We use cookies to enhance your experience. By continuing to visit this site you agree to our use of cookies . More info . X close

Chaos Engineering Tools Market

Report Code TC 8824
Published in Oct, 2023, By MarketsandMarkets™
Download PDF

Choose License Type

Buy Report Now Inquire Before Buying

Chaos Engineering Tools Market by Component (Tools and Services), Application, Deployment Mode (Public Cloud and Private Cloud), End User, Vertical (IT & ITeS, BFSI, Telecommunications, and Media & Entertainment) and Region - Global Forecast to 2028

US Tariff Impact on Chaos Engineering Tools Market

Trump Tariffs Are Reshaping Global Business

Overview

The global Chaos Engineering Tools Market size as per revenue was surpassed $1.9 billion in 2023. It is anticipated to grow at a CAGR of 8.8% in between 2023 to 2028. The revenue forecast for 2028 is set for the valuation of $2.9 billion. The base year for estimation is 2022 and the market size available for the years from 2023 to 2028. As chaos engineering became more prevalent, the late 2010s saw the emergence of commercial chaos engineering platforms. Companies like Gremlin and ChaosIQ recognized the potential and began offering more comprehensive tools with features and support for conducting controlled experiments. Chaos engineering started integrating closely with cloud computing, microservices, and DevOps practices. It became an integral part of the DevOps pipeline, ensuring the resilience of CI/CD processes. By the mid-2020s, automation became a focal point for chaos engineering tools. Advanced platforms offered automated chaos experiments, reducing the need for manual intervention and enabling organizations to conduct these tests more frequently and consistently. Moreover, features like AI-driven analysis of experiment results, enhanced observability, and remediation suggestions became common, making chaos engineering even more effective. The chaos engineering ecosystem continues to grow by developing new tools, libraries, and best practices. It has established itself as a fundamental practice in reliability engineering, fostering a robust knowledge base and community resources, including books, workshops, and online communities. The evolution of chaos engineering tools underscores their critical role in helping organizations ensure the resilience of their increasingly complex digital systems in a world driven by advanced technologies and a need for unwavering service availability.

Attractive Opportunities in the Chaos Engineering Tools Market

ASIA PACIFIC:

Asia Pacific is estimated to present huge opportunities for the adoption of chaos engineering tools market with the booming eCommerce and financial services sectors in Asia Pacific region, which depend on reliable digital platforms. Chaos engineering is vital for maintaining consistent service availability, especially during peak usage periods.

The growing adoption of cloud computing introduces new layers of complexity. Chaos engineering tools help businesses navigate the challenges of cloud infrastructure while maintaining uptime and availability.

The chaos engineering market is driven by technologies, such as microservices, cloud computing, and containerization, which increase system complexity. DevOps practices and advanced observability tools also play a vital role in the effectiveness of chaos engineering.

The chaos engineering field is constantly evolving, with new tools and frameworks emerging to make the practice more accessible and efficient

In some industries, such as BFSI and healthcare, regulatory requirements mandate system reliability and uptime. Chaos engineering helps organizations meet these compliance standards by minimizing disruptions.

Global Chaos Engineering Tools Market Dynamics

Driver: Need for observability tools for managing distributed systems

Observability tools drive the growth and adoption of the chaos engineering market by serving as the backbone for designing, executing, and extracting value from chaos experiments. Observability tools and practices offer organizations a holistic view of their complex, distributed systems, enabling them to monitor performance metrics, trace transactions, analyze logs, and gain real-time insights into system behavior. This level of visibility empowers chaos engineers to conduct more precise and impactful experiments, identify vulnerabilities, and measure the effects of injected failures with unprecedented accuracy. As businesses increasingly rely on digital infrastructure and applications, the need to ensure system resilience and reliability has grown exponentially. Observability facilitates the discovery of weaknesses and enables organizations to enhance their Mean Time To Detection (MTTD) of issues, quantify the business impact of failures, and make data-driven decisions to improve system robustness. The synergy between observability and chaos engineering has become so symbiotic that observability platforms now offer specialized features and integrations tailored to chaos engineering, further cementing their role in driving the growth of this essential practice in modern system engineering and operations.

Restraint: Privacy and security concerns

Privacy and security concerns can be significant barriers to the widespread adoption of chaos engineering tools. As chaos engineering involves intentionally injecting failures and disruptions into systems to identify weaknesses, it can raise valid apprehensions about data privacy and system security. Organizations may be reluctant to expose sensitive customer data or confidential information to potential risks associated with chaos experiments. Moreover, the chaos engineering process requires deep visibility into the system, which may inadvertently reveal vulnerabilities that malicious actors could exploit. This heightened exposure can understandably lead to resistance, especially in highly regulated industries like healthcare and finance, where data privacy and security compliance are paramount.


Opportunity: Integration with monitoring and observability tools

Integration with monitoring and observability tools creates significant opportunities in the chaos engineering tools market by bridging the gap between proactive resilience testing and real-time system monitoring. When chaos engineering tools seamlessly integrate with monitoring and observability solutions, organizations gain enhanced visibility into their system's behavior under simulated stress conditions. This integration enables quicker detection and response to issues, facilitating the identification of vulnerabilities and performance bottlenecks. It also empowers teams to make data-driven decisions for improving system resilience. Furthermore, the synergy between chaos engineering and observability helps organizations validate the effectiveness of their monitoring and alerting systems, ensuring they are robust and reliable. As businesses increasingly prioritize observability in modern, complex IT environments, chaos engineering tools offer this integration to provide holistic solutions, making them pivotal players in enhancing system reliability and performance.

Challenge: Risk of outages

The risk of outages poses a significant challenge for the chaos engineering tools market. While the primary purpose of chaos engineering is to uncover vulnerabilities and weaknesses in systems proactively, the very nature of injecting controlled failures and disruptions carries inherent risks. Unintended or poorly managed experiments can lead to production outages or performance degradation, causing financial losses and reputational damage for organizations. This risk aversion can deter some businesses from adopting chaos engineering practices altogether, inhibiting market growth. To address this challenge, organizations must approach chaos engineering with a meticulous and measured approach, ensuring that experiments are carefully scoped, safeguards are in place, and robust rollback procedures are established. Effective communication and education around the benefits and risks of chaos engineering can help organizations strike the right balance between improving system resilience and maintaining operational stability.

Global Chaos Engineering Tools Market Ecosystem Analysis

Based on components, the tools segment is projected to witness the highest market share during the forecast period. Chaos engineering tools are increasingly essential in today's complex and dynamic software landscape. As systems grow in complexity and scale, proactively identifying and addressing potential weaknesses becomes paramount. These tools enable organizations to intentionally inject controlled chaos into their infrastructure, applications, and services to uncover vulnerabilities and resiliency issues before they lead to costly outages or security breaches. By simulating real-world disruptions, such as network failures, hardware glitches, or unexpected traffic spikes, chaos engineering tools help teams fine-tune their systems, build robustness, and enhance their incident response capabilities. In addition, embracing chaos engineering tools is an intelligent strategy to fortify digital operations and ensure that services remain dependable, even in the face of unforeseen challenges.

By Vertical, the media & entertainment segment is expected to grow at the highest CAGR during the forecast period.

Chaos engineering in the media & entertainment industry helps organizations proactively identify weaknesses, improve infrastructure, enhance user experiences, and ensure uninterrupted content delivery. By deliberately introducing controlled failures, companies can better prepare for real-world challenges and maintain high service quality for their audiences. Companies from the media and entertainment industry heavily rely on advertising revenue. Chaos engineering can be used to test the resilience of ad delivery systems. This includes assessing the impact of ad server failures or network disruptions on the delivery of advertisements. Chaos engineering helps media and entertainment companies to understand how users' experiences are affected by failures. By introducing controlled chaos into their systems, they can assess how performance issues or downtime impact user engagement and satisfaction. This data can guide improvements in user experience design and system reliability. Media and entertainment companies leverage chaos engineering tools to ensure their digital services remain reliable and resilient, even in unexpected disruptions and high-demand situations. For instance, Netflix, a leading online streaming platform, employed a tool called “Chaos Monkey” to randomly terminate production instances to test the resilience of their infrastructure. They shut down a group of servers in the middle of a stream to ensure their system can gracefully handle such disruptions without affecting user experience.

NORTH AMERICA Region Holds the Largest Share of the Chaos Engineering Tools Market

North America is expected to hold the largest global chaos engineering tools market share. North America comprises the US and Canada. The adoption of chaos engineering tools in North America has witnessed a significant surge in recent years, reflecting the region's steadfast commitment to enhancing the reliability and resilience of complex software systems. North American businesses, particularly those in the tech, eCommerce, and finance sectors, have recognized the critical importance of robust digital infrastructure in delivering uninterrupted services and maintaining customer trust. In April 2021, Facebook experienced one of its most substantial data breaches, resulting in the unauthorized disclosure of personal information. This breach exposed the names, phone numbers, account usernames, and passwords of more than 530 million individuals to the public. Such incidents of high-profile software failures and outages, which can have crippling financial and reputational repercussions, have spurred this proactive approach to system reliability.


Recent Developments of Chaos Engineering Tools Market Industry

  • In February 2023, Tricentis announced the launch of Testim Mobile, an expansion of Testim that brings advanced mobile testing capabilities to the platform. The newly introduced mobile features enhance connectivity and provide a superior testing experience for iOS and Android, covering native and web applications with easy-to-use solutions. In March 2022, OpenText announced a partnership with Gremlin to develop new capabilities in LoadRunner Professional. With this release, the company enhanced its support for chaos engineering, offering benefits such as resilience testing, fault detection, introducing chaos, monitoring performance, and supporting multiple scenarios. In March 2022, Harness acquired ChaosNative, a creator of LitmusChaos, to offer a scalable platform for chaos engineering in the cloud and on-premises. This integration allows customers to diminish downtime in distributed environments, monitor enhancements in reliability, decrease Mean Time to Resolution (MTTR), and enhance the overall end-user experience.
  • In November 2021, Microsoft announced the Azure Chaos Studio public preview to assist customers in monitoring, quantifying, and addressing faults through controlled chaos engineering, enhancing the robustness of their cloud applications. In March 2021, AWS announced the general availability of the AWS Fault Injection Simulator to help users run application tests to detect system vulnerabilities.

Key Market Players

Key Players in the Chaos Engineering Tools Market Include

Want to explore hidden markets that can drive new revenue in Chaos Engineering Tools Market?

Scope of the Report

Report Attribute Details
Market size available for years 2018–2028
Base year considered 2022
Forecast period 2023–2028
Forecast units Value (USD Million/Billion)
Segments Covered Component, Application, Deployment Mode, End User, and Vertical
Regions covered North America, Europe, Asia Pacific, Middle East & Africa, and Latin America
Companies covered Microsoft (US), AWS (US), OpenText (Canada), Virtusa (US), Tricentis (US), Harness (US), Nagarro (Germany), PagerDuty (US), Cavission Systems (US), Gremlin (US), Steadybit (Germany), Reliably (UK), Speedscale (US), Verica (US), WireMock (US), Apica (Sweden), ChaosSearch (US), RapidSpike (UK), and DevCycle (Canada).

Key Questions Addressed by the Report

What is Chaos Engineering Tool?
Chaos engineering tools are software applications and platforms designed to facilitate the practice of chaos engineering. Chaos engineering involves controlled, deliberate experiments on a system or application to identify weaknesses, vulnerabilities, and potential points of failure. The goal is to proactively improve the system's resilience, fault tolerance, and reliability. These tools simulate real-world scenarios to observe how the system responds under stress, helping engineers uncover vulnerabilities and improve the architecture.
Which country is the early adopter of Chaos Engineering Tools?
The US is at the initial stage of adopting chaos engineering tools.
Which are the key vendors exploring Chaos Engineering Tools?
Some of the major vendors offering chaos engineering tools include Microsoft (US), AWS (US), OpenText (Canada), Virtusa (US), Tricentis (US), Harness (US), Nagarro (Germany), PagerDuty (US), Cavission Systems (US), Gremlin (US), Steadybit (Germany), Reliably (UK), Speedscale (US), Verica (US), WireMock (US), Apica (Sweden), ChaosSearch (US), RapidSpike (UK), and DevCycle (Canada).
What is the total CAGR expected to be recorded for the Chaos engineering tools market from 2023 to 2028?
The Chaos engineering tools market is expected to record a CAGR of 8.8% from 2023-2028.
What is the projected market value of the chaos engineering tools market?
The chaos engineering tools market size is expected to grow from USD 1.9 billion in 2023 to USD 2.9 billion by 2028 at a Compound Annual Growth Rate (CAGR) of 8.8% during the forecast period.


Personalize This Research

  • Triangulate with your Own Data
  • Get Data as per your Format and Definition
  • Gain a Deeper Dive on a Specific Application, Geography, Customer or Competitor
  • Any level of Personalization
Request A Free Customisation

Let Us Help You

  • What are the Known and Unknown Adjacencies Impacting the Chaos Engineering Tools Market
  • What will your New Revenue Sources be?
  • Who will be your Top Customer; what will make them switch?
  • Defend your Market Share or Win Competitors
  • Get a Scorecard for Target Partners
Customized Workshop Request

Table of Contents

Exclusive indicates content/data unique to MarketsandMarkets and not available with any competitors.

TITLE
PAGE NO
INTRODUCTION
31
RESEARCH METHODOLOGY
36
EXECUTIVE SUMMARY
52
PREMIUM INSIGHTS
57
MARKET OVERVIEW AND INDUSTRY TRENDS
60
  • 5.1 INTRODUCTION
    CHAOS ENGINEERING MATURITY MODEL
  • 5.2 MARKET DYNAMICS
    DRIVERS
    - Need for observability tools for managing distributed systems
    - Need for resilience and reliability in DevOps
    - Growing adoption of cloud-native applications
    RESTRAINTS
    - Privacy and security concerns
    - Complexity and lack of expertise required for conducting experiments
    OPPORTUNITIES
    - Integration with monitoring and observability tools
    - Growing adoption of hybrid and multi-cloud environments
    CHALLENGES
    - Risk of outages
    - Requirement of robust monitoring systems
  • 5.3 CASE STUDY ANALYSIS
    CASE STUDY 1: GREMLIN HELPED NAB BUILD RESILIENCE USING CHAOS ENGINEERING TECHNOLOGY
    CASE STUDY 2: STEADYBIT'S INNOVATIVE CHAOS ENGINEERING SOLUTION ENABLED SALESFORCE TO ATTAIN UNPARALLELED SYSTEM RESILIENCE
    CASE STUDY 3: LEADING MANUFACTURER ACHIEVED BUSINESS CONTINUITY WITH NAGARRO’S RESILIENCE ENGINEERING
  • 5.4 SUPPLY CHAIN ANALYSIS
  • 5.5 ECOSYSTEM
  • 5.6 TECHNOLOGICAL ANALYSIS
    KEY TECHNOLOGIES
    - Containerization
    - Orchestration
    - Microservices
    - Cloud Computing
    COMPLEMENTARY TECHNOLOGIES
    - AI and ML
    - Service Mesh Technology
    ADJACENT TECHNOLOGIES
    - DevOps
    - SRE
    - Edge Computing
  • 5.7 INDICATIVE PRICING ANALYSIS
  • 5.8 BUSINESS MODEL ANALYSIS
  • 5.9 PATENT ANALYSIS
  • 5.10 PORTER’S FIVE FORCES ANALYSIS
    THREAT OF NEW ENTRANTS
    THREAT OF SUBSTITUTES
    BARGAINING POWER OF SUPPLIERS
    BARGAINING POWER OF BUYERS
    INTENSITY OF COMPETITIVE RIVALRY
  • 5.11 KEY CONFERENCES AND EVENTS IN 2023 & 2024
  • 5.12 TARIFF AND REGULATORY LANDSCAPE
    REGULATORY BODIES, GOVERNMENT AGENCIES, AND OTHER ORGANIZATIONS
    REGULATIONS
    NORTH AMERICA
    EUROPE
    ASIA PACIFIC
    MIDDLE EAST & AFRICA
    LATIN AMERICA
  • 5.13 TRENDS/DISRUPTIONS IMPACTING BUYERS
  • 5.14 KEY STAKEHOLDERS & BUYING CRITERIA
    KEY STAKEHOLDERS IN BUYING PROCESS
    BUYING CRITERIA
CHAOS ENGINEERING TOOLS MARKET, BY COMPONENT
84
  • 6.1 INTRODUCTION
    COMPONENT: CHAOS ENGINEERING TOOLS MARKET DRIVERS
  • 6.2 TOOLS
    NEED TO MAINTAIN SYSTEM RESILIENCE AND RELIABILITY TO DRIVE DEMAND FOR CHAOS ENGINEERING TOOLS
    TOOLS: CHAOS ENGINEERING TOOLS MARKET DRIVERS
    MONITORING & OBSERVABILITY TOOLS
  • 6.3 SERVICES
    SERVICES: CHAOS ENGINEERING TOOLS MARKET DRIVERS
    PROFESSIONAL SERVICES
    - Professional services to offer expertise and guidance
    - Integration & Implementation
    - Consulting & Advisory
    - Support & Maintenance
    - Training & Documentation
CHAOS ENGINEERING TOOLS MARKET, BY APPLICATION (QUALITATIVE ANALYSIS)
92
  • 7.1 INTRODUCTION
    APPLICATION: CHAOS ENGINEERING TOOLS MARKET DRIVERS
  • 7.2 FAULT INJECTION & TESTING
    FAULT INJECTION & TESTING TO IDENTIFY VULNERABILITIES, OPTIMIZE RECOVERY PROCESSES, AND ENHANCE SYSTEM RELIABILITY
  • 7.3 RESILIENCE TESTING & DISASTER RECOVERY
    UNEXPECTED NETWORK FAILURES
  • 7.4 SECURITY RESILIENCE TESTING
    NEED TO FORTIFY SYSTEMS AGAINST CYBER THREATS AND SAFEGUARD SENSITIVE INFORMATION MANAGING SECURITY TO DRIVE MARKET
  • 7.5 PERFORMANCE & SCALABILITY TESTING
    NEED TO MAINTAIN USER SATISFACTION AND MEET CUSTOMER EXPECTATIONS FOR SEAMLESS EXPERIENCES TO DRIVE MARKET
  • 7.6 OTHER APPLICATIONS
CHAOS ENGINEERING TOOLS MARKET, BY DEPLOYMENT MODE
95
  • 8.1 INTRODUCTION
    DEPLOYMENT MODE: CHAOS ENGINEERING TOOLS MARKET DRIVERS
  • 8.2 PUBLIC CLOUD
    NEED FOR COST-EFFECTIVENESS, SCALABILITY, AND EASE OF DEPLOYMENT TO FUEL DEMAND FOR PUBLIC CLOUD
  • 8.3 PRIVATE CLOUD
    PRIVATE CLOUD TO ENHANCE CONTROL, ISOLATION FROM PUBLIC INTERNET, AND PREDICTABLE PERFORMANCE
CHAOS ENGINEERING TOOLS MARKET, BY VERTICAL
100
  • 9.1 INTRODUCTION
    VERTICAL: CHAOS ENGINEERING TOOLS MARKET DRIVERS
  • 9.2 BFSI
    CHAOS ENGINEERING TOOLS TO MANAGE INCREASING RISKS WITH DIGITALIZATION OF BANKING PROCESSES
  • 9.3 IT & ITES
    CHAOS ENGINEERING TOOLS TO FORTIFY DIGITAL INFRASTRUCTURE AND IDENTIFY AND MITIGATE VULNERABILITIES BEFORE THEY ESCALATE
  • 9.4 TELECOMMUNICATIONS
    NEED TO ENHANCE PERFORMANCE AND RELIABILITY, IDENTIFY POTENTIAL VULNERABILITIES, AND OPTIMIZE INCIDENT RESPONSE STRATEGIES TO DRIVE MARKET
  • 9.5 RETAIL & ECOMMERCE
    CHAOS ENGINEERING TOOLS TO PREVENT RETAIL INDUSTRY FROM DATA BREACHES AND SECURITY INCIDENTS
  • 9.6 MEDIA & ENTERTAINMENT
    NEED TO IDENTIFY WEAKNESSES, IMPROVE INFRASTRUCTURE, ENHANCE USER EXPERIENCES, AND ENSURE UNINTERRUPTED CONTENT DELIVERY TO DRIVE MARKET
  • 9.7 MANUFACTURING
    ADOPTION OF INDUSTRY 4.0 AND IOT TO BOOST DEMAND FOR CHAOS ENGINEERING TOOLS IN MANUFACTURING INDUSTRY
  • 9.8 HEALTHCARE & LIFE SCIENCES
    GROWING COMPLEXITIES IN DATA MANAGEMENT AND NEED TO PREVENT DATA BREACHES AND SYSTEM RELIABILITY TO PROPEL MARKET
  • 9.9 OTHER VERTICALS
CHAOS ENGINEERING TOOLS MARKET, BY END USER (QUALITATIVE ANALYSIS)
111
  • 10.1 INTRODUCTION
    END USER: CHAOS ENGINEERING TOOLS MARKET DRIVERS
  • 10.2 DEVELOPERS
    NEED TO FINE-TUNE APPLICATIONS, IMPROVE SYSTEM RESILIENCE, AND ENHANCE OVERALL RELIABILITY TO DRIVE MARKET
  • 10.3 QA/TEST TEAMS
    NEED TO IDENTIFY WEAKNESSES AND BOTTLENECKS AND IMPROVE COVERAGE AND QUALITY OF TESTING TO DRIVE MARKET
  • 10.4 OPERATIONS TEAMS
    CHAOS ENGINEERING TOOLS TO STRENGTHEN SYSTEMS, REDUCE DOWNTIME, AND BOLSTER OVERALL OPERATIONAL EFFICIENCY
  • 10.5 SECURITY TEAMS
    NEED TO ENABLE SECURITY PROFESSIONALS TO SIMULATE REAL-WORLD ATTACKS AND VULNERABILITIES TO PROPEL MARKET
CHAOS ENGINEERING TOOLS MARKET, BY REGION
113
  • 11.1 INTRODUCTION
    NORTH AMERICA
    NORTH AMERICA: CHAOS ENGINEERING TOOLS MARKET DRIVERS
    NORTH AMERICA: RECESSION IMPACT
    US
    - Convergence of advanced technologies and need to identify and address potential issues to drive market
    CANADA
    - Canadian financial institutions to embrace chaos engineering tools to modernize their infrastructure and enhance customer experiences
  • 11.2 EUROPE
    EUROPE: CHAOS ENGINEERING TOOLS MARKET DRIVERS
    EUROPE: RECESSION IMPACT
    UK
    - Proliferation of microservices and DevOps and advanced IT infrastructure supporting digitalization to propel market
    GERMANY
    - Growing technological developments in automotive sector and need to increase production to drive market
    FRANCE
    - Rapid technological adoption and digitalization of industries to fuel demand for chaos engineering tools
    ITALY
    - Growing complexity of software applications with distributed architecture to propel market
    REST OF EUROPE
  • 11.3 ASIA PACIFIC
    ASIA PACIFIC: CHAOS ENGINEERING TOOLS MARKET DRIVERS
    ASIA PACIFIC: RECESSION IMPACT
    CHINA
    - Presence of major cloud providers and well-developed technological infrastructure to drive market
    JAPAN
    - Growing technological innovation and rising cloud adoption rates to fuel demand for chaos engineering tools
    INDIA
    - Rising development in IT infrastructure and need to test and enhance resilience of complex systems to drive market
    REST OF ASIA PACIFIC
  • 11.4 MIDDLE EAST & AFRICA
    MIDDLE EAST & AFRICA: CHAOS ENGINEERING TOOLS MARKET DRIVERS
    MIDDLE EAST & AFRICA: RECESSION IMPACT
    KSA
    - Rapid and transformative adoption of cloud computing and Saudi Vision 2030 initiative to propel market
    REST OF MIDDLE EAST & AFRICA
  • 11.5 LATIN AMERICA
    LATIN AMERICA: CHAOS ENGINEERING TOOLS MARKET DRIVERS
    LATIN AMERICA: RECESSION IMPACT
    BRAZIL
    - Evolving ICT landscape, mobile connectivity, and a burgeoning tech startup ecosystem to propel market
    REST OF LATIN AMERICA
COMPETITIVE LANDSCAPE
145
  • 12.1 INTRODUCTION
  • 12.2 KEY PLAYERS’ STRATEGIES/RIGHT TO WIN
  • 12.3 MARKET SHARE ANALYSIS
  • 12.4 CHAOS ENGINEERING TOOLS MARKET: VENDOR PRODUCTS/BRANDS - COMPARISON
  • 12.5 REVENUE ANALYSIS OF TOP VENDORS
    MICROSOFT
    AWS
    OPENTEXT
  • 12.6 COMPANY EVALUATION MATRIX, 2022
    STARS
    EMERGING LEADERS
    PERVASIVE PLAYERS
    PARTICIPANTS
    COMPANY FOOTPRINT
  • 12.7 COMPANY FINANCIAL METRICS
  • 12.8 GLOBAL SNAPSHOT OF KEY MARKET PARTICIPANTS
  • 12.9 COMPETITIVE SCENARIO AND TRENDS
COMPANY PROFILES
161
  • 13.1 INTRODUCTION
  • 13.2 KEY PLAYERS
    MICROSOFT
    AWS
    OPENTEXT (MICRO FOCUS)
    VIRTUSA
    TRICENTIS
    HARNESS
    NAGARRO
    CAVISSON SYSTEMS
    PAGERDUTY
    GREMLIN
    STEADYBIT
    RELIABLY(CHAOSIQ)
    SPEEDSCALE
    VERICA
    WIREMOCK
    APICA
    CHAOSSEARCH
    RAPIDSPIKE
    DEVCYCLE
ADJACENT MARKETS
189
  • 14.1 INTRODUCTION
    RELATED MARKETS
  • 14.2 CLOUD NATIVE STORAGE MARKET
  • 14.3 DEVOPS MARKET
  • 14.4 OBSERVABILITY TOOLS AND PLATFORMS MARKET
APPENDIX
199
  • 15.1 DISCUSSION GUIDE
  • 15.2 KNOWLEDGESTORE: MARKETSANDMARKETS’ SUBSCRIPTION PORTAL
  • 15.3 CUSTOMIZATION OPTIONS
  • 15.4 RELATED REPORTS
  • 15.5 AUTHOR DETAILS
LIST OF TABLES
 
  • TABLE 1 USD EXCHANGE RATES, 2018–2022
  • TABLE 2 FACTOR ANALYSIS
  • TABLE 3 RELIABLY: PRICING ANALYSIS IN CHAOS ENGINEERING TOOLS MARKET, BY TOOL
  • TABLE 4 DEVCYCLE: PRICING ANALYSIS IN CHAOS ENGINEERING TOOLS MARKET, BY TOOL
  • TABLE 5 RAPIDSPIKE: PRICING ANALYSIS IN CHAOS ENGINEERING TOOLS MARKET, BY TOOL
  • TABLE 6 TOP TEN PATENT APPLICANTS (US), 2022
  • TABLE 7 CHAOS ENGINEERING TOOLS MARKET: PORTER’S FIVE FORCES ANALYSIS
  • TABLE 8 CHAOS ENGINEERING TOOLS MARKET: KEY CONFERENCES AND EVENTS IN 2023 & 2024
  • TABLE 9 NORTH AMERICA: LIST OF REGULATORY BODIES, GOVERNMENT AGENCIES, AND OTHER ORGANIZATIONS
  • TABLE 10 EUROPE: LIST OF REGULATORY BODIES, GOVERNMENT AGENCIES, AND OTHER ORGANIZATIONS
  • TABLE 11 ASIA PACIFIC: LIST OF REGULATORY BODIES, GOVERNMENT AGENCIES, AND OTHER ORGANIZATIONS
  • TABLE 12 ROW: LIST OF REGULATORY BODIES, GOVERNMENT AGENCIES, AND OTHER ORGANIZATIONS
  • TABLE 13 INFLUENCE OF STAKEHOLDERS ON BUYING PROCESS FOR INDUSTRY VERTICALS (%)
  • TABLE 14 KEY BUYING CRITERIA FOR END USERS
  • TABLE 15 CHAOS ENGINEERING TOOLS MARKET, BY COMPONENT, 2018–2022 (USD MILLION)
  • TABLE 16 CHAOS ENGINEERING TOOLS MARKET, BY COMPONENT, 2023–2028 (USD MILLION)
  • TABLE 17 TOOLS: CHAOS ENGINEERING TOOLS MARKET, BY REGION, 2018–2022 (USD MILLION)
  • TABLE 18 TOOLS: CHAOS ENGINEERING TOOLS MARKET, BY REGION, 2023–2028 (USD MILLION)
  • TABLE 19 SERVICES: CHAOS ENGINEERING TOOLS MARKET, BY REGION, 2018–2022 (USD MILLION)
  • TABLE 20 SERVICES: CHAOS ENGINEERING TOOLS MARKET, BY REGION, 2023–2028 (USD MILLION)
  • TABLE 21 CHAOS ENGINEERING TOOLS MARKET, BY DEPLOYMENT MODE, 2018–2022 (USD MILLION)
  • TABLE 22 CHAOS ENGINEERING TOOLS MARKET, BY DEPLOYMENT MODE, 2023–2028 (USD MILLION)
  • TABLE 23 PUBLIC CLOUD: CHAOS ENGINEERING TOOLS MARKET, BY REGION, 2018–2022 (USD MILLION)
  • TABLE 24 PUBLIC CLOUD: CHAOS ENGINEERING TOOLS MARKET, BY REGION, 2023–2028 (USD MILLION)
  • TABLE 25 PRIVATE CLOUD: CHAOS ENGINEERING TOOLS MARKET, BY REGION, 2018–2022 (USD MILLION)
  • TABLE 26 PRIVATE CLOUD: CHAOS ENGINEERING TOOLS MARKET, BY REGION, 2023–2028 (USD MILLION)
  • TABLE 27 CHAOS ENGINEERING TOOLS MARKET, BY VERTICAL, 2018–2022 (USD MILLION)
  • TABLE 28 CHAOS ENGINEERING TOOLS MARKET, BY VERTICAL, 2023–2028 (USD MILLION)
  • TABLE 29 BFSI: CHAOS ENGINEERING TOOLS MARKET, BY REGION, 2018–2022 (USD MILLION)
  • TABLE 30 BFSI: CHAOS ENGINEERING TOOLS MARKET, BY REGION, 2023–2028 (USD MILLION)
  • TABLE 31 IT & ITES: CHAOS ENGINEERING TOOLS MARKET, BY REGION, 2018–2022 (USD MILLION)
  • TABLE 32 IT & ITES: CHAOS ENGINEERING TOOLS MARKET, BY REGION, 2023–2028 (USD MILLION)
  • TABLE 33 TELECOMMUNICATIONS: CHAOS ENGINEERING TOOLS MARKET, BY REGION, 2018–2022 (USD MILLION)
  • TABLE 34 TELECOMMUNICATIONS: CHAOS ENGINEERING TOOLS MARKET, BY REGION, 2023–2028 (USD MILLION)
  • TABLE 35 RETAIL & ECOMMERCE: CHAOS ENGINEERING TOOLS MARKET, BY REGION, 2018–2022 (USD MILLION)
  • TABLE 36 RETAIL & ECOMMERCE: CHAOS ENGINEERING TOOLS MARKET, BY REGION, 2023–2028 (USD MILLION)
  • TABLE 37 MEDIA & ENTERTAINMENT: CHAOS ENGINEERING TOOLS MARKET, BY REGION, 2018–2022 (USD MILLION)
  • TABLE 38 MEDIA & ENTERTAINMENT: CHAOS ENGINEERING TOOLS MARKET, BY REGION, 2023–2028 (USD MILLION)
  • TABLE 39 MANUFACTURING: CHAOS ENGINEERING TOOLS MARKET, BY REGION, 2018–2022 (USD MILLION)
  • TABLE 40 MANUFACTURING: CHAOS ENGINEERING TOOLS MARKET, BY REGION, 2023–2028 (USD MILLION)
  • TABLE 41 HEALTHCARE & LIFE SCIENCES: CHAOS ENGINEERING TOOLS MARKET, BY REGION, 2018–2022 (USD MILLION)
  • TABLE 42 HEALTHCARE & LIFE SCIENCES: CHAOS ENGINEERING TOOLS MARKET, BY REGION, 2023–2028 (USD MILLION)
  • TABLE 43 OTHER VERTICALS: CHAOS ENGINEERING TOOLS MARKET, BY REGION, 2018–2022 (USD MILLION)
  • TABLE 44 OTHER VERTICALS: CHAOS ENGINEERING TOOLS MARKET, BY REGION, 2023–2028 (USD MILLION)
  • TABLE 45 CHAOS ENGINEERING TOOLS MARKET, BY REGION, 2018–2022 (USD MILLION)
  • TABLE 46 CHAOS ENGINEERING TOOLS MARKET, BY REGION, 2023–2028 (USD MILLION)
  • TABLE 47 NORTH AMERICA: CHAOS ENGINEERING TOOLS MARKET, BY COMPONENT, 2018–2022 (USD MILLION)
  • TABLE 48 NORTH AMERICA: CHAOS ENGINEERING TOOLS MARKET, BY COMPONENT, 2023–2028 (USD MILLION)
  • TABLE 49 NORTH AMERICA: CHAOS ENGINEERING TOOLS MARKET, BY DEPLOYMENT MODE, 2018–2022 (USD MILLION)
  • TABLE 50 NORTH AMERICA: CHAOS ENGINEERING TOOLS MARKET, BY DEPLOYMENT MODE, 2023–2028 (USD MILLION)
  • TABLE 51 NORTH AMERICA: CHAOS ENGINEERING TOOLS MARKET, BY VERTICAL, 2018–2022 (USD MILLION)
  • TABLE 52 NORTH AMERICA: CHAOS ENGINEERING TOOLS MARKET, BY VERTICAL, 2023–2028 (USD MILLION)
  • TABLE 53 NORTH AMERICA: CHAOS ENGINEERING TOOLS MARKET, BY COUNTRY, 2018–2022 (USD MILLION)
  • TABLE 54 NORTH AMERICA: CHAOS ENGINEERING TOOLS MARKET, BY COUNTRY, 2023–2028 (USD MILLION)
  • TABLE 55 US: CHAOS ENGINEERING TOOLS MARKET, BY DEPLOYMENT MODE, 2018–2022 (USD MILLION)
  • TABLE 56 US: CHAOS ENGINEERING TOOLS MARKET, BY DEPLOYMENT MODE, 2023–2028 (USD MILLION)
  • TABLE 57 CANADA: CHAOS ENGINEERING TOOLS MARKET, BY DEPLOYMENT MODE, 2018–2022 (USD MILLION)
  • TABLE 58 CANADA: CHAOS ENGINEERING TOOLS MARKET, BY DEPLOYMENT MODE DEPLOYMENT MODE, 2023–2028 (USD MILLION)
  • TABLE 59 EUROPE: CHAOS ENGINEERING TOOLS MARKET, BY COMPONENT, 2018–2022 (USD MILLION)
  • TABLE 60 EUROPE: CHAOS ENGINEERING TOOLS MARKET, BY COMPONENT, 2023–2028 (USD MILLION)
  • TABLE 61 EUROPE: CHAOS ENGINEERING TOOLS MARKET, BY DEPLOYMENT MODE, 2018–2022 (USD MILLION)
  • TABLE 62 EUROPE: CHAOS ENGINEERING TOOLS MARKET, BY DEPLOYMENT MODE, 2023–2028 (USD MILLION)
  • TABLE 63 EUROPE: CHAOS ENGINEERING TOOLS MARKET, BY VERTICAL, 2018–2022 (USD MILLION)
  • TABLE 64 EUROPE: CHAOS ENGINEERING TOOLS MARKET, BY VERTICAL, 2023–2028 (USD MILLION)
  • TABLE 65 EUROPE: CHAOS ENGINEERING TOOLS MARKET, BY COUNTRY, 2018–2022 (USD MILLION)
  • TABLE 66 EUROPE: CHAOS ENGINEERING TOOLS MARKET, BY COUNTRY, 2023–2028 (USD MILLION)
  • TABLE 67 UK: CHAOS ENGINEERING TOOLS MARKET, BY DEPLOYMENT MODE, 2018–2022 (USD MILLION)
  • TABLE 68 UK: CHAOS ENGINEERING TOOLS MARKET, BY DEPLOYMENT MODE, 2023–2028 (USD MILLION)
  • TABLE 69 GERMANY: CHAOS ENGINEERING TOOLS MARKET, BY DEPLOYMENT MODE, 2018–2022 (USD MILLION)
  • TABLE 70 GERMANY: CHAOS ENGINEERING TOOLS MARKET, BY DEPLOYMENT MODE, 2023–2028 (USD MILLION)
  • TABLE 71 FRANCE: CHAOS ENGINEERING TOOLS MARKET, BY DEPLOYMENT MODE, 2018–2022 (USD MILLION)
  • TABLE 72 FRANCE: CHAOS ENGINEERING TOOLS MARKET, BY DEPLOYMENT MODE, 2023–2028 (USD MILLION)
  • TABLE 73 ITALY: CHAOS ENGINEERING TOOLS MARKET, BY DEPLOYMENT MODE, 2018–2022 (USD MILLION)
  • TABLE 74 ITALY: CHAOS ENGINEERING TOOLS MARKET, BY DEPLOYMENT MODE, 2023–2028 (USD MILLION)
  • TABLE 75 REST OF EUROPE: CHAOS ENGINEERING TOOLS MARKET, BY DEPLOYMENT MODE, 2018–2022 (USD MILLION)
  • TABLE 76 REST OF EUROPE: CHAOS ENGINEERING TOOLS MARKET, BY DEPLOYMENT MODE, 2023–2028 (USD MILLION)
  • TABLE 77 ASIA PACIFIC: CHAOS ENGINEERING TOOLS MARKET, BY COMPONENT, 2018–2022 (USD MILLION)
  • TABLE 78 ASIA PACIFIC: CHAOS ENGINEERING TOOLS MARKET, BY COMPONENT, 2023–2028 (USD MILLION)
  • TABLE 79 ASIA PACIFIC: CHAOS ENGINEERING TOOLS MARKET, BY DEPLOYMENT MODE, 2018–2022 (USD MILLION)
  • TABLE 80 ASIA PACIFIC: CHAOS ENGINEERING TOOLS MARKET, BY DEPLOYMENT MODE, 2023–2028 (USD MILLION)
  • TABLE 81 ASIA PACIFIC: CHAOS ENGINEERING TOOLS MARKET, BY VERTICAL, 2018–2022 (USD MILLION)
  • TABLE 82 ASIA PACIFIC: CHAOS ENGINEERING TOOLS MARKET, BY VERTICAL, 2023–2028 (USD MILLION)
  • TABLE 83 ASIA PACIFIC: CHAOS ENGINEERING TOOLS MARKET, BY COUNTRY, 2018–2022 (USD MILLION)
  • TABLE 84 ASIA PACIFIC: CHAOS ENGINEERING TOOLS MARKET, BY COUNTRY, 2023–2028 (USD MILLION)
  • TABLE 85 CHINA: CHAOS ENGINEERING TOOLS MARKET, BY DEPLOYMENT MODE, 2018–2022 (USD MILLION)
  • TABLE 86 CHINA: CHAOS ENGINEERING TOOLS MARKET, BY DEPLOYMENT MODE, 2023–2028 (USD MILLION)
  • TABLE 87 JAPAN: CHAOS ENGINEERING TOOLS MARKET, BY DEPLOYMENT MODE, 2018–2022 (USD MILLION)
  • TABLE 88 JAPAN: CHAOS ENGINEERING TOOLS MARKET, BY DEPLOYMENT MODE, 2023–2028 (USD MILLION)
  • TABLE 89 INDIA: CHAOS ENGINEERING TOOLS MARKET, BY DEPLOYMENT MODE, 2018–2022 (USD MILLION)
  • TABLE 90 INDIA: CHAOS ENGINEERING TOOLS MARKET, BY DEPLOYMENT MODE, 2023–2028 (USD MILLION)
  • TABLE 91 REST OF ASIA PACIFIC: CHAOS ENGINEERING TOOLS MARKET, BY DEPLOYMENT MODE, 2018–2022 (USD MILLION)
  • TABLE 92 REST OF ASIA PACIFIC: CHAOS ENGINEERING TOOLS MARKET, BY DEPLOYMENT MODE, 2023–2028 (USD MILLION)
  • TABLE 93 MIDDLE EAST & AFRICA: CHAOS ENGINEERING TOOLS MARKET, BY COMPONENT, 2018–2022 (USD MILLION)
  • TABLE 94 MIDDLE EAST & AFRICA: CHAOS ENGINEERING TOOLS MARKET, BY COMPONENT, 2023–2028 (USD MILLION)
  • TABLE 95 MIDDLE EAST & AFRICA: CHAOS ENGINEERING TOOLS MARKET, BY DEPLOYMENT MODE, 2018–2022 (USD MILLION)
  • TABLE 96 MIDDLE EAST & AFRICA: CHAOS ENGINEERING TOOLS MARKET, BY DEPLOYMENT MODE, 2023–2028 (USD MILLION)
  • TABLE 97 MIDDLE EAST & AFRICA: CHAOS ENGINEERING TOOLS MARKET, BY VERTICAL, 2018–2022 (USD MILLION)
  • TABLE 98 MIDDLE EAST & AFRICA: CHAOS ENGINEERING TOOLS MARKET, BY VERTICAL, 2023–2028 (USD MILLION)
  • TABLE 99 MIDDLE EAST & AFRICA: CHAOS ENGINEERING TOOLS MARKET, BY COUNTRY, 2018–2022 (USD MILLION)
  • TABLE 100 MIDDLE EAST & AFRICA: CHAOS ENGINEERING TOOLS MARKET, BY COUNTRY, 2023–2028 (USD MILLION)
  • TABLE 101 KSA: CHAOS ENGINEERING TOOLS MARKET, BY DEPLOYMENT MODE, 2018–2022 (USD MILLION)
  • TABLE 102 KSA: CHAOS ENGINEERING TOOLS MARKET, BY DEPLOYMENT MODE, 2023–2028 (USD MILLION)
  • TABLE 103 REST OF MIDDLE EAST & AFRICA: CHAOS ENGINEERING TOOLS MARKET, BY DEPLOYMENT MODE, 2018–2022 (USD MILLION)
  • TABLE 104 REST OF MIDDLE EAST & AFRICA: CHAOS ENGINEERING TOOLS MARKET, BY DEPLOYMENT MODE, 2023–2028 (USD MILLION)
  • TABLE 105 LATIN AMERICA: CHAOS ENGINEERING TOOLS MARKET, BY COMPONENT, 2018–2022 (USD MILLION)
  • TABLE 106 LATIN AMERICA: CHAOS ENGINEERING TOOLS MARKET, BY COMPONENT, 2023–2028 (USD MILLION)
  • TABLE 107 LATIN AMERICA: CHAOS ENGINEERING TOOLS MARKET, BY DEPLOYMENT MODE, 2018–2022 (USD MILLION)
  • TABLE 108 LATIN AMERICA: CHAOS ENGINEERING TOOLS MARKET, BY DEPLOYMENT MODE, 2023–2028 (USD MILLION)
  • TABLE 109 LATIN AMERICA: CHAOS ENGINEERING TOOLS MARKET, BY VERTICAL, 2018–2022 (USD MILLION)
  • TABLE 110 LATIN AMERICA: CHAOS ENGINEERING TOOLS MARKET, BY VERTICAL, 2023–2028 (USD MILLION)
  • TABLE 111 LATIN AMERICA: CHAOS ENGINEERING TOOLS MARKET, BY COUNTRY, 2018–2022 (USD MILLION)
  • TABLE 112 LATIN AMERICA: CHAOS ENGINEERING TOOLS MARKET, BY COUNTRY, 2023–2028 (USD MILLION)
  • TABLE 113 BRAZIL: CHAOS ENGINEERING TOOLS MARKET, BY DEPLOYMENT MODE, 2018–2022 (USD MILLION)
  • TABLE 114 BRAZIL: CHAOS ENGINEERING TOOLS MARKET, BY DEPLOYMENT MODE, 2023–2028 (USD MILLION)
  • TABLE 115 REST OF LATIN AMERICA: CHAOS ENGINEERING TOOLS MARKET, BY DEPLOYMENT MODE, 2018–2022 (USD MILLION)
  • TABLE 116 REST OF LATIN AMERICA: CHAOS ENGINEERING TOOLS MARKET, BY DEPLOYMENT MODE, 2023–2028 (USD MILLION)
  • TABLE 117 OVERVIEW OF STRATEGIES ADOPTED BY KEY CHAOS ENGINEERING TOOLS VENDORS
  • TABLE 118 MARKET SHARE OF KEY VENDORS IN 2022
  • TABLE 119 VENDOR PRODUCTS/BRANDS - COMPARISON
  • TABLE 120 COMPANY REGIONAL FOOTPRINT
  • TABLE 121 COMPANY VERTICAL FOOTPRINT
  • TABLE 122 COMPANY COMPONENT FOOTPRINT
  • TABLE 123 OVERALL COMPANY FOOTPRINT
  • TABLE 124 CHAOS ENGINEERING TOOLS MARKET: PRODUCT LAUNCHES AND ENHANCEMENTS, MARCH 2021–JANUARY 2023
  • TABLE 125 CHAOS ENGINEERING TOOLS MARKET: DEALS, MARCH 2022–JANUARY 2023
  • TABLE 126 MICROSOFT: COMPANY OVERVIEW
  • TABLE 127 MICROSOFT: PRODUCTS/SOLUTIONS/SERVICES OFFERED
  • TABLE 128 MICROSOFT: PRODUCT LAUNCHES AND ENHANCEMENTS
  • TABLE 129 AWS: COMPANY OVERVIEW
  • TABLE 130 AWS: PRODUCTS/SOLUTIONS/SERVICES OFFERED
  • TABLE 131 AWS: PRODUCT LAUNCHES AND ENHANCEMENTS
  • TABLE 132 OPENTEXT: COMPANY OVERVIEW
  • TABLE 133 OPENTEXT: PRODUCTS/SOLUTIONS/SERVICES OFFERED
  • TABLE 134 OPENTEXT: DEALS
  • TABLE 135 VIRTUSA: COMPANY OVERVIEW
  • TABLE 136 VIRTUSA: PRODUCTS/SOLUTIONS/SERVICES OFFERED
  • TABLE 137 TRICENTIS: COMPANY OVERVIEW
  • TABLE 138 TRICENTIS: PRODUCTS/SOLUTIONS/SERVICES OFFERED
  • TABLE 139 TRICENTIS: PRODUCT LAUNCHES AND ENHANCEMENTS
  • TABLE 140 TRICENTIS: DEALS
  • TABLE 141 HARNESS: COMPANY OVERVIEW
  • TABLE 142 HARNESS: PRODUCTS/SOLUTIONS/SERVICES OFFERED
  • TABLE 143 HARNESS: PRODUCT LAUNCHES AND ENHANCEMENTS
  • TABLE 144 HARNESS: DEALS
  • TABLE 145 NAGARRO: COMPANY OVERVIEW
  • TABLE 146 NAGARRO: PRODUCTS/SOLUTIONS/SERVICES OFFERED
  • TABLE 147 NAGARRO: DEALS
  • TABLE 148 NAGARRO: OTHERS
  • TABLE 149 CAVISSON SYSTEMS: COMPANY OVERVIEW
  • TABLE 150 CAVISSON SYSTEMS: PRODUCTS/SOLUTIONS/SERVICES OFFERED
  • TABLE 151 PAGERDUTY: COMPANY OVERVIEW
  • TABLE 152 PAGERDUTY: PRODUCTS/SOLUTIONS/SERVICES OFFERED
  • TABLE 153 GREMLIN: COMPANY OVERVIEW
  • TABLE 154 GREMLIN: PRODUCTS/SOLUTIONS/SERVICES OFFERED
  • TABLE 155 GREMLIN: PRODUCT LAUNCHES AND ENHANCEMENTS
  • TABLE 156 CLOUD NATIVE STORAGE MARKET, BY COMPONENT, 2017–2021 (USD MILLION)
  • TABLE 157 CLOUD NATIVE STORAGE MARKET, BY COMPONENT, 2022–2027 (USD MILLION)
  • TABLE 158 CLOUD NATIVE STORAGE MARKET, BY ORGANIZATION SIZE, 2017–2021 (USD MILLION)
  • TABLE 159 CLOUD NATIVE STORAGE MARKET, BY ORGANIZATION SIZE, 2022–2027 (USD MILLION)
  • TABLE 160 CLOUD NATIVE STORAGE MARKET, BY DEPLOYMENT TYPE, 2017–2021 (USD MILLION)
  • TABLE 161 CLOUD NATIVE STORAGE MARKET, BY DEPLOYMENT TYPE, 2022–2027 (USD MILLION)
  • TABLE 162 CLOUD NATIVE STORAGE MARKET, BY VERTICAL, 2017–2021 (USD MILLION)
  • TABLE 163 CLOUD NATIVE STORAGE MARKET, BY VERTICAL, 2022–2027 (USD MILLION)
  • TABLE 164 CLOUD NATIVE STORAGE MARKET, BY REGION, 2017–2021 (USD MILLION)
  • TABLE 165 CLOUD NATIVE STORAGE MARKET, BY REGION, 2022–2027 (USD MILLION)
  • TABLE 166 DEVOPS MARKET, BY TYPE, 2018–2022 (USD MILLION)
  • TABLE 167 DEVOPS MARKET, BY ORGANIZATION SIZE, 2018–2022 (USD MILLION)
  • TABLE 168 PUBLIC CLOUD: DEVOPS MARKET, BY REGION, 2023–2028 (USD MILLION)
  • TABLE 169 DEVOPS MARKET, BY CLOUD DEPLOYMENT MODEL, 2018–2022 (USD MILLION)
  • TABLE 170 DEVOPS MARKET, BY CLOUD DEPLOYMENT MODEL, 2023–2028 (USD MILLION)
  • TABLE 171 DEVOPS MARKET, BY VERTICAL, 2018–2022 (USD MILLION)
  • TABLE 172 DEVOPS MARKET, BY REGION, 2018–2022 (USD MILLION)
  • TABLE 173 DEVOPS MARKET, BY REGION, 2023–2028 (USD MILLION)
  • TABLE 174 DEVOPS MARKET, BY VERTICAL, 2023–2028 (USD MILLION)
  • TABLE 175 DEVOPS MARKET, BY ORGANIZATION SIZE, 2023–2028 (USD MILLION)
  • TABLE 176 DEVOPS MARKET, BY TYPE, 2023–2028 (USD MILLION)
  • TABLE 177 OBSERVABILITY TOOLS AND PLATFORMS MARKET, BY COMPONENT, 2018–2022 (USD MILLION)
  • TABLE 178 OBSERVABILITY TOOLS AND PLATFORMS MARKET, BY COMPONENT, 2023–2028 (USD MILLION)
  • TABLE 179 OBSERVABILITY TOOLS AND PLATFORMS MARKET, BY DEPLOYMENT TYPE, 2018–2022 (USD MILLION)
  • TABLE 180 OBSERVABILITY TOOLS AND PLATFORMS MARKET, BY DEPLOYMENT TYPE, 2023–2028 (USD MILLION)
  • TABLE 181 OBSERVABILITY TOOLS AND PLATFORMS MARKET, BY VERTICAL, 2018–2022 (USD MILLION)
  • TABLE 182 OBSERVABILITY TOOLS AND PLATFORMS MARKET, BY VERTICAL, 2023–2028 (USD MILLION)
  • TABLE 183 OBSERVABILITY TOOLS AND PLATFORMS MARKET, BY REGION, 2018–2022 (USD MILLION)
  • TABLE 184 OBSERVABILITY TOOLS AND PLATFORMS MARKET, BY REGION, 2023–2028 (USD MILLION)
LIST OF FIGURES
 
  • FIGURE 1 CHAOS ENGINEERING TOOLS MARKET: RESEARCH DESIGN
  • FIGURE 2 CHAOS ENGINEERING TOOLS MARKET: DATA TRIANGULATION
  • FIGURE 3 CHAOS ENGINEERING TOOLS MARKET: TOP-DOWN AND BOTTOM-UP APPROACHES
  • FIGURE 4 MARKET SIZE ESTIMATION METHODOLOGY: TOP-DOWN APPROACH
  • FIGURE 5 MARKET SIZE ESTIMATION METHODOLOGY: BOTTOM-UP APPROACH
  • FIGURE 6 CHAOS ENGINEERING TOOLS MARKET: RESEARCH FLOW
  • FIGURE 7 MARKET SIZE ESTIMATION METHODOLOGY - SUPPLY SIDE: ILLUSTRATION OF VENDOR REVENUE ESTIMATION
  • FIGURE 8 MARKET SIZE ESTIMATION METHODOLOGY: SUPPLY-SIDE ANALYSIS
  • FIGURE 9 MARKET SIZE ESTIMATION METHODOLOGY: BOTTOM-UP APPROACH FROM SUPPLY SIDE - COLLECTIVE REVENUE OF VENDORS
  • FIGURE 10 MARKET SIZE ESTIMATION METHODOLOGY - DEMAND-SIDE APPROACH: REVENUE GENERATED FROM DIFFERENT VERTICALS
  • FIGURE 11 MARKET SIZE ESTIMATION METHODOLOGY - DEMAND SIDE APPROACH: CHAOS ENGINEERING TOOLS MARKET
  • FIGURE 12 FASTEST-GROWING SEGMENTS IN CHAOS ENGINEERING TOOLS MARKET, 2023–2028
  • FIGURE 13 TOOLS SEGMENT TO ACCOUNT FOR LARGER MARKET SIZE DURING FORECAST PERIOD
  • FIGURE 14 PUBLIC CLOUD SEGMENT TO ACCOUNT FOR LARGER MARKET SIZE DURING FORECAST PERIOD
  • FIGURE 15 IT & ITES VERTICAL TO ACCOUNT FOR LARGEST MARKET SIZE DURING FORECAST PERIOD
  • FIGURE 16 CHAOS ENGINEERING TOOLS MARKET: REGIONAL SNAPSHOT
  • FIGURE 17 GROWING DEMAND FOR UNDERSTANDING FAILURE TYPES IN SOFTWARE APPLICATIONS
  • FIGURE 18 TOOLS SEGMENT TO ACCOUNT FOR LARGER MARKET SHARE DURING FORECAST PERIOD
  • FIGURE 19 PUBLIC CLOUD SEGMENT TO ACCOUNT FOR LARGER MARKET SHARE DURING FORECAST PERIOD
  • FIGURE 20 BFSI VERTICAL TO ACCOUNT FOR LARGEST MARKET SHARE DURING FORECAST PERIOD
  • FIGURE 21 ASIA PACIFIC TO EMERGE AS BEST MARKET FOR INVESTMENT IN NEXT FIVE YEARS
  • FIGURE 22 DRIVERS, RESTRAINTS, OPPORTUNITIES, AND CHALLENGES: CHAOS ENGINEERING TOOLS MARKET
  • FIGURE 23 BENEFITS OF OBSERVABILITY TOOLS, 2023
  • FIGURE 24 STATE OF DEVOPS MATURITY
  • FIGURE 25 CHAOS ENGINEERING TOOLS MARKET: SUPPLY CHAIN ANALYSIS
  • FIGURE 26 CHAOS ENGINEERING TOOLS MARKET: ECOSYSTEM
  • FIGURE 27 NUMBER OF PATENTS PUBLISHED, 2012–2022
  • FIGURE 28 TOP FIVE PATENT OWNERS (GLOBAL), 2022
  • FIGURE 29 CHAOS ENGINEERING TOOLS MARKET: PORTER’S FIVE FORCES ANALYSIS
  • FIGURE 30 CHAOS ENGINEERING TOOLS MARKET: TRENDS/DISRUPTIONS IMPACTING BUYERS
  • FIGURE 31 INFLUENCE OF STAKEHOLDERS ON BUYING PROCESS FOR INDUSTRY VERTICALS
  • FIGURE 32 KEY BUYING CRITERIA FOR END USERS
  • FIGURE 33 STEPS TO UNDERSTAND CHAOS ENGINEERING TOOLS
  • FIGURE 34 SERVICES SEGMENT TO GROW AT HIGHER CAGR DURING FORECAST PERIOD
  • FIGURE 35 PUBLIC CLOUD SEGMENT TO ACCOUNT FOR LARGER MARKET DURING FORECAST PERIOD
  • FIGURE 36 IT & ITES VERTICAL TO ACCOUNT FOR LARGEST MARKET SIZE IN 2023
  • FIGURE 37 NORTH AMERICA TO ACCOUNT FOR LARGEST MARKET SIZE BY 2028
  • FIGURE 38 NORTH AMERICA: MARKET SNAPSHOT
  • FIGURE 39 ASIA PACIFIC: MARKET SNAPSHOT
  • FIGURE 40 CHAOS ENGINEERING TOOLS MARKET: MARKET SHARE ANALYSIS
  • FIGURE 41 REVENUE ANALYSIS FOR KEY PLAYERS IN PAST FIVE YEARS
  • FIGURE 42 COMPANY EVALUATION MATRIX: CRITERIA WEIGHTAGE
  • FIGURE 43 CHAOS ENGINEERING TOOLS MARKET (GLOBAL): COMPANY EVALUATION MATRIX, 2022
  • FIGURE 44 COMPANY FINANCIAL METRICS, 2022
  • FIGURE 45 CHAOS ENGINEERING TOOLS MARKET: GLOBAL SNAPSHOT OF KEY MARKET PARTICIPANTS, 2022
  • FIGURE 46 MICROSOFT: COMPANY SNAPSHOT
  • FIGURE 47 AWS: COMPANY SNAPSHOT
  • FIGURE 48 OPENTEXT: COMPANY SNAPSHOT
  • FIGURE 49 NAGARRO: COMPANY SNAPSHOT
  • FIGURE 50 PAGERDUTY: COMPANY SNAPSHOT

The study involved four major activities in estimating the current chaos engineering tools market size. Extensive secondary research was done to collect information on the market, the competitive market, and the parent market. The next step was to validate these findings, assumptions, and sizing with industry experts across the value chain through primary research. Both top-down and bottom-up approaches were employed to estimate the complete market size. After that, the market breakup and data triangulation procedures were used to estimate the size of the various segments in the chaos engineering tools market.

Secondary Research

This research study used extensive secondary sources, directories, and databases, such as D&B Hoovers, DiscoverOrg, Factiva, vendor data sheets, product demos, Cloud Computing Association (CCA), Vendor Surveys, Asia Cloud Computing Association, and The Software Alliance. All these sources were referred to for identifying and collecting valuable information for this technical, market-oriented, and commercial study of the chaos engineering tools market.

Primary Research

Primary sources were several industry experts from the core and related industries, preferred software providers, hardware manufacturers, distributors, service providers, technology developers, alliances, and organizations related to all segments of the industry’s value chain. In-depth interviews were conducted with various primary respondents, including key industry participants, subject-matter experts, C-level executives of key market players, and industry consultants, to obtain and verify critical qualitative and quantitative information and assess the market’s prospects.

Primary interviews were conducted to gather insights, such as market statistics, the latest trends disrupting the market, new use cases implemented, data on revenue collected from products and services, market breakups, market size estimations, market forecasts, and data triangulation. Primary research also helped understand various technology trends, segmentation types, industry trends, and regions. Demand-side stakeholders, such as Chief Information Officers (CIOs), Chief Technology Officers (CTOs), and Chief Security Officers (CSOs); the installation teams of governments/end users using chaos engineering tools; and digital initiatives project teams, were interviewed to understand the buyer’s perspective on suppliers, products, service providers, and their current use of services, which would affect the overall chaos engineering tools market.

Chaos Engineering Tools Market Size, and Share

To know about the assumptions considered for the study, download the pdf brochure

Market Size Estimation

Both top-down and bottom-up approaches were used to estimate and forecast the chaos engineering tools market and other dependent submarkets. The bottom-up procedure was deployed to arrive at the overall market size using the revenues and offerings of key companies in the market. With data triangulation methods and validation through primary interviews, this study determined and confirmed the exact value of the overall parent market size. The overall market size was then used in the top-down procedure to estimate the size of other individual markets via percentage splits of the market segments.

The top-down and bottom-up approaches were used to estimate and validate the size of the chaos engineering tools market and various other dependent subsegments.

The research methodology used to estimate the market size included the following details:

  • The key players in the market were identified through secondary research, and their revenue contributions in the respective countries were determined through primary and secondary research.
  • This procedure included studying top market players' annual and financial reports and extensive interviews for key insights from industry leaders, such as Chief Executive Officers (CEOs), VPs, directors, and marketing executives.
  • All percentage splits and breakups were determined using secondary sources and verified through primary sources.

All the possible parameters that affect the market covered in this research study have been accounted for, viewed in extensive detail, verified through primary research, and analyzed to get the final quantitative and qualitative data. This data is consolidated and added with detailed inputs and analysis from MarketsandMarkets.

Chaos engineering tools market: Top-down and bottom-up approaches

Chaos Engineering Tools Market Size, and Share

To know about the assumptions considered for the study, Request for Free Sample Report

Data Triangulation

After arriving at the overall market size, the market was split into several segments and subsegments—using the market size estimation processes as explained above. To complete the overall market engineering process and arrive at the exact statistics of each market segment and subsegment, data triangulation and market breakup procedures were employed, wherever applicable. The data was triangulated by studying several factors and trends from both the demand and supply sides in the chaos engineering tools market.

Market Definition

Chaos engineering tools are software applications and platforms designed to facilitate the practice of chaos engineering. Chaos engineering is a discipline that involves controlled, deliberate experiments on a system or application to identify weaknesses, vulnerabilities, and potential points of failure. The goal is to proactively improve the system's resilience, fault tolerance, and reliability. These tools typically provide the means to inject various forms of controlled chaos into a system, enabling engineers to simulate real-world scenarios and observe how the system responds under stress. The observations from these experiments help teams uncover vulnerabilities and shortcomings in their architecture, enabling them to make targeted improvements.
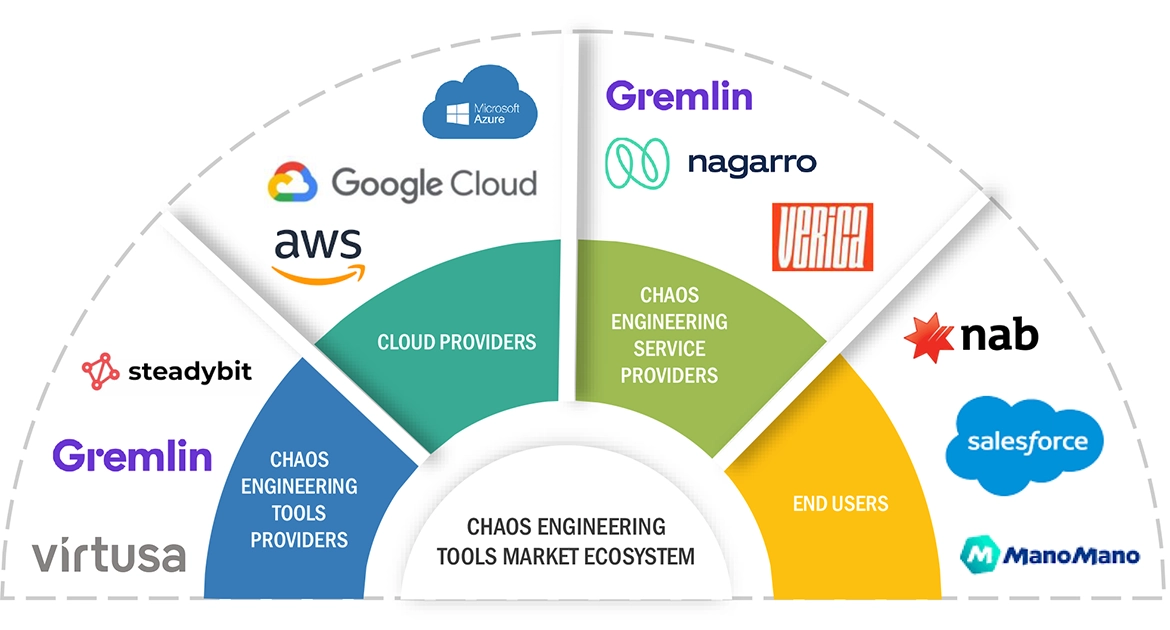
Key Stakeholders

  • IT Service Providers
  • Support Infrastructure Equipment Providers
  • Component Providers
  • Software Providers
  • System Integrators
  • Network Service Providers
  • Consulting Service Providers
  • Professional Service Providers
  • Distributors and Resellers
  • Cloud Providers
  • Colocation Providers
  • Enterprises
  • Government and Standardization Bodies
  • Telecom Operators
  • Healthcare Organizations
  • Financial Organizations
  • Datacenter Vendors
  • Technology partners
  • Technology providers

Report Objectives

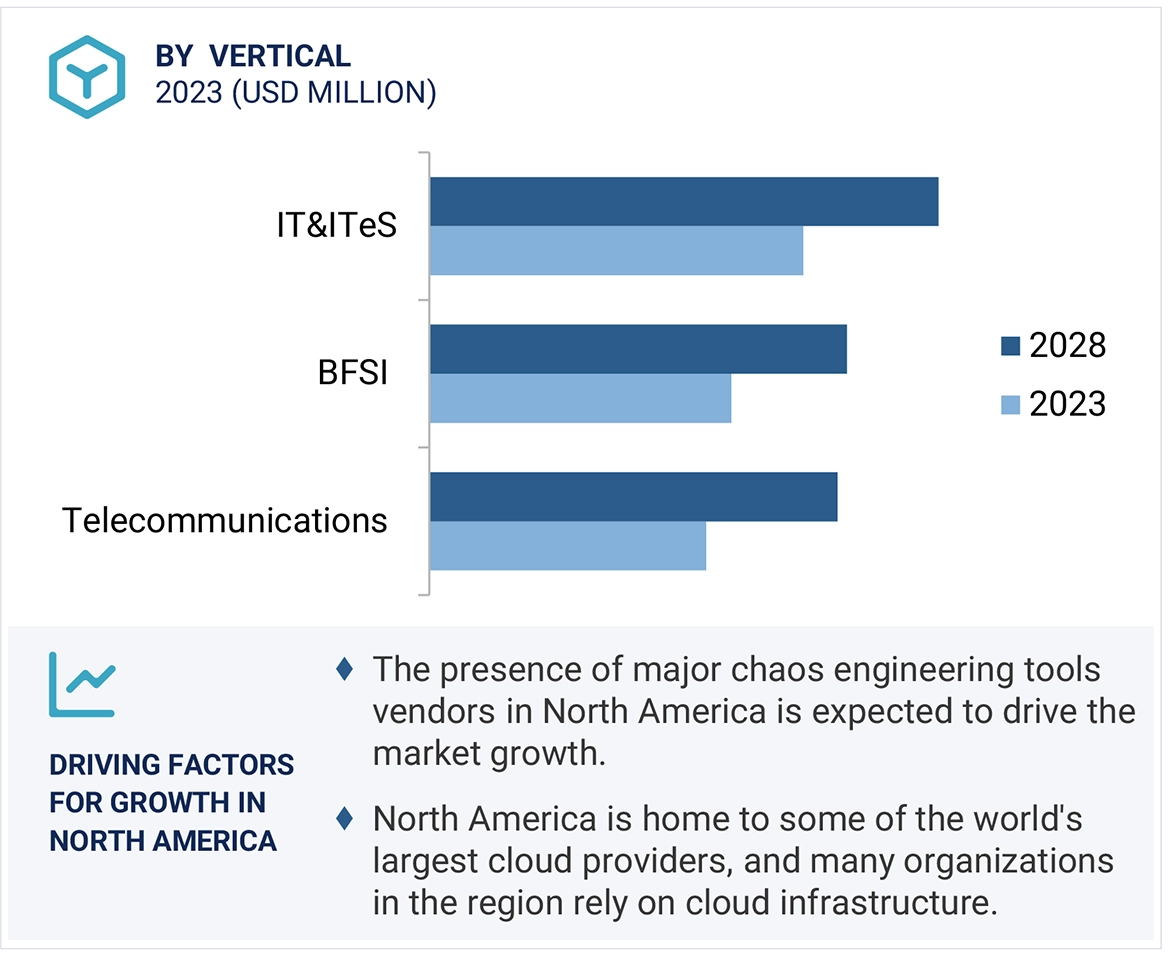
  • To define, describe, and forecast the global chaos engineering tools market based on component, application, deployment, end user, vertical, and region
  • To forecast the market size of the five major regional segments: North America, Europe, Asia Pacific, Middle East & Africa, and Latin America
  • To strategically analyze the market subsegments with respect to individual growth trends, prospects, and contributions to the total market
  • To provide detailed information related to the major factors influencing the growth of the market (drivers, restraints, opportunities, and challenges)
  • To strategically analyze the macro and micromarkets1 with respect to growth trends, prospects, and their contributions to the overall market
  • To analyze the industry trends, patents and innovations, and pricing data related to the chaos engineering tools market.
  • To analyze the opportunities in the market for stakeholders and provide details of the competitive landscape for major players.
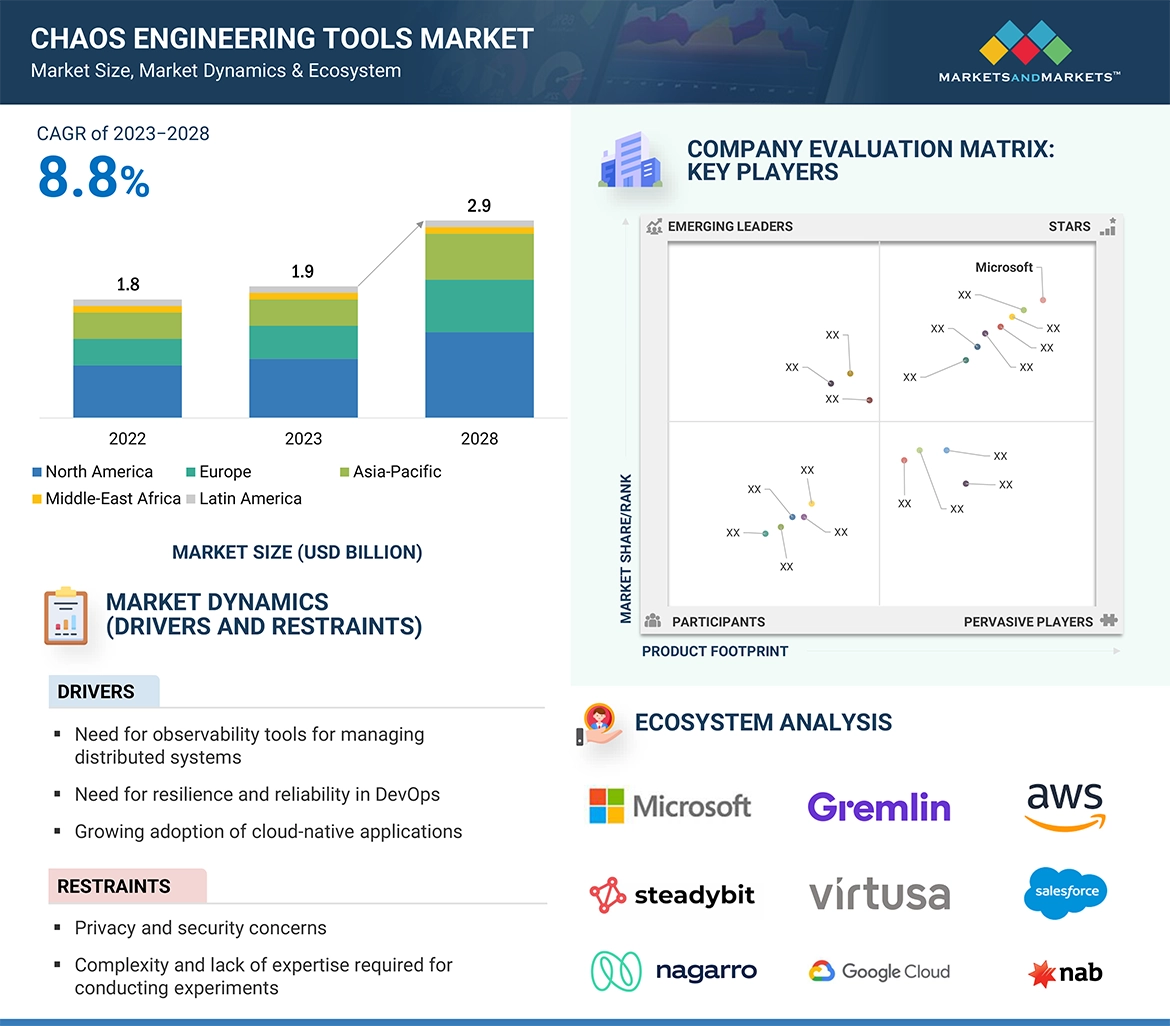
  • To profile the key players in the market and comprehensively analyze their market share/ranking and core competencies across segments and subsegments.
  • To track and analyze the competitive developments, such as mergers and acquisitions, product developments, and partnerships and collaborations in the market.

Available Customizations

With the given market data, MarketsandMarkets offers customizations as per the company’s specific needs. The following customization options are available for the report:

Product Analysis

  • The product matrix provides a detailed comparison of the product portfolio of each company.

Geographic Analysis

  • Further breakup of the Asia Pacific market into countries contributing 75% to the regional market size
  • Further breakup of the North American market into countries contributing 75% to the regional market size
  • Further breakup of the Latin American market into countries contributing 75% to the regional market size
  • Further breakup of the Middle Eastern & African market into countries contributing 75% to the regional market size
  • Further breakup of the European market into countries contributing 75% to the regional market size

Company Information

  • Detailed analysis and profiling of additional market players (up to 5)

Previous Versions of this Report

"Our USP is "providing game-changing business opportunities reports with free customization" - so please feel free to provide us with your specific areas of interest / business challenges in much greater detail !!"

We appreciate your interest in this report. Once you fill out the form, you'll be immediately directed to an exclusive solution tailored to your needs. This high-value offering can help boost your revenue by 30% - a must-see opportunity for anyone looking to maximize growth.


By clicking the "Submit" button, you are agreeing to the Terms of Use and Privacy Policy.

Custom Market Research Services

We Will Customise The Research For You, In Case The Report Listed Above Does Not Meet With Your Requirements

Get 10% Free Customisation

Growth opportunities and latent adjacency in Chaos Engineering Tools Market

DMCA.com Protection Status