We use cookies to enhance your experience. By continuing to visit this site you agree to our use of cookies . More info . X close

Bunion Surgery Market: Growth, Size, Share, and Trends

Report Code MD 9274
Published in Jan, 2025, By MarketsandMarkets™
Download PDF

Choose License Type

Buy Report Now Inquire Before Buying

Bunion Surgery Market by Product (Correction Systems, Implants & Accessories), Patient Type (Adult, Pediatric), Type (Minimally Invasive Surgery, Traditional Surgery), End User (Hospitals, ASCs, Orthopedic Clinics), Region - Global Forecast to 2029

Overview

The global bunion surgery market, valued at US$437.8 million in 2023, is forecasted to grow at a robust CAGR of 5.7%, reaching US$458.4 million in 2024 and an impressive US$606.1 million by 2029. The main factor driving this market is the rising prevalence of bunions, which has led to an increased demand for surgical treatments. In addition, the aging population, which is globally increasing and is more prone to orthopedic problems, such as hallux valgus (bunion), contributes to this demand. Moreover, the increasing adoption of minimally invasive procedures for small incisions, quicker recovery time, and shorter hospital stays also propel the market growth. The other driver for the market growth would be the increasing number of people suffering from rheumatoid arthritis, which may cause joint deformities in the form of bunions. Thus, the market for bunion surgery is expected to continue its steady growth over the next several years.

Bunion Surgery Market

Attractive Opportunities in the Bunion Surgery Market

Asia Pacific

Market growth in the Asia Pacific can be attributed to the increasing healthcare expenditure, the rapid expansion of medical infrastructure, and the rising geriatric population.

The market is driven by the increasing prevalence of bunions, especially among the aging population, coupled with changing lifestyles.

The Asia Pacific bunion surgery market is expected to be worth USD 127.6 million by 2029, growing at CAGR of 8.1% during the forecast period.

Product launches and acquisitions were the most widely adopted growth strategies among market players.

The Asia Pacific market is estimated to grow at the highest CAGR during the forecast period.

Global Bunion Surgery Market Dynamics

DRIVER: Increasing burden of bunion surgeries

The rising incidence of bunions is one of the key drivers for the bunion surgery market. With an increasing geriatric population globally, there is a surge in age-related conditions like arthritis. The elderly are at a higher risk of developing bunions because of joint degeneration. The growing elderly population has, therefore, led to the increased need for surgical interventions in correcting bunion deformities. Moreover, the increasing rate of sports injuries also contributes to the growth of the market because athletes often exert too much stress on their feet, which leads to the formation of bunions. Lifestyle factors, such as wearing inappropriate footwear, also lead to the development of bunions, further expanding surgical requirements. All such factors combined are significantly driving the growth of the bunion surgery market.

RESTRAINT: High cost of surgeries

The high cost of bunion surgery is a major restraint in the market because it restricts access to many patients, particularly those without adequate insurance or financial resources. Several factors influence the cost of bunion surgery, including geographic location, the type of procedure, insurance coverage, and the patient's overall health. These financial barriers prevent people from getting treatment on time. Thus, the patient faces more extended pain, complicated risk, or even requires complex procedures in the near future. The high cost of bunion surgery is a barrier to access surgeries, thereby limiting this market and preventing patients from availing themselves of the long-term benefits through the procedure.


OPPORTUNITY: Rising number of hospitals and surgical centers worldwide

Increasing numbers of hospitals and surgical centers in developed as well as emerging countries are driving the demand for orthopedic services, such as bunion surgery. The rising geriatric population drives this trend, higher numbers of trauma patients, and advancements in orthopedic implants. Moreover, the continuous upgrades of hospitals for orthopedic treatment devices and government initiatives for setting up new orthopedic facilities in developing countries are significant growth opportunities for manufacturers in the bunion surgery market. These factors allow expansion and a wider reach in the market for companies in the industry.

CHALLENGES: Availability of non-surgical alternatives

A significant challenge for the bunion surgery market is the availability of a wide range of effective non-surgical options that can manage symptoms and potentially postpone the need for surgery in less severe cases. Treatments such as custom orthotics, appropriate footwear, padding, night splints, physical therapy, corticosteroid injections, and ice therapy can decrease pain and improve foot function and the progression of the condition in many patients to the extent that surgery is avoided. Surgery is often the only cure for more advanced cases with significant pain due to a bunion or loss of mobility and function.

Global Bunion Surgery Market Ecosystem Analysis

The key end users of the bunion surgery market ecosystem are hospitals, ambulatory surgery centers, and orthopedic clinics. Traditional surgeries and minimally invasive surgeries are some of the key surgery segments within the bunion surgery market. This ecosystem is further influenced by advancements in surgical technologies, regulatory approvals, and the evolution of patient preferences that contribute to the growth and evolution of the market.

Bunion Surgery Market
 

By type, the minimally invasive surgeries segment is expected to grow at the highest rate in the bunion surgery market during the forecast period.

The minimally invasive surgeries segment is expected to grow at the highest rate due to faster recovery time, less tissue damage, and small incisions. Technological innovations in surgical equipment are also driving the segment. For instance, the launch of PROstep MIS Lapidus by Stryker (US) has improved precision, safety, and effectiveness for minimally invasive procedures. The increasing preference for procedures with quicker recovery periods, lower complication rates, and less scarring is also leading to the growth of the segment. Although initial costs are generally higher because of the high-tech equipment, shorter hospital stays and faster recovery periods are generally cost-effective compared to the overall costs. All these factors position minimally invasive surgeries for significant growth in the bunion surgery market.

By end user, the hospitals segment is expected to have the highest growth rate in the bunion surgery market during the forecast period.

The availability of advanced surgical technologies, well-qualified medical professionals, and adequate healthcare facilities in hospitals can be used for traditional and minimally invasive bunion surgeries. Additionally, the hospital segment growth is further supported by the increasing incidence of bunions and rising demand for specialty surgical procedures. Furthermore, the hospitals have established infrastructure, wide insurance coverage, and the capacity to serve higher volumes of patients, which collectively enhances their overall market position. Thus, the hospitals segment is likely to continue holding a larger share of the bunion surgery market during the projected period.

In 2023, North America held the largest share of the bunion surgery market.

The market for bunion surgery has been segmented into six major geographical regions: North America, Europe, the Asia Pacific, Latin America, the Middle East & Africa, and GCC Countries. North America holds a major share in the global bunion surgery market, mainly due to its developed healthcare system, high prevalence of bunions, FDA approvals, and key players in the region. The developed healthcare infrastructure in the region supports the adoption of traditional as well as minimally invasive surgeries. Moreover, the higher prevalence of bunions, especially among the elderly, increases the demand for surgical treatments. FDA approval of innovative surgical devices regarding safety and efficacy further boosts the market growth. Moreover, the presence of key players also strengthens the dominance of the region in the market.

HIGHEST CAGR MARKET IN 2023
NORTH AMERICA FASTEST GROWING MARKET IN THE REGION
Bunion Surgery Market

Recent Developments of Bunion Surgery Market

  • In July 2024, Stryker (US) acquired Artelon Inc. (Georgia), a company specializing in innovative soft tissue fixation products for foot and ankle, as well as sports medicine procedures. This acquisition enhances the soft tissue fixation portfolio of Stryker.
  • In August 2025, Johnson & Johnson Services, Inc. (US) introduced the TriLEAP Lower Extremity Anatomic Plating System through its subsidiary DePuy Synthes (US). It is used for bunionectomies, osteotomies, fusions, and foot or ankle fractures.
  • In May 2023, Medartis AG (Switzerland) acquired Nextremity Solutions, Inc. (US). The deal will help accelerate and scale its ongoing expansion activities in the US market, which is regarded as one of the major growth drivers for extremities business in the country.
  • In February 2022, Johnson & Johnson Services Inc. (US) acquired CrossRoads Extremity Systems (US), which focuses on procedure-specific, sterile-packed foot and ankle implants and instruments.

Key Market Players

Want to explore hidden markets that can drive new revenue in Bunion Surgery Market?

Scope of the Report

Report Metric Details
Market size available for years 2022-2029
Base Year Considered 2023
Forecast period 2024-2029
Forecast units Value (USD)
Segments covered Product Type, Method, Application, and End User
Geographies covered North America, Europe, Asia Pacific, Latin America, and the Middle East and Africa


Key Questions Addressed by the Report

What are the recent trends affecting the bunion surgery market?
The recent trends in the bunion surgery market are mainly driven by the increasing use of minimally invasive surgery. MIS techniques have gained popularity due to smaller incisions, reduced tissue disruption, and quicker recovery times. These procedures also tend to have less postoperative pain and fewer risks of complications. The increasing trend in age across the global population raises the prevalence of bunions. Bunions mostly occur in the elderly population and require surgery, thereby driving more demand for bunion surgeries.
What are the key types of bunion surgeries?
There are primarily two types of bunion surgeries: traditional and minimally invasive. Traditional surgery involves a large incision to remove the bunion and realign the bones. This may have a longer recovery time and is generally more risky for complications. However, it often corrects the deformity in severe cases. MIS uses smaller incisions and specialized tools for quicker recovery, less pain, and fewer complications, which is ideal for less severe cases.
Who are the key players in the bunion surgery market?
The key players in this market are Stryker (US), Johnson & Johnson Services, Inc. (US), Smith+Nephew (UK), Paragon 28, Inc. (US), CONMED Corporation (US), Zimmer Biomet (US), Treace Medical Concepts, Inc (US), Enovis Corporation (US), and Medartis AG (Switzerland).
Who are the key end users of the bunion surgery market?
The major end users of bunion surgery are hospitals, ambulatory surgery centers, and orthopedic clinics. In 2023, the largest share of the bunion surgery market was held by the hospitals segment with advanced infrastructure, specialized surgical teams, and the facility to deal with complicated cases.
Which region is more profitable for growth in the bunion surgery market?
The Asia Pacific region is one of the most promising for the bunion surgery market, mainly due to the high prevalence of disease, large patient population, and advanced infrastructure for healthcare.


Personalize This Research

  • Triangulate with your Own Data
  • Get Data as per your Format and Definition
  • Gain a Deeper Dive on a Specific Application, Geography, Customer or Competitor
  • Any level of Personalization
Request A Free Customisation

Let Us Help You

  • What are the Known and Unknown Adjacencies Impacting the Bunion Surgery Market
  • What will your New Revenue Sources be?
  • Who will be your Top Customer; what will make them switch?
  • Defend your Market Share or Win Competitors
  • Get a Scorecard for Target Partners
Customized Workshop Request

Table of Contents

Exclusive indicates content/data unique to MarketsandMarkets and not available with any competitors.

TITLE
PAGE NO
INTRODUCTION
24
RESEARCH METHODOLOGY
28
EXECUTIVE SUMMARY
40
PREMIUM INSIGHTS
44
MARKET OVERVIEW
47
  • 5.1 INTRODUCTION
  • 5.2 MARKET DYNAMICS
    DRIVERS
    - Increasing burden of bunion surgeries
    - Expanding geriatric population
    - Rising incidence of sports injuries and rheumatoid arthritis
    - Growing demand for minimally invasive surgeries
    - Increasing research funding and grants
    RESTRAINTS
    - High cost of surgeries
    OPPORTUNITIES
    - Rising number of hospitals and surgical centers worldwide
    - Growth opportunities in emerging markets
    CHALLENGES
    - Availability of non-surgical alternatives
  • 5.3 TRENDS/DISRUPTIONS IMPACTING CUSTOMER BUSINESS
  • 5.4 PRICING ANALYSIS
    AVERAGE SELLING PRICE TREND OF BUNION SURGERY PRODUCTS
    INDICATIVE SELLING PRICE OF BUNION SURGERY PRODUCTS, BY REGION
    INDICATIVE SELLING PRICE OF BUNION SURGERY PRODUCTS, BY KEY PLAYER
  • 5.5 VALUE CHAIN ANALYSIS
  • 5.6 SUPPLY CHAIN ANALYSIS
  • 5.7 ECOSYSTEM ANALYSIS
  • 5.8 INVESTMENT AND FUNDING SCENARIO
  • 5.9 TECHNOLOGY ANALYSIS
    KEY TECHNOLOGIES
    - Implants
    COMPLEMENTARY TECHNOLOGIES
    - Correction systems
    ADJACENT TECHNOLOGIES
    - Splints
  • 5.10 PATENT ANALYSIS
  • 5.11 TRADE ANALYSIS
    IMPORT DATA FOR HS CODE 9021
    EXPORT DATA FOR HS CODE 9021
  • 5.12 KEY CONFERENCES AND EVENTS, 2025–2026
  • 5.13 REGULATORY LANDSCAPE
    REGULATORY ANALYSIS
    - North America
    - Europe
    - Asia Pacific
    - Latin America
    - Middle East & Africa
    REGULATORY BODIES, GOVERNMENT AGENCIES, AND OTHER ORGANIZATIONS
  • 5.14 PORTER’S FIVE FORCES ANALYSIS
    THREAT OF NEW ENTRANTS
    THREAT OF SUBSTITUTES
    BARGAINING POWER OF BUYERS
    BARGAINING POWER OF SUPPLIERS
    INTENSITY OF COMPETITIVE RIVALRY
  • 5.15 KEY STAKEHOLDERS AND BUYING CRITERIA
    KEY STAKEHOLDERS IN BUYING PROCESS
    BUYING CRITERIA
  • 5.16 IMPACT OF AI ON BUNION SURGERY MARKET
    INTRODUCTION
    MARKET POTENTIAL OF AI
    AI USE CASES
    FUTURE OF AI/GEN AI
BUNION SURGERY MARKET, BY PRODUCT
80
  • 6.1 INTRODUCTION
  • 6.2 INTERNAL DEVICES
    SHIFTING DEMOGRAPHIC PATTERN TO FACILITATE GROWTH
  • 6.3 EXTERNAL DEVICES
    GROWING PREFERENCE FOR MINIMALLY INVASIVE SURGERIES TO DRIVE MARKET
BUNION SURGERY MARKET, BY PATIENT TYPE
88
  • 7.1 INTRODUCTION
  • 7.2 ADULT PATIENTS
    CHANGING LIFESTYLE PREFERENCES TO PROMOTE GROWTH
  • 7.3 PEDIATRIC PATIENTS
    INCREASING PREVALENCE OF FLAT FEET AND CEREBRAL PALSY TO AID GROWTH
BUNION SURGERY MARKET, BY TYPE
96
  • 8.1 INTRODUCTION
  • 8.2 TRADITIONAL SURGERIES
    RISING POOL OF ARTHRITIS PATIENTS TO EXPEDITE GROWTH
  • 8.3 MINIMALLY INVASIVE SURGERIES
    GROWING ADVANCEMENTS IN SPECIALIZED SURGICAL TOOLS TO FUEL MARKET
BUNION SURGERY MARKET, BY END USER
104
  • 9.1 INTRODUCTION
  • 9.2 HOSPITALS
    INCREASING DEMAND FOR SPECIALIZED TREATMENTS TO SUSTAIN GROWTH
  • 9.3 AMBULATORY SURGERY CENTERS
    RISING INCLINATION TOWARD LOWER COSTS AND SHORTER PATIENT STAYS TO STIMULATE GROWTH
  • 9.4 ORTHOPEDIC CLINICS
    GROWING PREFERENCE FOR EFFECTIVE POST-OPERATIVE CARE AND LIMITED HOSPITALIZATION TO BOOST MARKET
BUNION SURGERY MARKET, BY REGION
114
  • 10.1 INTRODUCTION
  • 10.2 NORTH AMERICA
    MACROECONOMIC OUTLOOK FOR NORTH AMERICA
    US
    - Increasing number of FDA approvals to facilitate growth
    CANADA
    - Growing incidence of arthritis to promote growth
  • 10.3 EUROPE
    MACROECONOMIC OUTLOOK FOR EUROPE
    GERMANY
    - Increasing incidence of osteoporosis to expedite growth
    UK
    - Growing demand for surgical treatments to drive market
    FRANCE
    - Presence of robust healthcare system to augment growth
    ITALY
    - Growing geriatric population to fuel market
    SPAIN
    - Rising prevalence of hallux valgus to encourage growth
    REST OF EUROPE
  • 10.4 ASIA PACIFIC
    MACROECONOMIC OUTLOOK FOR ASIA PACIFIC
    CHINA
    - Growing public access to modern healthcare to fuel market growth
    JAPAN
    - Rise in elderly population to support growth
    INDIA
    - High prevalence of arthritis and foot deformities to encourage growth
    REST OF ASIA PACIFIC
  • 10.5 LATIN AMERICA
    MACROECONOMIC OUTLOOK FOR LATIN AMERICA
    BRAZIL
    - Growing cultural focus on appearance to propel market
    MEXICO
    - Increased availability of advanced surgical techniques to augment growth
    REST OF LATIN AMERICA
  • 10.6 MIDDLE EAST & AFRICA
    GROWING ADVANCEMENTS IN MEDICAL TECHNOLOGIES TO PROPEL MARKET
    MACROECONOMIC OUTLOOK FOR MIDDLE EAST & AFRICA
  • 10.7 GCC COUNTRIES
    RISING FOCUS ON ADVANCED HEALTH INFRASTRUCTURE TO DRIVE MARKET
    MACROECONOMIC OUTLOOK FOR GCC COUNTRIES
COMPETITIVE LANDSCAPE
162
  • 11.1 INTRODUCTION
  • 11.2 KEY PLAYER STRATEGIES/RIGHT TO WIN
    OVERVIEW OF STRATEGIES ADOPTED BY KEY PLAYERS IN BUNION SURGERY MARKET
  • 11.3 REVENUE ANALYSIS, 2021–2023
  • 11.4 MARKET SHARE ANALYSIS, 2023
  • 11.5 COMPANY VALUATION AND FINANCIAL METRICS
  • 11.6 BRAND/PRODUCT COMPARISON
    SMITH+NEPHEW
    ZIMMER BIOMET
  • 11.7 COMPANY EVALUATION MATRIX: KEY PLAYERS, 2023
    STARS
    EMERGING LEADERS
    PERVASIVE PLAYERS
    PARTICIPANTS
    COMPANY FOOTPRINT: KEY PLAYERS, 2023
    - Company footprint
    - Region footprint
    - Product footprint
    - Patient type footprint
    - Type footprint
  • 11.8 COMPANY EVALUATION MATRIX: STARTUPS/SMES, 2023
    PROGRESSIVE COMPANIES
    RESPONSIVE COMPANIES
    DYNAMIC COMPANIES
    STARTING BLOCKS
    COMPETITIVE BENCHMARKING OF STARTUPS/SMES, 2023
    - Detailed list of key startups/SMEs
    - Competitive benchmarking of startups/SMEs
  • 11.9 COMPETITIVE SCENARIO
    PRODUCT LAUNCHES
    DEALS
COMPANY PROFILES
179
  • 12.1 KEY PLAYERS
    STRYKER
    - Business overview
    - Products offered
    - Recent developments
    - MnM view
    ZIMMER BIOMET
    - Business overview
    - Products offered
    - MnM view
    JOHNSON & JOHNSON SERVICES, INC.
    - Business overview
    - Products offered
    - Recent developments
    - MnM view
    SMITH+NEPHEW
    - Business overview
    - Products offered
    - Recent developments
    - MnM view
    ENOVIS CORPORATION
    - Business overview
    - Products offered
    - Recent developments
    PARAGON 28, INC.
    - Business overview
    - Products offered
    - Recent developments
    - MnM view
    TREACE MEDICAL CONCEPTS, INC.
    - Business overview
    - Products offered
    - Recent developments
    CONMED CORPORATION
    - Business overview
    - Products offered
    MEDARTIS AG
    - Business overview
    - Products offered
    - Recent developments
    DOUBLE MEDICAL TECHNOLOGY INC.
    - Business overview
    - Products offered
    ARTHREX, INC.
    - Business overview
    - Products offered
    - Recent developments
    ACUMED LLC
    - Business overview
    - Products offered
    - Recent developments
    MERETE GMBH
    - Business overview
    - Products offered
    VOOM MEDICAL DEVICES
    - Business overview
    - Products offered
    BIOPRO, INC
    - Business overview
    - Products offered
  • 12.2 OTHER PLAYERS
    DIETER MARQUARDT MEDIZINTECHNIK GMBH
    EXTREMITY MEDICAL
    ASTROLABE
    INVAMED
    ORTIMPLANT ORTHOPAEDICS & MEDICAL DEVICES
    AUXEIN
    EXACTECH, INC.
    JEIL MEDICAL CORPORATION
    AYSAM ORTHOPAEDICS & MEDICAL DEVICES
    DEVA TIBBI MALZEMELER
APPENDIX
227
  • 13.1 DISCUSSION GUIDE
  • 13.2 KNOWLEDGESTORE: MARKETSANDMARKETS’ SUBSCRIPTION PORTAL
  • 13.3 CUSTOMIZATION OPTIONS
  • 13.4 RELATED REPORTS
  • 13.5 AUTHOR DETAILS
LIST OF TABLES
 
  • TABLE 1 BUNION SURGERY MARKET: INCLUSIONS AND EXCLUSIONS
  • TABLE 2 BUNION SURGERY MARKET: RISK ASSESSMENT
  • TABLE 3 FUNDING AND GRANTS IN BUNION SURGERY MARKET, 2021–2022
  • TABLE 4 AVERAGE SELLING PRICE TREND OF BUNION SURGERY PRODUCTS, 2022–2024
  • TABLE 5 INDICATIVE SELLING PRICE OF BUNION SURGERY PRODUCTS, BY REGION, 2022–2024
  • TABLE 6 INDICATIVE SELLING PRICE OF BUNION SURGERY PRODUCTS, BY KEY PLAYER, 2024 (USD)
  • TABLE 7 BUNION SURGERY MARKET: ROLE OF COMPANIES IN ECOSYSTEM
  • TABLE 8 BUNION SURGERY MARKET: INNOVATIONS AND PATENT REGISTRATIONS, 2022–2023
  • TABLE 9 IMPORT DATA FOR HS CODE 9021, BY COUNTRY, 2019–2023 (USD MILLION)
  • TABLE 10 EXPORT DATA FOR HS CODE 9021, BY COUNTRY, 2019–2023 (USD MILLION)
  • TABLE 11 BUNION SURGERY MARKET: KEY CONFERENCES AND EVENTS, 2025–2026
  • TABLE 12 US FDA: MEDICAL DEVICE CLASSIFICATION
  • TABLE 13 US: MEDICAL DEVICE REGULATORY APPROVAL PROCESS
  • TABLE 14 CANADA: MEDICAL DEVICE REGULATORY APPROVAL PROCESS
  • TABLE 15 CHINA: CLASSIFICATION OF MEDICAL DEVICES
  • TABLE 16 JAPAN: MEDICAL DEVICE CLASSIFICATION UNDER PHARMACEUTICALS AND MEDICAL DEVICES AGENCY
  • TABLE 17 NORTH AMERICA: REGULATORY BODIES, GOVERNMENT AGENCIES, AND OTHER ORGANIZATIONS
  • TABLE 18 EUROPE: REGULATORY BODIES, GOVERNMENT AGENCIES, AND OTHER ORGANIZATIONS
  • TABLE 19 ASIA PACIFIC: REGULATORY BODIES, GOVERNMENT AGENCIES, AND OTHER ORGANIZATIONS
  • TABLE 20 LATIN AMERICA: REGULATORY BODIES, GOVERNMENT AGENCIES, AND OTHER ORGANIZATIONS
  • TABLE 21 REST OF THE WORLD: REGULATORY BODIES, GOVERNMENT AGENCIES, AND OTHER ORGANIZATIONS
  • TABLE 22 BUNION SURGERY MARKET: PORTER’S FIVE FORCES
  • TABLE 23 INFLUENCE OF STAKEHOLDERS ON BUYING PROCESS, BY PRODUCT (%)
  • TABLE 24 BUYING CRITERIA, BY PRODUCT
  • TABLE 25 BUNION SURGERY MARKET, BY PRODUCT, 2022–2029 (USD MILLION)
  • TABLE 26 KEY PRODUCTS IN INTERNAL DEVICES MARKET
  • TABLE 27 BUNION SURGERY MARKET FOR INTERNAL DEVICES, BY REGION, 2022–2029 (USD MILLION)
  • TABLE 28 NORTH AMERICA: BUNION SURGERY MARKET FOR INTERNAL DEVICES, BY COUNTRY, 2022–2029 (USD MILLION)
  • TABLE 29 EUROPE: BUNION SURGERY MARKET FOR INTERNAL DEVICES, BY COUNTRY, 2022–2029 (USD MILLION)
  • TABLE 30 ASIA PACIFIC: BUNION SURGERY MARKET FOR INTERNAL DEVICES, BY COUNTRY, 2022–2029 (USD MILLION)
  • TABLE 31 LATIN AMERICA: BUNION SURGERY MARKET FOR INTERNAL DEVICES, BY COUNTRY, 2022–2029 (USD MILLION)
  • TABLE 32 KEY PRODUCTS IN EXTERNAL DEVICES MARKET
  • TABLE 33 BUNION SURGERY MARKET FOR EXTERNAL DEVICES, BY REGION, 2022–2029 (USD MILLION)
  • TABLE 34 NORTH AMERICA: BUNION SURGERY MARKET FOR EXTERNAL DEVICES, BY COUNTRY, 2022–2029 (USD MILLION)
  • TABLE 35 EUROPE: BUNION SURGERY MARKET FOR EXTERNAL DEVICES, BY COUNTRY, 2022–2029 (USD MILLION)
  • TABLE 36 ASIA PACIFIC: BUNION SURGERY MARKET FOR EXTERNAL DEVICES, BY COUNTRY, 2022–2029 (USD MILLION)
  • TABLE 37 LATIN AMERICA: BUNION SURGERY MARKET FOR EXTERNAL DEVICES, BY COUNTRY, 2022–2029 (USD MILLION)
  • TABLE 38 BUNION SURGERY MARKET, BY PATIENT TYPE, 2022–2029 (USD MILLION)
  • TABLE 39 BUNION SURGERY MARKET FOR ADULT PATIENTS, BY REGION, 2022–2029 (USD MILLION)
  • TABLE 40 NORTH AMERICA: BUNION SURGERY MARKET FOR ADULT PATIENTS, BY COUNTRY, 2022–2029 (USD MILLION)
  • TABLE 41 EUROPE: BUNION SURGERY MARKET FOR ADULT PATIENTS, BY COUNTRY, 2022–2029 (USD MILLION)
  • TABLE 42 ASIA PACIFIC: BUNION SURGERY MARKET FOR ADULT PATIENTS, BY COUNTRY, 2022–2029 (USD MILLION)
  • TABLE 43 LATIN AMERICA: BUNION SURGERY MARKET FOR ADULT PATIENTS, BY COUNTRY, 2022–2029 (USD MILLION)
  • TABLE 44 BUNION SURGERY MARKET FOR PEDIATRIC PATIENTS, BY REGION, 2022–2029 (USD MILLION)
  • TABLE 45 NORTH AMERICA: BUNION SURGERY MARKET FOR PEDIATRIC PATIENTS, BY COUNTRY, 2022–2029 (USD MILLION)
  • TABLE 46 EUROPE: BUNION SURGERY MARKET FOR PEDIATRIC PATIENTS, BY COUNTRY, 2022–2029 (USD MILLION)
  • TABLE 47 ASIA PACIFIC: BUNION SURGERY MARKET FOR PEDIATRIC PATIENTS, BY COUNTRY, 2022–2029 (USD MILLION)
  • TABLE 48 LATIN AMERICA: BUNION SURGERY MARKET FOR PEDIATRIC PATIENTS, BY COUNTRY, 2022–2029 (USD MILLION)
  • TABLE 49 BUNION SURGERY MARKET, BY TYPE, 2022–2029 (USD MILLION)
  • TABLE 50 BUNION SURGERY MARKET FOR TRADITIONAL SURGERIES, BY REGION, 2022–2029 (USD MILLION)
  • TABLE 51 NORTH AMERICA: BUNION SURGERY MARKET FOR TRADITIONAL SURGERIES, BY COUNTRY, 2022–2029 (USD MILLION)
  • TABLE 52 EUROPE: BUNION SURGERY MARKET FOR TRADITIONAL SURGERIES, BY COUNTRY, 2022–2029 (USD MILLION)
  • TABLE 53 ASIA PACIFIC: BUNION SURGERY MARKET FOR TRADITIONAL SURGERIES, BY COUNTRY, 2022–2029 (USD MILLION)
  • TABLE 54 LATIN AMERICA: BUNION SURGERY MARKET FOR TRADITIONAL SURGERIES, BY COUNTRY, 2022–2029 (USD MILLION)
  • TABLE 55 BUNION SURGERY MARKET FOR MINIMALLY INVASIVE SURGERIES, BY REGION, 2022–2029 (USD MILLION)
  • TABLE 56 NORTH AMERICA: BUNION SURGERY MARKET FOR MINIMALLY INVASIVE SURGERIES, BY COUNTRY, 2022–2029 (USD MILLION)
  • TABLE 57 EUROPE: BUNION SURGERY MARKET FOR MINIMALLY INVASIVE SURGERIES, BY COUNTRY, 2022–2029 (USD MILLION)
  • TABLE 58 ASIA PACIFIC: BUNION SURGERY MARKET FOR MINIMALLY INVASIVE SURGERIES, BY COUNTRY, 2022–2029 (USD MILLION)
  • TABLE 59 LATIN AMERICA: BUNION SURGERY MARKET FOR MINIMALLY INVASIVE SURGERIES, BY COUNTRY, 2022–2029 (USD MILLION)
  • TABLE 60 BUNION SURGERY MARKET, BY END USER, 2022–2029 (USD MILLION)
  • TABLE 61 BUNION SURGERY MARKET FOR HOSPITALS, BY REGION, 2022–2029 (USD MILLION)
  • TABLE 62 NORTH AMERICA: BUNION SURGERY MARKET FOR HOSPITALS, BY COUNTRY, 2022–2029 (USD MILLION)
  • TABLE 63 EUROPE: BUNION SURGERY MARKET FOR HOSPITALS, BY COUNTRY, 2022–2029 (USD MILLION)
  • TABLE 64 ASIA PACIFIC: BUNION SURGERY MARKET FOR HOSPITALS, BY COUNTRY, 2022–2029 (USD MILLION)
  • TABLE 65 LATIN AMERICA: BUNION SURGERY MARKET FOR HOSPITALS, BY COUNTRY, 2022–2029 (USD MILLION)
  • TABLE 66 BUNION SURGERY MARKET FOR AMBULATORY SURGERY CENTERS, BY REGION, 2022–2029 (USD MILLION)
  • TABLE 67 NORTH AMERICA: BUNION SURGERY MARKET FOR AMBULATORY SURGERY CENTERS, BY COUNTRY, 2022–2029 (USD MILLION)
  • TABLE 68 EUROPE: BUNION SURGERY MARKET FOR AMBULATORY SURGERY CENTERS, BY COUNTRY, 2022–2029 (USD MILLION)
  • TABLE 69 ASIA PACIFIC: BUNION SURGERY MARKET FOR AMBULATORY SURGERY CENTERS, BY COUNTRY, 2022–2029 (USD MILLION)
  • TABLE 70 LATIN AMERICA: BUNION SURGERY MARKET FOR AMBULATORY SURGERY CENTERS, BY COUNTRY, 2022–2029 (USD MILLION)
  • TABLE 71 BUNION SURGERY MARKET FOR ORTHOPEDIC CLINICS, BY REGION, 2022–2029 (USD MILLION)
  • TABLE 72 NORTH AMERICA: BUNION SURGERY MARKET FOR ORTHOPEDIC CLINICS, BY COUNTRY, 2022–2029 (USD MILLION)
  • TABLE 73 EUROPE: BUNION SURGERY MARKET FOR ORTHOPEDIC CLINICS, BY COUNTRY, 2022–2029 (USD MILLION)
  • TABLE 74 ASIA PACIFIC: BUNION SURGERY MARKET FOR ORTHOPEDIC CLINICS, BY COUNTRY, 2022–2029 (USD MILLION)
  • TABLE 75 LATIN AMERICA: BUNION SURGERY MARKET FOR ORTHOPEDIC CLINICS, BY COUNTRY, 2022–2029 (USD MILLION)
  • TABLE 76 BUNION SURGERY MARKET, BY REGION, 2022–2029 (USD MILLION)
  • TABLE 77 NORTH AMERICA: BUNION SURGERY MARKET, BY COUNTRY, 2022–2029 (USD MILLION)
  • TABLE 78 NORTH AMERICA: BUNION SURGERY MARKET, BY PRODUCT, 2022–2029 (USD MILLION)
  • TABLE 79 NORTH AMERICA: BUNION SURGERY MARKET, BY PATIENT TYPE, 2022–2029 (USD MILLION)
  • TABLE 80 NORTH AMERICA: BUNION SURGERY MARKET, BY TYPE, 2022–2029 (USD MILLION)
  • TABLE 81 NORTH AMERICA: BUNION SURGERY MARKET, BY END USER, 2022–2029 (USD MILLION)
  • TABLE 82 NORTH AMERICA: NUMBER OF SURGERIES CONDUCTED, BY COUNTRY, 2022–2029
  • TABLE 83 NORTH AMERICA: MACROECONOMIC INDICATORS
  • TABLE 84 US: BUNION SURGERY MARKET, BY PRODUCT, 2022–2029 (USD MILLION)
  • TABLE 85 US: BUNION SURGERY MARKET, BY PATIENT TYPE, 2022–2029 (USD MILLION)
  • TABLE 86 US: BUNION SURGERY MARKET, BY TYPE, 2022–2029 (USD MILLION)
  • TABLE 87 US: BUNION SURGERY MARKET, BY END USER, 2022–2029 (USD MILLION)
  • TABLE 88 CANADA: BUNION SURGERY MARKET, BY PRODUCT, 2022–2029 (USD MILLION)
  • TABLE 89 CANADA: BUNION SURGERY MARKET, BY PATIENT TYPE, 2022–2029 (USD MILLION)
  • TABLE 90 CANADA: BUNION SURGERY MARKET, BY TYPE, 2022–2029 (USD MILLION)
  • TABLE 91 CANADA: BUNION SURGERY MARKET, BY END USER, 2022–2029 (USD MILLION)
  • TABLE 92 EUROPE: BUNION SURGERY MARKET, BY COUNTRY, 2022–2029 (USD MILLION)
  • TABLE 93 EUROPE: BUNION SURGERY MARKET, BY PRODUCT, 2022–2029 (USD MILLION)
  • TABLE 94 EUROPE: BUNION SURGERY MARKET, BY PATIENT TYPE, 2022–2029 (USD MILLION)
  • TABLE 95 EUROPE: BUNION SURGERY MARKET, BY TYPE, 2022–2029 (USD MILLION)
  • TABLE 96 EUROPE: BUNION SURGERY MARKET, BY END USER, 2022–2029 (USD MILLION)
  • TABLE 97 EUROPE: MACROECONOMIC INDICATORS
  • TABLE 98 GERMANY: BUNION SURGERY MARKET, BY PRODUCT, 2022–2029 (USD MILLION)
  • TABLE 99 GERMANY: BUNION SURGERY MARKET, BY PATIENT TYPE, 2022–2029 (USD MILLION)
  • TABLE 100 GERMANY: BUNION SURGERY MARKET, BY TYPE, 2022–2029 (USD MILLION)
  • TABLE 101 GERMANY: BUNION SURGERY MARKET, BY END USER, 2022–2029 (USD MILLION)
  • TABLE 102 UK: BUNION SURGERY MARKET, BY PRODUCT, 2022–2029 (USD MILLION)
  • TABLE 103 UK: BUNION SURGERY MARKET, BY PATIENT TYPE, 2022–2029 (USD MILLION)
  • TABLE 104 UK: BUNION SURGERY MARKET, BY TYPE, 2022–2029 (USD MILLION)
  • TABLE 105 UK: BUNION SURGERY MARKET, BY END USER, 2022–2029 (USD MILLION)
  • TABLE 106 FRANCE: BUNION SURGERY MARKET, BY PRODUCT, 2022–2029 (USD MILLION)
  • TABLE 107 FRANCE: BUNION SURGERY MARKET, BY PATIENT TYPE, 2022–2029 (USD MILLION)
  • TABLE 108 FRANCE: BUNION SURGERY MARKET, BY TYPE, 2022–2029 (USD MILLION)
  • TABLE 109 FRANCE: BUNION SURGERY MARKET, BY END USER, 2022–2029 (USD MILLION)
  • TABLE 110 ITALY: BUNION SURGERY MARKET, BY PRODUCT, 2022–2029 (USD MILLION)
  • TABLE 111 ITALY: BUNION SURGERY MARKET, BY PATIENT TYPE, 2022–2029 (USD MILLION)
  • TABLE 112 ITALY: BUNION SURGERY MARKET, BY TYPE, 2022–2029 (USD MILLION)
  • TABLE 113 ITALY: BUNION SURGERY MARKET, BY END USER, 2022–2029 (USD MILLION)
  • TABLE 114 SPAIN: BUNION SURGERY MARKET, BY PRODUCT, 2022–2029 (USD MILLION)
  • TABLE 115 SPAIN: BUNION SURGERY MARKET, BY PATIENT TYPE, 2022–2029 (USD MILLION)
  • TABLE 116 SPAIN: BUNION SURGERY MARKET, BY TYPE, 2022–2029 (USD MILLION)
  • TABLE 117 SPAIN: BUNION SURGERY MARKET, BY END USER, 2022–2029 (USD MILLION)
  • TABLE 118 REST OF EUROPE: BUNION SURGERY MARKET, BY PRODUCT, 2022–2029 (USD MILLION)
  • TABLE 119 REST OF EUROPE: BUNION SURGERY MARKET, BY PATIENT TYPE, 2022–2029 (USD MILLION)
  • TABLE 120 REST OF EUROPE: BUNION SURGERY MARKET, BY TYPE, 2022–2029 (USD MILLION)
  • TABLE 121 REST OF EUROPE: BUNION SURGERY MARKET, BY END USER, 2022–2029 (USD MILLION)
  • TABLE 122 ASIA PACIFIC: BUNION SURGERY MARKET, BY COUNTRY, 2022–2029 (USD MILLION)
  • TABLE 123 ASIA PACIFIC: BUNION SURGERY MARKET, BY PRODUCT, 2022–2029 (USD MILLION)
  • TABLE 124 ASIA PACIFIC: BUNION SURGERY MARKET, BY PATIENT TYPE, 2022–2029 (USD MILLION)
  • TABLE 125 ASIA PACIFIC: BUNION SURGERY MARKET, BY TYPE, 2022–2029 (USD MILLION)
  • TABLE 126 ASIA PACIFIC: BUNION SURGERY MARKET, BY END USER, 2022–2029 (USD MILLION)
  • TABLE 127 ASIA PACIFIC: MACROECONOMIC INDICATORS
  • TABLE 128 CHINA: BUNION SURGERY MARKET, BY PRODUCT, 2022–2029 (USD MILLION)
  • TABLE 129 CHINA: BUNION SURGERY MARKET, BY PATIENT TYPE, 2022–2029 (USD MILLION)
  • TABLE 130 CHINA: BUNION SURGERY MARKET, BY TYPE, 2022–2029 (USD MILLION)
  • TABLE 131 CHINA: BUNION SURGERY MARKET, BY END USER, 2022–2029 (USD MILLION)
  • TABLE 132 JAPAN: BUNION SURGERY MARKET, BY PRODUCT, 2022–2029 (USD MILLION)
  • TABLE 133 JAPAN: BUNION SURGERY MARKET, BY PATIENT TYPE, 2022–2029 (USD MILLION)
  • TABLE 134 JAPAN: BUNION SURGERY MARKET, BY TYPE, 2022–2029 (USD MILLION)
  • TABLE 135 JAPAN: BUNION SURGERY MARKET, BY END USER, 2022–2029 (USD MILLION)
  • TABLE 136 INDIA: BUNION SURGERY MARKET, BY PRODUCT, 2022–2029 (USD MILLION)
  • TABLE 137 INDIA: BUNION SURGERY MARKET, BY PATIENT TYPE, 2022–2029 (USD MILLION)
  • TABLE 138 INDIA: BUNION SURGERY MARKET, BY TYPE, 2022–2029 (USD MILLION)
  • TABLE 139 INDIA: BUNION SURGERY MARKET, BY END USER, 2022–2029 (USD MILLION)
  • TABLE 140 REST OF ASIA PACIFIC: BUNION SURGERY MARKET, BY PRODUCT, 2022–2029 (USD MILLION)
  • TABLE 141 REST OF ASIA PACIFIC: BUNION SURGERY MARKET, BY PATIENT TYPE, 2022–2029 (USD MILLION)
  • TABLE 142 REST OF ASIA PACIFIC: BUNION SURGERY MARKET, BY TYPE, 2022–2029 (USD MILLION)
  • TABLE 143 REST OF ASIA PACIFIC: BUNION SURGERY MARKET, BY END USER, 2022–2029 (USD MILLION)
  • TABLE 144 LATIN AMERICA: BUNION SURGERY MARKET, BY COUNTRY, 2022–2029 (USD MILLION)
  • TABLE 145 LATIN AMERICA: BUNION SURGERY MARKET, BY PRODUCT, 2022–2029 (USD MILLION)
  • TABLE 146 LATIN AMERICA: BUNION SURGERY MARKET, BY PATIENT TYPE, 2022–2029 (USD MILLION)
  • TABLE 147 LATIN AMERICA: BUNION SURGERY MARKET, BY TYPE, 2022–2029 (USD MILLION)
  • TABLE 148 LATIN AMERICA: BUNION SURGERY MARKET, BY END USER, 2022–2029 (USD MILLION)
  • TABLE 149 LATIN AMERICA: MACROECONOMIC INDICATORS
  • TABLE 150 BRAZIL: BUNION SURGERY MARKET, BY PRODUCT, 2022–2029 (USD MILLION)
  • TABLE 151 BRAZIL: BUNION SURGERY MARKET, BY PATIENT TYPE, 2022–2029 (USD MILLION)
  • TABLE 152 BRAZIL: BUNION SURGERY MARKET, BY TYPE, 2022–2029 (USD MILLION)
  • TABLE 153 BRAZIL: BUNION SURGERY MARKET, BY END USER, 2022–2029 (USD MILLION)
  • TABLE 154 MEXICO: BUNION SURGERY MARKET, BY PRODUCT, 2022–2029 (USD MILLION)
  • TABLE 155 MEXICO: BUNION SURGERY MARKET, BY PATIENT TYPE, 2022–2029 (USD MILLION)
  • TABLE 156 MEXICO: BUNION SURGERY MARKET, BY TYPE, 2022–2029 (USD MILLION)
  • TABLE 157 MEXICO: BUNION SURGERY MARKET, BY END USER, 2022–2029 (USD MILLION)
  • TABLE 158 REST OF LATIN AMERICA: BUNION SURGERY MARKET, BY PRODUCT, 2022–2029 (USD MILLION)
  • TABLE 159 REST OF LATIN AMERICA: BUNION SURGERY MARKET, BY PATIENT TYPE, 2022–2029 (USD MILLION)
  • TABLE 160 REST OF LATIN AMERICA: BUNION TYPE MARKET, BY TYPE, 2022–2029 (USD MILLION)
  • TABLE 161 REST OF LATIN AMERICA: BUNION SURGERY MARKET, BY END USER, 2022–2029 (USD MILLION)
  • TABLE 162 MIDDLE EAST & AFRICA: BUNION SURGERY MARKET, BY PRODUCT, 2022–2029 (USD MILLION)
  • TABLE 163 MIDDLE EAST & AFRICA: BUNION SURGERY MARKET, BY PATIENT TYPE, 2022–2029 (USD MILLION)
  • TABLE 164 MIDDLE EAST & AFRICA: BUNION SURGERY MARKET, BY TYPE, 2022–2029 (USD MILLION)
  • TABLE 165 MIDDLE EAST & AFRICA: BUNION SURGERY MARKET, BY END USER, 2022–2029 (USD MILLION)
  • TABLE 166 MIDDLE EAST & AFRICA: MACROECONOMIC INDICATORS
  • TABLE 167 GCC COUNTRIES: BUNION SURGERY MARKET, BY PRODUCT, 2022–2029 (USD MILLION)
  • TABLE 168 GCC COUNTRIES: BUNION SURGERY MARKET, BY PATIENT TYPE, 2022–2029 (USD MILLION)
  • TABLE 169 GCC COUNTRIES: BUNION SURGERY MARKET, BY TYPE, 2022–2029 (USD MILLION)
  • TABLE 170 GCC COUNTRIES: BUNION SURGERY MARKET, BY END USER, 2022–2029 (USD MILLION)
  • TABLE 171 GCC COUNTRIES: MACROECONOMIC INDICATORS
  • TABLE 172 OVERVIEW OF STRATEGIES ADOPTED BY KEY PLAYERS IN BUNION SURGERY MARKET, 2021–2024
  • TABLE 173 BUNION SURGERY MARKET: DEGREE OF COMPETITION
  • TABLE 174 BUNION SURGERY MARKET: REGION FOOTPRINT
  • TABLE 175 BUNION SURGERY MARKET: PRODUCT FOOTPRINT
  • TABLE 176 BUNION SURGERY MARKET: PATIENT TYPE FOOTPRINT
  • TABLE 177 BUNION SURGERY MARKET: TYPE FOOTPRINT
  • TABLE 178 BUNION SURGERY MARKET: DETAILED LIST OF KEY STARTUPS/SMES
  • TABLE 179 BUNION SURGERY MARKET: COMPETITIVE BENCHMARKING OF STARTUPS/SMES
  • TABLE 180 BUNION SURGERY MARKET: PRODUCT LAUNCHES, JANUARY 2021–NOVEMBER 2024
  • TABLE 181 BUNION SURGERY MARKET: DEALS, JANUARY 2021–NOVEMBER 2024
  • TABLE 182 STRYKER: COMPANY OVERVIEW
  • TABLE 183 STRYKER: PRODUCTS OFFERED
  • TABLE 184 STRYKER: PRODUCT LAUNCHES, JANUARY 2021–NOVEMBER 2024
  • TABLE 185 STRYKER: DEALS, JANUARY 2021–NOVEMBER 2024
  • TABLE 186 STRYKER: EXPANSIONS, JANUARY 2021–NOVEMBER 2024
  • TABLE 187 STRYKER: OTHER DEVELOPMENTS, JANUARY 2021–NOVEMBER 2024
  • TABLE 188 ZIMMER BIOMET: COMPANY OVERVIEW
  • TABLE 189 ZIMMER BIOMET: PRODUCTS OFFERED
  • TABLE 190 ZIMMER BIOMET: DEALS, JANUARY 2021–NOVEMBER 2024
  • TABLE 191 JOHNSON & JOHNSON SERVICES, INC.: COMPANY OVERVIEW
  • TABLE 192 JOHNSON & JOHNSON SERVICES, INC.: PRODUCTS OFFERED
  • TABLE 193 JOHNSON & JOHNSON SERVICES, INC.: PRODUCT LAUNCHES, JANUARY 2021–NOVEMBER 2024
  • TABLE 194 JOHNSON & JOHNSON: DEALS, JANUARY 2021–NOVEMBER 2024
  • TABLE 195 SMITH+NEPHEW: COMPANY OVERVIEW
  • TABLE 196 SMITH+NEPHEW: PRODUCTS OFFERED
  • TABLE 197 SMITH+NEPHEW: DEALS, JANUARY 2021–NOVEMBER 2024
  • TABLE 198 ENOVIS CORPORATION: COMPANY OVERVIEW
  • TABLE 199 ENOVIS CORPORATION: PRODUCTS OFFERED
  • TABLE 200 ENOVIS CORPORATION: DEALS, JANUARY 2021–NOVEMBER 2024
  • TABLE 201 ENOVIS CORPORATION: EXPANSIONS, JANUARY 2021–NOVEMBER 2024
  • TABLE 202 PARAGON 28, INC.: COMPANY OVERVIEW
  • TABLE 203 PARAGON 28, INC.: PRODUCTS OFFERED
  • TABLE 204 PARAGON 28, INC.: PRODUCT LAUNCHES, JANUARY 2021–NOVEMBER 2024
  • TABLE 205 PARAGON 28, INC.: DEALS, JANUARY 2021–NOVEMBER 2024
  • TABLE 206 TREACE MEDICAL CONCEPTS, INC.: COMPANY OVERVIEW
  • TABLE 207 TREACE MEDICAL CONCEPTS, INC.: PRODUCTS OFFERED
  • TABLE 208 TREACE MEDICAL CONCEPTS, INC.: PRODUCT LAUNCHES, JANUARY 2021–NOVEMBER 2024
  • TABLE 209 TREACE MEDICAL CONCEPTS, INC.: DEALS, JANUARY 2021–NOVEMBER 2024
  • TABLE 210 TREACE MEDICAL CONCEPTS, INC.: OTHER DEVELOPMENTS, JANUARY 2021–NOVEMBER 2024
  • TABLE 211 CONMED CORPORATION: COMPANY OVERVIEW
  • TABLE 212 CONMED CORPORATION: PRODUCTS OFFERED
  • TABLE 213 MEDARTIS AG: COMPANY OVERVIEW
  • TABLE 214 MEDARTIS AG: PRODUCTS OFFERED
  • TABLE 215 MEDARTIS AG: PRODUCT LAUNCHES, JANUARY 2021–NOVEMBER 2024
  • TABLE 216 MEDARTIS AG: DEALS, JANUARY 2021–NOVEMBER 2024
  • TABLE 217 DOUBLE MEDICAL TECHNOLOGY INC.: COMPANY OVERVIEW
  • TABLE 218 DOUBLE MEDICAL TECHNOLOGY INC.: PRODUCTS OFFERED
  • TABLE 219 ARTHREX, INC.: COMPANY OVERVIEW
  • TABLE 220 ARTHREX, INC.: PRODUCTS OFFERED
  • TABLE 221 ARTHREX, INC.: PRODUCT LAUNCHES, JANUARY 2021–NOVEMBER 2024
  • TABLE 222 ACUMED LLC: COMPANY OVERVIEW
  • TABLE 223 ACUMED LLC: PRODUCTS OFFERED
  • TABLE 224 ACUMED LLC: EXPANSIONS, JANUARY 2021–NOVEMBER 2024
  • TABLE 225 MERETE GMBH: COMPANY OVERVIEW
  • TABLE 226 MERETE GMBH: PRODUCTS OFFERED
  • TABLE 227 VOOM MEDICAL DEVICES: COMPANY OVERVIEW
  • TABLE 228 VOOM MEDICAL DEVICES: PRODUCTS OFFERED
  • TABLE 229 BIOPRO, INC.: COMPANY OVERVIEW
  • TABLE 230 BIOPRO, INC.: PRODUCTS OFFERED
  • TABLE 231 DIETER MARQUARDT MEDIZINTECHNIK GMBH: COMPANY OVERVIEW
  • TABLE 232 EXTREMITY MEDICAL: COMPANY OVERVIEW
  • TABLE 233 ASTROLABE: COMPANY OVERVIEW
  • TABLE 234 INVAMED: COMPANY OVERVIEW
  • TABLE 235 ORTIMPLANT ORTHOPAEDICS & MEDICAL DEVICES: COMPANY OVERVIEW
  • TABLE 236 AUXEIN: COMPANY OVERVIEW
  • TABLE 237 EXACTECH, INC.: COMPANY OVERVIEW
  • TABLE 238 JEIL MEDICAL CORPORATION: COMPANY OVERVIEW
  • TABLE 239 AYSAM ORTHOPAEDICS & MEDICAL DEVICES: COMPANY OVERVIEW
  • TABLE 240 DEVA TIBBI MALZEMELER: COMPANY OVERVIEW
LIST OF FIGURES
 
  • FIGURE 1 BUNION SURGERY MARKETS COVERED AND REGIONAL SCOPE
  • FIGURE 2 BUNION SURGERY MARKET: RESEARCH DESIGN METHODOLOGY
  • FIGURE 3 BREAKDOWN OF PRIMARY INTERVIEWS: SUPPLY- AND DEMAND-SIDE PARTICIPANTS
  • FIGURE 4 BREAKDOWN OF PRIMARY INTERVIEWS: BY COMPANY TYPE, DESIGNATION, AND REGION
  • FIGURE 5 BOTTOM-UP APPROACH: COMPANY REVENUE ESTIMATION APPROACH
  • FIGURE 6 CAGR PROJECTIONS: SUPPLY-SIDE ANALYSIS
  • FIGURE 7 BUNION SURGERY MARKET: TOP-DOWN APPROACH
  • FIGURE 8 DATA TRIANGULATION METHODOLOGY
  • FIGURE 9 BUNION SURGERY MARKET, BY PRODUCT, 2024 VS. 2029 (USD MILLION)
  • FIGURE 10 BUNION SURGERY MARKET, BY PATIENT TYPE, 2024 VS. 2029 (USD MILLION)
  • FIGURE 11 BUNION SURGERY MARKET, BY TYPE, 2024 VS. 2029 (USD MILLION)
  • FIGURE 12 BUNION SURGERY MARKET, BY END USER, 2024 VS. 2029 (USD MILLION)
  • FIGURE 13 BUNION SURGERY MARKET, BY REGION, 2024 VS. 2029 (USD MILLION)
  • FIGURE 14 INCREASING NUMBER OF BUNION SURGERIES TO DRIVE MARKET
  • FIGURE 15 INTERNAL DEVICES SEGMENT TO LEAD MARKET DURING FORECAST PERIOD
  • FIGURE 16 ADULT PATIENTS SEGMENT TO DOMINATE MARKET IN 2029
  • FIGURE 17 TRADITIONAL SURGERIES SEGMENT TO HAVE LARGEST MARKET SHARE DURING FORECAST PERIOD
  • FIGURE 18 HOSPITALS SEGMENT TO COMMAND LARGEST MARKET SHARE DURING FORECAST PERIOD
  • FIGURE 19 ASIA PACIFIC TO REGISTER HIGHEST GROWTH RATE DURING FORECAST PERIOD
  • FIGURE 20 BUNION SURGERY MARKET: DRIVERS, RESTRAINTS, OPPORTUNITIES, AND CHALLENGES
  • FIGURE 21 NEW REVENUE POCKETS FOR PLAYERS IN BUNION SURGERY MARKET
  • FIGURE 22 BUNION SURGERY MARKET: VALUE CHAIN ANALYSIS
  • FIGURE 23 BUNION SURGERY MARKET: SUPPLY CHAIN ANALYSIS
  • FIGURE 24 BUNION SURGERY MARKET: ECOSYSTEM ANALYSIS
  • FIGURE 25 INVESTMENT AND FUNDING SCENARIO, 2018–2024
  • FIGURE 26 BUNION SURGERY MARKET: PATENT ANALYSIS, JANUARY 2014–DECEMBER 2024
  • FIGURE 27 BUNION SURGERY MARKET: PORTER’S FIVE FORCES ANALYSIS
  • FIGURE 28 INFLUENCE OF STAKEHOLDERS ON BUYING PROCESS, BY PRODUCT
  • FIGURE 29 BUYING CRITERIA, BY PRODUCT
  • FIGURE 30 MARKET POTENTIAL OF AI IN BUNION SURGERY MARKET
  • FIGURE 31 NORTH AMERICA: BUNION SURGERY MARKET SNAPSHOT
  • FIGURE 32 ASIA PACIFIC: BUNION SURGERY MARKET SNAPSHOT
  • FIGURE 33 REVENUE ANALYSIS OF KEY PLAYERS IN BUNION SURGERY MARKET, 2021–2023
  • FIGURE 34 BUNION SURGERY MARKET SHARE ANALYSIS OF KEY PLAYERS, 2023
  • FIGURE 35 EV/EBITDA OF KEY VENDORS, 2024
  • FIGURE 36 YEAR-TO-DATE (YTD) PRICE TOTAL RETURN AND 5-YEAR STOCK BETA OF KEY VENDORS, 2024
  • FIGURE 37 BUNION SURGERY MARKET: BRAND/PRODUCT COMPARISON
  • FIGURE 38 BUNION SURGERY MARKET: COMPANY EVALUATION MATRIX (KEY PLAYERS), 2023
  • FIGURE 39 BUNION SURGERY MARKET: COMPANY FOOTPRINT
  • FIGURE 40 BUNION SURGERY MARKET: COMPANY EVALUATION MATRIX (STARTUPS/SMES), 2023
  • FIGURE 41 STRYKER: COMPANY SNAPSHOT (2023)
  • FIGURE 42 ZIMMER BIOMET: COMPANY SNAPSHOT (2023)
  • FIGURE 43 JOHNSON & JOHNSON SERVICES, INC.: COMPANY SNAPSHOT (2023)
  • FIGURE 44 SMITH+NEPHEW: COMPANY SNAPSHOT (2023)
  • FIGURE 45 ENOVIS CORPORATION: COMPANY SNAPSHOT (2023)
  • FIGURE 46 PARAGON 28, INC.: COMPANY SNAPSHOT (2023)
  • FIGURE 47 TREACE MEDICAL CONCEPTS, INC.: COMPANY SNAPSHOT (2023)
  • FIGURE 48 CONMED CORPORATION: COMPANY SNAPSHOT (2023)
  • FIGURE 49 MEDARTIS AG: COMPANY SNAPSHOT (2023)

The study involved major activities in estimating the current market size for the bunion surgery market. Exhaustive secondary research was done to collect information on the bunion surgery industry. The next step was to validate these findings, assumptions, and sizing with industry experts across the value chain using primary research. Different approaches, such as top-down and bottom-up, were employed to estimate the total market size. After that, the market breakup and data triangulation procedures were used to estimate the market size of the segments and subsegments of the bunion surgery market.

The four steps involved in estimating the market size are

Secondary Research

In the secondary research process, various secondary sources such as annual reports, press releases & investor presentations of companies, white papers, certified publications, articles by recognized authors, gold-standard & silver-standard websites, regulatory bodies, and databases (such as D&B Hoovers, Bloomberg Business, and Factiva) were referred to identify and collect information for this study.

Primary Research

In the primary research process, various sources from both the supply and demand sides were interviewed to obtain qualitative and quantitative information for this report. Primary sources were mainly industry experts from the core and related industries and preferred suppliers, manufacturers, distributors, service providers, orthopedic surgeons, and organizations related to all segments of this industry’s value chain. In-depth interviews were conducted with various primary respondents, including key industry participants, subject-matter experts, C-level executives of key market players, and industry consultants, to obtain and verify critical qualitative and quantitative information as well as assess prospects.

The following is a breakdown of the primary respondents:
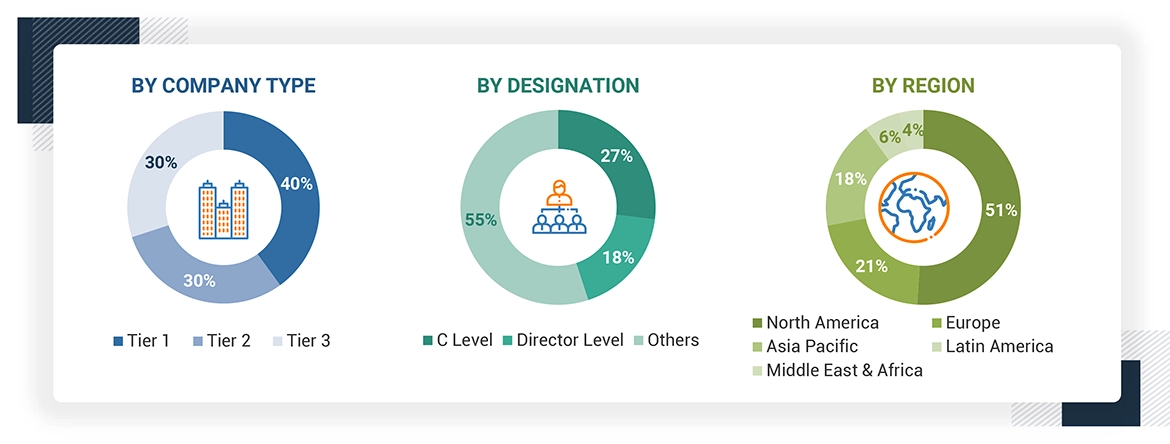
Bunion Surgery Market

Note 1: Others include sales managers, marketing managers, and product managers.

Note 2: Companies are classified into tiers based on their total revenues. As of 2023, Tier 1 = >USD 100 million, Tier 2 = USD 10 million to USD 100 million, and Tier 3 = < USD 10 million.

COMPANY NAME DESIGNATION
Zimmer Biomet Sales Executive
Johnson & Johnson Services, Inc. Sales Executive

To know about the assumptions considered for the study, download the pdf brochure

Market Size Estimation

Both top-down and bottom-up approaches were used to estimate and validate the bunion surgery market's total size. These methods were also used extensively to estimate the size of various subsegments in the market. The research methodology used to estimate the market size includes the following:

  • The key players in the industry have been identified through extensive secondary research
  • The revenues generated by leading players operating in the bunion surgery market have been determined through primary and secondary research.
  • All percentage shares, splits, and breakdowns have been determined using secondary sources and verified through primary sources.

The research methodology used to estimate the market size includes the following:

Bunion Surgery Market

Data Triangulation

After arriving at the overall market size by applying the process mentioned above, the total market was split into several segments. To complete the overall market engineering process and arrive at the exact statistics for all segments and subsegments, data triangulation and market breakdown procedures were employed, wherever applicable. The data was triangulated by studying various factors and trends from both the demand and supply sides.

Market Definition

Bunion surgery is performed to relieve pain and correct the deformity caused by a bunion. A bunion (hallux valgus) is a deformity of the bone or tissue around the joint at the base of the toe.

Stakeholders

  • Senior Management
  • End User
  • Finance/Procurement Department  
  • R&D Department

Report Objectives

  • To define, describe, segment, and forecast the global bunion surgery market, by product, patient type, type, end user, and region
  • To provide detailed information regarding the major factors influencing the market growth (such as drivers, restraints, opportunities, and challenges)
  • To analyze the micromarkets1 with respect to individual growth trends, prospects, and contributions to the overall bunion surgery market
  • To analyze market opportunities for stakeholders and provide details of the competitive landscape for key players
  • To forecast the size of the market segments with respect to six regions, namely, North America, Europe, the Asia Pacific, Middle East & Africa, Latin America, and GCC Countries
  • To profile the key players and comprehensively analyze their product portfolios, market positions, and core competencies
  • To track and analyze company developments such as product launches & approvals, partnerships, acquisitions, agreements, and other developments
  • To benchmark players within the market using the proprietary Competitive Leadership Mapping framework, which analyzes market players on various parameters within the broad categories of business and product excellence


Previous Versions of this Report

"Our USP is "providing game-changing business opportunities reports with free customization" - so please feel free to provide us with your specific areas of interest / business challenges in much greater detail !!"

We appreciate your interest in this report. Once you fill out the form, you'll be immediately directed to an exclusive solution tailored to your needs. This high-value offering can help boost your revenue by 30% - a must-see opportunity for anyone looking to maximize growth.


By clicking the "Submit" button, you are agreeing to the Terms of Use and Privacy Policy.

Custom Market Research Services

We Will Customise The Research For You, In Case The Report Listed Above Does Not Meet With Your Requirements

Get 10% Free Customisation

Growth opportunities and latent adjacency in Bunion Surgery Market

DMCA.com Protection Status