Building Twin Market

Building Twin Market by Offering (Software Solutions, Services), Application (Facility Management, Predictive Maintenance, Safety & Security Management, Energy Management), End User (Commercial, Industrial) and Region - Global Forecast to 2029

Report Code: SE 9084 Jul, 2024, by marketsandmarkets.com

[231 Pages Report] The global building twin market size is projected to grow from USD 2.1 billion in 2024 to USD 13.3 billion by 2029 at a CAGR of 44.7% during the forecast period. The growth of the building twin market is driven by the growing focus on predictive maintenance and government initiatives for digitization. In addition, advancements in AI & ML powered prediction and growing preference towards smart cities generate opportunities within the building twin market.

Building Twin Market

Building Twin Market

Building Twin Market Forecast to 2029

To know about the assumptions considered for the study, Request for Free Sample Report

Building Twin Market Dynamics

Driver: Growing focus on predictive maintenance

The increasing emphasis on predictive maintenance serves as a pivotal driver for the building twin. market, revolutionizing how buildings are managed and maintained. Traditionally, building. Maintenance relied on reactive repairs, addressing issues only after they occurred. This reactive. approach is not only costly but also disrupts building operations. Predictive maintenance offers.a. paradigm shift by aiming to anticipate equipment failures before they happen. Predictive. maintenance. leverages advanced technologies such as IoT sensors, data analytics, and artificial. intelligence-to-monitor the performance-of-building-systems-and-equipment-in-real-time. By-creating. a-building-twin, organizations-can-simulate-and-predict maintenance-needs-accurately. This proactive. the approach allows facility managers to anticipate equipment failures before they occur. minimizing downtime, reducing repair costs, and optimizing operational efficiency. Building-twins-enable. continuous monitoring and analysis of critical parameters such as energy usage, environmental conditions, and equipment performance. Insights derived from these digital replicas empower decision-makers to. implement preventive measures, schedule maintenance activities more efficiently, and allocate. resources-effectively.

Restraint: Susceptibility of building twin technology to cyberattacks

Adopting digital technologies, such as cloud computing, big data, the Internet of Things (IoT), and artificial intelligence, is becoming increasingly prevalent across various business domains. Digital twin technology integrates IoT sensors and other digital tools to create virtual replicas of physical assets. This interconnectedness creates vulnerabilities that malicious actors could exploit, potentially leading to serious consequences. A successful cyberattack on a building twin could disrupt critical building operations. Hackers might gain control of building systems, manipulating temperature controls, lighting, or even security measures. Furthermore, the data collected by building twins is often sensitive, containing information on occupant behavior, energy use patterns, and security protocols. A data breach could compromise this sensitive information, posing substantial privacy and security risks.

Opportunity: Advancements in AI & ML powered predictions

The rapid advancements in artificial intelligence (AI) and machine learning (ML) are creating significant opportunities for the building twin market. Al and ML technologies enhance the capabilities of building twins by enabling more accurate and sophisticated predictive analytics. These technologies allow building twins to analyze vast amounts of data from various sensors and systems in real time, identifying patterns and anomalies that would be impossible for humans to detect. This predictive capability can forecast equipment failures, optimize energy usage, and improve maintenance schedules, leading to increased efficiency and reduced operational costs. For instance, Al-driven predictive maintenance can anticipate when a piece of equipment is likely to fail, allowing for pre-emptive repairs that prevent downtime and extend the lifespan of building systems. Moreover, ML algorithms can continually learn and adapt from new data, refining their predictions and making building operations progressively more efficient. This dynamic adaptability makes Al and ML indispensable tools in maximizing the potential of building twin technology, driving the market forward by offering enhanced performance, cost savings, and sustainability benefits.

Challenge: Complexities associated with integrating large amounts of data

The key challenge facing the building twin industry is effectively managing the large volumes of data generated by these systems. Building twins rely on continuous data from numerous sensors and devices throughout buildings, measuring things like temperature, humidity, energy use, occupancy, and equipment performance. Managing and integrating this data is complex due to its sheer quantity and variety. It requires strong systems for processing and storing data. Additionally, the data needs to be standardized and made consistent to ensure accuracy in building twin models. This often involves using advanced analytics and complex algorithms to analyze raw data and derive useful insights.

Building Twin Market Ecosystem

Building Twin Market by Ecosystem

Facility Management Segment to hold the largest share of the building twin market during 2024–2029.

The facility management application is expected to account for the largest size of the building twin market during the forecast period. The segment's leadership is driven by its critical role in optimizing building performance and efficiency. It enables real-time monitoring, and proactive management of building systems, utilizing advanced data analytics and IoT technologies. This approach reduces operational costs, prolongs the lifespan of building assets, and enhances overall operational effectiveness. Moreover, businesses increasingly adopt building twins to streamline maintenance workflows, ensure compliance with regulations, and improve occupant comfort and safety. As a result, the facility management segment is becoming pivotal in advancing modern building management practices.

Software Solutions segment to dominate the market during the forecast period.

The software solutions segment to hold the largest size of the building twin market during the forecast period. The growth is fueled by advancements in cloud computing, IoT, and artificial intelligence, which greatly enhance how building twin technologies operate. These software solutions enable real-time data analysis, predictive maintenance, and effective building operations management, all essential for boosting efficiency and reducing costs. The increasing adoption of digital transformation and smart building technologies further drives this trend. Platform-as-a-Service (PaaS) and Software-as-a-Service (SaaS) models provide scalability, flexibility, and cost-effectiveness, allowing organizations to efficiently handle building data, optimize resource use, and achieve sustainability goals. This shift highlights the pivotal role of software solutions in innovating modern building management practices.

Commercial end user industry to dominate the market during the forecast period.

The Commercial end user industry is expected to account for the largest share of the building twin market during the forecast period. It is expected to grow at a significant CAGR from 2024 to 2029. Commercial entities, including office buildings, hospitals, and hotels, are increasingly adopting building twin technologies to enhance operational efficiency, reduce costs, and improve sustainability efforts. Building twins offer significant advantages, such as real-time monitoring, predictive maintenance, and optimized space utilization. These advantages are particularly valuable for commercial settings that streamline operations and enhance tenant experiences. Moreover, compliance with regulatory standards and the growing focus on environmental sustainability further propel the adoption of building twins in commercial properties. The integration of IoT and AI technologies enables commercial enterprises to leverage advanced analytics and automation, thereby improving decision-making processes and operational outcomes. This capability is crucial for maintaining competitive advantage and meeting evolving customer expectations in the commercial real estate sector.

The Building Twin market in North America is expected to maintain the highest share during 2024–2029

North America is expected to hold the largest share of the building twin market throughout the forecast period. The region has embraced advanced technologies like IoT, AI, and cloud computing, which are crucial for building twin solutions. These technologies are supported by a strong infrastructure and a dynamic ecosystem of leading technology companies constantly innovating in building management. Additionally, North America's culture of innovation, with support from major tech firms and top academic institutions, drives ongoing advancements in building twin technologies. This includes enhancements in real-time monitoring, predictive maintenance, and advanced data analytics, which are essential for modern building management practices. Moreover, the region's diverse industry landscape across commercial and industrial provides tailored building twin solutions that cater to specific market needs. This diversity fuels market growth and adoption across various applications, cementing North America's global leadership in the building twin market.

Building Twin Market by Region

Building Twin Market by Region

To know about the assumptions considered for the study, download the pdf brochure

Key Market Players

The building twin companies have implemented various types of organic and inorganic growth strategies, such as product launches, product developments, partnerships, and collaborations, to strengthen their offerings in the market. The major players are Microsoft (US), Siemens (Germany), Amazon (AWS) (US), Dassault Systèmes (France), Robert Bosch GmbH (Germany), ANSYS, Inc (US), IBM (US), Autodesk Inc. (US), SAP (Germany), Oracle (US), and Bentley Systems, Incorporated (US). The study includes an in-depth competitive analysis of these key players in the building twin market with their company profiles, recent developments, and key market strategies.

Get online access to the report on the World's First Market Intelligence Cloud

  • Easy to Download Historical Data & Forecast Numbers
  • Company Analysis Dashboard for high growth potential opportunities
  • Research Analyst Access for customization & queries
  • Competitor Analysis with Interactive dashboard
  • Latest News, Updates & Trend analysis
Request Sample

Scope of the Report

Report Metric

Details

Market size available for years

2020—2029

Base year

2023

Forecast period

2024—2029

Units

Value (USD Million/Billion)

Segments Covered

Offering, Application, End User, and Region

Geographic regions covered

North America, Europe, Asia Pacific, and Rest of the World

Companies covered

Key players in the building twin market are Microsoft (US), Siemens (Germany), Amazon (US), Dassault Systèmes (France), Robert Bosch GmbH (Germany), ANSYS, Inc (US), IBM (US), Autodesk Inc. (US), SAP (Germany), Oracle (US), and Bentley Systems, Incorporated (US) —a total of 25 companies.

Building Twin Market Highlights

This report categorizes the building twin market based on offering, application, end user, and region.

Segment

Subsegment

By Offering:

  • Software Solutions
  • Services

By Application:

  • Design & Construction
  • Facility Management
  • Predictive Maintenance
  • Safety & Security Management
  • Energy Management
  • Other Applications

By End User:

  • Commercial
  • Industrial

By Region:

  • North America
    • US
    • Canada
    • Mexico
  • Europe
    • Germany
    • UK
    • France
    • Rest of Europe
  • Asia Pacific
    • China
    • Japan
    • India
    • South Korea
    • Rest of Asia Pacific
  • Rest of the World
    • Middle East
    • Africa
    • South America

Recent Developments

  • In April 2024, Siemens Smart Infrastructure has introduced Electrification X to change aging electrification infrastructure. As the latest addition to the Siemens Xcelerator portfolio, Electrification X builds upon the success of Building X and Gridscale X. This continuously evolving, dynamic, open, and interoperable portfolio facilitates seamless digital transformation of electrification infrastructure across commercial, industrial, and utility applications. By leveraging Electrification X, customers can access a range of IoT SaaS offerings and software solutions designed to enhance energy efficiency, enable e-mobility, and optimize industrial energy systems.
  • In April 2024, Autodesk, Inc. announced an interoperability agreement with the Nemetschek Group aimed at enhancing open collaboration and efficiencies within the architecture, engineering, construction, and operations (AECO) and media and entertainment (M&E) industries. This optimization of workflows will facilitate smoother data transfer across various cloud platforms and desktop applications, ensuring critical details reach the right people at the right time. Powered by Autodesk Platform Services (APS)—a suite of open APIs and web services—this interoperability enables Nemetschek's dTwin, Bluebeam Cloud, BIMcloud, and BIMplus to connect seamlessly with Autodesk's industry clouds, including Forma, Fusion, Flow, and design solutions.
  • In January 2023, Dassault Systèmes and IBM signed a memorandum of understanding to extend their collaboration, combining Dassault Systèmes’ 3DEXPERIENCE platform and virtual twin technology with IBM’s solutions for asset management, resource optimization, environmental risk management, and ESG governance. They will focus on developing joint offerings for owners and operators of water and energy distribution, energy transmission projects, wind farms, airports, and datacenter-focused IT infrastructure projects

Critical Questions: FAQs:

To speak to our analyst for a discussion on the above findings, click Speak to Analyst

TABLE OF CONTENTS
 
1 INTRODUCTION (Page No. - 22)
    1.1 STUDY OBJECTIVES 
    1.2 MARKET DEFINITION 
    1.3 STUDY SCOPE 
           1.3.1 MARKETS COVERED
           1.3.2 INCLUSIONS AND EXCLUSIONS
           1.3.3 YEARS CONSIDERED
    1.4 CURRENCY CONSIDERED 
    1.5 LIMITATIONS 
    1.6 STAKEHOLDERS 
    1.7 RECESSION IMPACT 
 
2 RESEARCH METHODOLOGY (Page No. - 26)
    2.1 RESEARCH DATA 
           2.1.1 SECONDARY AND PRIMARY RESEARCH
           2.1.2 SECONDARY DATA
                    2.1.2.1 List of key secondary sources
                    2.1.2.2 Key data from secondary sources
           2.1.3 PRIMARY DATA
                    2.1.3.1 Intended participants and key opinion leaders in primary interviews
                    2.1.3.2 Key data from primary sources
                    2.1.3.3 Key industry insights
                    2.1.3.4 Breakdown of primaries
    2.2 MARKET SIZE ESTIMATION 
           2.2.1 BOTTOM-UP APPROACH
                    2.2.1.1 Approach to estimate market size using bottom-up analysis (demand side)
           2.2.2 TOP-DOWN APPROACH
                    2.2.2.1 Approach to estimate market size using top-down analysis (supply side)
    2.3 DATA TRIANGULATION 
    2.4 RESEARCH ASSUMPTIONS 
    2.5 PARAMETERS CONSIDERED TO ANALYZE IMPACT OF RECESSION ON BUILDING TWIN MARKET 
    2.6 RESEARCH LIMITATIONS 
    2.7 RISK ANALYSIS 
 
3 EXECUTIVE SUMMARY (Page No. - 38)
 
4 PREMIUM INSIGHTS (Page No. - 42)
    4.1 ATTRACTIVE OPPORTUNITIES FOR PLAYERS IN BUILDING TWIN MARKET 
    4.2 BUILDING TWIN MARKET, BY OFFERING 
    4.3 BUILDING TWIN MARKET, BY APPLICATION 
    4.4 BUILDING TWIN MARKET, BY END USER 
    4.5 BUILDING TWIN MARKET, BY COUNTRY 
 
5 MARKET OVERVIEW (Page No. - 45)
    5.1 INTRODUCTION 
    5.2 MARKET DYNAMICS 
           5.2.1 DRIVERS
                    5.2.1.1 Pressing need to mitigate environmental impact
                    5.2.1.2 Rising adoption of improved real-time data visualization tools in building operations
                    5.2.1.3 Rising focus on predictive maintenance to ensure safety and reliability of building operations
                    5.2.1.4 Government-led initiatives to boost digital infrastructure
           5.2.2 RESTRAINTS
                    5.2.2.1 High cost of establishing building twins
                    5.2.2.2 Susceptibility to cyberattacks
           5.2.3 OPPORTUNITIES
                    5.2.3.1 Integration of building twin technology with advanced sensors and IoT technologies
                    5.2.3.2 Emergence of AI- and ML-powered building twins
                    5.2.3.3 Growing initiatives to develop smart cities
           5.2.4 CHALLENGES
                    5.2.4.1 Complexities associated with integrating large amount of data
                    5.2.4.2 Lack of standardization in building twin technology
    5.3 TRENDS/DISRUPTIONS IMPACTING CUSTOMERS’ BUSINESSES 
    5.4 PRICING ANALYSIS 
           5.4.1 AVERAGE SELLING PRICE TREND OF BUILDING TWIN SOLUTIONS, BY KEY PLAYER
    5.5 VALUE CHAIN ANALYSIS 
    5.6 ECOSYSTEM ANALYSIS 
    5.7 INVESTMENT AND FUNDING SCENARIO 
    5.8 TECHNOLOGY ANALYSIS 
           5.8.1 KEY TECHNOLOGIES
                    5.8.1.1 IoT and IIoT
                    5.8.1.2 Building information modeling
                    5.8.1.3 3D modeling
           5.8.2 COMPLIMENTARY TECHNOLOGIES
                    5.8.2.1 AI and ML
                    5.8.2.2 AR, VR, and MR
                    5.8.2.3 Cloud computing and edge computing
           5.8.3 ADJACENT TECHNOLOGIES
                    5.8.3.1 Blockchain
                    5.8.3.2 5G
    5.9 PATENT ANALYSIS 
    5.10TRADE ANALYSIS 
           5.10.1 IMPORT DATA (HS CODE 851769)
           5.10.2 EXPORT DATA (HS CODE 851769)
    5.11 KEY CONFERENCES AND EVENTS, 2023–2024 
    5.12 CASE STUDY ANALYSIS 
           5.12.1 TEMPLE UNIVERSITY DEVELOPED DIGITAL TWIN ECOSYSTEM WITH AZURE IOT TO OPTIMIZE OPERATIONS
           5.12.2 AWS PROVIDED JOHN HOLLAND WITH AWS IOT TWINMAKER TO ENHANCE ASSET DEVELOPMENT AND MANAGEMENT
           5.12.3 UNITY HELPED ORLANDO WITH 3D DIGITAL TWIN FOR URBAN PLANNING THROUGH REAL-TIME VISUALIZATION AND SCENARIO TESTING
           5.12.4 SINGAPORE LAND AUTHORITY IMPLEMENTED DIGITAL TWIN FOR EFFECTIVE URBAN PLANNING AND TRANSPORTATION MANAGEMENT
    5.13 REGULATORY LANDSCAPE 
           5.13.1 REGULATORY BODIES, GOVERNMENT AGENCIES, AND OTHER ORGANIZATIONS
           5.13.2 STANDARDS
    5.14 PORTER’S FIVE FORCES ANALYSIS 
           5.14.1 THREAT OF NEW ENTRANTS
           5.14.2 THREAT OF SUBSTITUTES
           5.14.3 BARGAINING POWER OF BUYERS
           5.14.4 BARGAINING POWER OF SUPPLIERS
           5.14.5 INTENSITY OF COMPETITIVE RIVALRY
    5.15 KEY STAKEHOLDERS AND BUYING CRITERIA 
           5.15.1 KEY STAKEHOLDERS IN BUYING PROCESS
           5.15.2 BUYING CRITERIA
 
6 TYPES OF BUILDING TWINS (Page No. - 85)
    6.1 INTRODUCTION 
    6.2 DESCRIPTIVE TWINS 
    6.3 INFORMATIVE TWINS 
    6.4 PREDICTIVE TWINS 
    6.5 COMPREHENSIVE TWINS 
    6.6 AUTONOMOUS TWINS 
 
7 BUILDING TWIN MARKET, BY OFFERING (Page No. - 88)
    7.1 INTRODUCTION 
    7.2 SOFTWARE SOLUTIONS 
           7.2.1 INTEGRATION OF REAL-TIME SENSOR DATA AND STATIC INFORMATION TO OFFER LUCRATIVE GROWTH OPPORTUNITIES
           7.2.2 PLATFORM AS A SERVICE (PAAS)
           7.2.3 SOFTWARE AS A SERVICE (SAAS)
    7.3 SERVICES 
           7.3.1 INCREASING COMPLEXITIES OF MODERN BUILDING PROJECTS TO BOOST DEMAND
 
8 BUILDING TWIN MARKET, BY APPLICATION (Page No. - 94)
    8.1 INTRODUCTION 
    8.2 BY APPLICATION 
           8.2.1 FACILITY MANAGEMENT
                    8.2.1.1 Rising trend of smart buildings to boost adoption
           8.2.2 PREDICTIVE MAINTENANCE
                    8.2.2.1 Ability to monitor equipment performance and detect failures to accelerate demand
           8.2.3 ENERGY MANAGEMENT
                    8.2.3.1 Integration of renewable energy sources to offer lucrative growth opportunities
           8.2.4 SAFETY & SECURITY MANAGEMENT
                    8.2.4.1 Increasing need to monitor security breaches to spur demand
           8.2.5 OTHERS
    8.3 DESIGN & CONSTRUCTION (QUALITATIVE) 
 
9 BUILDING TWIN MARKET, BY END USER (Page No. - 104)
    9.1 INTRODUCTION 
    9.2 COMMERCIAL 
           9.2.1 OFFICE BUILDINGS
                    9.2.1.1 Increasing demand for virtual tours and interactive maps to drive market
           9.2.2 RETAIL SPACE
                    9.2.2.1 Rising demand for innovative and data-driven solutions for operational efficiency to accelerate demand
           9.2.3 HOSPITALITY INDUSTRY
                    9.2.3.1 Growing emphasis on providing personalized guest experiences to spur demand
           9.2.4 HOSPITALS
                    9.2.4.1 Ability to simulate disaster scenarios for planning effective responses to foster segmental growth
           9.2.5 EDUCATIONAL INSTITUTIONS
                    9.2.5.1 Increasing demand for optimizing classroom layouts to boost adoption
           9.2.6 AIRPORT & TRANSPORTATION HUBS
                    9.2.6.1 Rising need to streamline airport operations to enhance passenger experiences to drive market
    9.3 INDUSTRIAL 
           9.3.1 GROWING NEED TO BOOST PRODUCTIVITY AND LOWER OPERATIONAL COSTS TO DRIVE MARKET
 
10 BUILDING TWIN MARKET, BY REGION (Page No. - 117)
     10.1 INTRODUCTION 
     10.2 NORTH AMERICA 
             10.2.1 IMPACT OF RECESSION ON BUILDING TWIN MARKET IN NORTH AMERICA
             10.2.2 US
                        10.2.2.1 Growing adoption of digital technology in infrastructure sector to drive market
             10.2.3 CANADA
                        10.2.3.1 Increasing adoption of green building practices to spur demand
             10.2.4 MEXICO
                        10.2.4.1 Government-led initiatives promoting digitalized infrastructure to create lucrative growth opportunities
     10.3 EUROPE 
             10.3.1 IMPACT OF RECESSION ON BUILDING TWIN MARKET IN EUROPE
             10.3.2 GERMANY
                        10.3.2.1 Increasing focus on crafting 3D model of nation to foster market growth
             10.3.3 FRANCE
                        10.3.3.1 Rising emphasis on modernizing industrial sector to drive market
             10.3.4 UK
 
             10.3.5 REST OF EUROPE
     10.4 ASIA PACIFIC 
             10.4.1 IMPACT OF RECESSION ON BUILDING TWIN MARKET IN ASIA PACIFIC
             10.4.2 CHINA
                        10.4.2.1 Increasing development of digital twin cities to boost demand
             10.4.3 JAPAN
                        10.4.3.1 Implementation of digital twin technology to enhance urban planning, disaster management, and customer engagement to drive market
             10.4.4 INDIA
                        10.4.4.1 Growing application of AI and 5G in infrastructure planning and designing to spur demand
             10.4.5 SOUTH KOREA
                        10.4.5.1 Rising focus on promoting R&D initiatives for IoT to drive market
             10.4.6 REST OF ASIA PACIFIC
     10.5 ROW 
             10.5.1 IMPACT OF RECESSION ON BUILDING TWIN MARKET IN ROW
             10.5.2 SOUTH AMERICA
                        10.5.2.1 Ongoing development of infrastructure and communication networks to foster market growth
             10.5.3 MIDDLE EAST
                        10.5.3.1 Growing partnerships among industry vendors and consultants to spur demand
                        10.5.3.2 GCC
                        10.5.3.3 Rest of Middle East
             10.5.4 AFRICA
                        10.5.4.1 Increasing demand for smart connectivity to boost adoption
 
11 COMPETITIVE LANDSCAPE (Page No. - 144)
     11.1 OVERVIEW 
     11.2 KEY PLAYER STRATEGIES/RIGHT TO WIN, 2022–2024 
     11.3 REVENUE ANALYSIS, 2019–2023 
     11.4 MARKET SHARE ANALYSIS, 2023 
     11.5 COMPANY VALUATION AND FINANCIAL METRICS 
     11.6 BRAND/PRODUCT COMPARISON 
     11.7 COMPANY EVALUATION MATRIX, 2023 
             11.7.1 STARS
             11.7.2 EMERGING LEADERS
             11.7.3 PERVASIVE PLAYERS
             11.7.4 PARTICIPANTS
             11.7.5 COMPANY FOOTPRINT: KEY PLAYERS, 2023
                        11.7.5.1 Company footprint
                        11.7.5.2 Offering footprint
                        11.7.5.3 End user footprint
                        11.7.5.4 Application footprint
                        11.7.5.5 Region footprint
     11.8 COMPANY EVALUATION MATRIX: STARTUPS/SMES, 2023 
             11.8.1 PROGRESSIVE COMPANIES
             11.8.2 RESPONSIVE COMPANIES
             11.8.3 DYNAMIC COMPANIES
             11.8.4 STARTING BLOCKS
             11.8.5 COMPETITIVE BENCHMARKING: STARTUPS/SMES, 2023
                        11.8.5.1 Detailed list of key startups/SMEs
                        11.8.5.2 Competitive benchmarking of key startups/SMEs
     11.9 COMPETITIVE SCENARIO AND TRENDS 
             11.9.1 PRODUCT LAUNCHES
             11.9.2 DEALS
             11.9.3 OTHERS
 
12 COMPANY PROFILES (Page No. - 167)
     12.1 KEY PLAYERS 
             12.1.1 SIEMENS
                        12.1.1.1 Business overview
                        12.1.1.2 Products/Solutions/Services offered
                        12.1.1.3 Recent developments
                                     12.1.1.3.1 Product launches/Developments
                                     12.1.1.3.2 Deals
                        12.1.1.4 MnM view
                                     12.1.1.4.1 Key strengths/Right to win
                                     12.1.1.4.2 Strategic choices
                                     12.1.1.4.3 Weaknesses/Competitive threats
             12.1.2 MICROSOFT
                        12.1.2.1 Business overview
                        12.1.2.2 Products/Solutions/Services offered
                        12.1.2.3 Recent developments
                                     12.1.2.3.1 Deals
                        12.1.2.4 MnM view
                                     12.1.2.4.1 Key strengths/Right to win
                                     12.1.2.4.2 Strategic choices
                                     12.1.2.4.3 Weaknesses/Competitive threats
             12.1.3 ROBERT BOSCH GMBH
                        12.1.3.1 Business overview
                        12.1.3.2 Products/Solutions/Services offered
                        12.1.3.3 Recent developments
                                     12.1.3.3.1 Product launches/Developments
                                     12.1.3.3.2 Deals
                        12.1.3.4 MnM view
                                     12.1.3.4.1 Key strengths/Right to win
                                     12.1.3.4.2 Strategic choices
                                     12.1.3.4.3 Weaknesses/Competitive threats
             12.1.4 DASSAULT SYSTÈMES
                        12.1.4.1 Business overview
                        12.1.4.2 Products/Solutions/Services offered
                        12.1.4.3 Recent developments
                                     12.1.4.3.1 Product launches/Developments
                                     12.1.4.3.2 Deals
                        12.1.4.4 MnM view
                                     12.1.4.4.1 Key strengths/Right to win
                                     12.1.4.4.2 Strategic choices
                                     12.1.4.4.3 Weaknesses/Competitive threats
             12.1.5 AMAZON WEB SERVICES, INC. (AWS)
                        12.1.5.1 Business overview
                        12.1.5.2 Products/Solutions/Services offered
                        12.1.5.3 Recent developments
                                     12.1.5.3.1 Product launches/Developments
                                     12.1.5.3.2 Deals
                        12.1.5.4 MnM view
                                     12.1.5.4.1 Key strengths/Right to win
                                     12.1.5.4.2 Strategic choices
                                     12.1.5.4.3 Weaknesses/Competitive threats
             12.1.6 AUTODESK INC.
                        12.1.6.1 Business overview
                        12.1.6.2 Products/Solutions/Services offered
                        12.1.6.3 Recent developments
                                     12.1.6.3.1 Product launches/Developments
                                     12.1.6.3.2 Deals
             12.1.7 IBM
                        12.1.7.1 Business overview
                        12.1.7.2 Products/Solutions/Services offered
                        12.1.7.3 Recent developments
                                     12.1.7.3.1 Deals
             12.1.8 ORACLE
                        12.1.8.1 Business overview
                        12.1.8.2 Products/Solutions/Services offered
                        12.1.8.3 Recent developments
                                     12.1.8.3.1 Product launches/Developments
                                     12.1.8.3.2 Deals
                                     12.1.8.3.3 Others
             12.1.9 ANSYS, INC.
                        12.1.9.1 Business overview
                        12.1.9.2 Products/Solutions/Services offered
                        12.1.9.3 Recent developments
                                     12.1.9.3.1 Product launches/Developments
                                     12.1.9.3.2 Deals
             12.1.10 SAP
                        12.1.10.1 Business overview
                        12.1.10.2 Products/Solutions/Services offered
                        12.1.10.3 Recent developments
                                     12.1.10.3.1 Deals
             12.1.11 BENTLEY SYSTEMS, INCORPORATED
                        12.1.11.1 Business overview
                        12.1.11.2 Products/Solutions/Services offered
                        12.1.11.3 Recent developments
                                     12.1.11.3.1 Deals
     12.2 OTHER KEY PLAYERS 
             12.2.1 MATTERPORT INC.
             12.2.2 TRIMBLE INC.
             12.2.3 ABB
             12.2.4 JOHNSON CONTROLS
             12.2.5 SCHNEIDER ELECTRIC
             12.2.6 ESRI
             12.2.7 NAVVIS
             12.2.8 NOVACENE IOT LTD.
             12.2.9 APRIORI
             12.2.10 SOFTWARE AG
             12.2.11 INTEGRATED ENVIRONMENTAL SOLUTIONS LIMITED
             12.2.12 TWINSITY GMBH
             12.2.13 TWINZO
             12.2.14 CITYZENITH
 
13 ADJACENT AND RELATED MARKETS (Page No. - 220)
     13.1 INTRODUCTION 
     13.2 DIGITAL TWIN MARKET, BY ENTERPRISE 
     13.3 LARGE ENTERPRISES 
             13.3.1 GROWING DEPLOYMENT OF BLOCKCHAIN TECHNOLOGY IN HEALTHCARE SECTOR TO DRIVE DEMAND
     13.4 SMALL & MEDIUM ENTERPRISES (SMES) 
             13.4.1 INCREASING DEMAND FOR SUBSCRIPTION-BASED DIGITAL TWIN SERVICES TO BOOST SEGMENTAL GROWTH
 
14 APPENDIX (Page No. - 225)
     14.1 INSIGHTS FROM INDUSTRY EXPERTS 
     14.2 DISCUSSION GUIDE 
     14.3 KNOWLEDGESTORE: MARKETSANDMARKETS’ SUBSCRIPTION PORTAL 
     14.4 CUSTOMIZATION OPTIONS 
     14.5 RELATED REPORTS 
     14.6 AUTHOR DETAILS 
 
LIST OF TABLES (189 TABLES)
 
TABLE 1 INDICATIVE PRICING TREND OF BUILDING TWIN PRODUCTS OFFERED BY KEY PLAYERS, 2019–2023 (USD)
TABLE 2 ROLES OF COMPANIES IN BUILDING TWIN MARKET ECOSYSTEM
TABLE 3 LIST OF APPLIED/GRANTED PATENTS RELATED TO BUILDING TWINS, 2023–2024
TABLE 4 BUILDING TWIN MARKET: LIST OF CONFERENCES AND EVENTS
TABLE 5 NORTH AMERICA: LIST OF REGULATORY BODIES, GOVERNMENT AGENCIES, AND OTHER ORGANIZATIONS
TABLE 6 EUROPE: LIST OF REGULATORY BODIES, GOVERNMENT AGENCIES, AND OTHER ORGANIZATIONS
TABLE 7 ASIA PACIFIC: LIST OF REGULATORY BODIES, GOVERNMENT AGENCIES, AND OTHER ORGANIZATIONS
TABLE 8 ROW: LIST OF REGULATORY BODIES, GOVERNMENT AGENCIES, AND OTHER ORGANIZATIONS
TABLE 9 GLOBAL STANDARDS RELATED TO BUILDING TWINS
TABLE 10 BUILDING TWIN MARKET: PORTER’S FIVE FORCES ANALYSIS
TABLE 11 INFLUENCE OF KEY STAKEHOLDERS ON BUYING PROCESS, BY END USER (%)
TABLE 12 KEY BUYING CRITERIA, BY END USER
TABLE 13 BUILDING TWIN MARKET, BY OFFERING, 2020–2023 (USD MILLION)
TABLE 14 BUILDING TWIN MARKET, BY OFFERING, 2024–2029 (USD MILLION)
TABLE 15 SOFTWARE SOLUTIONS: BUILDING TWIN MARKET, BY END USER, 2020–2023 (USD MILLION)
TABLE 16 SOFTWARE SOLUTIONS: BUILDING TWIN MARKET, BY END USER, 2024–2029 (USD MILLION)
TABLE 17 SOFTWARE SOLUTIONS: BUILDING TWIN MARKET, BY REGION, 2020–2023 (USD MILLION)
TABLE 18 SOFTWARE SOLUTIONS: BUILDING TWIN MARKET, BY REGION, 2024–2029 (USD MILLION)
TABLE 19 SERVICES: BUILDING TWIN MARKET, BY END USER, 2020–2023 (USD MILLION)
TABLE 20 SERVICES: BUILDING TWIN MARKET, BY END USER, 2024–2029 (USD MILLION)
TABLE 21 SERVICES: BUILDING TWIN MARKET, BY REGION, 2020–2023 (USD MILLION)
TABLE 22 SERVICES: BUILDING TWIN MARKET, BY REGION, 2024–2029 (USD MILLION)
TABLE 23 BUILDING TWIN MARKET, BY APPLICATION, 2020–2023 (USD MILLION)
TABLE 24 BUILDING TWIN MARKET, BY APPLICATION, 2024–2029 (USD MILLION)
TABLE 25 FACILITY MANAGEMENT: BUILDING TWIN MARKET, BY END USER, 2020–2023 (USD MILLION)
TABLE 26 FACILITY MANAGEMENT: BUILDING TWIN MARKET, BY END USER, 2024–2029 (USD MILLION)
TABLE 27 FACILITY MANAGEMENT: BUILDING TWIN MARKET, BY REGION, 2020–2023 (USD MILLION)
TABLE 28 FACILITY MANAGEMENT: BUILDING TWIN MARKET, BY REGION, 2024–2029 (USD MILLION)
TABLE 29 PREDICTIVE MAINTENANCE: BUILDING TWIN MARKET, BY END USER, 2020–2023 (USD MILLION)
TABLE 30 PREDICTIVE MAINTENANCE: BUILDING TWIN MARKET, BY END USER, 2024–2029 (USD MILLION)
TABLE 31 PREDICTIVE MAINTENANCE: BUILDING TWIN MARKET, BY REGION, 2020–2023 (USD MILLION)
TABLE 32 PREDICTIVE MAINTENANCE: BUILDING TWIN MARKET, BY REGION, 2024–2029 (USD MILLION)
TABLE 33 ENERGY MANAGEMENT: BUILDING TWIN MARKET, BY END USER, 2020–2023 (USD MILLION)
TABLE 34 ENERGY MANAGEMENT: BUILDING TWIN MARKET, BY END USER, 2024–2029 (USD MILLION)
TABLE 35 ENERGY MANAGEMENT: BUILDING TWIN MARKET, BY REGION, 2020–2023 (USD MILLION)
TABLE 36 ENERGY MANAGEMENT: BUILDING TWIN MARKET, BY REGION, 2024–2029 (USD MILLION)
TABLE 37 SAFETY & SECURITY MANAGEMENT: BUILDING TWIN MARKET, BY END USER, 2020–2023 (USD MILLION)
TABLE 38 SAFETY & SECURITY MANAGEMENT: BUILDING TWIN MARKET, BY END USER, 2024–2029 (USD MILLION)
TABLE 39 SAFETY & SECURITY MANAGEMENT: BUILDING TWIN MARKET, BY REGION, 2020–2023 (USD MILLION)
TABLE 40 SAFETY & SECURITY MANAGEMENT: BUILDING TWIN MARKET, BY REGION, 2024–2029 (USD MILLION)
TABLE 41 OTHERS: BUILDING TWIN MARKET, BY END USER, 2020–2023 (USD MILLION)
TABLE 42 OTHERS: BUILDING TWIN MARKET, BY END USER, 2024–2029 (USD MILLION)
TABLE 43 OTHERS: BUILDING TWIN MARKET, BY REGION, 2020–2023 (USD MILLION)
TABLE 44 OTHERS: BUILDING TWIN MARKET, BY REGION, 2024–2029 (USD MILLION)
TABLE 45 BUILDING TWIN MARKET, BY END USER, 2020–2023 (USD MILLION)
TABLE 46 BUILDING TWIN MARKET, BY END USER, 2024–2029 (USD MILLION)
TABLE 47 COMMERCIAL: BUILDING TWIN MARKET, BY END USER, 2020–2023 (USD MILLION)
TABLE 48 COMMERCIAL: BUILDING TWIN MARKET, BY END USER, 2024–2029 (USD MILLION)
TABLE 49 COMMERCIAL: BUILDING TWIN MARKET, BY OFFERING, 2020–2023 (USD MILLION)
TABLE 50 COMMERCIAL: BUILDING TWIN MARKET, BY OFFERING, 2024–2029 (USD MILLION)
TABLE 51 COMMERCIAL: BUILDING TWIN MARKET, BY APPLICATION, 2020–2023 (USD MILLION)
TABLE 52 COMMERCIAL: BUILDING TWIN MARKET, BY APPLICATION, 2024–2029 (USD MILLION)
TABLE 53 COMMERCIAL: BUILDING TWIN MARKET, BY REGION, 2020–2023 (USD MILLION)
TABLE 54 COMMERCIAL: BUILDING TWIN MARKET, BY REGION, 2024–2029 (USD MILLION)
TABLE 55 OFFICE BUILDINGS: BUILDING TWIN MARKET, BY REGION, 2020–2023 (USD MILLION)
TABLE 56 OFFICE BUILDINGS: BUILDING TWIN MARKET, BY REGION, 2024–2029 (USD MILLION)
TABLE 57 RETAIL SPACE: BUILDING TWIN MARKET, BY REGION, 2020–2023 (USD MILLION)
TABLE 58 RETAIL SPACE: BUILDING TWIN MARKET, BY REGION, 2024–2029 (USD MILLION)
TABLE 59 HOSPITALITY INDUSTRY: BUILDING TWIN MARKET, BY REGION, 2020–2023 (USD MILLION)
TABLE 60 HOSPITALITY INDUSTRY: BUILDING TWIN MARKET, BY REGION, 2024–2029 (USD MILLION)
TABLE 61 HOSPITALS: BUILDING TWIN MARKET, BY REGION, 2020–2023 (USD MILLION)
TABLE 62 HOSPITALS: BUILDING TWIN MARKET, BY REGION, 2024–2029 (USD MILLION)
TABLE 63 EDUCATIONAL INSTITUTIONS: BUILDING TWIN MARKET, BY REGION, 2020–2023 (USD MILLION)
TABLE 64 EDUCATIONAL INSTITUTIONS: BUILDING TWIN MARKET, BY REGION, 2024–2029 (USD MILLION)
TABLE 65 AIRPORT & TRANSPORTATION HUBS: BUILDING TWIN MARKET, BY REGION, 2020–2023 (USD MILLION)
TABLE 66 AIRPORT & TRANSPORTATION HUBS: BUILDING TWIN MARKET, BY REGION, 2024–2029 (USD MILLION)
TABLE 67 INDUSTRIAL: BUILDING TWIN MARKET, BY OFFERING, 2020–2023 (USD MILLION)
TABLE 68 INDUSTRIAL: BUILDING TWIN MARKET, BY OFFERING, 2024–2029 (USD MILLION)
TABLE 69 INDUSTRIAL: BUILDING TWIN MARKET, BY APPLICATION, 2020–2023 (USD MILLION)
TABLE 70 INDUSTRIAL: BUILDING TWIN MARKET, BY APPLICATION, 2024–2029 (USD MILLION)
TABLE 71 INDUSTRIAL: BUILDING TWIN MARKET, BY REGION, 2020–2023 (USD MILLION)
TABLE 72 INDUSTRIAL: BUILDING TWIN MARKET, BY REGION, 2024–2029 (USD MILLION)
TABLE 73 BUILDING TWIN MARKET, BY REGION, 2020–2023 (USD MILLION)
TABLE 74 BUILDING TWIN MARKET, BY REGION, 2024–2029 (USD MILLION)
TABLE 75 NORTH AMERICA: BUILDING TWIN MARKET, BY COUNTRY, 2020–2023 (USD MILLION)
TABLE 76 NORTH AMERICA: BUILDING TWIN MARKET, BY COUNTRY, 2024–2029 (USD MILLION)
TABLE 77 NORTH AMERICA: BUILDING TWIN MARKET, BY APPLICATION, 2020–2023 (USD MILLION)
TABLE 78 NORTH AMERICA: BUILDING TWIN MARKET, BY APPLICATION, 2024–2029 (USD MILLION)
TABLE 79 NORTH AMERICA: BUILDING TWIN MARKET, BY END USER, 2020–2023 (USD MILLION)
TABLE 80 NORTH AMERICA: BUILDING TWIN MARKET, BY END USER, 2024–2029 (USD MILLION)
TABLE 81 NORTH AMERICA: BUILDING TWIN MARKET FOR COMMERCIAL, BY END USER, 2020–2023 (USD MILLION)
TABLE 82 NORTH AMERICA: BUILDING TWIN MARKET FOR COMMERCIAL, BY END USER, 2024–2029 (USD MILLION)
TABLE 83 NORTH AMERICA: BUILDING TWIN MARKET, BY OFFERING, 2020–2023 (USD MILLION)
TABLE 84 NORTH AMERICA: BUILDING TWIN MARKET, BY OFFERING, 2024–2029 (USD MILLION)
TABLE 85 EUROPE: BUILDING TWIN MARKET, BY COUNTRY, 2020–2023 (USD MILLION)
TABLE 86 EUROPE: BUILDING TWIN MARKET, BY COUNTRY, 2024–2029 (USD MILLION)
TABLE 87 EUROPE: BUILDING TWIN MARKET, BY APPLICATION, 2020–2023 (USD MILLION)
TABLE 88 EUROPE: BUILDING TWIN MARKET, BY APPLICATION, 2024–2029 (USD MILLION)
TABLE 89 EUROPE: BUILDING TWIN MARKET, BY END USER, 2020–2023 (USD MILLION)
TABLE 90 EUROPE: BUILDING TWIN MARKET, BY END USER, 2024–2029 (USD MILLION)
TABLE 91 EUROPE: BUILDING TWIN MARKET FOR COMMERCIAL, BY END USER, 2020–2023 (USD MILLION)
TABLE 92 EUROPE: BUILDING TWIN MARKET FOR COMMERCIAL, BY END USER, 2024–2029 (USD MILLION)
TABLE 93 EUROPE: BUILDING TWIN MARKET, BY OFFERING, 2020–2023 (USD MILLION)
TABLE 94 EUROPE: BUILDING TWIN MARKET, BY OFFERING, 2024–2029 (USD MILLION)
TABLE 95 ASIA PACIFIC: BUILDING TWIN MARKET, BY COUNTRY, 2020–2023 (USD MILLION)
TABLE 96 ASIA PACIFIC: BUILDING TWIN MARKET, BY COUNTRY, 2024–2029 (USD MILLION)
TABLE 97 ASIA PACIFIC: BUILDING TWIN MARKET, BY APPLICATION, 2020–2023 (USD MILLION)
TABLE 98 ASIA PACIFIC: BUILDING TWIN MARKET, BY APPLICATION, 2024–2029 (USD MILLION)
TABLE 99 ASIA PACIFIC: BUILDING TWIN MARKET, BY END USER, 2020–2023 (USD MILLION)
TABLE 100 ASIA PACIFIC: BUILDING TWIN MARKET, BY END USER, 2024–2029 (USD MILLION)
TABLE 101 ASIA PACIFIC: BUILDING TWIN MARKET FOR COMMERCIAL, BY END USER, 2020–2023 (USD MILLION)
TABLE 102 ASIA PACIFIC: BUILDING TWIN MARKET FOR COMMERCIAL, BY END USER, 2024–2029 (USD MILLION)
TABLE 103 ASIA PACIFIC: BUILDING TWIN MARKET, BY OFFERING, 2020–2023 (USD MILLION)
TABLE 104 ASIA PACIFIC: BUILDING TWIN MARKET, BY OFFERING, 2024–2029 (USD MILLION)
TABLE 105 ROW: BUILDING TWIN MARKET, BY REGION, 2020–2023 (USD MILLION)
TABLE 106 ROW: BUILDING TWIN MARKET, BY REGION, 2024–2029 (USD MILLION)
TABLE 107 ROW: BUILDING TWIN MARKET, BY APPLICATION, 2020–2023 (USD MILLION)
TABLE 108 ROW: BUILDING TWIN MARKET, BY APPLICATION, 2024–2029 (USD MILLION)
TABLE 109 ROW: BUILDING TWIN MARKET, BY END USER, 2020–2023 (USD MILLION)
TABLE 110 ROW: BUILDING TWIN MARKET, BY END USER, 2024–2029 (USD MILLION)
TABLE 111 ROW: BUILDING TWIN MARKET FOR COMMERCIAL, BY END USER, 2020–2023 (USD MILLION)
TABLE 112 ROW: BUILDING TWIN MARKET FOR COMMERCIAL, BY END USER, 2024–2029 (USD MILLION)
TABLE 113 ROW: BUILDING TWIN MARKET, BY OFFERING, 2020–2023 (USD MILLION)
TABLE 114 ROW: BUILDING TWIN MARKET, BY OFFERING, 2024–2029 (USD MILLION)
TABLE 115 MIDDLE EAST: BUILDING TWIN MARKET, BY COUNTRY, 2020–2023 (USD MILLION)
TABLE 116 MIDDLE EAST: BUILDING TWIN MARKET, BY COUNTRY, 2024–2029 (USD MILLION)
TABLE 117 KEY PLAYER STRATEGIES/RIGHT TO WIN, 2022–2024
TABLE 118 BUILDING TWIN MARKET: DEGREE OF COMPETITION, 2023
TABLE 119 BUILDING TWIN MARKET: RANKING ANALYSIS OF BUILDING TWIN PLATFORM PROVIDERS, 2023
TABLE 120 BUILDING TWIN MARKET: OFFERING FOOTPRINT
TABLE 121 BUILDING TWIN MARKET: END USER FOOTPRINT
TABLE 122 BUILDING TWIN MARKET: APPLICATION FOOTPRINT
TABLE 123 BUILDING TWIN MARKET: REGION FOOTPRINT
TABLE 124 BUILDING TWIN MARKET: LIST OF KEY STARTUPS/SMES
TABLE 125 BUILDING TWIN MARKET: COMPETITIVE BENCHMARKING OF KEY STARTUPS/SMES
TABLE 126 BUILDING TWIN MARKET: PRODUCT LAUNCHES, FEBRUARY 2022–APRIL 2024
TABLE 127 BUILDING TWIN MARKET: DEALS, FEBRUARY 2022–APRIL 2024
TABLE 128 BUILDING TWIN MARKET: OTHERS, FEBRUARY 2022–APRIL 2024
TABLE 129 SIEMENS: COMPANY OVERVIEW
TABLE 130 SIEMENS: PRODUCTS/SOLUTIONS/SERVICES OFFERED
TABLE 131 SIEMENS: PRODUCT LAUNCHES/DEVELOPMENTS
TABLE 132 SIEMENS: DEALS
TABLE 133 MICROSOFT: COMPANY OVERVIEW
TABLE 134 MICROSOFT: PRODUCTS/SOLUTIONS/SERVICES OFFERED
TABLE 135 MICROSOFT: DEALS
TABLE 136 ROBERT BOSCH GMBH: COMPANY OVERVIEW
TABLE 137 ROBERT BOSCH GMBH: PRODUCTS/SOLUTIONS/SERVICES OFFERED
TABLE 138 ROBERT BOSCH GMBH: PRODUCT LAUNCHES/DEVELOPMENTS
TABLE 139 ROBERT BOSCH GMBH: DEALS
TABLE 140 DASSAULT SYSTÈMES: COMPANY OVERVIEW
TABLE 141 DASSAULT SYSTÈMES: PRODUCTS/SOLUTIONS/SERVICES OFFERED
TABLE 142 DASSAULT SYSTÈMES: PRODUCTS LAUNCHES/DEVELOPMENTS
TABLE 143 DASSAULT SYSTÈMES: DEALS
TABLE 144 AMAZON WEB SERVICES, INC.: COMPANY OVERVIEW
TABLE 145 AMAZON WEB SERVICES, INC.: PRODUCTS/SOLUTIONS/SERVICES OFFERED
TABLE 146 AMAZON WEB SERVICES, INC.: PRODUCTS LAUNCHES/DEVELOPMENTS
TABLE 147 AMAZON WEB SERVICES, INC.: DEALS
TABLE 148 AUTODESK INC.: COMPANY OVERVIEW
TABLE 149 AUTODESK INC.: PRODUCTS/SOLUTIONS/SERVICES OFFERED
TABLE 150 AUTODESK INC.: PRODUCTS LAUNCHES/DEVELOPMENTS
TABLE 151 AUTODESK INC.: DEALS
TABLE 152 IBM: COMPANY OVERVIEW
TABLE 153 IBM: PRODUCTS/SOLUTIONS/SERVICES OFFERED
TABLE 154 IBM: DEALS
TABLE 155 ORACLE: COMPANY OVERVIEW
TABLE 156 ORACLE: PRODUCTS/SOLUTIONS/SERVICES OFFERED
TABLE 157 ORACLE: PRODUCTS LAUNCHES/DEVELOPMENTS
TABLE 158 ORACLE: DEALS
TABLE 159 ORACLE: OTHERS
TABLE 160 ANSYS, INC.: COMPANY OVERVIEW
TABLE 161 ANSYS, INC.: PRODUCTS/SOLUTIONS/SERVICES OFFERED
TABLE 162 ANSYS, INC.: PRODUCTS LAUNCHES/DEVELOPMENTS
TABLE 163 ANSYS, INC.: DEALS
TABLE 164 SAP: COMPANY OVERVIEW
TABLE 165 SAP: PRODUCTS/SOLUTIONS/SERVICES OFFERED
TABLE 166 SAP: DEALS
TABLE 167 BENTLEY SYSTEMS, INCORPORATED: COMPANY OVERVIEW
TABLE 168 BENTLEY SYSTEMS, INCORPORATED: PRODUCTS/SOLUTIONS/SERVICES OFFERED
TABLE 169 BENTLEY SYSTEMS, INCORPORATED: DEALS
TABLE 170 MATTERPORT INC.: COMPANY OVERVIEW
TABLE 171 TRIMBLE INC.: COMPANY OVERVIEW
TABLE 172 ABB: COMPANY OVERVIEW
TABLE 173 JOHNSON CONTROLS: COMPANY OVERVIEW
TABLE 174 SCHNEIDER ELECTRIC: COMPANY OVERVIEW
TABLE 175 ESRI: COMPANY OVERVIEW
TABLE 176 NAVVIS: COMPANY OVERVIEW
TABLE 177 NOVACENE IOT LTD.: COMPANY OVERVIEW
TABLE 178 APRIORI: COMPANY OVERVIEW
TABLE 179 SOFTWARE AG: COMPANY OVERVIEW
TABLE 180 INTEGRATED ENVIRONMENTAL SOLUTIONS LIMITED: COMPANY OVERVIEW
TABLE 181 TWINSITY: COMPANY OVERVIEW
TABLE 182 TWINZO: COMPANY OVERVIEW
TABLE 183 CITYZENITH: COMPANY OVERVIEW
TABLE 184 DIGITAL TWIN MARKET, BY ENTERPRISE, 2019–2022 (USD MILLION)
TABLE 185 DIGITAL TWIN MARKET, BY ENTERPRISE, 2023–2028 (USD MILLION)
TABLE 186 LARGE ENTERPRISES: DIGITAL TWIN MARKET, BY REGION, 2019–2022 (USD MILLION)
TABLE 187 LARGE ENTERPRISES: DIGITAL TWIN MARKET, BY REGION, 2023–2028 (USD MILLION)
TABLE 188 SMALL & MEDIUM ENTERPRISES: DIGITAL TWIN MARKET, BY REGION, 2019–2022 (USD MILLION)
TABLE 189 SMALL & MEDIUM ENTERPRISES: DIGITAL TWIN MARKET, BY REGION, 2023–2028 (USD MILLION)
 
 
LIST OF FIGURES (65 FIGURES)
 
FIGURE 1 BUILDING TWIN MARKET SEGMENTATION AND REGIONAL SCOPE
FIGURE 2 BUILDING TWIN MARKET: RESEARCH DESIGN
FIGURE 3 BUILDING TWIN MARKET: RESEARCH APPROACH
FIGURE 4 MARKET SIZE ESTIMATION METHODOLOGY: BOTTOM-UP APPROACH
FIGURE 5 MARKET SIZE ESTIMATION METHODOLOGY: TOP-DOWN APPROACH
FIGURE 6 MARKET SIZE ESTIMATION METHODOLOGY: (DEMAND SIDE) REVENUE GENERATED BY PLAYERS IN BUILDING TWIN MARKET
FIGURE 7 DATA TRIANGULATION
FIGURE 8 SOFTWARE SOLUTIONS TO HOLD LARGER MARKET SHARE IN 2024
FIGURE 9 FACILITY MANAGEMENT SEGMENT TO REGISTER HIGHEST CAGR DURING FORECAST PERIOD
FIGURE 10 COMMERCIAL SEGMENT TO RECORD HIGHER CAGR DURING FORECAST PERIOD
FIGURE 11 NORTH AMERICA ACCOUNTED FOR LARGEST MARKET SHARE IN 2023
FIGURE 12 INCREASING FOCUS ON PREDICTIVE MAINTENANCE TO FUEL MARKET GROWTH
FIGURE 13 SOFTWARE SOLUTIONS SEGMENT TO HOLD LARGER MARKET SHARE IN 2029
FIGURE 14 FACILITY MANAGEMENT SEGMENT TO DOMINATE MARKET IN 2029
FIGURE 15 COMMERCIAL SEGMENT TO REGISTER HIGHER CAGR DURING FORECAST PERIOD
FIGURE 16 CHINA TO RECORD HIGHEST CAGR IN GLOBAL BUILDING TWIN MARKET DURING FORECAST PERIOD
FIGURE 17 BUILDING TWIN MARKET: DRIVERS, RESTRAINTS, OPPORTUNITIES, AND CHALLENGES
FIGURE 18 BUILDING TWIN MARKET: IMPACT ANALYSIS OF DRIVERS
FIGURE 19 BUILDING TWIN MARKET: IMPACT ANALYSIS OF RESTRAINTS
FIGURE 20 BUILDING TWIN MARKET: IMPACT ANALYSIS OF OPPORTUNITIES
FIGURE 21 BUILDING TWIN MARKET: IMPACT ANALYSIS OF CHALLENGES
FIGURE 22 TRENDS/DISRUPTIONS IMPACTING CUSTOMERS’ BUSINESSES
FIGURE 23 INDICATIVE PRICING TREND OF KEY PLAYERS, BY END USER (USD)
FIGURE 24 INDICATIVE PRICING TREND OF BUILDING TWIN PRODUCTS OFFERED BY KEY PLAYERS, 2019–2023 (USD)
FIGURE 25 AVERAGE SELLING PRICE TREND OF PRODUCTS/SOLUTIONS, BY REGION, 2019–2023 (USD)
FIGURE 26 BUILDING TWIN MARKET: VALUE CHAIN ANALYSIS
FIGURE 27 ECOSYSTEM ANALYSIS: BUILDING TWIN MARKET
FIGURE 28 INVESTMENT AND FUNDING SCENARIO
FIGURE 29 NUMBER OF PATENTS APPLIED AND GRANTED FOR BUILDING TWINS, 2014–2023
FIGURE 30 IMPORT DATA FOR HS CODE 851769-COMPLIANT PRODUCTS, BY COUNTRY, 2018–2022 (USD MILLION)
FIGURE 31 EXPORT DATA FOR HS CODE 851769-COMPLIANT PRODUCTS, BY COUNTRY, 2018–2022 (USD MILLION)
FIGURE 32 BUILDING TWIN MARKET: PORTER’S FIVE FORCES ANALYSIS
FIGURE 33 INFLUENCE OF STAKEHOLDERS ON BUYING PROCESS, BY END USER
FIGURE 34 KEY BUYING CRITERIA, BY END USER
FIGURE 35 BUILDING TWIN TYPES
FIGURE 36 BUILDING TWIN MARKET, BY OFFERING
FIGURE 37 SOFTWARE SOLUTIONS SEGMENT TO DOMINATE MARKET IN 2024
FIGURE 38 FACILITY MANAGEMENT SEGMENT TO ACCOUNT FOR LARGEST MARKET SHARE IN 2024
FIGURE 39 BUILDING TWIN MARKET, BY END USER
FIGURE 40 COMMERCIAL SEGMENT TO ACCOUNT FOR LARGER MARKET SHARE IN 2024
FIGURE 41 BUILDING TWIN MARKET, BY REGION
FIGURE 42 CHINA TO REGISTER HIGHEST CAGR IN GLOBAL BUILDING TWIN MARKET DURING FORECAST PERIOD
FIGURE 43 NORTH AMERICA TO DOMINATE GLOBAL BUILDING TWIN MARKET IN 2024
FIGURE 44 NORTH AMERICA: BUILDING TWIN MARKET SNAPSHOT
FIGURE 45 EUROPE: BUILDING TWIN MARKET SNAPSHOT
FIGURE 46 ASIA PACIFIC: BUILDING TWIN MARKET SNAPSHOT
FIGURE 47 BUILDING TWIN MARKET: REVENUE ANALYSIS OF TOP COMPANIES, 2019–2023
FIGURE 48 BUILDING TWIN MARKET SHARE ANALYSIS, 2023
FIGURE 49 VALUATION OF KEY PLAYERS, 2023
FIGURE 50 FINANCIAL METRICS (EV/EBITDA), 2023
FIGURE 51 BRAND/PRODUCT COMPARISON
FIGURE 52 BUILDING TWIN MARKET: COMPANY EVALUATION MATRIX (KEY PLAYERS), 2023
FIGURE 53 BUILDING TWIN MARKET: COMPANY FOOTPRINT
FIGURE 54 BUILDING TWIN MARKET: COMPANY EVALUATION MATRIX (STARTUPS/SMES), 2023
FIGURE 55 SIEMENS: COMPANY SNAPSHOT
FIGURE 56 MICROSOFT: COMPANY SNAPSHOT
FIGURE 57 ROBERT BOSCH GMBH: COMPANY SNAPSHOT
FIGURE 58 DASSAULT SYSTÈMES: COMPANY SNAPSHOT
FIGURE 59 AMAZON WEB SERVICES, INC.: COMPANY SNAPSHOT
FIGURE 60 AUTODESK INC.: COMPANY SNAPSHOT
FIGURE 61 IBM: COMPANY SNAPSHOT
FIGURE 62 ORACLE: COMPANY SNAPSHOT
FIGURE 63 ANSYS, INC: COMPANY SNAPSHOT
FIGURE 64 SAP: COMPANY SNAPSHOT
FIGURE 65 BENTLEY SYSTEMS, INCORPORATED: COMPANY SNAPSHOT


The study involves four major activities for estimating the size of the building twin market. Exhaustive secondary research has been conducted to collect information related to the market. The next step has been validating these findings, assumptions, and sizing with the industry experts across the value chain through primary research. Both top-down and bottom-up approaches have been employed to estimate the overall size of the building twin market. After that, market breakdown and data triangulation procedures have been used to determine the extent of different segments and subsegments of the market.

Secondary Research

Secondary sources in this research study include corporate filings (such as annual reports, investor presentations, and financial statements); trade, business, and professional associations; white papers, certified publications, articles from recognized authors; directories; and databases. The secondary data has been collected and analyzed to determine the overall market size estimations, further validated by primary research.

Primary Research

In the primary research process, several sources from both supply and demand sides were interviewed to obtain qualitative and quantitative information about this report. Several primary interviews have been conducted with market experts from both demand and supply sides across four major regions—North America, Europe, Asia Pacific, and the Rest of the World. This primary data has been collected through questionnaires, emails, and telephonic interviews. Approximately 60% of the primary interviews have been conducted with the demand side and 40% with the supply side. This primary data has been collected mainly through telephonic interviews, which accounted for 80% of the total primary interviews. Additionally, questionnaires and emails were used to collect the data.

Building Twin Market
 Size, and Share

To know about the assumptions considered for the study, download the pdf brochure

Market Size Estimation

In the complete market engineering process, both top-down and bottom-up approaches have been implemented, along with several data triangulation methods, to estimate and validate the size of the building twin market and other dependent submarkets listed in this report.

  • The key players in the industry and markets have been identified through extensive secondary research.
  • Both the supply chain of the industry and the market size, in terms of value, have been determined through primary and secondary research.
  • All percentage shares, splits, and breakdowns have been determined using secondary sources and verified through primary sources.

Global Building Twin Market Size: Bottom-Up Approach

Building Twin Market
 Size, and Bottom-Up Approach

Global Building Twin Market Size: Top-Down Approach

Building Twin Market
 Size, and Top-Down Approach

Data Triangulation

After arriving at the overall market size, the total market has been split into several segments. To complete the overall market engineering process and arrive at exact statistics for all segments, the market breakdown and data triangulation procedures have been employed wherever applicable. The data has been triangulated by studying various factors and trends from both the demand and supply sides. The market has also been validated using both top-down and bottom-up approaches.

Market Definition

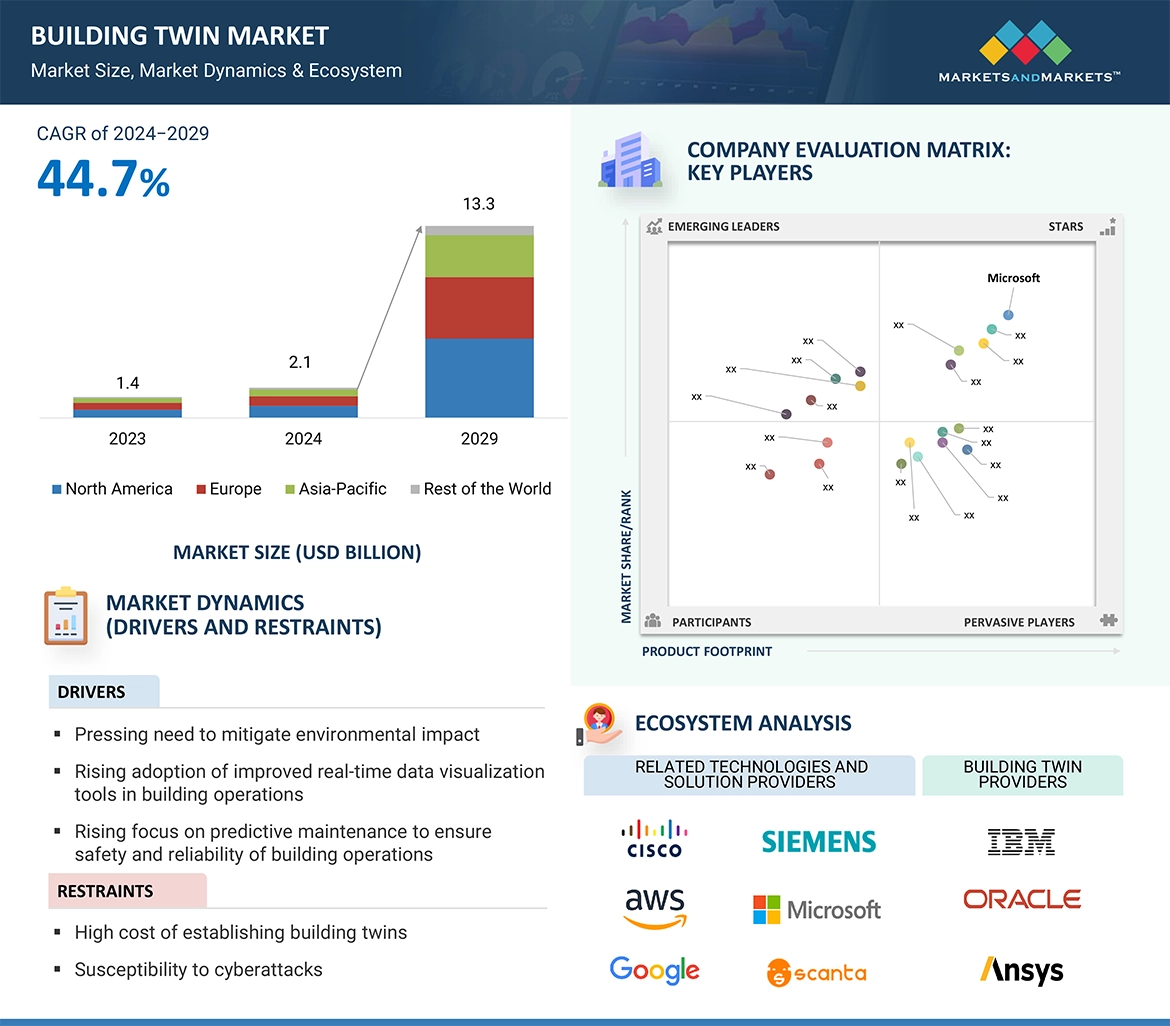
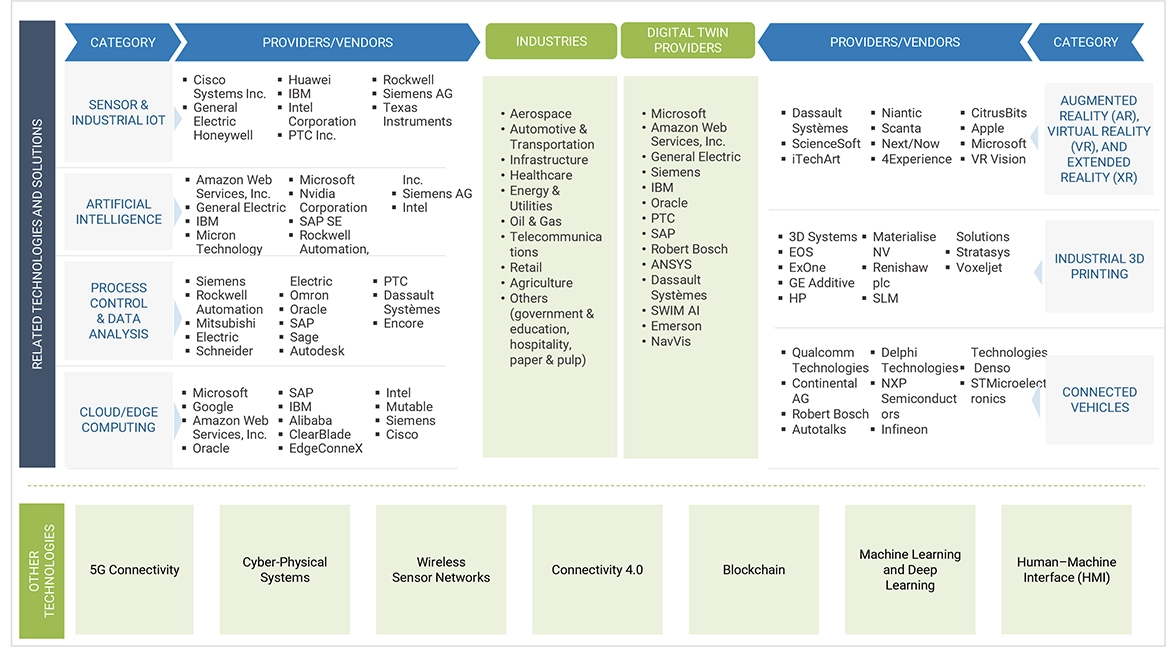
Building twin, or digital twin for buildings, is a virtual representation of a physical building or facility that integrates real-time data from sensors, IoT devices, and other sources. This digital replica enables comprehensive monitoring, analysis, and management of the building's operations and performance throughout its lifecycle. Building twin technology allows stakeholders such as facility managers, engineers, and designers to simulate scenarios, optimize energy usage, predict maintenance needs, and enhance operational efficiency. By leveraging advanced analytics and simulation capabilities, building twins support informed decision-making, improve sustainability efforts, and streamline building management practices effectively.

Key Stakeholders

  • Government bodies and policymakers
  • Industry organizations, forums, alliances, and associations
  • Market research and consulting firms
  • Raw material suppliers and distributors
  • Research institutes and organizations
  • Analysts and strategic business planners
  • End users of building twins

Study Objectives:

  • To define, describe, and forecast the building twin market size by offering, application, and end user, in terms of value
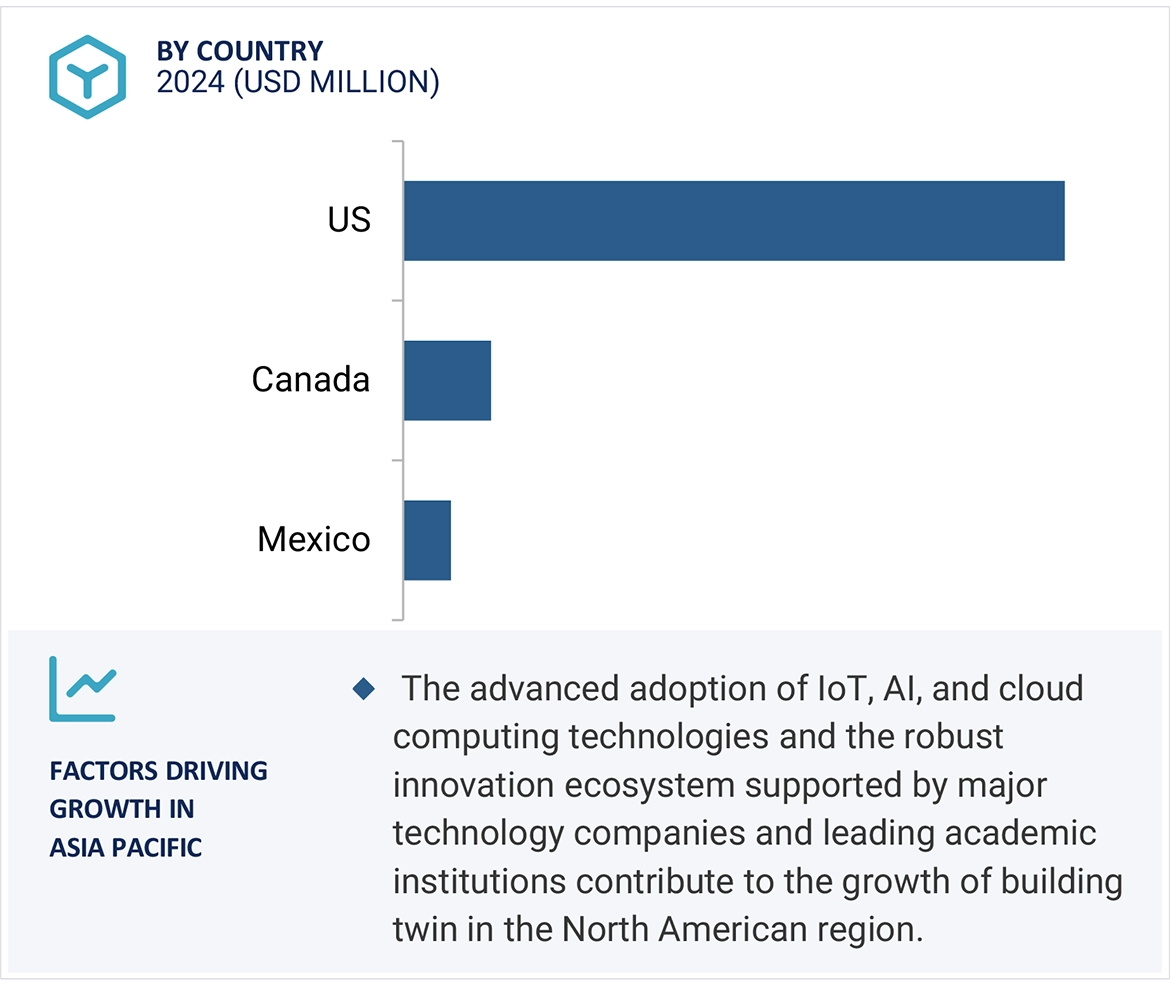
  • To describe and forecast the size of the building twin market across four regions, namely, North America, Europe, Asia Pacific, and the Rest of the World, along with their respective country-level market sizes, in terms of value
  • To provide detailed information regarding the drivers, restraints, opportunities, and challenges influencing the market growth
  • To provide a detailed overview of the process flow of the building twin market
  • To strategically analyze micromarkets1 for individual growth trends, prospects, and contributions to the overall market size
  • To study the complete value chain of the building twin market
  • To analyze opportunities for stakeholders by identifying high-growth segments of the building twin market
  • To strategically profile the key players and comprehensively analyze their market positions in terms of their ranking and core competencies2
  • To analyze competitive developments, such as product launches, deals (mergers, acquisitions, partnerships, collaborations, agreements, contracts, and investments), and others (expansions) in the building twin market

Available Customizations

With the given market data, MarketsandMarkets offers customizations according to the specific requirements of companies. The following customization options are available for the report:

Product Analysis

  • Product matrix that gives a detailed comparison of the product portfolio of each company

Company Information

  • Detailed analysis and profiling of 25 market players
Custom Market Research Services

We will customize the research for you, in case the report listed above does not meet with your exact requirements. Our custom research will comprehensively cover the business information you require to help you arrive at strategic and profitable business decisions.

Request Customization
Report Code
SE 9084
Published ON
Jul, 2024
Choose License Type
BUY NOW
  • SHARE
X
Request Customization
Speak to Analyst
Speak to Analyst
OR FACE-TO-FACE MEETING
PERSONALIZE THIS RESEARCH
  • Triangulate with your Own Data
  • Get Data as per your Format and Definition
  • Gain a Deeper Dive on a Specific Application, Geography, Customer or Competitor
  • Any level of Personalization
REQUEST A FREE CUSTOMIZATION
LET US HELP YOU!
  • What are the Known and Unknown Adjacencies Impacting the Building Twin Market
  • What will your New Revenue Sources be?
  • Who will be your Top Customer; what will make them switch?
  • Defend your Market Share or Win Competitors
  • Get a Scorecard for Target Partners
CUSTOMIZED WORKSHOP REQUEST
  • Call Us
  • +1-888-600-6441 (Corporate office hours)
  • +1-888-600-6441 (US/Can toll free)
  • +44-800-368-9399 (UK office hours)
CONNECT WITH US
ABOUT TRUST ONLINE
©2024 MarketsandMarkets Research Private Ltd. All rights reserved
DMCA.com Protection Status Website Feedback