Bubble Generator Market

Report Code CH 9221
Published in Nov, 2024, By MarketsandMarkets™
Download PDF

Choose License Type

Buy Report Now Inquire Before Buying

Bubble Generator Market by Type (Micro, Fine, Nano), Technology, Function, End-user (Water & Wastewater Treatment, Agriculture & Aquaculture, Food & Beverage, Chemicals, Power Generation, Mining & Mineral Processing), and Region - Global Forecast to 2029

Overview

The global bubble generators market is valued at USD 1.3 billion in 2024 and is projected to reach USD 1.8 billion by 2029, growing at 6.8% cagr from 2024 to 2029. Bubble generators are machines that are manufactured to create bubbles in varied sizes, mainly used in water treatment, and related areas of agriculture, aquaculture, and food industries. They can produce micro-&-nanobubbles and the nanobubbles are less than 100 nanometers in dimension. These generators tend to work by passing gas through a narrow channel or orifice into a liquid, the pressure of which causes gas molecules to be dispersed as bubbles that may float on the surface of the liquid for rather long durations. Today industries are looking forward to sustainable solutions for efficiency enhancement and reducing chemicals and that is why bubble generator has found relevance in almost all fields.

Attractive Opportunities in the Bubble Generators Market

Asia Pacific

The market in Asia Pacific is expected to witness high growth during the forecast period due to the increasing investments in the water & wastewater treatment and agriculture & aquaculture sectors.

The market growth is attributed to the increasing awareness of environmental issues and sustainability concerns.

Rise in investments in agriculture & aquaculture sector to further enhance the growth prospects of the bubble generators market worldwide.

The Asia Pacific bubble generators market is expected to be worth USD 0.5 billion in 2024, growing at CAGR of 8.0% during the forecast period.

Availability of various substitutes to pose a challenge to the growth of this market.

Global Bubble Generators Market Dynamics

DRIVER: Expanding aquaculture industry

The rapid growth of the aquaculture industry, particularly in the Asia-Pacific region, is significantly driving the expansion of the bubble generator market. This growth is supported by the increasing demand for sustainable seafood production, which is projected to reach USD 360.6 billion by 2032, up from USD 244 billion in 2023. As aquaculture production continues to rise accounting for over 59% of global fisheries and aquaculture production bubble generators play a crucial role in enhancing water quality and oxygenation in fish farming systems. Countries like China, India, and Indonesia are at the forefront of this growth, with China alone contributing approximately 56% of global aquatic animal production in 2021. The need for efficient aeration systems to support intensive fish farming practices is paramount, as these systems help maintain optimal living conditions for aquatic species. For instance, bubble generators can significantly increase dissolved oxygen levels in water, which is essential for the health and growth of fish such as tilapia and catfish, key species in freshwater aquaculture.

RESTRAINT: Competition from Chemical Treatments

Traditional chemical methods, such as chlorine disinfection and coagulation with agents like aluminum sulfate, are commonly used for water treatment and wastewater management. For instance, chlorine is the most widely utilized disinfectant globally, with approximately 90% of municipal water systems employing it to eliminate pathogens. This reliance on chemical treatments creates a formidable barrier for bubble generator technologies, which are still gaining traction in comparison. Moreover, the operational simplicity and cost-effectiveness of chemical treatments make them attractive options for many facilities. The average cost of chemical disinfection can be significantly lower than the initial investment required for bubble generator systems, which can range from USD 5,000 to USD 50,000 depending on specifications. This financial consideration can deter potential users from adopting newer technologies, especially in regions where budget constraints are a concern.


OPPORTUNITY: Growing Focus on Eco-Friendly Alternatives

As governments tighten regulations around water quality and waste management, companies are increasingly compelled to adopt eco-friendly technologies, reflecting the rising demand for chemical-free water treatment solutions across various sectors, including agriculture, aquaculture, and food processing. Nanobubble technology aligns seamlessly with sustainability goals by offering a chemical-free approach to water treatment that enhances operational efficiency. For example, these generators can improve oxygen levels in aquaculture systems by up to 30%, promoting fish health and growth rates while mitigating diseases caused by poor water quality. This capability is critical in meeting the rising demand for sustainable fish farming practices, especially as global seafood consumption is expected to increase by 20% over the next decade.

CHALLENGES: Limited Economies of Scale for Small-Scale Operations

Small-scale industries can face significant challenges, which can impede their ability to compete and innovate. One of the primary obstacles is the high initial costsassociated with the production and implementation of bubble generator technology. Advanced materials and sophisticated manufacturing processes often require substantial investments, which can be prohibitive for smaller companies with limited financial resources. Additionally, these enterprises may struggle to access technologies that larger firms can afford, resulting in a competitive disadvantage as larger players invest in research and development to drive innovation. Moreover, many small-scale businesses may not be fully aware of the benefits and applications of bubble generator technology, leading to hesitance in adopting new solutions.

Global Bubble Generators Market Ecosystem Analysis

Prominent companies in this market include well-established, financially stable manufacturers of bubble generators. These companies have been operating in the market for several years and possess diversified product portfolios and strong global sales and marketing networks.


Based on type, fine bubble is the second fastest growing segment in the bubble generators market

The requirement of fine bubbles, especially microbubbles and ultrafine bubbles in the bubble generator market is increasing substantially because of its usefulness and characteristics. The fine bubbles having size smaller than 100 micrometers provide much greater solid and gas solubility and lower bubble rise velocity in liquids thus, they are more suitable for water treatments in different fields including aquaculture and agriculture, industrial water and wastewater treatments and many others. They can float for longer periods hence when used in fish farming allows enough oxygen that is very crucial for the fish and when used in farming eliminate the need of using chemicals on crops. However, fine bubbles enhance the particle aggregation and removal processes necessary in industries such as food processing and mining. Based on these and other considerations, there is a rising trend towards sustainability, and consequently, regulations affecting the environment are also on the rise, and fine bubble technology helps manufacturers and service providers save on chemicals and energy.

Based on technology, the swirl flow segment is projected to be the second largest during the forecast period

The swirl flow technology is in high demand in the bubble generators market due to increased call for higher mixing and agitation in various operations. Swirl flow technology, through which a tornado like vortex is formed in the tank enhances suspension of solids, or in the case of sediments do not settle at the bottom, thus significant in operations such as minerals separation or water treatment. Advantages of this technology include lower capital and operational costs, and lower maintenance and higher reliability compared to conventional agitation techniques. For example, with regard to hydrate hardware elements, the construction of the swirl flow systems is short-shaft as they reduce mechanical failure and wear rates even in intensely operated systems that require minimal maintenance breaks. Moreover, high efficiency of mixing by means of swirl flow technology enables high speed of production and minimal time for stoppages, thus it may be of huge interest for various kinds of enterprises. In combination with the continuous recognition of these advantages by companies, the usage of swirl flow technology in bubble generators will slightly increase, contributing to the further market development.

Based on end-user, water & wastewater treatment is projected to be the largest segment in the bubble generators market

The problem of freshwater scarcity and pollution becomes an acute issue in the context of globalization the more, so industries tend to find more effective solutions for water purification. Bubble generators including micro and nanobubble technology aerate water by increasing dissolved oxygen and promoting the removal of contaminants and proliferation of beneficial microbes. Such ultrafine bubbles float in liquid for longer time as and provide high rates of gas transfer and aeration. Also, there is increasing pressure in regard to the quality of water and this is ensuring that the municipalities and industries look for new ways through which they can employ the use of improved technologies that will ensure minimum use of chemicals in the water treatment plants. The fact that bubble generation systems are flexible render them useful in a number of applications such as municipal wastewater treatment, aquaculture fish farming as well as irrigation in agriculture hence the reason why they are indispensable in working towards the solution of some environmental issues and problems with a prevalence of water pollution.

Asia Pacific is expected to be the largest market during the forecast period

The market for bubble generators in the Asia Pacific includes countries such as China, Japan, India, South Korea, and Rest of Asia Pacific. It is expected to be the fastest-growing market owing to continuous investments due to advancements in end-user sectors. Demand in this region for bubble generators is significantly driven by their use in agriculture & aquaculture sectors. Bubble generators unique properties make them ideal for various industrial sectors, further boosting their market presence. The market in the Asia Pacific is mainly driven by China, Japan, and India, as these countries are adopting bubble generators in newer applications. The rapid industrialization in this region is expected to drive the bubble generators market in the coming years.

HIGHEST CAGR MARKET IN 2024-2029
ASIA PACIFIC GROWING MARKET IN THE REGION

Recent Developments of Bubble Generators Market

  • In October 2023, acniti LLC's agricultural nanobubble technology is exclusively distributed throughout North America by Fairway Green Cannabis. Through this partnership, solutions specifically tailored to the Fairway Green Cannabis will be developed, utilizing the company’s proficiency in vertical farming and AI technology. This partnership expands Fairway Green's nanobubble technology capabilities and comes after the company acquired Nanobubble Control Systems.
  • In July 2023, acniti LLC has partnered exclusively with Vsquare Holding B.V., with intentions to extend throughout Europe, this partnership focuses on the development and sales of nanobubble technology within Belgium, the Netherlands, and Luxembourg regions. The acniti LLC.'s products will be marketed by Vsquare Holding B.V. under their brand, promoting the expansion of agricultural industries such as fisheries, cattle, and vegetable and flower cultivation.
  • In October 2023, Moleaer launched INDALO, which is made to endure the weather patterns encountered in southern parts of Spain. The most effective and economical way to supersaturate water with oxygen is with INDALO, a unique gas-to-liquid injection system that creates trillions of nanobubbles.
  • In October 2023, Moleaer Inc. and BIOSABOR SAT, have formed a partnership to use Moleaer Inc.'s nanobubble technology to increase agricultural productivity in Spain. As part of this partnership, a new production plant will be built in Almería. This plant will act as a central location for local farmers to receive Moleaer's nanobubble generators. Even in difficult circumstances like extreme heat and water scarcity, the technology enriches irrigation water with billions of oxygen nanobubbles, which would dramatically improve plant health and increase crop yields.

Key Market Players

Want to explore hidden markets that can drive new revenue in Bubble Generator Market?

Scope of the Report

Report Metric Details
Market size available for years 2023-2029
Base Year Considered 2023
Forecast period 2024-2029
Forecast units Value (USD Million)
Segments covered Type, Technology, Function, End-User, and Region
Geographies covered North America, Europe, Asia Pacific, Middle East & Africa, South America


Key Questions Addressed by the Report

What are the factors influencing the growth of the bubble generators market?
The growth of the bubble generators market is influenced by factors such as increasing demand across end-use sectors, technological advancements, and growing market for agriculture & aquaculture products.
Which are the key end-users driving the bubble generators market?
The key end-users driving the demand for bubble generators are water & wastewater treatment, agriculture & aquaculture, food & beverage, chemicals, power generation, and mining & mineral processing among others.
Who are the major manufacturers?
The major manufacturers include Acniti LLC (Japan), Moleaer Inc. (US), Shandong Sundon Technology Co., Ltd. (China), Pacific Water Technology (Australia), Agrona B.V. (Netherlands), Fine Bubble Technologies (South Africa), Shanghai Mutao Environmental Technology Co., Ltd. (China), All-Pumps Pty Ltd (Australia), NanoKriti (India), and NEWMANTECH Co. Ltd. (South Korea).
What will be the growth prospects of the bubble generators market?
The bubble generators market is expected to witness robust growth due to the rising demand from end-users.
What will be the growth prospects of the bubble generators market in terms of CAGR in the next five years?
Growing demand for environmentally friendly products, expanding end-users in emerging markets, and technological advancements & product innovations are expected to drive the market. The CAGR of the market is expected to be 6.8% for the next five years.


Personalize This Research

  • Triangulate with your Own Data
  • Get Data as per your Format and Definition
  • Gain a Deeper Dive on a Specific Application, Geography, Customer or Competitor
  • Any level of Personalization
Request A Free Customisation

Let Us Help You

  • What are the Known and Unknown Adjacencies Impacting the Bubble Generator Market
  • What will your New Revenue Sources be?
  • Who will be your Top Customer; what will make them switch?
  • Defend your Market Share or Win Competitors
  • Get a Scorecard for Target Partners
Customized Workshop Request

Table of Contents

Exclusive indicates content/data unique to MarketsandMarkets and not available with any competitors.

TITLE
PAGE NO
INTRODUCTION
21
RESEARCH METHODOLOGY
25
EXECUTIVE SUMMARY
34
PREMIUM INSIGHTS
38
MARKET OVERVIEW
41
  • 5.1 INTRODUCTION
  • 5.2 IMPACT OF AI/GENAI
  • 5.3 MARKET DYNAMICS
    DRIVERS
    - Growth of aquaculture industry
    - Rising demand for water management solutions
    RESTRAINTS
    - Preference for traditional chemical methods
    - Stringent regulatory standards
    OPPORTUNITIES
    - Growing focus on eco-friendly alternatives
    - Diverse applications of bubble generators across industries
    CHALLENGES
    - Lack of standardized protocols
    - Limited economies of scale for small-scale operations
  • 5.4 PORTER’S FIVE FORCES ANALYSIS
    THREAT OF SUBSTITUTES
    THREAT OF NEW ENTRANTS
    BARGAINING POWER OF BUYERS
    BARGAINING POWER OF SUPPLIERS
    INTENSITY OF COMPETITIVE RIVALRY
  • 5.5 KEY STAKEHOLDERS AND BUYING CRITERIA
    KEY STAKEHOLDERS IN BUYING PROCESS
    BUYING CRITERIA
  • 5.6 MACROECONOMIC INDICATORS
    GLOBAL GDP TRENDS
    MARINE AQUATIC ANIMAL CAPTURE PRODUCTION BY MAJOR PRODUCERS
  • 5.7 VALUE CHAIN ANALYSIS
    RAW MATERIAL SUPPLIERS
    MANUFACTURERS
    DISTRIBUTORS
    END USERS/CONSUMERS
  • 5.8 ECOSYSTEM ANALYSIS
  • 5.9 CASE STUDY ANALYSIS
    IMPACT OF NANOBUBBLE TECHNOLOGY ON BOD/COD REDUCTION IN FOOD PROCESSING FACILITIES
    EFFECT OF NANOAQUA N-50 NANOBUBBLE TECHNOLOGY IN PHOOL KALAN’S COMMUNITY POND
    APPLICATION OF ARMSTRONG NANOBUBBLE GENERATORS AT WEST MICHIGAN COMPOUNDING
  • 5.10 REGULATORY LANDSCAPE
    ENVIRONMENTAL REGULATIONS
    - North America
    - Europe
    - Others
    REGULATORY BODIES, GOVERNMENT AGENCIES, AND OTHER ORGANIZATIONS
  • 5.11 TECHNOLOGY ANALYSIS
    KEY TECHNOLOGIES
    - Venturi-type bubble generation
    - Vortex bubble generation
    COMPLEMENTARY TECHNOLOGIES
    - Technology integration with smart sensors
    ADJACENT TECHNOLOGIES
    - Bubble diffuser
  • 5.12 TRENDS/DISRUPTIONS IMPACTING CUSTOMER BUSINESS
  • 5.13 TRADE ANALYSIS
    IMPORT SCENARIO (HS CODE 842121)
    EXPORT SCENARIO (HS CODE 842121)
  • 5.14 KEY CONFERENCES AND EVENTS, 2024–2025
  • 5.15 PRICING ANALYSIS
    INDICATIVE PRICING ANALYSIS TREND, BY REGION
    INDICATIVE PRICING ANALYSIS TREND, BY TYPE
  • 5.16 INVESTMENT AND FUNDING SCENARIO
  • 5.17 PATENT ANALYSIS
    METHODOLOGY
    DOCUMENT TYPES
    PUBLICATION TRENDS
    INSIGHTS
    LEGAL STATUS OF PATENTS
    JURISDICTION ANALYSIS
    TOP APPLICANTS
BUBBLE GENERATOR MARKET, BY TYPE
71
  • 6.1 INTRODUCTION
  • 6.2 MICROBUBBLE
    INTEGRATION INTO WASTEWATER TREATMENT AND AQUACULTURE REFLECTS SHIFT TOWARD MORE SUSTAINABLE PRACTICES
  • 6.3 FINE BUBBLE
    OPTIMIZING RESOURCE USE AND IMPROVING ENVIRONMENTAL OUTCOMES TO DRIVE MARKET
  • 6.4 NANOBUBBLE
    ADVANCEMENTS IN PRESSURIZED DISSOLUTION METHODS AND ULTRASONIC TECHNOLOGY TO BOOST DEMAND
  • 6.5 OTHER TYPES
BUBBLE GENERATOR MARKET, BY TECHNOLOGY
75
  • 7.1 INTRODUCTION
  • 7.2 SWIRL FLOW
    RECENT ADVANCEMENTS IN SWIRL FLOW TECHNOLOGY TO IMPROVE EFFICIENCY AND REDUCE MAINTENANCE COSTS
  • 7.3 EJECTOR
    APPLICATION OF EJECTOR TECHNOLOGY IN GENERATING NANOBUBBLES TO DRIVE MARKET
  • 7.4 VENTURI
    INNOVATIVE TECHNIQUES TO MEASURE FLOW RATES TO YIELD EFFECTIVE SOLUTIONS FOR FLUID VELOCITY CHANGES
  • 7.5 PRESSURE DISSOLUTION
    WIDE USE IN WASTEWATER TREATMENT AND AQUACULTURE TO DRIVE MARKET
  • 7.6 ULTRASONIC VIBRATION
    ADVANCEMENTS IN ULTRASONIC VIBRATION TECHNOLOGY TO BOOST DEMAND
  • 7.7 MIXED VAPOR CONDENSATION BY DIRECT CONTACT WITH COOLANT WATER
    EFFICIENCY TO IMPROVE HEAT TRANSFER RATES AND REDUCE THERMAL RESISTANCE IN COOLING SYSTEMS TO BOOST DEMAND
  • 7.8 NANOPORES
    INCREASING DEMAND IN GENERATING ULTRAFINE BUBBLES WHILE MINIMIZING ENERGY CONSUMPTION TO DRIVE MARKET
BUBBLE GENERATOR MARKET, BY FUNCTION
81
  • 8.1 INTRODUCTION
  • 8.2 FLOTATION
  • 8.3 OZONATION
  • 8.4 GAS-LIQUID MIXING
  • 8.5 PARTICLE AGGREGATION & REMOVAL
  • 8.6 OTHER FUNCTIONS
BUBBLE GENERATOR MARKET, BY END USER
86
  • 9.1 INTRODUCTION
  • 9.2 WATER & WASTEWATER TREATMENT
    EFFICACY IN ENHANCING ADSORPTION OF CONTAMINANTS ONTO BUBBLE SURFACE TO DRIVE MARKET
    MUNICIPAL WASTEWATER TREATMENT
    INDUSTRIAL WASTEWATER TREATMENT
  • 9.3 AGRICULTURE & AQUACULTURE
    EFFICIENT NUTRIENT DELIVERY AND IMPROVED WATER QUALITY TO BOOST DEMAND
  • 9.4 FOOD & BEVERAGE
    INCREASING DEMAND FOR ECO-FRIENDLY AND CHEMICAL-FREE SOLUTIONS TO DRIVE MARKET
    FOOD PROCESSING
    BEVERAGE PROCESSING
  • 9.5 CHEMICALS
    SURGE IN DEMAND FOR HIGH-SHEAR AGITATORS AND UNIQUE POROUS TUBE DESIGNS TO DRIVE MARKET
  • 9.6 POWER GENERATION
    SIGNIFICANT SHIFT TOWARD INTEGRATING ADVANCED AERATION TECHNIQUES IN POWER PLANTS TO BOOST MARKET
  • 9.7 MINING & MINERAL PROCESSING
    INNOVATIVE SOLUTIONS TO ENHANCE OPERATIONAL EFFICIENCY
  • 9.8 OTHER END USERS
BUBBLE GENERATOR MARKET, BY REGION
95
  • 10.1 INTRODUCTION
  • 10.2 NORTH AMERICA
    US
    - Increase in oil production activities and rising demand for potable drinking water to drive market
    CANADA
    - Favorable government policies and increasing public and private investments to drive market
    MEXICO
    - Growth of energy and power sectors to boost market
  • 10.3 EUROPE
    GERMANY
    - Advanced R&D and manufacturing to lead market
    FRANCE
    - High level of labor productivity and presence of established international companies to drive market
    SPAIN
    - EU Directives to shape water treatment industry landscape
    UK
    - Fossil fuel volatility to increase demand for alternative energy solutions
    ITALY
    - Transformation of renewable energy sector to fuel dependency
    REST OF EUROPE
  • 10.4 ASIA PACIFIC
    CHINA
    - Growing industrialization and urbanization to drive market
    JAPAN
    - Advanced water treatment infrastructure to boost demand for bubble generators
    INDIA
    - Economic strategies and significant investments in bubble generators to drive market
    SOUTH KOREA
    - Strategic focus on specialty foods to boost market
    MALAYSIA
    - Green technology and sustainable water management to boost foreign investment
    REST OF ASIA PACIFIC
  • 10.5 MIDDLE EAST & AFRICA
    GCC
    - Saudi Arabia
    - UAE
    - Rest of GCC
    SOUTH AFRICA
    - Growth of chemical industry to drive market
    REST OF MIDDLE EAST & AFRICA
  • 10.6 SOUTH AMERICA
    BRAZIL
    - Energy reforms and industrial growth to boost economic growth
    ARGENTINA
    - Hydropower and natural gas power fuel energy demand
    REST OF SOUTH AMERICA
COMPETITIVE LANDSCAPE
156
  • 11.1 OVERVIEW
  • 11.2 KEY PLAYER STRATEGIES/RIGHT TO WIN
  • 11.3 REVENUE ANALYSIS
  • 11.4 MARKET SHARE ANALYSIS, 2023
  • 11.5 COMPANY VALUATION AND FINANCIAL METRICS
  • 11.6 BRAND/PRODUCT COMPARISON
  • 11.7 COMPANY EVALUATION MATRIX: KEY PLAYERS, 2023
    STARS
    EMERGING LEADERS
    PERVASIVE PLAYERS
    PARTICIPANTS
    COMPANY FOOTPRINT: KEY PLAYERS, 2023
    - Type footprint
    - Technology footprint
    - Region footprint
    - Function footprint
    - End user footprint
    - Company footprint
  • 11.8 COMPANY EVALUATION MATRIX: STARTUPS/SMES, 2023
    PROGRESSIVE COMPANIES
    RESPONSIVE COMPANIES
    DYNAMIC COMPANIES
    STARTING BLOCKS
    COMPETITIVE BENCHMARKING
    - Detailed list of key startups/SMEs
    - Competitive benchmarking of key startups/SMEs
  • 11.9 COMPETITIVE SCENARIO AND TRENDS
    PRODUCT LAUNCHES
    DEALS
    EXPANSIONS
COMPANY PROFILES
180
  • 12.1 KEY PLAYERS
    ACNITI LLC
    - Business overview
    - Products/Solutions/Services offered
    - Recent developments
    - MnM view
    MOLEAER INC.
    - Business overview
    - Products/Solutions/Services offered
    - Recent developments
    - MnM view
    SHANDONG SUNDON TECHNOLOGY CO., LTD.
    - Business overview
    - Products/Solutions/Services offered
    - Recent developments
    - MnM view
    PACIFIC WATER TECHNOLOGY
    - Business overview
    - Products/Solutions/Services offered
    - MnM view
    AGRONA B.V.
    - Business overview
    - Products/Solutions/Services offered
    - MnM view
    FINE BUBBLE TECHNOLOGIES
    - Business overview
    - Products/Solutions/Services offered
    - Recent developments
    - MnM view
    SHANGHAI MUTAO ENVIRONMENTAL TECHNOLOGY CO., LTD.
    - Business overview
    - Products/Solutions/Services offered
    - MnM view
    ALL-PUMPS PTY LTD.
    - Business overview
    - Products/Solutions/Services offered
    - MnM view
    NANOKRITI
    - Business overview
    - Products/Solutions/Services offered
    - MnM view
    NEWMANTECH CO. LTD.
    - Business overview
    - Products/Solutions/Services offered
    - MnM view
  • 12.2 OTHER PLAYERS
    TRIDENT BUBBLE TECHNOLOGIES LLC
    ARMSTRONG INTERNATIONAL INC.
    TAISEI KOGYO CO., LTD.
    QINGDAO AOZENGNIER PURIFICATION EQUIPMENT CO., LTD.
    GAIA WATER LTD. GAIA USA, INC.
    RAPID WATER TECHNOLOGIES
    AQUAB NANOBUBBLE INNOVATIONS LTD.
    AIROXI TUBE
    GASION AIRTEC PVT. LTD.
    NANJING LANJIANG PROCESSING EQUIPMENTS CO., LTD.
    ZHEJIANG JUBEI TECHNOLOGY GROUP SHARE CO., LTD.
    DINO PURIFICATION EQUIPMENT(GUANGZHOU) CO., LTD.
    HINODE SANGYO CO. LTD.
    NIKUNI CORPORATION
    SOLARI WATER
APPENDIX
225
  • 13.1 DISCUSSION GUIDE
  • 13.2 KNOWLEDGESTORE: MARKETSANDMARKETS’ SUBSCRIPTION PORTAL
  • 13.3 CUSTOMIZATION OPTIONS
  • 13.4 RELATED REPORTS
  • 13.5 AUTHOR DETAILS
LIST OF TABLES
 
  • TABLE 1 BUBBLE GENERATOR MARKET: INCLUSIONS AND EXCLUSIONS
  • TABLE 2 BUBBLE GENERATOR MARKET: PORTER’S FIVE FORCES ANALYSIS
  • TABLE 3 INFLUENCE OF STAKEHOLDERS ON BUYING PROCESS, BY END-USE INDUSTRY
  • TABLE 4 KEY BUYING CRITERIA FOR BUBBLE GENERATORS, BY END-USE INDUSTRY
  • TABLE 5 TRENDS OF PER CAPITA GDP, BY COUNTRY, 2020–2023 (USD)
  • TABLE 6 GDP GROWTH, BY COUNTRY, 2024–2027 (USD)
  • TABLE 7 MARINE AQUATIC ANIMAL CAPTURE PRODUCTION BY MAJOR PRODUCERS, BY COUNTRY/TERRITORY, 2021–2022 (THOUSAND TONS, LIVE WEIGHT EQUIVALENT)
  • TABLE 8 BUBBLE GENERATOR MARKET: ECOSYSTEM
  • TABLE 9 NORTH AMERICA: REGULATORY BODIES, GOVERNMENT AGENCIES, AND OTHER ORGANIZATIONS
  • TABLE 10 EUROPE: REGULATORY BODIES, GOVERNMENT AGENCIES, AND OTHER ORGANIZATIONS
  • TABLE 11 ASIA PACIFIC: REGULATORY BODIES, GOVERNMENT AGENCIES, AND OTHER ORGANIZATIONS
  • TABLE 12 BUBBLE GENERATOR MARKET: KEY CONFERENCES AND EVENTS, 2024–2025
  • TABLE 13 INDICATIVE PRICING ANALYSIS TREND, BY REGION, 2023 (USD/UNIT)
  • TABLE 14 INDICATIVE PRICING ANALYSIS TREND, BY TYPE, 2023 (USD/UNIT)
  • TABLE 15 TOP 10 PATENT OWNERS DURING LAST 10 YEARS, 2014– 2023
  • TABLE 16 BUBBLE GENERATOR MARKET, BY TYPE, 2020–2023 (USD MILLION)
  • TABLE 17 BUBBLE GENERATOR MARKET, BY TYPE, 2024–2029 (USD MILLION)
  • TABLE 18 BUBBLE GENERATOR MARKET, BY TECHNOLOGY, 2020–2023 (USD MILLION)
  • TABLE 19 BUBBLE GENERATOR MARKET, BY TECHNOLOGY, 2024–2029 (USD MILLION)
  • TABLE 20 BUBBLE GENERATOR MARKET, BY FUNCTION, 2020–2023 (USD MILLION)
  • TABLE 21 BUBBLE GENERATOR MARKET, BY FUNCTION, 2024–2029 (USD MILLION)
  • TABLE 22 BUBBLE GENERATOR MARKET, BY END USER, 2020–2023 (USD MILLION)
  • TABLE 23 BUBBLE GENERATOR MARKET, BY END USER, 2024–2029 (USD MILLION)
  • TABLE 24 BUBBLE GENERATOR MARKET, BY REGION, 2020–2023 (USD MILLION)
  • TABLE 25 BUBBLE GENERATOR MARKET, BY REGION, 2024–2029 (USD MILLION)
  • TABLE 26 NORTH AMERICA: BUBBLE GENERATOR MARKET, BY COUNTRY, 2020–2023 (USD MILLION)
  • TABLE 27 NORTH AMERICA: BUBBLE GENERATOR MARKET, BY COUNTRY, 2024–2029 (USD MILLION)
  • TABLE 28 NORTH AMERICA: BUBBLE GENERATOR MARKET, BY TYPE, 2020–2023 (USD MILLION)
  • TABLE 29 NORTH AMERICA: BUBBLE GENERATOR MARKET, BY TYPE, 2024–2029 (USD MILLION)
  • TABLE 30 NORTH AMERICA: BUBBLE GENERATOR MARKET, BY APPLICATION, 2020–2023 (USD MILLION)
  • TABLE 31 NORTH AMERICA: BUBBLE GENERATOR MARKET, BY APPLICATION, 2024–2029 (USD MILLION)
  • TABLE 32 NORTH AMERICA: BUBBLE GENERATOR MARKET, BY FUNCTION, 2020–2023 (USD MILLION)
  • TABLE 33 NORTH AMERICA: BUBBLE GENERATOR MARKET, BY FUNCTION, 2024–2029 (USD MILLION)
  • TABLE 34 NORTH AMERICA: BUBBLE GENERATOR MARKET, BY END USER, 2020–2023 (USD MILLION)
  • TABLE 35 NORTH AMERICA: BUBBLE GENERATOR MARKET, BY END USER, 2024–2029 (USD MILLION)
  • TABLE 36 US: BUBBLE GENERATOR MARKET, BY END USER, 2020–2023 (USD MILLION)
  • TABLE 37 US: BUBBLE GENERATOR MARKET, BY END USER, 2024–2029 (USD MILLION)
  • TABLE 38 CANADA: BUBBLE GENERATOR MARKET, BY END USER, 2020–2023 (USD MILLION)
  • TABLE 39 CANADA: BUBBLE GENERATOR MARKET, BY END USER, 2024–2029 (USD MILLION)
  • TABLE 40 MEXICO: BUBBLE GENERATOR MARKET, BY END USER, 2020–2023 (USD MILLION)
  • TABLE 41 MEXICO: BUBBLE GENERATOR MARKET, BY END USER, 2024–2029 (USD MILLION)
  • TABLE 42 EUROPE: BUBBLE GENERATOR MARKET, BY COUNTRY, 2020–2023 (USD MILLION)
  • TABLE 43 EUROPE: BUBBLE GENERATOR MARKET, BY COUNTRY, 2024–2029 (USD MILLION)
  • TABLE 44 EUROPE: BUBBLE GENERATOR MARKET, BY TYPE, 2020–2023 (USD MILLION)
  • TABLE 45 EUROPE: BUBBLE GENERATOR MARKET, BY TYPE, 2024–2029 (USD MILLION)
  • TABLE 46 EUROPE: BUBBLE GENERATOR MARKET, BY APPLICATION, 2020–2023 (USD MILLION)
  • TABLE 47 EUROPE: BUBBLE GENERATOR MARKET, BY APPLICATION, 2024–2029 (USD MILLION)
  • TABLE 48 EUROPE: BUBBLE GENERATOR MARKET, BY FUNCTION, 2020–2023 (USD MILLION)
  • TABLE 49 EUROPE: BUBBLE GENERATOR MARKET, BY FUNCTION, 2024–2029 (USD MILLION)
  • TABLE 50 EUROPE: BUBBLE GENERATOR MARKET, BY END USER, 2020–2023 (USD MILLION)
  • TABLE 51 EUROPE: BUBBLE GENERATOR MARKET, BY END USER, 2024–2029 (USD MILLION)
  • TABLE 52 GERMANY: BUBBLE GENERATOR MARKET, BY END USER, 2020–2023 (USD MILLION)
  • TABLE 53 GERMANY: BUBBLE GENERATOR MARKET, BY END USER, 2024–2029 (USD MILLION)
  • TABLE 54 FRANCE: BUBBLE GENERATOR MARKET, BY END USER, 2020–2023 (USD MILLION)
  • TABLE 55 FRANCE: BUBBLE GENERATOR MARKET, BY END USER, 2024–2029 (USD MILLION)
  • TABLE 56 SPAIN: BUBBLE GENERATOR MARKET, BY END USER, 2020–2023 (USD MILLION)
  • TABLE 57 SPAIN: BUBBLE GENERATOR MARKET, BY END USER, 2024–2029 (USD MILLION)
  • TABLE 58 UK: BUBBLE GENERATOR MARKET, BY END USER, 2020–2023 (USD MILLION)
  • TABLE 59 UK: BUBBLE GENERATOR MARKET, BY END USER, 2024–2029 (USD MILLION)
  • TABLE 60 ITALY: BUBBLE GENERATOR MARKET, BY END USER, 2020–2023 (USD MILLION)
  • TABLE 61 ITALY: BUBBLE GENERATOR MARKET, BY END USER, 2024–2029 (USD MILLION)
  • TABLE 62 REST OF EUROPE: BUBBLE GENERATOR MARKET, BY END USER, 2020–2023 (USD MILLION)
  • TABLE 63 REST OF EUROPE: BUBBLE GENERATOR MARKET, BY END USER, 2024–2029 (USD MILLION)
  • TABLE 64 ASIA PACIFIC: BUBBLE GENERATOR MARKET, BY COUNTRY, 2020–2023 (USD MILLION)
  • TABLE 65 ASIA PACIFIC: BUBBLE GENERATOR MARKET, BY COUNTRY, 2024–2029 (USD MILLION)
  • TABLE 66 ASIA PACIFIC: BUBBLE GENERATOR MARKET, BY TYPE, 2020–2023 (USD MILLION)
  • TABLE 67 ASIA PACIFIC: BUBBLE GENERATOR MARKET, BY TYPE, 2024–2029 (USD MILLION)
  • TABLE 68 ASIA PACIFIC: BUBBLE GENERATOR MARKET, BY APPLICATION, 2020–2023 (USD MILLION)
  • TABLE 69 ASIA PACIFIC: BUBBLE GENERATOR MARKET, BY APPLICATION, 2024–2029 (USD MILLION)
  • TABLE 70 ASIA PACIFIC: BUBBLE GENERATOR MARKET, BY FUNCTION, 2020–2023 (USD MILLION)
  • TABLE 71 ASIA PACIFIC: BUBBLE GENERATOR MARKET, BY FUNCTION, 2024–2029 (USD MILLION)
  • TABLE 72 ASIA PACIFIC: BUBBLE GENERATOR MARKET, BY END USER, 2020–2023 (USD MILLION)
  • TABLE 73 ASIA PACIFIC: BUBBLE GENERATOR MARKET, BY END USER, 2024–2029 (USD MILLION)
  • TABLE 74 CHINA: BUBBLE GENERATOR MARKET, BY END USER, 2020–2023 (USD MILLION)
  • TABLE 75 CHINA: BUBBLE GENERATOR MARKET, BY END USER, 2024–2029 (USD MILLION)
  • TABLE 76 JAPAN: BUBBLE GENERATOR MARKET, BY END USER, 2020–2023 (USD MILLION)
  • TABLE 77 JAPAN: BUBBLE GENERATOR MARKET, BY END USER, 2024–2029 (USD MILLION)
  • TABLE 78 INDIA: BUBBLE GENERATOR MARKET, BY END USER, 2020–2023 (USD MILLION)
  • TABLE 79 INDIA: BUBBLE GENERATOR MARKET, BY END USER, 2024–2029 (USD MILLION)
  • TABLE 80 SOUTH KOREA: BUBBLE GENERATOR MARKET, BY END USER, 2020–2023 (USD MILLION)
  • TABLE 81 SOUTH KOREA: BUBBLE GENERATOR MARKET, BY END USER, 2024–2029 (USD MILLION)
  • TABLE 82 MALAYSIA: BUBBLE GENERATOR MARKET, BY END USER, 2020–2023 (USD MILLION)
  • TABLE 83 MALAYSIA: BUBBLE GENERATOR MARKET, BY END USER, 2024–2029 (USD MILLION)
  • TABLE 84 REST OF ASIA PACIFIC: BUBBLE GENERATOR MARKET, BY END USER, 2020–2023 (USD MILLION)
  • TABLE 85 REST OF ASIA PACIFIC: BUBBLE GENERATOR MARKET, BY END USER, 2024–2029 (USD MILLION)
  • TABLE 86 MIDDLE EAST & AFRICA: BUBBLE GENERATOR MARKET, BY COUNTRY, 2020–2023 (USD MILLION)
  • TABLE 87 MIDDLE EAST & AFRICA: BUBBLE GENERATOR MARKET, BY COUNTRY, 2024–2029 (USD MILLION)
  • TABLE 88 MIDDLE EAST & AFRICA: BUBBLE GENERATOR MARKET, BY TYPE, 2020–2023 (USD MILLION)
  • TABLE 89 MIDDLE EAST & AFRICA: BUBBLE GENERATOR MARKET, BY TYPE, 2024–2029 (USD MILLION)
  • TABLE 90 MIDDLE EAST & AFRICA: BUBBLE GENERATOR MARKET, BY APPLICATION, 2020–2023 (USD MILLION)
  • TABLE 91 MIDDLE EAST & AFRICA: BUBBLE GENERATOR MARKET, BY APPLICATION, 2024–2029 (USD MILLION)
  • TABLE 92 MIDDLE EAST & AFRICA: BUBBLE GENERATOR MARKET, BY FUNCTION, 2020–2023 (USD MILLION)
  • TABLE 93 MIDDLE EAST & AFRICA: BUBBLE GENERATOR MARKET, BY FUNCTION, 2024–2029 (USD MILLION)
  • TABLE 94 MIDDLE EAST & AFRICA: BUBBLE GENERATOR MARKET, BY END USER, 2020–2023 (USD MILLION)
  • TABLE 95 MIDDLE EAST & AFRICA: BUBBLE GENERATOR MARKET, BY END USER, 2024–2029 (USD MILLION)
  • TABLE 96 GCC: BUBBLE GENERATOR MARKET, BY END USER, 2020–2023 (USD MILLION)
  • TABLE 97 GCC: BUBBLE GENERATOR MARKET, BY END USER, 2024–2029 (USD MILLION)
  • TABLE 98 SAUDI ARABIA: BUBBLE GENERATOR MARKET, BY END USER, 2020–2023 (USD MILLION)
  • TABLE 99 SAUDI ARABIA: BUBBLE GENERATOR MARKET, BY END USER, 2024–2029 (USD MILLION)
  • TABLE 100 UAE: BUBBLE GENERATOR MARKET, BY END USER, 2020–2023 (USD MILLION)
  • TABLE 101 UAE: BUBBLE GENERATOR MARKET, BY END USER, 2024–2029 (USD MILLION)
  • TABLE 102 REST OF GCC: BUBBLE GENERATOR MARKET, BY END USER, 2020–2023 (USD MILLION)
  • TABLE 103 REST OF GCC: BUBBLE GENERATOR MARKET, BY END USER, 2024–2029 (USD MILLION)
  • TABLE 104 SOUTH AFRICA: BUBBLE GENERATOR MARKET, BY END USER, 2020–2023 (USD MILLION)
  • TABLE 105 SOUTH AFRICA: BUBBLE GENERATOR MARKET, BY END USER, 2024–2029 (USD MILLION)
  • TABLE 106 REST OF MIDDLE EAST & AFRICA: BUBBLE GENERATOR MARKET, BY END USER, 2020–2023 (USD MILLION)
  • TABLE 107 REST OF MIDDLE EAST & AFRICA: BUBBLE GENERATOR MARKET, BY END USER, 2024–2029 (USD MILLION)
  • TABLE 108 SOUTH AMERICA: BUBBLE GENERATOR MARKET, BY COUNTRY, 2020–2023 (USD MILLION)
  • TABLE 109 SOUTH AMERICA: BUBBLE GENERATOR MARKET, BY COUNTRY, 2024–2029 (USD MILLION)
  • TABLE 110 SOUTH AMERICA: BUBBLE GENERATOR MARKET, BY TYPE, 2020–2023 (USD MILLION)
  • TABLE 111 SOUTH AMERICA: BUBBLE GENERATOR MARKET, BY TYPE, 2024–2029 (USD MILLION)
  • TABLE 112 SOUTH AMERICA: BUBBLE GENERATOR MARKET, BY APPLICATION, 2020–2023 (USD MILLION)
  • TABLE 113 SOUTH AMERICA: BUBBLE GENERATOR MARKET, BY APPLICATION, 2024–2029 (USD MILLION)
  • TABLE 114 SOUTH AMERICA: BUBBLE GENERATOR MARKET, BY FUNCTION, 2020–2023 (USD MILLION)
  • TABLE 115 SOUTH AMERICA: BUBBLE GENERATOR MARKET, BY FUNCTION, 2024–2029 (USD MILLION)
  • TABLE 116 SOUTH AMERICA: BUBBLE GENERATOR MARKET, BY END USER, 2020–2023 (USD MILLION)
  • TABLE 117 SOUTH AMERICA: BUBBLE GENERATOR MARKET, BY END USER, 2024–2029 (USD MILLION)
  • TABLE 118 BRAZIL: BUBBLE GENERATOR MARKET, BY END USER, 2020–2023 (USD MILLION)
  • TABLE 119 BRAZIL: BUBBLE GENERATOR MARKET, BY END USER, 2024–2029 (USD MILLION)
  • TABLE 120 ARGENTINA: BUBBLE GENERATOR MARKET, BY END USER, 2020–2023 (USD MILLION)
  • TABLE 121 ARGENTINA: BUBBLE GENERATOR MARKET, BY END USER, 2024–2029 (USD MILLION)
  • TABLE 122 REST OF SOUTH AMERICA: BUBBLE GENERATOR MARKET, BY END USER, 2020–2023 (USD MILLION)
  • TABLE 123 REST OF SOUTH AMERICA: BUBBLE GENERATOR MARKET, BY END USER, 2024–2029 (USD MILLION)
  • TABLE 124 OVERVIEW OF STRATEGIES ADOPTED BY KEY PLAYERS IN BUBBLE GENERATOR MARKET BETWEEN 2020 AND 2024
  • TABLE 125 BUBBLE GENERATOR MARKET: DEGREE OF COMPETITION
  • TABLE 126 BUBBLE GENERATOR MARKET: TYPE FOOTPRINT
  • TABLE 127 BUBBLE GENERATOR MARKET: TECHNOLOGY FOOTPRINT
  • TABLE 128 BUBBLE GENERATOR MARKET: REGION FOOTPRINT
  • TABLE 129 BUBBLE GENERATOR MARKET: FUNCTION FOOTPRINT
  • TABLE 130 BUBBLE GENERATOR MARKET: END USER FOOTPRINT
  • TABLE 131 BUBBLE GENERATOR MARKET: KEY STARTUPS/SMES
  • TABLE 132 BUBBLE GENERATOR MARKET: COMPETITIVE BENCHMARKING OF STARTUPS/SMES
  • TABLE 133 BUBBLE GENERATOR MARKET: PRODUCT LAUNCHES, JANUARY 2O20–SEPTEMBER 2024
  • TABLE 134 BUBBLE GENERATOR MARKET: DEALS, JANUARY 2O20–SEPTEMBER 2024
  • TABLE 135 BUBBLE GENERATOR MARKET: EXPANSIONS, JANUARY 2O20–SEPTEMBER 2024
  • TABLE 136 ACNITI LLC: COMPANY OVERVIEW
  • TABLE 137 ACNITI LLC: PRODUCTS OFFERED
  • TABLE 138 ACNITI LLC: DEALS, JANUARY 2020–SEPTEMBER 2024
  • TABLE 139 MOLEAER INC.: COMPANY OVERVIEW
  • TABLE 140 MOLEAER INC.: PRODUCTS OFFERED
  • TABLE 141 MOLEAER INC.: SERVICES OFFERED
  • TABLE 142 MOLEAER INC.: PRODUCT LAUNCHES, JANUARY 2O20–SEPTEMBER 2024
  • TABLE 143 MOLEAER INC.: DEALS, JANUARY 2020−SEPTEMBER 2024
  • TABLE 144 MOLEAER INC.: EXPANSION, JANUARY 2020−SEPTEMBER 2024
  • TABLE 145 SHANDONG SUNDON TECHNOLOGY CO., LTD.: COMPANY OVERVIEW
  • TABLE 146 SHANDONG SUNDON TECHNOLOGY CO., LTD.: PRODUCTS OFFERED
  • TABLE 147 SHANDONG SUNDON TECHNOLOGY CO., LTD.: PRODUCT LAUNCHES, JANUARY 2O20–SEPTEMBER 2024
  • TABLE 148 PACIFIC WATER TECHNOLOGY: COMPANY OVERVIEW
  • TABLE 149 PACIFIC WATER TECHNOLOGY: PRODUCTS OFFERED
  • TABLE 150 AGRONA B.V.: COMPANY OVERVIEW
  • TABLE 151 AGRONA B.V.: PRODUCTS OFFERED
  • TABLE 152 FINE BUBBLE TECHNOLOGIES: COMPANY OVERVIEW
  • TABLE 153 FINE BUBBLE TECHNOLOGIES: PRODUCTS OFFERED
  • TABLE 154 FINE BUBBLE TECHNOLOGIES: EXPANSIONS, JANUARY 2020−SEPTEMBER 2024
  • TABLE 155 SHANGHAI MUTAO ENVIRONMENTAL TECHNOLOGY CO., LTD.: COMPANY OVERVIEW
  • TABLE 156 SHANGHAI MUTAO ENVIRONMENTAL TECHNOLOGY CO., LTD.: PRODUCTS OFFERED
  • TABLE 157 ALL-PUMPS PTY LTD.: COMPANY OVERVIEW
  • TABLE 158 ALL-PUMPS PTY LTD: PRODUCTS OFFERED
  • TABLE 159 NANOKRITI: COMPANY OVERVIEW
  • TABLE 160 NANOKRITI: PRODUCTS OFFERED
  • TABLE 161 NEWMANTECH CO. LTD.: COMPANY OVERVIEW
  • TABLE 162 NEWMANTECH CO. LTD.: PRODUCTS OFFERED
  • TABLE 163 TRIDENT BUBBLE TECHNOLOGIES LLC: COMPANY OVERVIEW
  • TABLE 164 ARMSTRONG INTERNATIONAL INC.: COMPANY OVERVIEW
  • TABLE 165 TAISEI KOGYO CO., LTD.: COMPANY OVERVIEW
  • TABLE 166 QINGDAO AOZENGNIER PURIFICATION EQUIPMENT CO., LTD.: COMPANY OVERVIEW
  • TABLE 167 GAIA WATER LTD. GAIA USA, INC.: COMPANY OVERVIEW
  • TABLE 168 RAPID WATER TECHNOLOGIES: COMPANY OVERVIEW
  • TABLE 169 AQUAB NANOBUBBLE INNOVATIONS LTD.: COMPANY OVERVIEW
  • TABLE 170 AIROXI TUBE: COMPANY OVERVIEW
  • TABLE 171 GASION AIRTEC PVT. LTD.: COMPANY OVERVIEW
  • TABLE 172 NANJING LANJIANG PROCESSING EQUIPMENTS CO., LTD.: COMPANY OVERVIEW
  • TABLE 173 ZHEJIANG JUBEI TECHNOLOGY GROUP SHARE CO., LTD.: COMPANY OVERVIEW
  • TABLE 174 DINO PURIFICATION EQUIPMENT(GUANGZHOU) CO., LTD.: COMPANY OVERVIEW
  • TABLE 175 HINODE SANGYO CO. LTD.: COMPANY OVERVIEW
  • TABLE 176 NIKUNI CORPORATION: COMPANY OVERVIEW
  • TABLE 177 SOLARI WATER: COMPANY OVERVIEW
LIST OF FIGURES
 
  • FIGURE 1 BUBBLE GENERATOR MARKET SEGMENTATION
  • FIGURE 2 BUBBLE GENERATOR MARKET: RESEARCH DESIGN
  • FIGURE 3 BUBBLE GENERATOR MARKET: BOTTOM-UP APPROACH
  • FIGURE 4 BUBBLE GENERATOR MARKET: TOP-DOWN APPROACH
  • FIGURE 5 BUBBLE GENERATOR MARKET: DATA TRIANGULATION
  • FIGURE 6 MICROBUBBLE SEGMENT TO ACCOUNT FOR LARGEST MARKET SHARE DURING FORECAST PERIOD
  • FIGURE 7 PRESSURE DISSOLUTION SEGMENT TO ACCOUNT FOR LARGEST MARKET SHARE DURING FORECAST PERIOD
  • FIGURE 8 FLOTATION SEGMENT TO ACCOUNT FOR LARGEST MARKET SHARE DURING FORECAST PERIOD
  • FIGURE 9 FOOD & BEVERAGE TO BE LARGEST END USER DURING FORECAST PERIOD
  • FIGURE 10 ASIA PACIFIC TO BE FASTEST-GROWING MARKET DURING FORECAST PERIOD
  • FIGURE 11 INCREASING DEMAND FROM INDUSTRIAL SECTOR TO DRIVE MARKET DURING FORECAST PERIOD
  • FIGURE 12 NANOBUBBLE SEGMENT TO REGISTER HIGHEST CAGR DURING FORECAST PERIOD
  • FIGURE 13 MIXED VAPOR CONDENSATION BY DIRECT CONTACT WITH COOLANT WATER SEGMENT TO WITNESS HIGHER GROWTH DURING FORECAST PERIOD
  • FIGURE 14 PARTICLE AGGREGATION & REMOVAL SEGMENT TO WITNESS HIGHER GROWTH DURING FORECAST PERIOD
  • FIGURE 15 AGRICULTURE & AQUACULTURE SEGMENT TO WITNESS HIGHEST CAGR DURING FORECAST PERIOD
  • FIGURE 16 INDIA TO REGISTER HIGHEST CAGR DURING FORECAST PERIOD
  • FIGURE 17 DRIVERS, RESTRAINTS, OPPORTUNITIES, AND CHALLENGES IN BUBBLE GENERATOR MARKET
  • FIGURE 18 PROPORTION OF SAFELY TREATED DOMESTIC WASTEWATER FLOWS 2022 (PERCENTAGE)
  • FIGURE 19 BUBBLE GENERATOR MARKET: PORTER’S FIVE FORCES ANALYSIS
  • FIGURE 20 INFLUENCE OF STAKEHOLDERS ON BUYING PROCESS, BY END-USE INDUSTRY
  • FIGURE 22 BUBBLE GENERATOR MARKET: VALUE CHAIN ANALYSIS
  • FIGURE 23 BUBBLE GENERATOR MARKET: ECOSYSTEM ANALYSIS
  • FIGURE 24 TRENDS/DISRUPTIONS IMPACTING CUSTOMER BUSINESS
  • FIGURE 25 IMPORT DATA RELATED TO HS CODE 842121-COMPLIANT PRODUCTS, BY KEY COUNTRY, 2019–2023 (USD THOUSAND)
  • FIGURE 26 EXPORT DATA RELATED TO HS CODE 842121-COMPLIANT PRODUCTS, BY KEY COUNTRY, 2020–2023 (USD THOUSAND)
  • FIGURE 27 INVESTMENT AND FUNDING SCENARIO (USD MILLION)
  • FIGURE 30 LEGAL STATUS OF PATENTS
  • FIGURE 32 APPLICANT ANALYSIS, 2014–2023
  • FIGURE 33 MICROBUBBLE TO ACCOUNT FOR LARGEST MARKET SHARE DURING FORECAST PERIOD
  • FIGURE 34 PRESSURE DISSOLUTION TO ACCOUNT FOR LARGEST MARKET SHARE DURING FORECAST PERIOD
  • FIGURE 35 FLOTATION TO ACCOUNT FOR LARGEST MARKET SHARE DURINGFORECAST PERIOD
  • FIGURE 36 WATER & WASTEWATER TREATMENT TO ACCOUNT FOR LARGEST MARKET SHARE
  • FIGURE 37 CHINA TO REGISTER HIGHEST CAGR DURING FORECAST PERIOD
  • FIGURE 38 NORTH AMERICA: BUBBLE GENERATOR MARKET SNAPSHOT
  • FIGURE 39 INDUSTRIAL SEGMENT TO GROW AT HIGHER CAGR IN EUROPE
  • FIGURE 40 ASIA PACIFIC: BUBBLE GENERATOR MARKET SNAPSHOT
  • FIGURE 41 REVENUE ANALYSIS OF KEY COMPANIES IN BUBBLE GENERATOR MARKET, 2023
  • FIGURE 42 SHARES OF LEADING COMPANIES IN BUBBLE GENERATOR MARKET, 2023
  • FIGURE 43 COMPANY VALUATION OF LEADING COMPANIES IN BUBBLE GENERATOR MARKET, 2023
  • FIGURE 44 FINANCIAL METRICS OF LEADING COMPANIES IN BUBBLE GENERATOR MARKET, 2023
  • FIGURE 45 BUBBLE GENERATOR MARKET: BRAND/PRODUCT COMPARISON
  • FIGURE 46 BUBBLE GENERATOR MARKET: COMPANY EVALUATION MATRIX (KEY PLAYERS), 2023
  • FIGURE 47 BUBBLE GENERATOR MARKET: COMPANY OVERALL FOOTPRINT
  • FIGURE 48 BUBBLE GENERATOR MARKET: COMPANY EVALUATION MATRIX (STARTUPS/SMES), 2023

The study involved four major activities in estimating the market size of the bubble generators market. Exhaustive secondary research was done to collect information on the market, the peer market, and the parent market. The next step was to validate these findings, assumptions, and sizing with industry experts across the value chain through primary research. Both top-down and bottom-up approaches were employed to estimate the complete market size. Thereafter, the market breakdown and data triangulation procedures were used to estimate the market size of the segments and subsegments.

Secondary Research

In the secondary research process, various secondary sources have been referred to for identifying and collecting information for this study. These secondary sources include annual reports, press releases, investor presentations of companies, white papers, certified publications, trade directories, certified publications, articles from recognized authors, gold standard and silver standard websites, and databases.

Secondary research has been used to obtain key information about the value chain of the industry, monetary chain of the market, the total pool of key bubble generators, market classification and segmentation according to industry trends to the bottom-most level, and regional markets. It was also used to obtain information about the key developments from a market-oriented perspective.

Primary Research

The bubble generators market comprises several stakeholders in the value chain, which include raw material suppliers, manufacturers, and end users. Various primary sources from the supply and demand sides of the bubble generators market have been interviewed to obtain qualitative and quantitative information. The primary interviewees from the demand side include key opinion leaders in end-use sectors. The primary sources from the supply side include manufacturers, associations, and institutions involved in the bubble generators industry.

Primary interviews were conducted to gather insights such as market statistics, data of revenue collected from the products and services, market breakdowns, market size estimations, market forecasting, and data triangulation. Primary research also helped in understanding the various trends related to type, technology, function, end-user, and region. Stakeholders from the demand side, such as CIOs, CTOs, and CSOs were interviewed to understand the buyer’s perspective on the suppliers, products, component providers, and their current usage of bubble generators and the future outlook of their business which will affect the overall market.

The breakdown of profiles of the primary interviewees is illustrated in the figure below:
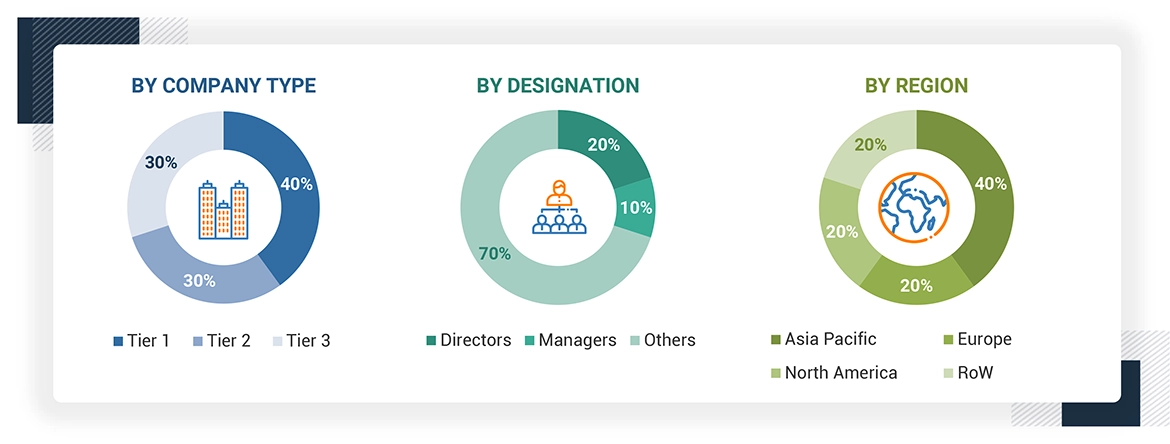
Note: Tier 1, Tier 2, and Tier 3 companies are classified based on their market revenue in 2023 available in the public domain, product portfolios, and geographical presence.

Other designations include sales representatives, production heads, and technicians.

To know about the assumptions considered for the study, download the pdf brochure

Market Size Estimation

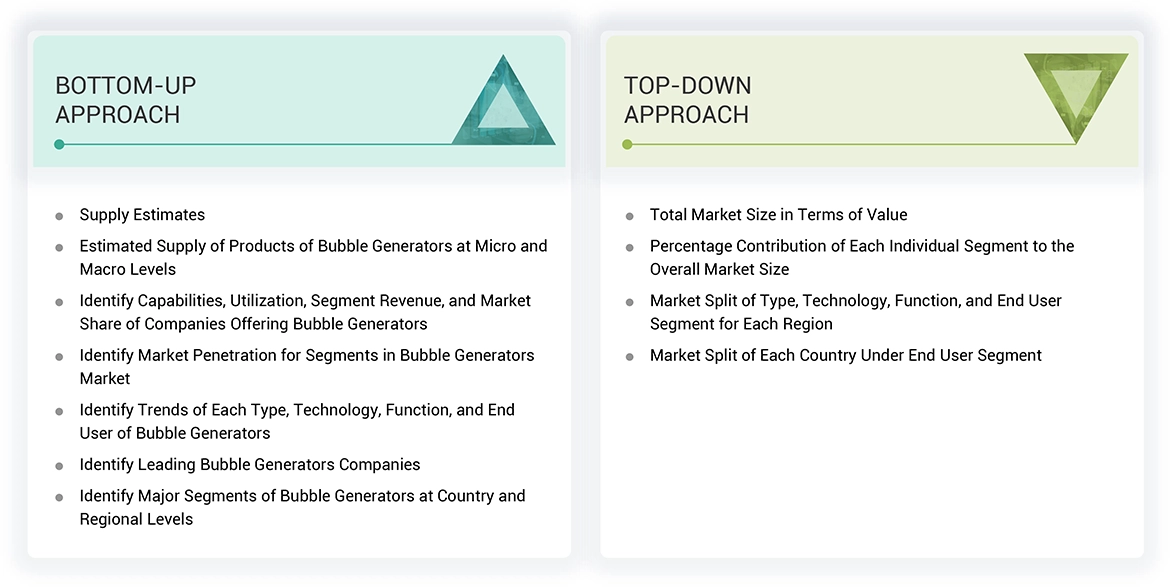
The top-down approach was used to estimate and validate the size of various submarkets for bubble generators for each region. The research methodology used to estimate the market size included the following steps:

  • The key players in the industry have been identified through extensive secondary research.
  • The supply chain of the industry has been determined through primary and secondary research.
  • The global market was then segmented into five major regions and validated by industry experts.
  • All percentage shares, splits, and breakdowns based on type, technology, function, end-user, and region were determined using secondary sources and verified through primary sources.
  • All possible parameters that affect the markets covered in this research study were accounted for, viewed in extensive detail, verified through primary research, and analyzed to get the final quantitative and qualitative data. This data was consolidated and added with detailed inputs and analysis and presented in this report.
Data Triangulation

After arriving at the total market size from the estimation process bubble generators above, the overall market has been split into several segments and sub-segments. To complete the overall market engineering process and arrive at the exact statistics for all the segments and sub-segments, the data triangulation and market breakdown procedures have been employed, wherever applicable. The data has been triangulated by studying various factors and trends from both the demand and supply sides. Along with this, the market size has been validated by using both the top-down and bottom-up approaches and primary interviews. Hence, for every data segment, there have been three sources—top-down approach, bottom-up approach, and expert interviews. The data was assumed correct when the values arrived from the three sources matched.

Market Definition

Bubble generators are machines that aim to create bubbles in the required sizes and characteristics for the most frequent uses: aeration, water purification, and energy extraction. They work on the premise where gas is compressed to form liquids that can improve physical, chemical as well as biological processes. That is why the technology of bubble generators has developed more than one type for use in various settings. Micro bubble generators create bubbles in the micron size range including 1-100 micron sizes and these small bubbles are suitable for aeration within the water treatment industry. Some of them are used in the field like aquaculture and wastewater treatment. Of these, the swirl type micro bubble generator is known for producing bubbles of a specific size with less complexity and with high efficiency. In contrast, nanobubble generators produce virtually tiny bubbles which aim at ranging between 70 and 120 nanometer size. The abovementioned THz nanobubbles have several unusual characteristics, including stability and neutral buoyancy, offering increased gaseous solubility in liquids. Some of uses are to increase the quality of water and enable chemical reactions to occur without the use of toxic agents.

Stakeholders

  • Bubble Generator Manufacturers
  • Bubble Generator Traders, Distributors, and Suppliers
  • Raw Type Suppliers
  • Government and Private Research Organizations
  • Associations and Industrial Bodies
  • R&D Institutions
  • Environmental Support Agencies

Report Objectives

  • To define, describe, and forecast the bubble generator market size in terms of value and volume
  • To provide detailed information regarding the drivers, restraints, opportunities, and challenges influencing the growth of the bubble generator market
  • To analyze and forecast the market by type, technology, function, end-user, and region
  • To describe and forecast the market with respect to five main regions: North America, Europe, Asia Pacific, South America, and the Middle East & Africa, along with their key countries
  • To analyze opportunities for stakeholders by identifying high-growth segments of the bubble generator market
  • To strategically analyze the ecosystem, Porter’s Five Forces, technology analysis, tariffs and regulations, patent landscape, trade landscape, key conferences and events, and case studies/use cases pertaining to the market under study
  • To strategically analyze micromarkets with respect to individual growth trends, prospects, and contributions to the overall market
  • To strategically profile the key players and comprehensively analyze their market positions in terms of their ranking and core competencies, along with detailing the competitive landscape for market leaders
  • To analyze competitive developments such as investments & expansions and mergers & acquisitions.

Previous Versions of this Report

"Our USP is "providing game-changing business opportunities reports with free customization" - so please feel free to provide us with your specific areas of interest / business challenges in much greater detail !!"

We appreciate your interest in this report. Once you fill out the form, you'll be immediately directed to an exclusive solution tailored to your needs. This high-value offering can help boost your revenue by 30% - a must-see opportunity for anyone looking to maximize growth.


By clicking the "Submit" button, you are agreeing to the Terms of Use and Privacy Policy.

Custom Market Research Services

We Will Customise The Research For You, In Case The Report Listed Above Does Not Meet With Your Requirements

Get 10% Free Customisation

Growth opportunities and latent adjacency in Bubble Generator Market

DMCA.com Protection Status