2
RESEARCH METHODOLOGY
42
5
MARKET OVERVIEW
Biosimulation market thrives on R&D investments and regulatory adoption despite standardization challenges.
65
5.2.1.1
INCREASING R&D INVESTMENTS IN PHARMACEUTICAL AND BIOTECHNOLOGY INDUSTRIES
5.2.1.2
GROWING ADOPTION OF BIOSIMULATION SOFTWARE BY REGULATORY BODIES
5.2.1.3
INTEGRATION OF TECHNOLOGICALLY ADVANCED QUANTITATIVE SYSTEMS PHARMACOLOGY (QSP)
5.2.1.4
NEED TO CURTAIL DRUG DISCOVERY AND DEVELOPMENT COSTS
5.2.1.5
GROWTH IN BIOLOGICS AND BIOSIMILARS MARKETS
5.2.2.1
LACK OF STANDARDIZATION
5.2.2.2
DATA AVAILABILITY AND QUALITY
5.2.3.1
EMERGING APPLICATIONS
5.2.3.2
USE OF BIOSIMULATION SOLUTIONS FOR PEDIATRIC DRUG DEVELOPMENT
5.2.4.1
DIFFICULTIES IN MATCHING COMPLEXITY OF BIOLOGICAL SYSTEMS AND PROCESSES
5.2.4.2
SHORTAGE OF BIOSIMULATION AND MODELING EXPERTS
5.3.2
PHARMACEUTICAL & BIOTECH COMPANIES
5.3.3
CONTRACT RESEARCH ORGANIZATIONS (CROS)
5.3.5
ACADEMIC & RESEARCH INSTITUTIONS
5.4.1
CASE STUDY 1: OPTIMIZING ASCIMINIB DEVELOPMENT THROUGH ADVANCED PBPK MODELING
5.4.2
CASE STUDY 2: COMPUTATIONAL DISCOVERY OF SELECTIVE WEE1 INHIBITORS FOR CANCER
5.4.3
CASE STUDY 3: EFFICIENT CLINICAL TRIAL UTILIZING SCALE MANAGEMENT EXPERTISE
5.6
PORTER'S FIVE FORCES ANALYSIS
5.6.1
BARGAINING POWER OF SUPPLIERS
5.6.2
BARGAINING POWER OF BUYERS
5.6.3
THREAT OF SUBSTITUTES
5.6.4
THREAT OF NEW ENTRANTS
5.6.5
INTENSITY OF COMPETITIVE RIVALRY
5.7.1
REGULATORY LANDSCAPE
5.7.1.5
MIDDLE EAST & AFRICA
5.7.2
REGULATORY BODIES, GOVERNMENT AGENCIES, AND OTHER ORGANIZATIONS
5.8.1
PATENT PUBLICATION TRENDS FOR BIOSIMULATION
5.8.2
JURISDICTION AND TOP APPLICANT ANALYSIS
5.9.1.1
MATHEMATICAL MODELING
5.9.1.2
SOFTWARE PLATFORMS
5.9.1.3
QUANTITATIVE SYSTEMS PHARMACOLOGY (QSP)
5.9.2
COMPLEMENTARY TECHNOLOGIES
5.9.2.2
MACHINE LEARNING AND AI
5.9.3
ADJACENT TECHNOLOGIES
5.10.1
DISCOVERY OF BIOMARKERS
5.10.2
ADOPTION IN PERSONALIZED MEDICINE
5.11.1
INDICATIVE PRICING ANALYSIS OF KEY PLAYERS, BY OFFERING, 2023
5.11.2
AVERAGE SELLING PRICE TREND, BY REGION (QUALITATIVE)
5.12
KEY CONFERENCES & EVENTS, 2024–2025
5.13
KEY STAKEHOLDERS & BUYING CRITERIA
5.14
TRENDS & DISRUPTIONS IMPACTING CUSTOMERS’ BUSINESSES
5.15.2
END-USER EXPECTATIONS
5.16
INVESTMENT AND FUNDING SCENARIO
5.17
IMPACT OF AI/GEN AI ON BIOSIMULATION MARKET
5.17.2
IMPACT OF AI/GEN AI ON INTERCONNECTED AND ADJACENT ECOSYSTEMS
5.17.2.2
BIOINFORMATICS MARKET
5.17.2.3
DRUG DISCOVERY SERVICES MARKET
5.17.2.4
DRUG DISCOVERY INFORMATICS MARKET
5.17.3
USER READINESS & IMPACT ASSESSMENT
5.17.3.1.1
PHARMACEUTICAL & BIOTECHNOLOGY COMPANIES
5.17.3.1.2
CONTRACT RESEARCH ORGANIZATIONS
5.17.3.2
IMPACT ASSESSMENT
5.17.3.2.1
USER A: PHARMACEUTICAL & BIOTECHNOLOGY COMPANIES
5.17.3.2.2
USER B: ACADEMIC & RESEARCH INSTITUTES
6
BIOSIMULATION MARKET, BY OFFERING
Market Size & Growth Rate Forecast Analysis to 2029 in USD Million | 17 Data Tables
98
6.2.1.1
MOLECULAR MODELING & SIMULATION SOFTWARE
6.2.1.1.1
GROWING IMPORTANCE OF MOLECULAR MODELING & SIMULATION IN DRUG DISCOVERY AND DEVELOPMENT TO ACCELERATE MARKET GROWTH
6.2.1.2
PK/PD MODELING & SIMULATION SOFTWARE
6.2.1.2.1
PIVOTAL ROLE IN EARLY DRUG DEVELOPMENT PHASE TO BOOST MARKET GROWTH
6.2.1.3
PBPK MODELING & SIMULATION SOFTWARE
6.2.1.3.1
WIDESPREAD USE BY REGULATORY BODIES TO DRIVE PBPK MODELING & SIMULATION SOFTWARE MARKET
6.2.1.4
TOXICITY PREDICTION SOFTWARE
6.2.1.4.1
PRESSING NEED FOR TOXICITY PREDICTION IN DRUG DISCOVERY AND DEVELOPMENT IS DRIVING THE MARKET
6.2.1.5
CLINICAL TRIAL SIMULATION SOFTWARE
6.2.1.5.1
HIGH FAILURE RATE OF CLINICAL TRIALS TO ACCELERATE GROWTH
6.2.1.6
OTHER BIOSIMULATION SOFTWARE
6.2.2
INTEGRATED SOFTWARE SUITES/PLATFORMS
6.2.2.1
NEED FOR EFFICIENT R&D TOOLS TO ACCELERATE GROWTH OF INTEGRATED PLATFORMS
6.3.1
CONSULTING & ADVISORY
6.3.1.1
NEED TO FOCUS ON CORE COMPETENCIES TO DRIVE NEED FOR CONSULTING & ADVISORY SERVICES
6.3.2
IMPLEMENTATION, TRAINING, AND SUPPORT
6.3.2.1
NEED FOR WELL-TRAINED PROFESSIONALS AND EXPERTS TO ACCELERATE MARKET GROWTH
6.3.3
DATA ANALYSIS & INTERPRETATION
6.3.3.1
ACCURATE AND PRECISE INTERPRETATION OF DATA TO DRIVE NEED FOR DATA ANALYSIS & INTERPRETATION SERVICES
7
BIOSIMULATION MARKET, BY APPLICATION
Market Size & Growth Rate Forecast Analysis to 2029 in USD Million | 26 Data Tables
114
7.2.1
TARGET IDENTIFICATION & VALIDATION
7.2.1.1
NEED FOR IDENTIFICATION OF OPTIMAL TARGETS IN DRUG DISCOVERY TO DRIVE MARKET
7.2.2
LEAD IDENTIFICATION & OPTIMIZATION
7.2.2.1
CRUCIAL ROLE IN FACILITATING VIABLE DRUG DISCOVERY TO ACCELERATE MARKET GROWTH
7.3.1
PRECLINICAL TESTING
7.3.1.1.1
CRITICAL ROLE OF PK/PD STUDIES IN DRUG DEVELOPMENT TO DRIVE MARKET
7.3.1.2.1
GROWING ROLE IN SELECTION OF POTENT DRUG MOLECULES TO BOOST MARKET GROWTH
7.3.2.1.1
GROWING NEED TO EASE DECISION-MAKING PROCESS TO DRIVE SEGMENTAL GROWTH
7.3.2.2.1
EFFICIENCY IN DOSE ASSESSMENT AND PRODUCT EFFICACY TO DRIVE GROWTH
7.3.2.3.1
NEED TO CURTAIL LARGE COSTS INVOLVED IN TRIALS TO PROPEL DEMAND
7.3.2.4
PHASE IV/POST-MARKETING SURVEILLANCE
7.3.2.4.1
ABILITY TO ASSIST RESEARCHERS IN PROCESS INNOVATION AND DECISION SUPPORT TO DRIVE ADOPTION
7.4.1
CAPABILITY TO PREDICT DISEASE DYNAMICS AND INFORM THERAPEUTIC STRATEGIES TO DRIVE MARKET GROWTH
7.5
MANUFACTURING & SUPPLY CHAIN MANAGEMENT
7.5.1
PRODUCTION PLANNING & OPTIMIZATION
7.5.1.1
NEED FOR PROPER PRODUCTION PLANNING AND EXECUTION TO DRIVE MARKET GROWTH
7.5.2
QUALITY CONTROL & PROCESS MONITORING
7.5.2.1
ADHERENCE TO MAINTAINING PRODUCT QUALITY TO FUEL MARKET GROWTH
7.5.3
DEMAND FORECASTING & INVENTORY MANAGEMENT
7.5.3.1
NEED TO FORECAST DEMAND EFFECTIVELY TO DRIVE MARKET GROWTH
7.5.4
RISK MANAGEMENT & CONTINGENCY PLANNING
7.5.4.1
NEED TO MAINTAIN OPERATIONAL CONTINUITY TO SUPPORT MARKET GROWTH
7.5.5
OTHER MANUFACTURING & SUPPLY CHAIN MANAGEMENT APPLICATIONS
8
BIOSIMULATION MARKET, BY THERAPEUTIC AREA
Market Size & Growth Rate Forecast Analysis to 2029 in USD Million | 6 Data Tables
138
8.2.1
HIGH PREVALENCE OF CANCER AND SHORTAGE OF EFFECTIVE CANCER DRUGS TO DRIVE MARKET GROWTH
8.3
CARDIOVASCULAR DISEASES
8.3.1
RISING NEED FOR DRUGS TO TREAT CARDIOVASCULAR DISEASES TO BOOST MARKET
8.4
NEUROLOGICAL DISORDERS
8.4.1
NEED TO BOOST DRUG DISCOVERY AND DEVELOPMENT FOR NEUROLOGICAL DISORDERS TO SUPPORT MARKET GROWTH
8.5.1
RISING EPIDEMIC OUTBREAKS TO BOOST DRUG DISCOVERY ACTIVITY
8.6
OTHER THERAPEUTIC AREAS
9
BIOSIMULATION MARKET, BY REVENUE MODEL
Market Size & Growth Rate Forecast Analysis to 2029 in USD Million | 5 Data Tables
145
9.2.1
LICENSE-BASED MODELS TO ACCOUNT FOR LARGEST SHARE OF MARKET
9.3
SUBSCRIPTION-BASED MODELS
9.3.1
SUBSCRIPTION-BASED MODELS TO REGISTER HIGHEST GROWTH RATE DURING FORECAST PERIOD
9.4.1
SPECIALIZED SIMULATION EXPERTISE WITH SERVICE-BASED MODELS TO SUPPORT ADOPTION
9.5.1
RISING DEMAND FOR FLEXIBLE BIOSIMULATION SOLUTIONS WITHOUT UPFRONT COSTS TO SUPPORT MARKET GROWTH
10
BIOSIMULATION MARKET, BY DEPLOYMENT MODEL
Market Size & Growth Rate Forecast Analysis to 2029 in USD Million | 4 Data Tables
151
10.2.1
OPTIMAL CONTROL ON DEPLOYMENT AND DATA BACKUP TO SUPPORT MARKET UPTAKE
10.3.1
CLOUD-BASED MODEL TO EXPERIENCE HIGHEST GROWTH RATE DURING FORECAST PERIOD
10.4.1
BALANCED CAPABILITIES OF HYBRID BIOSIMULATION MODELS TO ACCELERATE ADOPTION
11
BIOSIMULATION MARKET, BY END USER
Market Size & Growth Rate Forecast Analysis to 2029 in USD Million | 6 Data Tables
156
11.2
PHARMACEUTICAL & BIOTECHNOLOGY COMPANIES
11.2.1
INCREASING R&D EXPENDITURE FOR DRUG DISCOVERY AND DEVELOPMENT TO DRIVE MARKET
11.3
CONTRACT RESEARCH ORGANIZATIONS
11.3.1
RISING OUTSOURCING OF CLINICAL TRIAL ACTIVITIES TO CROS BY PHARMACEUTICAL COMPANIES TO DRIVE MARKET
11.4
ACADEMIC & RESEARCH INSTITUTES
11.4.1
FAVORABLE GOVERNMENT SUPPORT FOR RESEARCH TO SUPPORT MARKET GROWTH
11.5.1
GROWING USAGE OF BIOSIMULATION SOFTWARE FOR CLINICAL TRIAL EFFICACY TO PROPEL MARKET GROWTH
12
BIOSIMULATION MARKET, BY REGION
Comprehensive coverage of 8 Regions with country-level deep-dive of 12 Countries | 314 Data Tables.
163
12.2.1
MACROECONOMIC OUTLOOK FOR NORTH AMERICA
12.2.2.1
RISING GOVERNMENT FUNDING FOR PHARMACEUTICAL R&D TO DRIVE MARKET
12.2.3.1
INCREASING FUNDING BY CANADIAN GOVERNMENT IN HEALTHCARE TO DRIVE MARKET
12.3.1
MACROECONOMIC OUTLOOK FOR EUROPE
12.3.2.1
HIGH NUMBER OF SPONSORED CLINICAL TRIALS TO DRIVE UPTAKE OF BIOSIMULATION
12.3.3.1
INVESTMENTS BY PHARMACEUTICAL SPONSORS FOR DRUG DISCOVERY SERVICES TO BOOST MARKET
12.3.4.1
GROWING R&D PIPELINE FOR CLINICAL TRIALS TO DRIVE MARKET
12.3.5.1
INCREASING GOVERNMENT FUNDS AND FAVORABLE REGULATORY SCENARIOS TO FUEL UPTAKE
12.3.6.1
ESTABLISHED NETWORK OF RESEARCH CENTERS TO PROPEL MARKET
12.4.1
MACROECONOMIC OUTLOOK FOR ASIA PACIFIC
12.4.2.1
LOW COST OF DRUG DEVELOPMENT AND LARGE PHARMACEUTICAL R&D BASE TO DRIVE MARKET
12.4.3.1
GROWING PHARMACEUTICAL INDUSTRY TO FUEL UPTAKE OF BIOSIMULATION
12.4.4.1
ESTABLISHED DRUG DEVELOPMENT INFRASTRUCTURE AND BIOMEDICAL RESEARCH CAPABILITIES TO SUPPORT MARKET GROWTH
12.4.5
REST OF ASIA PACIFIC
12.5.1
MACROECONOMIC OUTLOOK FOR LATIN AMERICA
12.5.2.1
ADVANCING BIOSIMULATION IN REGION TO SUPPORT MARKET GROWTH
12.5.3.1
GOVERNMENT INITIATIVES TO ENHANCE DIGITAL HEALTH TO PROPEL MARKET GROWTH
12.5.4
REST OF LATIN AMERICA
12.6
MIDDLE EAST & AFRICA
12.6.1
MACROECONOMIC OUTLOOK FOR MIDDLE EAST & AFRICA
12.6.2.1
INCREASE IN HEALTHCARE INVESTMENTS TO SUPPORT MARKET GROWTH
12.6.3
REST OF MIDDLE EAST & AFRICA
13
COMPETITIVE LANDSCAPE
Discover market dominance shifts and strategic maneuvers shaping the biosimulation competitive landscape.
291
13.2
KEY PLAYER STRATEGY/RIGHT TO WIN
13.2.1
OVERVIEW OF STRATEGIES ADOPTED BY PLAYERS IN BIOSIMULATION MARKET
13.3
REVENUE ANALYSIS, 2019–2023
13.4
MARKET SHARE ANALYSIS, 2023
13.5
RANKING OF KEY MARKET PLAYERS
13.6
COMPANY EVALUATION MATRIX: KEY PLAYERS, 2023
13.6.5
COMPANY FOOTPRINT: KEY PLAYERS, 2023
13.6.5.1
COMPANY FOOTPRINT
13.6.5.2
OFFERING FOOTPRINT
13.6.5.3
APPLICATION FOOTPRINT
13.6.5.4
END-USER FOOTPRINT
13.6.5.5
REGION FOOTPRINT
13.7
COMPANY EVALUATION MATRIX: START-UP/SMES, 2023
13.7.1
PROGRESSIVE COMPANIES
13.7.2
RESPONSIVE COMPANIES
13.7.5
COMPETITIVE BENCHMARKING: STARTUPS/SMES, 2023
13.8
COMPANY EVALUATION AND FINANCIAL METRICS, 2025
13.9
BRAND/PRODUCT COMPARISON
13.10
COMPETITIVE SCENARIO
13.10.1
PRODUCT LAUNCHES & ENHANCEMENTS
13.10.4
OTHER DEVELOPMENTS
14
COMPANY PROFILES
In-depth Company Profiles of Leading Market Players with detailed Business Overview, Product and Service Portfolio, Recent Developments, and Unique Analyst Perspective (MnM View)
313
14.1.1.1
BUSINESS OVERVIEW
14.1.1.2
PRODUCTS & SERVICES OFFERED
14.1.1.3
RECENT DEVELOPMENTS
14.1.1.3.1
PRODUCT LAUNCHES & ENHANCEMENTS
14.1.1.3.3
OTHER DEVELOPMENTS
14.1.1.4.2
STRATEGIC CHOICES
14.1.1.4.3
WEAKNESSES & COMPETITIVE THREATS
14.1.5
ADVANCED CHEMISTRY DEVELOPMENT, INC.
14.1.6
CHEMICAL COMPUTING GROUP ULC
14.1.8
GENEDATA AG (A DANAHER COMPANY)
14.1.10
IN SILICO BIOSCIENCES
14.1.12
OPENEYE, CADENCE MOLECULAR SCIENCES
14.1.13
CELLWORKS GROUP, INC.
14.1.16
CHARNWOOD DISCOVERY
14.1.17
THE MATHWORKS, INC.
14.2
START-UP/SME PLAYERS
14.2.1
INSTEM GROUP OF COMPANIES
14.2.3
SCM – SOFTWARE CHEMISTRY & MATERIALS
14.2.4
BIOSYMETRICS, INC.
15.2
KNOWLEDGESTORE: MARKETSANDMARKETS’ SUBSCRIPTION PORTAL
15.3
CUSTOMIZATION OPTIONS
TABLE 1
BIOSIMULATION MARKET: ROLE OF COMPANIES IN ECOSYSTEM
TABLE 2
BIOSIMULATION MARKET: PORTER’S FIVE FORCES
TABLE 3
NORTH AMERICA: LIST OF REGULATORY BODIES, GOVERNMENT AGENCIES, AND OTHER ORGANIZATIONS
TABLE 4
EUROPE: LIST OF REGULATORY BODIES, GOVERNMENT AGENCIES, AND OTHER ORGANIZATIONS
TABLE 5
ASIA PACIFIC: LIST OF REGULATORY BODIES, GOVERNMENT AGENCIES, AND OTHER ORGANIZATIONS
TABLE 6
LATIN AMERICA: LIST OF REGULATORY BODIES, GOVERNMENT AGENCIES, AND OTHER ORGANIZATIONS
TABLE 7
MIDDLE EAST & AFRICA: LIST OF REGULATORY BODIES, GOVERNMENT AGENCIES, AND OTHER ORGANIZATIONS
TABLE 8
INDICATIVE PRICING ANALYSIS OF KEY PLAYERS, BY OFFERING
TABLE 9
BIOSIMULATION MARKET: KEY CONFERENCES AND EVENTS, 2024–2025
TABLE 10
INFLUENCE OF STAKEHOLDERS ON BUYING PROCESS OF TOP 3 END USERS (%)
TABLE 11
KEY BUYING CRITERIA FOR TOP 3 END USERS
TABLE 12
UNMET NEEDS IN BIOSIMULATION MARKET
TABLE 13
END-USER EXPECTATIONS IN BIOSIMULATION MARKET
TABLE 14
BIOSIMULATION MARKET, BY OFFERING, 2022–2029 (USD MILLION)
TABLE 15
BIOSIMULATION SOFTWARE MARKET, BY TYPE, 2022–2029 (USD MILLION)
TABLE 16
BIOSIMULATION SOFTWARE MARKET, BY COUNTRY, 2022–2029 (USD MILLION)
TABLE 17
BIOSIMULATION MARKET FOR STANDALONE MODULES, BY TYPE, 2022–2029 (USD MILLION)
TABLE 18
BIOSIMULATION MARKET FOR STANDALONE MODULES, BY COUNTRY, 2022–2029 (USD MILLION)
TABLE 19
BIOSIMULATION MARKET FOR MOLECULAR MODELING & SIMULATION SOFTWARE, BY COUNTRY, 2022–2029 (USD MILLION)
TABLE 20
BIOSIMULATION MARKET FOR PK/PD MODELING & SIMULATION SOFTWARE, BY COUNTRY, 2022–2029 (USD MILLION)
TABLE 21
BIOSIMULATION MARKET FOR PBPK MODELING & SIMULATION SOFTWARE, BY COUNTRY, 2022–2029 (USD MILLION)
TABLE 22
BIOSIMULATION MARKET FOR TOXICITY PREDICTION SOFTWARE, BY COUNTRY, 2022–2029 (USD MILLION)
TABLE 23
BIOSIMULATION MARKET FOR CLINICAL TRIAL SIMULATION SOFTWARE, BY COUNTRY, 2022–2029 (USD MILLION)
TABLE 24
BIOSIMULATION MARKET FOR OTHER BIOSIMULATION SOFTWARE, BY COUNTRY, 2022–2029 (USD MILLION)
TABLE 25
BIOSIMULATION MARKET FOR INTEGRATED SOFTWARE SUITES/PLATFORMS, BY COUNTRY, 2022–2029 (USD MILLION)
TABLE 26
BIOSIMULATION SERVICES MARKET, BY TYPE, 2022–2029 (USD MILLION)
TABLE 27
BIOSIMULATION SERVICES MARKET, BY COUNTRY, 2022–2029 (USD MILLION)
TABLE 28
BIOSIMULATION MARKET FOR CONSULTING & ADVISORY SERVICES, BY COUNTRY, 2022–2029 (USD MILLION)
TABLE 29
BIOSIMULATION MARKET FOR IMPLEMENTATION, TRAINING, AND SUPPORT SERVICES, BY COUNTRY, 2022–2029 (USD MILLION)
TABLE 30
BIOSIMULATION MARKET FOR DATA ANALYSIS & INTERPRETATION SERVICES, BY COUNTRY, 2022–2029 (USD MILLION)
TABLE 31
BIOSIMULATION MARKET, BY APPLICATION, 2022–2029 (USD MILLION)
TABLE 32
BIOSIMULATION MARKET FOR DRUG DISCOVERY APPLICATIONS, BY TYPE, 2022–2029 (USD MILLION)
TABLE 33
BIOSIMULATION MARKET FOR DRUG DISCOVERY APPLICATIONS, BY COUNTRY, 2022–2029 (USD MILLION)
TABLE 34
BIOSIMULATION MARKET FOR TARGET IDENTIFICATION & VALIDATION, BY COUNTRY, 2022–2029 (USD MILLION)
TABLE 35
BIOSIMULATION MARKET FOR LEAD IDENTIFICATION & OPTIMIZATION, BY COUNTRY, 2022–2029 (USD MILLION)
TABLE 36
BIOSIMULATION MARKET FOR DRUG DEVELOPMENT APPLICATIONS, BY TYPE, 2022–2029 (USD MILLION)
TABLE 37
BIOSIMULATION MARKET FOR DRUG DEVELOPMENT APPLICATIONS, BY COUNTRY, 2022–2029 (USD MILLION)
TABLE 38
BIOSIMULATION MARKET FOR PRECLINICAL TESTING, BY TYPE, 2022–2029 (USD MILLION)
TABLE 39
BIOSIMULATION MARKET FOR PRECLINICAL TESTING, BY COUNTRY, 2022–2029 (USD MILLION)
TABLE 40
BIOSIMULATION MARKET FOR PK/PD, BY COUNTRY, 2022–2029 (USD MILLION)
TABLE 41
BIOSIMULATION MARKET FOR ADME/TOXICOLOGY, BY COUNTRY, 2022–2029 (USD MILLION)
TABLE 42
BIOSIMULATION MARKET FOR CLINICAL TRIALS, BY TYPE, 2022–2029 (USD MILLION)
TABLE 43
BIOSIMULATION MARKET FOR CLINICAL TRIALS, BY COUNTRY, 2022–2029 (USD MILLION)
TABLE 44
BIOSIMULATION MARKET FOR PHASE I CLINICAL TRIALS, BY COUNTRY, 2022–2029 (USD MILLION)
TABLE 45
BIOSIMULATION MARKET FOR PHASE II CLINICAL TRIALS, BY COUNTRY, 2022–2029 (USD MILLION)
TABLE 46
BIOSIMULATION MARKET FOR PHASE III CLINICAL TRIALS, BY COUNTRY, 2022–2029 (USD MILLION)
TABLE 47
BIOSIMULATION MARKET FOR PHASE IV/POST-MARKETING SURVEILLANCE, BY COUNTRY, 2022–2029 (USD MILLION)
TABLE 48
BIOSIMULATION MARKET FOR DISEASE MODELING APPLICATIONS, BY COUNTRY, 2022–2029 (USD MILLION)
TABLE 49
BIOSIMULATION MARKET FOR MANUFACTURING & SUPPLY CHAIN MANAGEMENT APPLICATIONS, BY TYPE, 2022–2029 (USD MILLION)
TABLE 50
BIOSIMULATION MARKET FOR MANUFACTURING & SUPPLY CHAIN MANAGEMENT APPLICATIONS, BY COUNTRY, 2022–2029 (USD MILLION)
TABLE 51
BIOSIMULATION MARKET FOR PRODUCTION PLANNING & OPTIMIZATION, BY COUNTRY, 2022–2029 (USD MILLION)
TABLE 52
BIOSIMULATION MARKET FOR QUALITY CONTROL & PROCESS MONITORING, BY COUNTRY, 2022–2029 (USD MILLION)
TABLE 53
BIOSIMULATION MARKET FOR DEMAND FORECASTING & INVENTORY MANAGEMENT, BY COUNTRY, 2022–2029 (USD MILLION)
TABLE 54
BIOSIMULATION MARKET FOR RISK MANAGEMENT & CONTINGENCY PLANNING, BY COUNTRY, 2022–2029 (USD MILLION)
TABLE 55
BIOSIMULATION MARKET FOR OTHER MANUFACTURING & SUPPLY CHAIN MANAGEMENT APPLICATIONS, BY COUNTRY, 2022–2029 (USD MILLION)
TABLE 56
BIOSIMULATION MARKET FOR OTHER APPLICATIONS, BY COUNTRY, 2022–2029 (USD MILLION)
TABLE 57
BIOSIMULATION MARKET, BY THERAPEUTIC AREA, 2022–2029 (USD MILLION)
TABLE 58
BIOSIMULATION MARKET FOR ONCOLOGY, BY COUNTRY, 2022–2029 (USD MILLION)
TABLE 59
BIOSIMULATION MARKET FOR CARDIOVASCULAR DISEASES, BY COUNTRY, 2022–2029 (USD MILLION)
TABLE 60
BIOSIMULATION MARKET FOR NEUROLOGICAL DISORDERS, BY COUNTRY, 2022–2029 (USD MILLION)
TABLE 61
BIOSIMULATION MARKET FOR INFECTIOUS DISEASES, BY COUNTRY, 2022–2029 (USD MILLION)
TABLE 62
BIOSIMULATION MARKET FOR OTHER THERAPEUTIC AREAS, BY COUNTRY, 2022–2029 (USD MILLION)
TABLE 63
BIOSIMULATION MARKET, BY REVENUE MODEL, 2022–2029 (USD MILLION)
TABLE 64
BIOSIMULATION MARKET FOR LICENSE-BASED MODELS, BY COUNTRY, 2022–2029 (USD MILLION)
TABLE 65
BIOSIMULATION MARKET FOR SUBSCRIPTION-BASED MODELS, BY COUNTRY, 2022–2029 (USD MILLION)
TABLE 66
BIOSIMULATION MARKET FOR SERVICE-BASED MODELS, BY COUNTRY, 2022–2029 (USD MILLION)
TABLE 67
BIOSIMULATION MARKET FOR PAY-PER-USE MODELS, BY COUNTRY, 2022–2029 (USD MILLION)
TABLE 68
BIOSIMULATION MARKET, BY DEPLOYMENT MODEL, 2022–2029 (USD MILLION)
TABLE 69
BIOSIMULATION MARKET FOR ON-PREMISE MODELS, BY COUNTRY, 2022–2029 (USD MILLION)
TABLE 70
BIOSIMULATION MARKET FOR CLOUD-BASED MODELS, BY COUNTRY, 2022–2029 (USD MILLION)
TABLE 71
BIOSIMULATION MARKET FOR HYBRID MODELS, BY COUNTRY, 2022–2029 (USD MILLION)
TABLE 72
BIOSIMULATION MARKET, BY END USER, 2022–2029 (USD MILLION)
TABLE 73
BIOSIMULATION MARKET FOR PHARMACEUTICAL & BIOTECHNOLOGY COMPANIES, BY COUNTRY, 2022–2029 (USD MILLION)
TABLE 74
BIOSIMULATION MARKET FOR CONTRACT RESEARCH ORGANIZATIONS, BY COUNTRY, 2022–2029 (USD MILLION)
TABLE 75
BIOSIMULATION MARKET FOR ACADEMIC & RESEARCH INSTITUTES, BY COUNTRY, 2022–2029 (USD MILLION)
TABLE 76
BIOSIMULATION MARKET FOR REGULATORY BODIES, BY COUNTRY, 2022–2029 (USD MILLION)
TABLE 77
BIOSIMULATION MARKET FOR OTHER END USERS, BY COUNTRY, 2022–2029 (USD MILLION)
TABLE 78
BIOSIMULATION MARKET, BY REGION, 2022–2029 (USD MILLION)
TABLE 79
NORTH AMERICA: BIOSIMULATION MARKET, BY COUNTRY, 2022–2029 (USD MILLION)
TABLE 80
NORTH AMERICA: BIOSIMULATION MARKET, BY OFFERING, 2022–2029 (USD MILLION)
TABLE 81
NORTH AMERICA: BIOSIMULATION SOFTWARE MARKET, BY TYPE, 2022–2029 (USD MILLION)
TABLE 82
NORTH AMERICA: BIOSIMULATION MARKET FOR STANDALONE MODULES, BY TYPE, 2022–2029 (USD MILLION)
TABLE 83
NORTH AMERICA: BIOSIMULATION SERVICES MARKET, BY TYPE, 2022–2029 (USD MILLION)
TABLE 84
NORTH AMERICA: BIOSIMULATION MARKET, BY APPLICATION, 2022–2029 (USD MILLION)
TABLE 85
NORTH AMERICA: BIOSIMULATION MARKET FOR DRUG DISCOVERY APPLICATIONS, BY TYPE, 2022–2029 (USD MILLION)
TABLE 86
NORTH AMERICA: BIOSIMULATION MARKET FOR DRUG DEVELOPMENT APPLICATIONS, BY TYPE, 2022–2029 (USD MILLION)
TABLE 87
NORTH AMERICA: BIOSIMULATION MARKET FOR PRECLINICAL TESTING, BY TYPE, 2022–2029 (USD MILLION)
TABLE 88
NORTH AMERICA: BIOSIMULATION MARKET FOR CLINICAL TRIALS, BY TYPE, 2022–2029 (USD MILLION)
TABLE 89
NORTH AMERICA: BIOSIMULATION MARKET FOR MANUFACTURING & SUPPLY CHAIN MANAGEMENT APPLICATIONS, BY TYPE, 2022–2029 (USD MILLION)
TABLE 90
NORTH AMERICA: BIOSIMULATION MARKET, BY THERAPEUTIC AREA, 2022–2029 (USD MILLION)
TABLE 91
NORTH AMERICA: BIOSIMULATION MARKET, BY REVENUE MODEL, 2022–2029 (USD MILLION)
TABLE 92
NORTH AMERICA: BIOSIMULATION MARKET, BY DEPLOYMENT MODEL, 2022–2029 (USD MILLION)
TABLE 93
NORTH AMERICA: BIOSIMULATION MARKET, BY END USER, 2022–2029 (USD MILLION)
TABLE 94
US: BIOSIMULATION MARKET, BY OFFERING, 2022–2029 (USD MILLION)
TABLE 95
US: BIOSIMULATION SOFTWARE MARKET, BY TYPE, 2022–2029 (USD MILLION)
TABLE 96
US: BIOSIMULATION MARKET FOR STANDALONE MODULES, BY TYPE, 2022–2029 (USD MILLION)
TABLE 97
US: BIOSIMULATION SERVICES MARKET, BY TYPE, 2022–2029 (USD MILLION)
TABLE 98
US: BIOSIMULATION MARKET, BY APPLICATION, 2022–2029 (USD MILLION)
TABLE 99
US: BIOSIMULATION MARKET FOR DRUG DISCOVERY APPLICATIONS, BY TYPE, 2022–2029 (USD MILLION)
TABLE 100
US: BIOSIMULATION MARKET FOR DRUG DEVELOPMENT APPLICATIONS, BY TYPE, 2022–2029 (USD MILLION)
TABLE 101
US: BIOSIMULATION MARKET FOR PRECLINICAL TESTING, BY TYPE, 2022–2029 (USD MILLION)
TABLE 102
US: BIOSIMULATION MARKET FOR CLINICAL TRIALS, BY TYPE, 2022–2029 (USD MILLION)
TABLE 103
US: BIOSIMULATION MARKET FOR MANUFACTURING & SUPPLY CHAIN MANAGEMENT APPLICATIONS, BY TYPE, 2022–2029 (USD MILLION)
TABLE 104
US: BIOSIMULATION MARKET, BY THERAPEUTIC AREA, 2022–2029 (USD MILLION)
TABLE 105
US: BIOSIMULATION MARKET, BY REVENUE MODEL, 2022–2029 (USD MILLION)
TABLE 106
US: BIOSIMULATION MARKET, BY DEPLOYMENT MODEL, 2022–2029 (USD MILLION)
TABLE 107
US: BIOSIMULATION MARKET, BY END USER, 2022–2029 (USD MILLION)
TABLE 108
CANADA: BIOSIMULATION MARKET, BY OFFERING, 2022–2029 (USD MILLION)
TABLE 109
CANADA: BIOSIMULATION SOFTWARE MARKET, BY TYPE, 2022–2029 (USD MILLION)
TABLE 110
CANADA: BIOSIMULATION MARKET FOR STANDALONE MODULES, BY TYPE, 2022–2029 (USD MILLION)
TABLE 111
CANADA: BIOSIMULATION SERVICES MARKET, BY TYPE, 2022–2029 (USD MILLION)
TABLE 112
CANADA: BIOSIMULATION MARKET, BY APPLICATION, 2022–2029 (USD MILLION)
TABLE 113
CANADA: BIOSIMULATION MARKET FOR DRUG DISCOVERY APPLICATIONS, BY TYPE, 2022–2029 (USD MILLION)
TABLE 114
CANADA: BIOSIMULATION MARKET FOR DRUG DEVELOPMENT APPLICATIONS, BY TYPE, 2022–2029 (USD MILLION)
TABLE 115
CANADA: BIOSIMULATION MARKET FOR PRECLINICAL TESTING, BY TYPE, 2022–2029 (USD MILLION)
TABLE 116
CANADA: BIOSIMULATION MARKET FOR CLINICAL TRIALS, BY TYPE, 2022–2029 (USD MILLION)
TABLE 117
CANADA: BIOSIMULATION MARKET FOR MANUFACTURING & SUPPLY CHAIN MANAGEMENT APPLICATIONS, BY TYPE, 2022–2029 (USD MILLION)
TABLE 118
CANADA: BIOSIMULATION MARKET, BY THERAPEUTIC AREA, 2022–2029 (USD MILLION)
TABLE 119
CANADA: BIOSIMULATION MARKET, BY REVENUE MODEL, 2022–2029 (USD MILLION)
TABLE 120
CANADA: BIOSIMULATION MARKET, BY DEPLOYMENT MODEL, 2022–2029 (USD MILLION)
TABLE 121
CANADA: BIOSIMULATION MARKET, BY END USER, 2022–2029 (USD MILLION)
TABLE 122
EUROPE: BIOSIMULATION MARKET, BY COUNTRY, 2022–2029 (USD MILLION)
TABLE 123
EUROPE: BIOSIMULATION MARKET, BY OFFERING, 2022–2029 (USD MILLION)
TABLE 124
EUROPE: BIOSIMULATION SOFTWARE MARKET, BY TYPE, 2022–2029 (USD MILLION)
TABLE 125
EUROPE: BIOSIMULATION MARKET FOR STANDALONE MODULES, BY TYPE, 2022–2029 (USD MILLION)
TABLE 126
EUROPE: BIOSIMULATION SERVICES MARKET, BY TYPE, 2022–2029 (USD MILLION)
TABLE 127
EUROPE: BIOSIMULATION MARKET, BY APPLICATION, 2022–2029 (USD MILLION)
TABLE 128
EUROPE: BIOSIMULATION MARKET FOR DRUG DISCOVERY APPLICATIONS, BY TYPE, 2022–2029 (USD MILLION)
TABLE 129
EUROPE: BIOSIMULATION MARKET FOR DRUG DEVELOPMENT APPLICATIONS, BY TYPE, 2022–2029 (USD MILLION)
TABLE 130
EUROPE: BIOSIMULATION MARKET FOR PRECLINICAL TESTING, BY TYPE, 2022–2029 (USD MILLION)
TABLE 131
EUROPE: BIOSIMULATION MARKET FOR CLINICAL TRIALS, BY TYPE, 2022–2029 (USD MILLION)
TABLE 132
EUROPE: BIOSIMULATION MARKET FOR MANUFACTURING & SUPPLY CHAIN MANAGEMENT APPLICATIONS, BY TYPE, 2022–2029 (USD MILLION)
TABLE 133
EUROPE: BIOSIMULATION MARKET, BY THERAPEUTIC AREA, 2022–2029 (USD MILLION)
TABLE 134
EUROPE: BIOSIMULATION MARKET, BY REVENUE MODEL, 2022–2029 (USD MILLION)
TABLE 135
EUROPE: BIOSIMULATION MARKET, BY DEPLOYMENT MODEL, 2022–2029 (USD MILLION)
TABLE 136
EUROPE: BIOSIMULATION MARKET, BY END USER, 2022–2029 (USD MILLION)
TABLE 137
GERMANY: BIOSIMULATION MARKET, BY OFFERING, 2022–2029 (USD MILLION)
TABLE 138
GERMANY: BIOSIMULATION SOFTWARE MARKET, BY TYPE, 2022–2029 (USD MILLION)
TABLE 139
GERMANY: BIOSIMULATION MARKET FOR STANDALONE MODULES, BY TYPE, 2022–2029 (USD MILLION)
TABLE 140
GERMANY: BIOSIMULATION SERVICES MARKET, BY TYPE, 2022–2029 (USD MILLION)
TABLE 141
GERMANY: BIOSIMULATION MARKET, BY APPLICATION, 2022–2029 (USD MILLION)
TABLE 142
GERMANY: BIOSIMULATION MARKET FOR DRUG DISCOVERY APPLICATIONS, BY TYPE, 2022–2029 (USD MILLION)
TABLE 143
GERMANY: BIOSIMULATION MARKET FOR DRUG DEVELOPMENT APPLICATIONS, BY TYPE, 2022–2029 (USD MILLION)
TABLE 144
GERMANY: BIOSIMULATION MARKET FOR PRECLINICAL TESTING, BY TYPE, 2022–2029 (USD MILLION)
TABLE 145
GERMANY: BIOSIMULATION MARKET FOR CLINICAL TRIALS, BY TYPE, 2022–2029 (USD MILLION)
TABLE 146
GERMANY: BIOSIMULATION MARKET FOR MANUFACTURING & SUPPLY CHAIN MANAGEMENT APPLICATIONS, BY TYPE, 2022–2029 (USD MILLION)
TABLE 147
GERMANY: BIOSIMULATION MARKET, BY THERAPEUTIC AREA, 2022–2029 (USD MILLION)
TABLE 148
GERMANY: BIOSIMULATION MARKET, BY REVENUE MODEL, 2022–2029 (USD MILLION)
TABLE 149
GERMANY: BIOSIMULATION MARKET, BY DEPLOYMENT MODEL, 2022–2029 (USD MILLION)
TABLE 150
GERMANY: BIOSIMULATION MARKET, BY END USER, 2022–2029 (USD MILLION)
TABLE 151
UK: BIOSIMULATION MARKET, BY OFFERING, 2022–2029 (USD MILLION)
TABLE 152
UK: BIOSIMULATION SOFTWARE MARKET, BY TYPE, 2022–2029 (USD MILLION)
TABLE 153
UK: BIOSIMULATION MARKET FOR STANDALONE MODULES, BY TYPE, 2022–2029 (USD MILLION)
TABLE 154
UK: BIOSIMULATION SERVICES MARKET, BY TYPE, 2022–2029 (USD MILLION)
TABLE 155
UK: BIOSIMULATION MARKET, BY APPLICATION, 2022–2029 (USD MILLION)
TABLE 156
UK: BIOSIMULATION MARKET FOR DRUG DISCOVERY APPLICATIONS, BY TYPE, 2022–2029 (USD MILLION)
TABLE 157
UK: BIOSIMULATION MARKET FOR DRUG DEVELOPMENT APPLICATIONS, BY TYPE, 2022–2029 (USD MILLION)
TABLE 158
UK: BIOSIMULATION MARKET FOR PRECLINICAL TESTING, BY TYPE, 2022–2029 (USD MILLION)
TABLE 159
UK: BIOSIMULATION MARKET FOR CLINICAL TRIALS, BY TYPE, 2022–2029 (USD MILLION)
TABLE 160
UK: BIOSIMULATION MARKET FOR MANUFACTURING & SUPPLY CHAIN MANAGEMENT APPLICATIONS, BY TYPE, 2022–2029 (USD MILLION)
TABLE 161
UK: BIOSIMULATION MARKET, BY THERAPEUTIC AREA, 2022–2029 (USD MILLION)
TABLE 162
UK: BIOSIMULATION MARKET, BY REVENUE MODEL, 2022–2029 (USD MILLION)
TABLE 163
UK: BIOSIMULATION MARKET, BY DEPLOYMENT MODEL, 2022–2029 (USD MILLION)
TABLE 164
UK: BIOSIMULATION MARKET, BY END USER, 2022–2029 (USD MILLION)
TABLE 165
FRANCE: BIOSIMULATION MARKET, BY OFFERING, 2022–2029 (USD MILLION)
TABLE 166
FRANCE: BIOSIMULATION SOFTWARE MARKET, BY TYPE, 2022–2029 (USD MILLION)
TABLE 167
FRANCE: BIOSIMULATION MARKET FOR STANDALONE MODULES, BY TYPE, 2022–2029 (USD MILLION)
TABLE 168
FRANCE: BIOSIMULATION SERVICES MARKET, BY TYPE, 2022–2029 (USD MILLION)
TABLE 169
FRANCE: BIOSIMULATION MARKET, BY APPLICATION, 2022–2029 (USD MILLION)
TABLE 170
FRANCE: BIOSIMULATION MARKET FOR DRUG DISCOVERY APPLICATIONS, BY TYPE, 2022–2029 (USD MILLION)
TABLE 171
FRANCE: BIOSIMULATION MARKET FOR DRUG DEVELOPMENT APPLICATIONS, BY TYPE, 2022–2029 (USD MILLION)
TABLE 172
FRANCE: BIOSIMULATION MARKET FOR PRECLINICAL TESTING, BY TYPE, 2022–2029 (USD MILLION)
TABLE 173
FRANCE: BIOSIMULATION MARKET FOR CLINICAL TRIALS, BY TYPE, 2022–2029 (USD MILLION)
TABLE 174
FRANCE: BIOSIMULATION MARKET FOR MANUFACTURING & SUPPLY CHAIN MANAGEMENT APPLICATIONS, BY TYPE, 2022–2029 (USD MILLION)
TABLE 175
FRANCE: BIOSIMULATION MARKET, BY THERAPEUTIC AREA, 2022–2029 (USD MILLION)
TABLE 176
FRANCE: BIOSIMULATION MARKET, BY REVENUE MODEL, 2022–2029 (USD MILLION)
TABLE 177
FRANCE: BIOSIMULATION MARKET, BY DEPLOYMENT MODEL, 2022–2029 (USD MILLION)
TABLE 178
FRANCE: BIOSIMULATION MARKET, BY END USER, 2022–2029 (USD MILLION)
TABLE 179
ITALY: BIOSIMULATION MARKET, BY OFFERING, 2022–2029 (USD MILLION)
TABLE 180
ITALY: BIOSIMULATION SOFTWARE MARKET, BY TYPE, 2022–2029 (USD MILLION)
TABLE 181
ITALY: BIOSIMULATION MARKET FOR STANDALONE MODULES, BY TYPE, 2022–2029 (USD MILLION)
TABLE 182
ITALY: BIOSIMULATION SERVICES MARKET, BY TYPE, 2022–2029 (USD MILLION)
TABLE 183
ITALY: BIOSIMULATION MARKET, BY APPLICATION, 2022–2029 (USD MILLION)
TABLE 184
ITALY: BIOSIMULATION MARKET FOR DRUG DISCOVERY APPLICATIONS, BY TYPE, 2022–2029 (USD MILLION)
TABLE 185
ITALY: BIOSIMULATION MARKET FOR DRUG DEVELOPMENT APPLICATIONS, BY TYPE, 2022–2029 (USD MILLION)
TABLE 186
ITALY: BIOSIMULATION MARKET FOR PRECLINICAL TESTING, BY TYPE, 2022–2029 (USD MILLION)
TABLE 187
ITALY: BIOSIMULATION MARKET FOR CLINICAL TRIALS, BY TYPE, 2022–2029 (USD MILLION)
TABLE 188
ITALY: BIOSIMULATION MARKET FOR MANUFACTURING & SUPPLY CHAIN MANAGEMENT APPLICATIONS, BY TYPE, 2022–2029 (USD MILLION)
TABLE 189
ITALY: BIOSIMULATION MARKET, BY THERAPEUTIC AREA, 2022–2029 (USD MILLION)
TABLE 190
ITALY: BIOSIMULATION MARKET, BY REVENUE MODEL, 2022–2029 (USD MILLION)
TABLE 191
ITALY: BIOSIMULATION MARKET, BY DEPLOYMENT MODEL, 2022–2029 (USD MILLION)
TABLE 192
ITALY: BIOSIMULATION MARKET, BY END USER, 2022–2029 (USD MILLION)
TABLE 193
SPAIN: BIOSIMULATION MARKET, BY OFFERING, 2022–2029 (USD MILLION)
TABLE 194
SPAIN: BIOSIMULATION SOFTWARE MARKET, BY TYPE, 2022–2029 (USD MILLION)
TABLE 195
SPAIN: BIOSIMULATION MARKET FOR STANDALONE MODULES, BY TYPE, 2022–2029 (USD MILLION)
TABLE 196
SPAIN: BIOSIMULATION SERVICES MARKET, BY TYPE, 2022–2029 (USD MILLION)
TABLE 197
SPAIN: BIOSIMULATION MARKET, BY APPLICATION, 2022–2029 (USD MILLION)
TABLE 198
SPAIN: BIOSIMULATION MARKET FOR DRUG DISCOVERY APPLICATIONS, BY TYPE, 2022–2029 (USD MILLION)
TABLE 199
SPAIN: BIOSIMULATION MARKET FOR DRUG DEVELOPMENT APPLICATIONS, BY TYPE, 2022–2029 (USD MILLION)
TABLE 200
SPAIN: BIOSIMULATION MARKET FOR PRECLINICAL TESTING, BY TYPE, 2022–2029 (USD MILLION)
TABLE 201
SPAIN: BIOSIMULATION MARKET FOR CLINICAL TRIALS, BY TYPE, 2022–2029 (USD MILLION)
TABLE 202
SPAIN: BIOSIMULATION MARKET FOR MANUFACTURING & SUPPLY CHAIN MANAGEMENT APPLICATIONS, BY TYPE, 2022–2029 (USD MILLION)
TABLE 203
SPAIN: BIOSIMULATION MARKET, BY THERAPEUTIC AREA, 2022–2029 (USD MILLION)
TABLE 204
SPAIN: BIOSIMULATION MARKET, BY REVENUE MODEL, 2022–2029 (USD MILLION)
TABLE 205
SPAIN: BIOSIMULATION MARKET, BY DEPLOYMENT MODEL, 2022–2029 (USD MILLION)
TABLE 206
SPAIN: BIOSIMULATION MARKET, BY END USER, 2022–2029 (USD MILLION)
TABLE 207
REST OF EUROPE: BIOSIMULATION MARKET, BY OFFERING, 2022–2029 (USD MILLION)
TABLE 208
REST OF EUROPE: BIOSIMULATION SOFTWARE MARKET, BY TYPE, 2022–2029 (USD MILLION)
TABLE 209
REST OF EUROPE: BIOSIMULATION MARKET FOR STANDALONE MODULES, BY TYPE, 2022–2029 (USD MILLION)
TABLE 210
REST OF EUROPE: BIOSIMULATION SERVICES MARKET, BY TYPE, 2022–2029 (USD MILLION)
TABLE 211
REST OF EUROPE: BIOSIMULATION MARKET, BY APPLICATION, 2022–2029 (USD MILLION)
TABLE 212
REST OF EUROPE: BIOSIMULATION MARKET FOR DRUG DISCOVERY APPLICATIONS, BY TYPE, 2022–2029 (USD MILLION)
TABLE 213
REST OF EUROPE: BIOSIMULATION MARKET FOR DRUG DEVELOPMENT APPLICATIONS, BY TYPE, 2022–2029 (USD MILLION)
TABLE 214
REST OF EUROPE: BIOSIMULATION MARKET FOR PRECLINICAL TESTING, BY TYPE, 2022–2029 (USD MILLION)
TABLE 215
REST OF EUROPE: BIOSIMULATION MARKET FOR CLINICAL TRIALS, BY TYPE, 2022–2029 (USD MILLION)
TABLE 216
REST OF EUROPE: BIOSIMULATION MARKET FOR MANUFACTURING & SUPPLY CHAIN MANAGEMENT APPLICATIONS, BY TYPE, 2022–2029 (USD MILLION)
TABLE 217
REST OF EUROPE: BIOSIMULATION MARKET, BY THERAPEUTIC AREA, 2022–2029 (USD MILLION)
TABLE 218
REST OF EUROPE: BIOSIMULATION MARKET, BY REVENUE MODEL, 2022–2029 (USD MILLION)
TABLE 219
REST OF EUROPE: BIOSIMULATION MARKET, BY DEPLOYMENT MODEL, 2022–2029 (USD MILLION)
TABLE 220
REST OF EUROPE: BIOSIMULATION MARKET, BY END USER, 2022–2029 (USD MILLION)
TABLE 221
ASIA PACIFIC: BIOSIMULATION MARKET, BY COUNTRY, 2022–2029 (USD MILLION)
TABLE 222
ASIA PACIFIC: BIOSIMULATION MARKET, BY OFFERING, 2022–2029 (USD MILLION)
TABLE 223
ASIA PACIFIC: BIOSIMULATION SOFTWARE MARKET, BY TYPE, 2022–2029 (USD MILLION)
TABLE 224
ASIA PACIFIC: BIOSIMULATION MARKET FOR STANDALONE MODULES, BY TYPE, 2022–2029 (USD MILLION)
TABLE 225
ASIA PACIFIC: BIOSIMULATION SERVICES MARKET, BY TYPE, 2022–2029 (USD MILLION)
TABLE 226
ASIA PACIFIC: BIOSIMULATION MARKET, BY APPLICATION, 2022–2029 (USD MILLION)
TABLE 227
ASIA PACIFIC: BIOSIMULATION MARKET FOR DRUG DISCOVERY APPLICATIONS, BY TYPE, 2022–2029 (USD MILLION)
TABLE 228
ASIA PACIFIC: BIOSIMULATION MARKET FOR DRUG DEVELOPMENT APPLICATIONS, BY TYPE, 2022–2029 (USD MILLION)
TABLE 229
ASIA PACIFIC: BIOSIMULATION MARKET FOR PRECLINICAL TESTING, BY TYPE, 2022–2029 (USD MILLION)
TABLE 230
ASIA PACIFIC: BIOSIMULATION MARKET FOR CLINICAL TRIALS, BY TYPE, 2022–2029 (USD MILLION)
TABLE 231
ASIA PACIFIC: BIOSIMULATION MARKET FOR MANUFACTURING & SUPPLY CHAIN MANAGEMENT APPLICATIONS, BY TYPE, 2022–2029 (USD MILLION)
TABLE 232
ASIA PACIFIC: BIOSIMULATION MARKET, BY THERAPEUTIC AREA, 2022–2029 (USD MILLION)
TABLE 233
ASIA PACIFIC: BIOSIMULATION MARKET, BY REVENUE MODEL, 2022–2029 (USD MILLION)
TABLE 234
ASIA PACIFIC: BIOSIMULATION MARKET, BY DEPLOYMENT MODEL, 2022–2029 (USD MILLION)
TABLE 235
ASIA PACIFIC: BIOSIMULATION MARKET, BY END USER, 2022–2029 (USD MILLION)
TABLE 236
CHINA: BIOSIMULATION MARKET, BY OFFERING, 2022–2029 (USD MILLION)
TABLE 237
CHINA: BIOSIMULATION SOFTWARE MARKET, BY TYPE, 2022–2029 (USD MILLION)
TABLE 238
CHINA: BIOSIMULATION MARKET FOR STANDALONE MODULES, BY TYPE, 2022–2029 (USD MILLION)
TABLE 239
CHINA: BIOSIMULATION SERVICES MARKET, BY TYPE, 2022–2029 (USD MILLION)
TABLE 240
CHINA: BIOSIMULATION MARKET, BY APPLICATION, 2022–2029 (USD MILLION)
TABLE 241
CHINA: BIOSIMULATION MARKET FOR DRUG DISCOVERY APPLICATIONS, BY TYPE, 2022–2029 (USD MILLION)
TABLE 242
CHINA: BIOSIMULATION MARKET FOR DRUG DEVELOPMENT APPLICATIONS, BY TYPE, 2022–2029 (USD MILLION)
TABLE 243
CHINA: BIOSIMULATION MARKET FOR PRECLINICAL TESTING, BY TYPE, 2022–2029 (USD MILLION)
TABLE 244
CHINA: BIOSIMULATION MARKET FOR CLINICAL TRIALS, BY TYPE, 2022–2029 (USD MILLION)
TABLE 245
CHINA: BIOSIMULATION MARKET FOR MANUFACTURING & SUPPLY CHAIN MANAGEMENT APPLICATIONS, BY TYPE, 2022–2029 (USD MILLION)
TABLE 246
CHINA: BIOSIMULATION MARKET, BY THERAPEUTIC AREA, 2022–2029 (USD MILLION)
TABLE 247
CHINA: BIOSIMULATION MARKET, BY REVENUE MODEL, 2022–2029 (USD MILLION)
TABLE 248
CHINA: BIOSIMULATION MARKET, BY DEPLOYMENT MODEL, 2022–2029 (USD MILLION)
TABLE 249
CHINA: BIOSIMULATION MARKET, BY END USER, 2022–2029 (USD MILLION)
TABLE 250
INDIA: BIOSIMULATION MARKET, BY OFFERING, 2022–2029 (USD MILLION)
TABLE 251
INDIA: BIOSIMULATION SOFTWARE MARKET, BY TYPE, 2022–2029 (USD MILLION)
TABLE 252
INDIA: BIOSIMULATION MARKET FOR STANDALONE MODULES, BY TYPE, 2022–2029 (USD MILLION)
TABLE 253
INDIA: BIOSIMULATION SERVICES MARKET, BY TYPE, 2022–2029 (USD MILLION)
TABLE 254
INDIA: BIOSIMULATION MARKET, BY APPLICATION, 2022–2029 (USD MILLION)
TABLE 255
INDIA: BIOSIMULATION MARKET FOR DRUG DISCOVERY APPLICATIONS, BY TYPE, 2022–2029 (USD MILLION)
TABLE 256
INDIA: BIOSIMULATION MARKET FOR DRUG DEVELOPMENT APPLICATIONS, BY TYPE, 2022–2029 (USD MILLION)
TABLE 257
INDIA: BIOSIMULATION MARKET FOR PRECLINICAL TESTING, BY TYPE, 2022–2029 (USD MILLION)
TABLE 258
INDIA: BIOSIMULATION MARKET FOR CLINICAL TRIALS, BY TYPE, 2022–2029 (USD MILLION)
TABLE 259
INDIA: BIOSIMULATION MARKET FOR MANUFACTURING & SUPPLY CHAIN MANAGEMENT APPLICATIONS, BY TYPE, 2022–2029 (USD MILLION)
TABLE 260
INDIA: BIOSIMULATION MARKET, BY THERAPEUTIC AREA, 2022–2029 (USD MILLION)
TABLE 261
INDIA: BIOSIMULATION MARKET, BY REVENUE MODEL, 2022–2029 (USD MILLION)
TABLE 262
INDIA: BIOSIMULATION MARKET, BY DEPLOYMENT MODEL, 2022–2029 (USD MILLION)
TABLE 263
INDIA: BIOSIMULATION MARKET, BY END USER, 2022–2029 (USD MILLION)
TABLE 264
JAPAN: BIOSIMULATION MARKET, BY OFFERING, 2022–2029 (USD MILLION)
TABLE 265
JAPAN: BIOSIMULATION SOFTWARE MARKET, BY TYPE, 2022–2029 (USD MILLION)
TABLE 266
JAPAN: BIOSIMULATION MARKET FOR STANDALONE MODULES, BY TYPE, 2022–2029 (USD MILLION)
TABLE 267
JAPAN: BIOSIMULATION SERVICES MARKET, BY TYPE, 2022–2029 (USD MILLION)
TABLE 268
JAPAN: BIOSIMULATION MARKET, BY APPLICATION, 2022–2029 (USD MILLION)
TABLE 269
JAPAN: BIOSIMULATION MARKET FOR DRUG DISCOVERY APPLICATIONS, BY TYPE, 2022–2029 (USD MILLION)
TABLE 270
JAPAN: BIOSIMULATION MARKET FOR DRUG DEVELOPMENT APPLICATIONS, BY TYPE, 2022–2029 (USD MILLION)
TABLE 271
JAPAN: BIOSIMULATION MARKET FOR PRECLINICAL TESTING, BY TYPE, 2022–2029 (USD MILLION)
TABLE 272
JAPAN: BIOSIMULATION MARKET FOR CLINICAL TRIALS, BY TYPE, 2022–2029 (USD MILLION)
TABLE 273
JAPAN: BIOSIMULATION MARKET FOR MANUFACTURING & SUPPLY CHAIN MANAGEMENT APPLICATIONS, BY TYPE, 2022–2029 (USD MILLION)
TABLE 274
JAPAN: BIOSIMULATION MARKET, BY THERAPEUTIC AREA, 2022–2029 (USD MILLION)
TABLE 275
JAPAN: BIOSIMULATION MARKET, BY REVENUE MODEL, 2022–2029 (USD MILLION)
TABLE 276
JAPAN: BIOSIMULATION MARKET, BY DEPLOYMENT MODEL, 2022–2029 (USD MILLION)
TABLE 277
JAPAN: BIOSIMULATION MARKET, BY END USER, 2022–2029 (USD MILLION)
TABLE 278
REST OF ASIA PACIFIC: BIOSIMULATION MARKET, BY OFFERING, 2022–2029 (USD MILLION)
TABLE 279
REST OF ASIA PACIFIC: BIOSIMULATION SOFTWARE MARKET, BY TYPE, 2022–2029 (USD MILLION)
TABLE 280
REST OF ASIA PACIFIC: BIOSIMULATION MARKET FOR STANDALONE MODULES, BY TYPE, 2022–2029 (USD MILLION)
TABLE 281
REST OF ASIA PACIFIC: BIOSIMULATION SERVICES MARKET, BY TYPE, 2022–2029 (USD MILLION)
TABLE 282
REST OF ASIA PACIFIC: BIOSIMULATION MARKET, BY APPLICATION, 2022–2029 (USD MILLION)
TABLE 283
REST OF ASIA PACIFIC: BIOSIMULATION MARKET FOR DRUG DISCOVERY APPLICATIONS, BY TYPE, 2022–2029 (USD MILLION)
TABLE 284
REST OF ASIA PACIFIC: BIOSIMULATION MARKET FOR DRUG DEVELOPMENT APPLICATIONS, BY TYPE, 2022–2029 (USD MILLION)
TABLE 285
REST OF ASIA PACIFIC: BIOSIMULATION MARKET FOR PRECLINICAL TESTING, BY TYPE, 2022–2029 (USD MILLION)
TABLE 286
REST OF ASIA PACIFIC: BIOSIMULATION MARKET FOR CLINICAL TRIALS, BY TYPE, 2022–2029 (USD MILLION)
TABLE 287
REST OF ASIA PACIFIC: BIOSIMULATION MARKET FOR MANUFACTURING & SUPPLY CHAIN MANAGEMENT APPLICATIONS, BY TYPE, 2022–2029 (USD MILLION)
TABLE 288
REST OF ASIA PACIFIC: BIOSIMULATION MARKET, BY THERAPEUTIC AREA, 2022–2029 (USD MILLION)
TABLE 289
REST OF ASIA PACIFIC: BIOSIMULATION MARKET, BY REVENUE MODEL, 2022–2029 (USD MILLION)
TABLE 290
REST OF ASIA PACIFIC: BIOSIMULATION MARKET, BY DEPLOYMENT MODEL, 2022–2029 (USD MILLION)
TABLE 291
REST OF ASIA PACIFIC: BIOSIMULATION MARKET, BY END USER, 2022–2029 (USD MILLION)
TABLE 292
LATIN AMERICA: BIOSIMULATION MARKET, BY COUNTRY, 2022–2029 (USD MILLION)
TABLE 293
LATIN AMERICA: BIOSIMULATION MARKET, BY OFFERING, 2022–2029 (USD MILLION)
TABLE 294
LATIN AMERICA: BIOSIMULATION SOFTWARE MARKET, BY TYPE, 2022–2029 (USD MILLION)
TABLE 295
LATIN AMERICA: BIOSIMULATION MARKET FOR STANDALONE MODULES, BY TYPE, 2022–2029 (USD MILLION)
TABLE 296
LATIN AMERICA: BIOSIMULATION SERVICES MARKET, BY TYPE, 2022–2029 (USD MILLION)
TABLE 297
LATIN AMERICA: BIOSIMULATION MARKET, BY APPLICATION, 2022–2029 (USD MILLION)
TABLE 298
LATIN AMERICA: BIOSIMULATION MARKET FOR DRUG DISCOVERY APPLICATIONS, BY TYPE, 2022–2029 (USD MILLION)
TABLE 299
LATIN AMERICA: BIOSIMULATION MARKET FOR DRUG DEVELOPMENT APPLICATIONS, BY TYPE, 2022–2029 (USD MILLION)
TABLE 300
LATIN AMERICA: BIOSIMULATION MARKET FOR PRECLINICAL TESTING, BY TYPE, 2022–2029 (USD MILLION)
TABLE 301
LATIN AMERICA: BIOSIMULATION MARKET FOR CLINICAL TRIALS, BY TYPE, 2022–2029 (USD MILLION)
TABLE 302
LATIN AMERICA: BIOSIMULATION MARKET FOR MANUFACTURING & SUPPLY CHAIN MANAGEMENT APPLICATIONS, BY TYPE, 2022–2029 (USD MILLION)
TABLE 303
LATIN AMERICA: BIOSIMULATION MARKET, BY THERAPEUTIC AREA, 2022–2029 (USD MILLION)
TABLE 304
LATIN AMERICA: BIOSIMULATION MARKET, BY REVENUE MODEL, 2022–2029 (USD MILLION)
TABLE 305
LATIN AMERICA: BIOSIMULATION MARKET, BY DEPLOYMENT MODEL, 2022–2029 (USD MILLION)
TABLE 306
LATIN AMERICA: BIOSIMULATION MARKET, BY END USER, 2022–2029 (USD MILLION)
TABLE 307
BRAZIL: BIOSIMULATION MARKET, BY OFFERING, 2022–2029 (USD MILLION)
TABLE 308
BRAZIL: BIOSIMULATION SOFTWARE MARKET, BY TYPE, 2022–2029 (USD MILLION)
TABLE 309
BRAZIL: BIOSIMULATION MARKET FOR STANDALONE MODULES, BY TYPE, 2022–2029 (USD MILLION)
TABLE 310
BRAZIL: BIOSIMULATION SERVICES MARKET, BY TYPE, 2022–2029 (USD MILLION)
TABLE 311
BRAZIL: BIOSIMULATION MARKET, BY APPLICATION, 2022–2029 (USD MILLION)
TABLE 312
BRAZIL: BIOSIMULATION MARKET FOR DRUG DISCOVERY APPLICATIONS, BY TYPE, 2022–2029 (USD MILLION)
TABLE 313
BRAZIL: BIOSIMULATION MARKET FOR DRUG DEVELOPMENT APPLICATIONS, BY TYPE, 2022–2029 (USD MILLION)
TABLE 314
BRAZIL: BIOSIMULATION MARKET FOR PRECLINICAL TESTING, BY TYPE, 2022–2029 (USD MILLION)
TABLE 315
BRAZIL: BIOSIMULATION MARKET FOR CLINICAL TRIALS, BY TYPE, 2022–2029 (USD MILLION)
TABLE 316
BRAZIL: BIOSIMULATION MARKET FOR MANUFACTURING & SUPPLY CHAIN MANAGEMENT APPLICATIONS, BY TYPE, 2022–2029 (USD MILLION)
TABLE 317
BRAZIL: BIOSIMULATION MARKET, BY THERAPEUTIC AREA, 2022–2029 (USD MILLION)
TABLE 318
BRAZIL: BIOSIMULATION MARKET, BY REVENUE MODEL, 2022–2029 (USD MILLION)
TABLE 319
BRAZIL: BIOSIMULATION MARKET, BY DEPLOYMENT MODEL, 2022–2029 (USD MILLION)
TABLE 320
BRAZIL: BIOSIMULATION MARKET, BY END USER, 2022–2029 (USD MILLION)
TABLE 321
MEXICO: BIOSIMULATION MARKET, BY OFFERING, 2022–2029 (USD MILLION)
TABLE 322
MEXICO: BIOSIMULATION SOFTWARE MARKET, BY TYPE, 2022–2029 (USD MILLION)
TABLE 323
MEXICO: BIOSIMULATION MARKET FOR STANDALONE MODULES, BY TYPE, 2022–2029 (USD MILLION)
TABLE 324
MEXICO: BIOSIMULATION SERVICES MARKET, BY TYPE, 2022–2029 (USD MILLION)
TABLE 325
MEXICO: BIOSIMULATION MARKET, BY APPLICATION, 2022–2029 (USD MILLION)
TABLE 326
MEXICO: BIOSIMULATION MARKET FOR DRUG DISCOVERY APPLICATIONS, BY TYPE, 2022–2029 (USD MILLION)
TABLE 327
MEXICO: BIOSIMULATION MARKET FOR DRUG DEVELOPMENT APPLICATIONS, BY TYPE, 2022–2029 (USD MILLION)
TABLE 328
MEXICO: BIOSIMULATION MARKET FOR PRECLINICAL TESTING, BY TYPE, 2022–2029 (USD MILLION)
TABLE 329
MEXICO: BIOSIMULATION MARKET FOR CLINICAL TRIALS, BY TYPE, 2022–2029 (USD MILLION)
TABLE 330
MEXICO: BIOSIMULATION MARKET FOR MANUFACTURING & SUPPLY CHAIN MANAGEMENT APPLICATIONS, BY TYPE, 2022–2029 (USD MILLION)
TABLE 331
MEXICO: BIOSIMULATION MARKET, BY THERAPEUTIC AREA, 2022–2029 (USD MILLION)
TABLE 332
MEXICO: BIOSIMULATION MARKET, BY REVENUE MODEL, 2022–2029 (USD MILLION)
TABLE 333
MEXICO: BIOSIMULATION MARKET, BY DEPLOYMENT MODEL, 2022–2029 (USD MILLION)
TABLE 334
MEXICO: BIOSIMULATION MARKET, BY END USER, 2022–2029 (USD MILLION)
TABLE 335
REST OF LATIN AMERICA: BIOSIMULATION MARKET, BY OFFERING, 2022–2029 (USD MILLION)
TABLE 336
REST OF LATIN AMERICA: BIOSIMULATION SOFTWARE MARKET, BY TYPE, 2022–2029 (USD MILLION)
TABLE 337
REST OF LATIN AMERICA: BIOSIMULATION MARKET FOR STANDALONE MODULES, BY TYPE, 2022–2029 (USD MILLION)
TABLE 338
REST OF LATIN AMERICA: BIOSIMULATION SERVICES MARKET, BY TYPE, 2022–2029 (USD MILLION)
TABLE 339
REST OF LATIN AMERICA: BIOSIMULATION MARKET, BY APPLICATION, 2022–2029 (USD MILLION)
TABLE 340
REST OF LATIN AMERICA: BIOSIMULATION MARKET FOR DRUG DISCOVERY APPLICATIONS, BY TYPE, 2022–2029 (USD MILLION)
TABLE 341
REST OF LATIN AMERICA: BIOSIMULATION MARKET FOR DRUG DEVELOPMENT APPLICATIONS, BY TYPE, 2022–2029 (USD MILLION)
TABLE 342
REST OF LATIN AMERICA: BIOSIMULATION MARKET FOR PRECLINICAL TESTING, BY TYPE, 2022–2029 (USD MILLION)
TABLE 343
REST OF LATIN AMERICA: BIOSIMULATION MARKET FOR CLINICAL TRIALS, BY TYPE, 2022–2029 (USD MILLION)
TABLE 344
REST OF LATIN AMERICA: BIOSIMULATION MARKET FOR MANUFACTURING & SUPPLY CHAIN MANAGEMENT APPLICATIONS, BY TYPE, 2022–2029 (USD MILLION)
TABLE 345
REST OF LATIN AMERICA: BIOSIMULATION MARKET, BY THERAPEUTIC AREA, 2022–2029 (USD MILLION)
TABLE 346
REST OF LATIN AMERICA: BIOSIMULATION MARKET, BY REVENUE MODEL, 2022–2029 (USD MILLION)
TABLE 347
REST OF LATIN AMERICA: BIOSIMULATION MARKET, BY DEPLOYMENT MODEL, 2022–2029 (USD MILLION)
TABLE 348
REST OF LATIN AMERICA: BIOSIMULATION MARKET, BY END USER, 2022–2029 (USD MILLION)
TABLE 349
MIDDLE EAST & AFRICA: BIOSIMULATION MARKET, BY COUNTRY, 2022–2029 (USD MILLION)
TABLE 350
MIDDLE EAST & AFRICA: BIOSIMULATION MARKET, BY OFFERING, 2022–2029 (USD MILLION)
TABLE 351
MIDDLE EAST & AFRICA: BIOSIMULATION SOFTWARE MARKET, BY TYPE, 2022–2029 (USD MILLION)
TABLE 352
MIDDLE EAST & AFRICA: BIOSIMULATION MARKET FOR STANDALONE MODULES, BY TYPE, 2022–2029 (USD MILLION)
TABLE 353
MIDDLE EAST & AFRICA: BIOSIMULATION SERVICES MARKET, BY TYPE, 2022–2029 (USD MILLION)
TABLE 354
MIDDLE EAST & AFRICA: BIOSIMULATION MARKET, BY APPLICATION, 2022–2029 (USD MILLION)
TABLE 355
MIDDLE EAST & AFRICA: BIOSIMULATION MARKET FOR DRUG DISCOVERY APPLICATIONS, BY TYPE, 2022–2029 (USD MILLION)
TABLE 356
MIDDLE EAST & AFRICA: BIOSIMULATION MARKET FOR DRUG DEVELOPMENT APPLICATIONS, BY TYPE, 2022–2029 (USD MILLION)
TABLE 357
MIDDLE EAST & AFRICA: BIOSIMULATION MARKET FOR PRECLINICAL TESTING, BY TYPE, 2022–2029 (USD MILLION)
TABLE 358
MIDDLE EAST & AFRICA: BIOSIMULATION MARKET FOR CLINICAL TRIALS, BY TYPE, 2022–2029 (USD MILLION)
TABLE 359
MIDDLE EAST & AFRICA: BIOSIMULATION MARKET FOR MANUFACTURING & SUPPLY CHAIN MANAGEMENT APPLICATIONS, BY TYPE, 2022–2029 (USD MILLION)
TABLE 360
MIDDLE EAST & AFRICA: BIOSIMULATION MARKET, BY THERAPEUTIC AREA, 2022–2029 (USD MILLION)
TABLE 361
MIDDLE EAST & AFRICA: BIOSIMULATION MARKET, BY REVENUE MODEL, 2022–2029 (USD MILLION)
TABLE 362
MIDDLE EAST & AFRICA: BIOSIMULATION MARKET, BY DEPLOYMENT MODEL, 2022–2029 (USD MILLION)
TABLE 363
MIDDLE EAST & AFRICA: BIOSIMULATION MARKET, BY END USER, 2022–2029 (USD MILLION)
TABLE 364
GCC COUNTRIES: BIOSIMULATION MARKET, BY OFFERING, 2022–2029 (USD MILLION)
TABLE 365
GCC COUNTRIES: BIOSIMULATION SOFTWARE MARKET, BY TYPE, 2022–2029 (USD MILLION)
TABLE 366
GCC COUNTRIES: BIOSIMULATION MARKET FOR STANDALONE MODULES, BY TYPE, 2022–2029 (USD MILLION)
TABLE 367
GCC COUNTRIES: BIOSIMULATION SERVICES MARKET, BY TYPE, 2022–2029 (USD MILLION)
TABLE 368
GCC COUNTRIES: BIOSIMULATION MARKET, BY APPLICATION, 2022–2029 (USD MILLION)
TABLE 369
GCC COUNTRIES: BIOSIMULATION MARKET FOR DRUG DISCOVERY APPLICATIONS, BY TYPE, 2022–2029 (USD MILLION)
TABLE 370
GCC COUNTRIES: BIOSIMULATION MARKET FOR DRUG DEVELOPMENT APPLICATIONS, BY TYPE, 2022–2029 (USD MILLION)
TABLE 371
GCC COUNTRIES: BIOSIMULATION MARKET FOR PRECLINICAL TESTING, BY TYPE, 2022–2029 (USD MILLION)
TABLE 372
GCC COUNTRIES: BIOSIMULATION MARKET FOR CLINICAL TRIALS, BY TYPE, 2022–2029 (USD MILLION)
TABLE 373
GCC COUNTRIES: BIOSIMULATION MARKET FOR MANUFACTURING & SUPPLY CHAIN MANAGEMENT APPLICATIONS, BY TYPE, 2022–2029 (USD MILLION)
TABLE 374
GCC COUNTRIES: BIOSIMULATION MARKET, BY THERAPEUTIC AREA, 2022–2029 (USD MILLION)
TABLE 375
GCC COUNTRIES: BIOSIMULATION MARKET, BY REVENUE MODEL, 2022–2029 (USD MILLION)
TABLE 376
GCC COUNTRIES: BIOSIMULATION MARKET, BY DEPLOYMENT MODEL, 2022–2029 (USD MILLION)
TABLE 377
GCC COUNTRIES: BIOSIMULATION MARKET, BY END USER, 2022–2029 (USD MILLION)
TABLE 378
REST OF MIDDLE EAST & AFRICA: BIOSIMULATION MARKET, BY OFFERING, 2022–2029 (USD MILLION)
TABLE 379
REST OF MIDDLE EAST & AFRICA: BIOSIMULATION SOFTWARE MARKET, BY TYPE, 2022–2029 (USD MILLION)
TABLE 380
REST OF MIDDLE EAST & AFRICA: BIOSIMULATION MARKET FOR STANDALONE MODULES, BY TYPE, 2022–2029 (USD MILLION)
TABLE 381
REST OF MIDDLE EAST & AFRICA: BIOSIMULATION SERVICES MARKET, BY TYPE, 2022–2029 (USD MILLION)
TABLE 382
REST OF MIDDLE EAST & AFRICA: BIOSIMULATION MARKET, BY APPLICATION, 2022–2029 (USD MILLION)
TABLE 383
REST OF MIDDLE EAST & AFRICA: BIOSIMULATION MARKET FOR DRUG DISCOVERY APPLICATIONS, BY TYPE, 2022–2029 (USD MILLION)
TABLE 384
REST OF MIDDLE EAST & AFRICA: BIOSIMULATION MARKET FOR DRUG DEVELOPMENT APPLICATIONS, BY TYPE, 2022–2029 (USD MILLION)
TABLE 385
REST OF MIDDLE EAST & AFRICA: BIOSIMULATION MARKET FOR PRECLINICAL TESTING, BY TYPE, 2022–2029 (USD MILLION)
TABLE 386
REST OF MIDDLE EAST & AFRICA: BIOSIMULATION MARKET FOR CLINICAL TRIALS, BY TYPE, 2022–2029 (USD MILLION)
TABLE 387
REST OF MIDDLE EAST & AFRICA: BIOSIMULATION MARKET FOR MANUFACTURING & SUPPLY CHAIN MANAGEMENT APPLICATIONS, BY TYPE, 2022–2029 (USD MILLION)
TABLE 388
REST OF MIDDLE EAST & AFRICA: BIOSIMULATION MARKET, BY THERAPEUTIC AREA, 2022–2029 (USD MILLION)
TABLE 389
REST OF MIDDLE EAST & AFRICA: BIOSIMULATION MARKET, BY REVENUE MODEL, 2022–2029 (USD MILLION)
TABLE 390
REST OF MIDDLE EAST & AFRICA NORTH AMERICA: BIOSIMULATION MARKET, BY DEPLOYMENT MODEL, 2022–2029 (USD MILLION)
TABLE 391
REST OF MIDDLE EAST & AFRICA: BIOSIMULATION MARKET, BY END USER, 2022–2029 (USD MILLION)
TABLE 392
OVERVIEW OF STRATEGIES ADOPTED BY KEY PLAYERS IN BIOSIMULATION MARKET
TABLE 393
BIOSIMULATION MARKET: DEGREE OF COMPETITION
TABLE 394
BIOSIMULATION MARKET: OFFERING FOOTPRINT
TABLE 395
BIOSIMULATION MARKET: APPLICATION FOOTPRINT
TABLE 396
BIOSIMULATION MARKET: END-USER FOOTPRINT
TABLE 397
BIOSIMULATION MARKET: REGION FOOTPRINT
TABLE 398
BIOSIMULATION MARKET: DETAILED LIST OF KEY START-UPS/SMES
TABLE 399
BIOSIMULATION MARKET: COMPETITIVE BENCHMARKING OF KEY EMERGING PLAYERS/STARTUPS
TABLE 400
BIOSIMULATION MARKET: PRODUCT LAUNCHES & ENHANCEMENTS, JANUARY 2021–JANUARY 2025
TABLE 401
BIOSIMULATION MARKET: DEALS, JANUARY 2021– JANUARY 2025
TABLE 402
BIOSIMULATION MARKET: EXPANSIONS, JANUARY 2021– JANUARY 2025
TABLE 403
BIOSIMULATION MARKET: OTHER DEVELOPMENTS, JANUARY 2021– JANUARY 2025
TABLE 404
CERTARA, USA: COMPANY OVERVIEW
TABLE 405
CERTARA, USA: PRODUCTS & SERVICES OFFERED
TABLE 406
CERTARA, USA: PRODUCT LAUNCHES & ENHANCEMENTS, JANUARY 2021−JANUARY 2025
TABLE 407
CERTARA, USA: DEALS, JANUARY 2021−JANUARY 2025
TABLE 408
CERTARA, USA: OTHER DEVELOPMENTS, JANUARY 2021−JANUARY 2025
TABLE 409
DASSAULT SYSTÈMES: COMPANY OVERVIEW
TABLE 410
DASSAULT SYSTÈMES: PRODUCTS & SERVICES OFFERED
TABLE 411
DASSAULT SYSTÈMES: PRODUCT LAUNCHES & ENHANCEMENTS, JANUARY 2021− JANUARY 2025
TABLE 412
DASSAULT SYSTÈMES: DEALS, JANUARY 2021−JANUARY 2025
TABLE 413
DASSAULT SYSTÈMES: OTHER DEVELOPMENTS, JANUARY 2021−JANUARY 2025
TABLE 414
SCHRÖDINGER, INC.: COMPANY OVERVIEW
TABLE 415
SCHRÖDINGER, INC.: PRODUCTS & SERVICES OFFERED
TABLE 416
SCHRÖDINGER, INC.: DEALS, JANUARY 2021−JANUARY 2025
TABLE 417
SCHRÖDINGER, INC.: OTHER DEVELOPMENTS, JANUARY 2021−JANUARY 2025
TABLE 418
SIMULATIONS PLUS: COMPANY OVERVIEW
TABLE 419
SIMULATIONS PLUS: PRODUCTS & SERVICES OFFERED
TABLE 420
SIMULATIONS PLUS: PRODUCT LAUNCHES & ENHANCEMENTS, JANUARY 2021−JANUARY 2025
TABLE 421
SIMULATIONS PLUS: DEALS, JANUARY 2021−JANUARY 2025
TABLE 422
SIMULATIONS PLUS: OTHER DEVELOPMENTS, JANUARY 2021–JANUARY 2025
TABLE 423
ADVANCED CHEMISTRY DEVELOPMENT, INC.: COMPANY OVERVIEW
TABLE 424
ADVANCED CHEMISTRY DEVELOPMENT, INC.: PRODUCTS & SERVICES OFFERED
TABLE 425
ADVANCED CHEMISTRY DEVELOPMENT, INC.: PRODUCT LAUNCHES & ENHANCEMENTS, JANUARY 2021−JANUARY 2025
TABLE 426
ADVANCED CHEMISTRY DEVELOPMENT, INC.: DEALS, JANUARY 2021−JANUARY 2025
TABLE 427
CHEMICAL COMPUTING GROUP ULC: COMPANY OVERVIEW
TABLE 428
CHEMICAL COMPUTING GROUP ULC: PRODUCTS & SERVICES OFFERED
TABLE 429
CHEMICAL COMPUTING GROUP ULC: PRODUCT LAUNCHES & ENHANCEMENTS, JANUARY 2021−JANUARY 2025
TABLE 430
CHEMICAL COMPUTING GROUP ULC: DEALS, JANUARY 2021−JANUARY 2025
TABLE 431
CHEMICAL COMPUTING GROUP ULC: OTHER DEVELOPMENTS, JANUARY 2021−JANUARY 2025
TABLE 432
ROSA & CO. LLC: COMPANY OVERVIEW
TABLE 433
ROSA & CO. LLC: PRODUCTS & SERVICES OFFERED
TABLE 434
GENEDATA AG (A DANAHER COMPANY): COMPANY OVERVIEW
TABLE 435
GENEDATA AG (A DANAHER COMPANY): PRODUCTS & SERVICES OFFERED
TABLE 436
GENEDATA AG (A DANAHER COMPANY): PRODUCT LAUNCHES & ENHANCEMENTS, JANUARY 2021−JANUARY 2025
TABLE 437
GENEDATA AG (A DANAHER COMPANY): DEALS, JANUARY 2021−JANUARY 2025
TABLE 438
PHYSIOMICS PLC: COMPANY OVERVIEW
TABLE 439
PHYSIOMICS PLC: PRODUCTS & SERVICES OFFERED
TABLE 440
PHYSIOMICS PLC: PRODUCT LAUNCHES & ENHANCEMENTS, JANUARY 2021−JANUARY 2025
TABLE 441
PHYSIOMICS PLC: OTHER DEVELOPMENTS, JANUARY 2021−JANUARY 2025
TABLE 442
IN SILICO BIOSCIENCES: COMPANY OVERVIEW
TABLE 443
IN SILICO BIOSCIENCES: PRODUCTS & SERVICES OFFERED
TABLE 444
ALLUCENT: COMPANY OVERVIEW
TABLE 445
ALLUCENT: PRODUCTS & SERVICES OFFERED
TABLE 446
ALLUCENT: DEALS, JANUARY 2021−JANUARY 2025
TABLE 447
ALLUCENT: EXPANSIONS, JANUARY 2021– JANUARY 2025
TABLE 448
ALLUCENT: OTHER DEVELOPMENTS, JANUARY 2021–JANUARY 2025
TABLE 449
OPENEYE, CADENCE MOLECULAR SCIENCES: COMPANY OVERVIEW
TABLE 450
OPENEYE, CADENCE MOLECULAR SCIENCES: PRODUCTS & SERVICES OFFERED
TABLE 451
OPENEYE, CADENCE MOLECULAR SCIENCES: PRODUCT ENHANCEMENTS, JANUARY 2021−JANUARY 2025
TABLE 452
OPENEYE, CADENCE MOLECULAR SCIENCES: DEALS, JANUARY 2021−JANUARY 2025
TABLE 453
OPENEYE, CADENCE MOLECULAR SCIENCES: EXPANSIONS, JANUARY 2021– JANUARY 2025
TABLE 454
CELLWORKS GROUP, INC.: COMPANY OVERVIEW
TABLE 455
CELLWORKS GROUP, INC.: PRODUCTS & SERVICES OFFERED
TABLE 456
CELLWORKS GROUP, INC.: OTHER DEVELOPMENTS, JANUARY 2021–JANUARY 2025
TABLE 457
VERISIM LIFE: COMPANY OVERVIEW
TABLE 458
VERISIM LIFE: PRODUCTS & SERVICES OFFERED
TABLE 459
VERISIM LIFE: DEALS, JANUARY 2021−JANUARY 2025
TABLE 460
VERISIM LIFE: OTHER DEVELOPMENTS, JANUARY 2021–JANUARY 2025
TABLE 461
NETABOLICS: COMPANY OVERVIEW
TABLE 462
NETABOLICS: PRODUCTS & SERVICES OFFERED
TABLE 463
CHARNWOOD DISCOVERY: COMPANY OVERVIEW
TABLE 464
CHARNWOOD DISCOVERY: PRODUCTS & SERVICES OFFERED
TABLE 465
CHARNWOOD DISCOVERY: DEALS, JANUARY 2021−JANUARY 2025
TABLE 466
THE MATHWORKS, INC.: COMPANY OVERVIEW
TABLE 467
THE MATHWORKS, INC.: PRODUCTS & SERVICES OFFERED
TABLE 468
THE MATHWORKS, INC.: PRODUCT ENHANCEMENTS, JANUARY 2021−JANUARY 2025
TABLE 469
ANSYS, INC.: COMPANY OVERVIEW
TABLE 470
ANSYS, INC.: PRODUCTS & SERVICES OFFERED
TABLE 471
ANSYS, INC.: DEALS, JANUARY 2021−JANUARY 2025
TABLE 472
ANSYS, INC.: OTHER DEVELOPMENTS, JANUARY 2021–JANUARY 2025
FIGURE 1
BIOSIMULATION MARKET SEGMENTATION & REGIONAL SCOPE
FIGURE 4
BREAKDOWN OF PRIMARY INTERVIEWS (DEMAND SIDE): BY COMPANY TYPE, DESIGNATION, AND REGION
FIGURE 5
MARKET SIZE ESTIMATION: REVENUE SHARE ANALYSIS
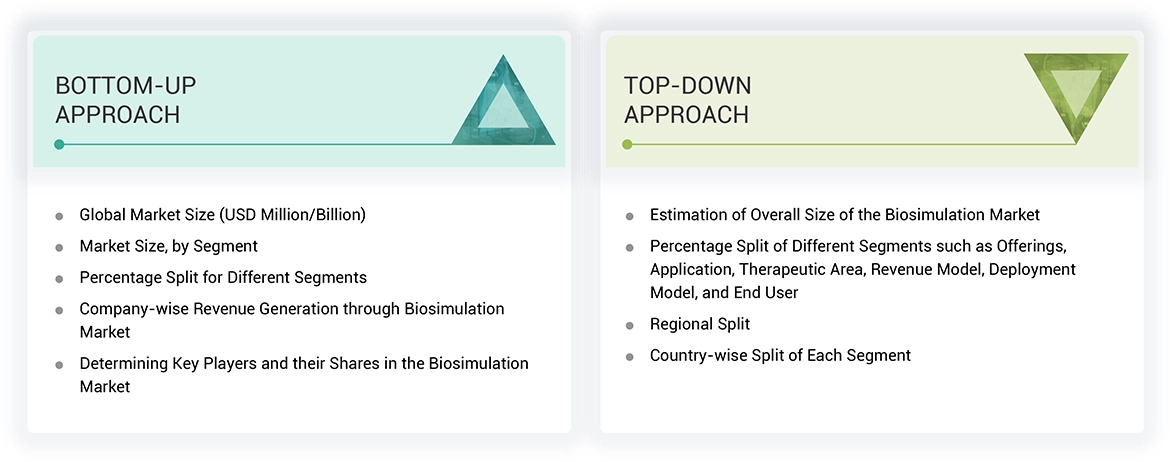
FIGURE 6
TOP-DOWN APPROACH
FIGURE 7
CAGR PROJECTIONS, 2024–2029
FIGURE 8
CAGR PROJECTIONS: SUPPLY-SIDE ANALYSIS
FIGURE 9
DATA TRIANGULATION
FIGURE 10
BIOSIMULATION MARKET, BY OFFERING, 2024 VS. 2029 (USD MILLION)
FIGURE 11
BIOSIMULATION MARKET, BY APPLICATION, 2024 VS. 2029 (USD MILLION)
FIGURE 12
BIOSIMULATION MARKET, BY THERAPEUTIC AREA, 2024 VS. 2029 (USD MILLION)
FIGURE 13
BIOSIMULATION MARKET, BY REVENUE MODEL, 2024 VS. 2029 (USD MILLION)
FIGURE 14
BIOSIMULATION MARKET, BY DEPLOYMENT MODEL, 2024 VS. 2029 (USD MILLION)
FIGURE 15
BIOSIMULATION MARKET, BY END USER, 2024 VS. 2029 (USD MILLION)
FIGURE 16
GEOGRAPHIC SNAPSHOT OF BIOSIMULATION MARKET
FIGURE 17
INCREASING R&D EXPENDITURE ON DRUG DISCOVERY & DEVELOPMENT BY PHARMACEUTICAL & BIOTECHNOLOGY COMPANIES TO DRIVE MARKET
FIGURE 18
CHINA DOMINATED MARKET IN ASIA PACIFIC IN 2023
FIGURE 19
INDIA TO REGISTER HIGHEST GROWTH RATE DURING FORECAST PERIOD
FIGURE 20
NORTH AMERICA TO DOMINATE BIOSIMULATION MARKET DURING FORECAST PERIOD
FIGURE 21
EMERGING ECONOMIES TO REGISTER HIGHER GROWTH RATES DURING FORECAST PERIOD
FIGURE 22
BIOSIMULATION MARKET: DRIVERS, RESTRAINTS, OPPORTUNITIES, AND CHALLENGES
FIGURE 23
BIOSIMULATION MARKET: ECOSYSTEM ANALYSIS
FIGURE 24
BIOSIMULATION MARKET: VALUE CHAIN ANALYSIS
FIGURE 25
BIOSIMULATION MARKET: PORTER’S FIVE FORCES ANALYSIS
FIGURE 26
BIOSIMULATION-RELATED PATENT APPLICATIONS AND PUBLICATIONS, 2015–2024
FIGURE 27
BIOSIMULATION MARKET: PATENT ANALYSIS, JANUARY 2015–DECEMBER 2024
FIGURE 28
INDICATIVE PRICING ANALYSIS FOR BIOSIMULATION SOFTWARE
FIGURE 29
INFLUENCE OF STAKEHOLDERS ON BUYING PROCESS OF TOP 3 END USERS
FIGURE 30
KEY BUYING CRITERIA FOR TOP 3 END USERS
FIGURE 31
TRENDS & DISRUPTIONS IMPACTING CUSTOMERS’ BUSINESSES
FIGURE 32
BIOSIMULATION MARKET: INVESTMENT AND FUNDING SCENARIO FOR SMES
FIGURE 33
MARKET POTENTIAL OF AI/GENERATIVE AI ON BIOSIMULATION
FIGURE 34
IMPACT OF AI/GEN AI ON INTERCONNECTED AND ADJACENT ECOSYSTEMS
FIGURE 35
NORTH AMERICA: BIOSIMULATION MARKET SNAPSHOT
FIGURE 36
ASIA PACIFIC: BIOSIMULATION MARKET SNAPSHOT
FIGURE 37
REVENUE ANALYSIS OF KEY PLAYERS IN BIOSIMULATION MARKET, 2019–2023 (USD BILLION)
FIGURE 38
BIOSIMULATION MARKET: MARKET SHARE ANALYSIS (2023)
FIGURE 39
RANKING OF KEY PLAYERS IN BIOSIMULATION MARKET, 2023
FIGURE 40
BIOSIMULATION MARKET: COMPANY EVALUATION MATRIX (KEY PLAYERS), 2023
FIGURE 41
BIOSIMULATION MARKET: COMPANY FOOTPRINT
FIGURE 42
BIOSIMULATION MARKET: COMPANY EVALUATION MATRIX (START-UPS/SMES), 2023
FIGURE 43
EV/EBITDA OF KEY VENDORS, 2025
FIGURE 44
YEAR-TO-DATE (YTD) PRICE TOTAL RETURN AND 5-YEAR STOCK BETA VALUE FOR BIOSIMULATION VENDORS
FIGURE 45
BIOSIMULATION MARKET: BRAND/PRODUCT COMPARATIVE ANALYSIS
FIGURE 46
CERTARA, USA: COMPANY SNAPSHOT (2023)
FIGURE 47
DASSAULT SYSTÈMES: COMPANY SNAPSHOT (2023)
FIGURE 48
SCHRÖDINGER, INC.: COMPANY SNAPSHOT (2023)
FIGURE 49
SIMULATIONS PLUS: COMPANY SNAPSHOT (2023)
FIGURE 50
GENEDATA AG (A DANAHER COMPANY): COMPANY SNAPSHOT (2023)
FIGURE 51
PHYSIOMICS PLC: COMPANY SNAPSHOT (2023)
FIGURE 52
OPENEYE, CADENCE MOLECULAR SCIENCES: COMPANY SNAPSHOT (2023)
FIGURE 53
ANSYS, INC.: COMPANY SNAPSHOT (2023)


 Exclusive indicates content/data unique to MarketsandMarkets and not available with any competitors.
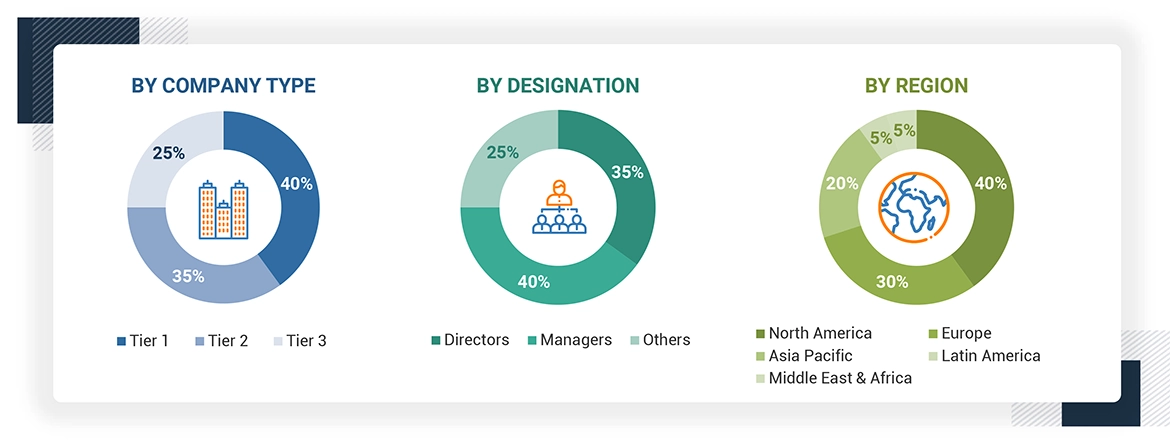


Growth opportunities and latent adjacency in Biosimulation Market