Biocides Market

Biocides Market by Type (Non-oxidizing Biocides, Oxidizing Biocides), Application (Water Treatment, Industrial & Institutional Cleaning and Home Care, Paints & Coatings, Wood Preservatives), and Region - Global Forecast to 2029

Report Code: CH 2155 Aug, 2024, by marketsandmarkets.com

Updated on : November 25, 2024

Biocides Market

The global biocides market is valued at USD 9.7 billion in 2024 and is projected to reach USD 12.3 billion by 2029, growing at 4.9% cagr from 2024 to 2029. Biocides are agents or compounds designed to manage and eliminate harmful organisms using chemical or biological methods. Biocides are used in the water treatment sector to prevent microbiological growth in storage tanks, pipelines, and cooling towers. They are used to maintain the safety and purity of the water supply, reduce corrosion, and stop the development of biofilms. Biocides are used in various applications such as water treatment, industrial & institutional cleaning and home care, paints & coatings, wood preservatives, and other bocides to control bacteria, fungi, viruses, insects, rodents, and other harmful organisms.

Biocides Market Forecast & Trends

Biocides Market

To know about the assumptions considered for the study, Request for Free Sample Report

Biocides Market

Biocides Market Dynamics

Driver: Increase in antimicrobial protection in end-use industries

The market for biocides is being driven by the increasing need for antimicrobial protection in diverse applications. Biocides are crucial in the water treatment sector because they regulate microbial development and ensure that the water remains safe and clean. Biocides are used in the household and industrial cleaning industries to maintain hygienic practices and stop the spread of harmful bacteria. Biocides aid in preventing microbial deterioration in the paint and coatings sector, prolonging product life. Similarly, biocides improve longevity in wood preservation by providing protection from fungi and insects. The need for biocides in various areas is fueled by the growing emphasis on health, safety, and product longevity as well as by the strict rules for microbial control.

Restraints: Environmental regulations on toxic biocides

The market for biocides is greatly impacted by environmental rules on harmful biocides because they encourage the creation and use of safer substitutes. Tight rules force producers to develop innovative, environmentally friendly, biodegradable solutions to reduce the harmful effects of toxic biocides on the environment and the health concerns they provide. To meet market needs, compliance with these rules often necessitates significant testing and certification, which can be expensive. In a consequence, the market for green biocides which provide antimicrobial protection without causing negative side effects is expanding. In addition to improving environmental sustainability, this regulatory pressure also encourages biocide technology breakthroughs, which result in safer goods and more market prospects for producers who comply.

Opportunities: Rising demand for green biocides

The market for biocides has the potential for substantial growth due to the growing demand for environmentally friendly and sustainable products from both consumers and enterprises. Green biocides, derived from natural sources or formulated to be less harmful to the environment, cater to the growing awareness and regulatory pressures regarding environmental and human health. Due to their lower toxicology and less environmental impact, these biocides are preferred in applications such as food preservation, water treatment, and personal care products. The market for green biocides is growing as sustainability gains traction, giving producers a competitive advantage and supporting international environmental objectives.

Challenges : Fluctuating raw material prices

The market for biocides is severely impacted by fluctuating raw material costs, which influence manufacturing costs and profit margins. Global demand fluctuations, supply chain interruptions, and geopolitical tensions are some of the variables that might affect the price of essential raw materials, including chemical precursors and natural extracts. Manufacturers find it challenging to maintain stable prices because of these swings, and they may have to raise manufacturing costs and pass those savings along to customers. The availability and affordability of creating new biocidal products may also be impacted by this instability, which could impede industry expansion and competitiveness.

Biocides Market Ecosystem

Leading companies in this market include well-established biocides manufacturers. These businesses have been in business for a while and have an extensive range of products, pioneering technologies, and strong international sales and marketing networks. Top companies in this market include LANXESS AG (Germany), Veolia Group (France), Arxada AG (Switzerland), Ecolab Inc. (US), Nouryon (Netherlands), General Electric Company (US), Evonik Industries AG (Germany), Solvay SA (Belgium), and Clariant AG (Switzerland).

Biocides Market Ecosystem

“Based on type, oxidizing biocides was the second largest type for biocides in 2023, in terms of value.”

Oxidizing biocides are the second most popular kind of biocides on the market in 2023 because of their rapid action and broad-spectrum effectiveness against a variety of microorganisms, such as fungus, viruses, and bacteria. These biocides are very successful in a variety of applications because they oxidize biological components, which destroys microbial cells. Because of their effectiveness in preventing biofilm formation and microbial contamination, they are frequently utilized in industrial operations, water treatment facilities, and healthcare environments. Oxidizing biocides are in high demand because they work well at low concentrations and can be used in a variety of settings where strict disinfection regulations are needed, such as cooling towers, swimming pools, and drinking water systems.

“Based on application, industrial & institutional cleaning and home care was the second largest application for biocides  in 2023, in terms of value.”

The increased emphasis on hygiene and cleanliness has made the industrial and institutional cleaning as well as home care segment the second-largest segment of the biocides market in 2023. The need for efficient antimicrobial agents in cleaning solutions has increased due to growing awareness of the importance of preventing infections and maintaining hygienic surroundings. Biocides are necessary in both home and business settings to get rid of dangerous bacteria and ensure clean, safe surfaces. Additionally, the need for biocidal products is expanding due to the growth of food processing companies, public facilities, and healthcare facilities. In addition, the expanding number of people living in cities and rising living standards have raised the need for cleaning supplies. The demand for practical and efficient cleaning products containing biocides has increased as people place a higher priority on cleanliness and hygiene, particularly in metropolitan areas.

“North America was the largest region in biocides market 2023, in terms of value.”

North America is the largest region in the biocides market in 2023 due to its rapid industrialization, urbanization, and infrastructure development. Countries like US are experiencing significant growth in sectors such as paints & coatings, water treatment, and industrial & institutional cleaning and home care, which heavily rely on biocides to prevent microbial growth, ensuring product durability and hygiene. These biocides are crucial for keeping safety regulations and extending the life of systems and products. The region's focus on technological advancements, product durability and hygiene in paints & coatings, water treatment, and industrial & institutional cleaning and home care industries further supports its leading position in the biocides market.

Biocides Market by Region

To know about the assumptions considered for the study, download the pdf brochure

Biocides Market Players

The key players profiled in the report LANXESS AG (Germany), Veolia Group (France), Arxada AG (Switzerland), Ecolab Inc. (US), and Nouryon (Netherlands), among others, are the key manufacturers that holds major market share in the last few years. A major focus was given to collaborations, partnerships, and new product development due to the changing requirements of users across the world.

Biocides Market Report Scope

Report Metric

Details

Years considered for the study

2018–2029

Base year considered

2023

Forecast period

2024–2029

Units considered

Value (USD Million), Volume (Kiloton)

Segments covered

Type, Application, and Region

Regions covered

Asia Pacific, North America, Europe, Middle East & Africa, and South America

Companies profiled

LANXESS AG (Germany), Veolia Group (France), Arxada AG (Switzerland), Ecolab Inc. (US), Nouryon (Netherlands), General Electric Company (US), Evonik Industries AG (Germany), Solvay SA (Belgium), and Clariant AG (Switzerland)

This report categorizes the global biocides market based on type, application, and region.

Based on type, the biocides market has been segmented as follows:
  • Oxidizing Biocides
  • Non-oxidizing Biocides
  • Other Biocides type
Based on end-use industry, the biocides market has been segmented as follows:
  • Water Treatment
  • Industrial & Institutional Cleaning and Home Care
  • Paints & Coatings
  • Wood Preservatives
  • Others
Based on region, the biocides market has been segmented as follows:
  • Asia Pacific
  • North America
  • Europe
  • Middle East & Africa
  • South America

Recent Developments

  • In 2024, Univar Solutions Brasil Ltd., a subsidiary of Univar Solutions LLC, announced a new distribution agreement with Arxada for a full range of biocides, preservatives, and performance additives used in industrial applications such as paints, coatings, and lubricating fluids in Brazil.
  • In 2023, Solvay completed the partial spin-off of its Specialty Businesses into a new standalone company called Syensqo. The completion of this spin-off was effective on December 9, 2023, and Solvay and Syensqo started trading as separate entities on Euronext Brussels and Paris.
  • In 2023, Solvay completed the divestment of its 50% stake in the Rusvinyl joint venture to its partner Sibur in the first quarter of 2023, with the transaction having an impact on Solvay's 2023 financial results.

Frequently Asked Questions (FAQ):

To speak to our analyst for a discussion on the above findings, click Speak to Analyst

Exclusive indicates content/data unique to MarketsandMarkets and not available with any competitors.

INTRODUCTION
24
RESEARCH METHODOLOGY
31
EXECUTIVE SUMMARY
41
PREMIUM INSIGHTS
44
MARKET OVERVIEW
47
  • 5.1 INTRODUCTION
  • 5.2 MARKET DYNAMICS
    DRIVERS
    - Increase in antimicrobial protection in end-use industries
    - Stringent regulatory environment
    - Government focus on consumption of clean water
    RESTRAINTS
    - Lengthy and expensive registration process
    - Environmental regulations on toxic biocides
    OPPORTUNITIES
    - Rising demand for green biocides
    - Emerging applications of biocidal products
    CHALLENGES
    - Fluctuating raw material prices
  • 5.3 PORTER’S FIVE FORCES ANALYSIS
    THREAT OF NEW ENTRANTS
    THREAT OF SUBSTITUTES
    BARGAINING POWER OF SUPPLIERS
    BARGAINING POWER OF BUYERS
    INTENSITY OF COMPETITIVE RIVALRY
  • 5.4 MACROECONOMIC INDICATORS
    GDP TRENDS AND FORECAST FOR MAJOR ECONOMIES
INDUSTRY TRENDS
56
  • 6.1 SUPPLY CHAIN ANALYSIS
    RAW MATERIAL
    MANUFACTURER
    DISTRIBUTION NETWORK
    APPLICATION
  • 6.2 KEY STAKEHOLDERS & BUYING CRITERIA
    KEY STAKEHOLDERS IN BUYING PROCESS
    BUYING CRITERIA
  • 6.3 PRICING ANALYSIS
    AVERAGE SELLING PRICE TREND OF KEY PLAYERS, BY APPLICATION
    AVERAGE SELLING PRICE TREND, BY REGION
  • 6.4 TRENDS/DISRUPTIONS IMPACTING CUSTOMER BUSINESS
    REVENUE SHIFT & REVENUE POCKETS FOR BIOCIDES MARKET
  • 6.5 ECOSYSTEM ANALYSIS/MARKET MAP
  • 6.6 TECHNOLOGY ANALYSIS
    KEY TECHNOLOGIES
    - Aqueous process
    - Kemira KemConnect DEX technology
    - Thor AMME (Advanced Micro Matrix Embedding) technology
  • 6.7 CASE STUDY ANALYSIS
    VEOLIA GROUP
    ECOLAB INC.
    EVONIK INDUSTRIES AG
  • 6.8 TRADE DATA STATISTICS
    IMPORT SCENARIO OF BIOCIDES
    EXPORT SCENARIO OF BIOCIDES
  • 6.9 REGULATORY LANDSCAPE
    REGULATORY BODIES, GOVERNMENT AGENCIES, AND OTHER ORGANIZATIONS
  • 6.10 KEY CONFERENCES & EVENTS IN 2024
  • 6.11 INVESTMENT AND FUNDING SCENARIO
  • 6.12 PATENT ANALYSIS
    APPROACH
    DOCUMENT TYPE
    TOP APPLICANTS
    JURISDICTION ANALYSIS
  • 6.13 IMPACT OF AI/GEN AI ON BIOCIDES MARKET
BIOCIDES MARKET, BY TYPE
79
  • 7.1 INTRODUCTION
  • 7.2 OXIDIZING BIOCIDES
    PREVENTION OF MICROBIAL DEVELOPMENT IN INDUSTRIAL, MUNICIPAL, AND HEALTHCARE SECTORS TO DRIVE MARKET
    HALOGEN COMPOUNDS
  • 7.3 NON-OXIDIZING BIOCIDES
    EXTENSIVE USE IN OIL & GAS PRODUCTION TO DRIVE MARKET
    METALLIC COMPOUNDS
    QUATERNARY AMMONIUM COMPOUNDS
    ORGANOSULFUR
    GLUTARALDEHYDE
    ORGANIC ACIDS
    PHENOLIC COMPOUNDS
  • 7.4 OTHER BIOCIDE TYPES
BIOCIDES MARKET, BY APPLICATION
92
  • 8.1 INTRODUCTION
  • 8.2 WATER TREATMENT
    RAPID INDUSTRIALIZATION, ENVIRONMENTAL AWARENESS, AND REGULATIONS TO DRIVE MARKET
    MUNICIPAL WATER TREATMENT
    - Growing population, limited freshwater resources, and increasing water scarcity to drive market
    OIL & GAS
    - Need for microbial control for operational efficiency to drive market
    POWER PLANTS
    - Growth of power generation industry to drive market
    PULP & PAPER
    - Use of high volumes of processed water for pulp preparation and bleaching to drive market
    SWIMMING POOLS
    - Demand for chlorine-based disinfectants to drive market
    MINING
    - Extensive use for water-intensive industry to drive market
    OTHER WATER TREATMENT APPLICATIONS
  • 8.3 INDUSTRIAL & INSTITUTIONAL CLEANING AND HOME CARE
    RISING AWARENESS AMONG CONSUMERS REGARDING HYGIENE TO DRIVE MARKET
  • 8.4 WOOD PRESERVATIVES
    RESIDENTIAL CONSTRUCTION AND INDUSTRIAL APPLICATIONS TO DRIVE MARKET
  • 8.5 PAINTS & COATINGS
    PREVENTION OF GROWTH OF BACTERIA, YEASTS, FUNGI, AND MOLDS TO DRIVE MARKET
    MARINE COATINGS
    - Prevention of drag, reduction of vessel speed, and increased fuel consumption to drive market
    OTHER PAINT & COATING APPLICATIONS
  • 8.6 OTHER APPLICATIONS
BIOCIDES MARKET, BY REGION
119
  • 9.1 INTRODUCTION
  • 9.2 ASIA PACIFIC
    CHINA
    - Exponential growth of manufacturing industry to drive market
    INDIA
    - Increased demand for clean drinking water and construction activities to drive market
    JAPAN
    - Infrastructure, shipbuilding, and automotive sectors to drive market
    SOUTH KOREA
    - Shipbuilding, chemical, automotive, and water treatment sectors to drive market
    INDONESIA
    - Increasing FDI in manufacturing industry to drive market
    AUSTRALIA AND NEW ZEALAND
    - Consumer goods, mining, wood, and power industries to drive market
  • 9.3 EUROPE
    GERMANY
    - Increased demand for environment-friendly biocides to drive market
    FRANCE
    - Large chemical industry to drive market
    ITALY
    - Demand for environmentally friendly non-oxidized and oxidized biocides to drive market
    UK
    - R&D investments in chemical industry to drive market
    RUSSIA
    - Oil & gas sector to drive market
  • 9.4 NORTH AMERICA
    US
    - Large chemical industry to drive market
    CANADA
    - Demand for water treatment and wood preservatives to drive market
    MEXICO
    - Increased construction activities to drive market
  • 9.5 MIDDLE EAST & AFRICA
    GCC
    - Expansion of oil & gas industry to support market growth
    - Saudi Arabia
    - UAE
    IRAN
    - Rising industrialization to drive market
    SOUTH AFRICA
    - Presence of automotive plants to drive market
  • 9.6 SOUTH AMERICA
    BRAZIL
    - Construction industry to drive market
    ARGENTINA
    - Demand for mining and oil sectors to drive market
COMPETITIVE LANDSCAPE
213
  • 10.1 INTRODUCTION
  • 10.2 KEY PLAYER STRATEGIES/RIGHT TO WIN
    OVERVIEW OF STRATEGIES ADOPTED BY KEY BIOCIDE MANUFACTURERS
  • 10.3 MARKET SHARE ANALYSIS
  • 10.4 REVENUE ANALYSIS, 2019–2023
  • 10.5 COMPANY EVALUATION MATRIX: KEY PLAYERS, 2023
    STARS
    EMERGING LEADERS
    PERVASIVE PLAYERS
    PARTICIPANTS
    COMPANY FOOTPRINT: KEY PLAYERS, 2023
    - Company footprint
    - Region footprint
    - Type footprint
    - Application footprint
  • 10.6 COMPANY EVALUATION MATRIX: STARTUPS/SMES, 2023
    PROGRESSIVE COMPANIES
    RESPONSIVE COMPANIES
    DYNAMIC COMPANIES
    STARTING BLOCKS
    COMPETITIVE BENCHMARKING: STARTUPS/SMES, 2023
    - Detailed list of key startups/SMES
    - Competitive benchmarking of key startups/SMEs
  • 10.7 BRAND/PRODUCT COMPARISON
  • 10.8 COMPANY VALUATION AND FINANCIAL METRICS
  • 10.9 COMPETITIVE SCENARIO
    DEALS
    EXPANSIONS
    PRODUCT LAUNCHES
    OTHER DEVELOPMENTS
COMPANY PROFILES
234
  • 11.1 KEY PLAYERS
    LANXESS AG
    - Business overview
    - Products/Solutions/Services offered
    - Recent developments
    - MnM view
    VEOLIA GROUP
    - Business overview
    - Products/Solutions/Services offered
    - Recent developments
    - MnM view
    ARXADA AG
    - Business overview
    - Products/Solutions/Services offered
    - Recent developments
    - MnM view
    ECOLAB INC.
    - Business overview
    - Products/Solutions/Services offered
    - Recent developments
    - MnM view
    NOURYON
    - Business overview
    - Products/Solutions/Services offered
    - Recent developments
    - MnM view
    GENERAL ELECTRIC COMPANY
    - Business overview
    - Products/Solutions/Services offered
    - MnM view
    EVONIK INDUSTRIES AG
    - Business overview
    - Products/Solutions/Services offered
    - MnM view
    SOLVAY SA
    - Business overview
    - Products/Solutions/Services offered
    - Recent developments
    - MnM view
    CLARIANT AG
    - Business overview
    - Products/Solutions/Services offered
    - MnM view
    ITALMATCH CHEMICALS S.P.A.
    - Business overview
    - Products/Solutions/Services offered
    - Recent developments
    SOLENIS
    - Business overview
    - Products/Solutions/Services offered
    - Recent developments
  • 11.2 OTHER PLAYERS
    KEMIRA OYJ
    STEPAN COMPANY
    DANAHER CORPORATION
    ALBEMARLE CORPORATION
    FMC CORPORATION
    ICL GROUP
    BASF SE
    CES ENERGY SOLUTIONS CORP.
    ARKEMA SA
    THE LUBRIZOL CORPORATION
    THOR GROUP LIMITED
    CHEMICREA INC.
    MERCK KGAA
    ACCEPTA WATER TREATMENT
ADJACENT & RELATED MARKETS
285
  • 12.1 INTRODUCTION
  • 12.2 LIMITATIONS
  • 12.3 WATER TREATMENT CHEMICALS MARKET
    MARKET DEFINITION
    MARKET OVERVIEW
  • 12.4 WATER TREATMENT CHEMICALS MARKET, BY REGION
    NORTH AMERICA
    EUROPE
    ASIA PACIFIC
    MIDDLE EAST & AFRICA
    SOUTH AMERICA
APPENDIX
295
  • 13.1 DISCUSSION GUIDE
  • 13.2 KNOWLEDGESTORE: MARKETSANDMARKETS’ SUBSCRIPTION PORTAL
  • 13.3 CUSTOMIZATION OPTIONS
  • 13.4 RELATED REPORTS
  • 13.5 AUTHOR DETAILS
LIST OF TABLES
 
  • TABLE 1 BIOCIDES MARKET: RISK ASSESSMENT
  • TABLE 2 GLOBAL OIL PRODUCTION, 2018–2023 (MILLION TON)
  • TABLE 3 FEES PAYABLE TO EUROPEAN CHEMICALS AGENCY CONCERNING USE AND MARKETING OF BIOCIDAL PRODUCTS IN EUROPEAN UNION
  • TABLE 4 BIOCIDES MARKET: PORTER’S FIVE FORCES ANALYSIS
  • TABLE 5 GDP TRENDS AND FORECAST OF MAJOR ECONOMIES, 2021–2029 (USD BILLION)
  • TABLE 6 INFLUENCE OF STAKEHOLDERS ON BUYING PROCESS FOR TOP 3 APPLICATIONS (%)
  • TABLE 7 KEY BUYING CRITERIA FOR TOP 3 APPLICATIONS
  • TABLE 8 AVERAGE SELLING PRICE TREND OF KEY PLAYERS FOR TOP 3 APPLICATIONS (USD/KG)
  • TABLE 9 AVERAGE SELLING PRICE TREND, BY REGION (USD/KG)
  • TABLE 10 BIOCIDES MARKET: ECOSYSTEM
  • TABLE 11 BENEFITS OF OSG HYDREX
  • TABLE 12 IMPORT OF BIOCIDES, BY REGION, 2017–2022 (USD BILLION)
  • TABLE 13 EXPORT OF BIOCIDES, BY REGION, 2017–2022 (USD BILLION)
  • TABLE 14 NORTH AMERICA: REGULATIONS RELATED TO BIOCIDES
  • TABLE 15 EUROPE: REGULATIONS RELATED TO BIOCIDES
  • TABLE 16 ASIA PACIFIC: REGULATIONS RELATED TO BIOCIDES
  • TABLE 17 MIDDLE EAST & AFRICA: REGULATIONS RELATED TO BIOCIDES
  • TABLE 18 BIOCIDES: REGULATORY BODIES, GOVERNMENT AGENCIES, AND OTHER ORGANIZATIONS
  • TABLE 19 BIOCIDES MARKET: DETAILED LIST OF CONFERENCES & EVENTS
  • TABLE 20 BIOCIDES MARKET: FUNDING/INVESTMENT
  • TABLE 21 GRANTED PATENTS ACCOUNTED FOR 47.1% OF TOTAL COUNT
  • TABLE 22 MAJOR PATENTS FOR BIOCIDES
  • TABLE 23 PATENTS BY DOW GLOBAL TECHNOLOGIES LLC
  • TABLE 24 PATENTS BY BASF SE
  • TABLE 25 PATENTS BY NOVOZYMES A/S
  • TABLE 26 TOP 10 PATENT OWNERS IN US, 2013–2023
  • TABLE 27 TYPES OF BIOCIDES USED IN INDUSTRIAL APPLICATIONS
  • TABLE 28 BIOCIDES MARKET, BY TYPE, 2018–2022 (KILOTON)
  • TABLE 29 MARKET, BY TYPE, 2023–2029 (KILOTON)
  • TABLE 30 BIOCIDES MARKET, BY TYPE, 2018–2022 (USD MILLION)
  • TABLE 31 MARKET, BY TYPE, 2023–2029 (USD MILLION)
  • TABLE 32 OXIDIZING BIOCIDES MARKET, BY REGION, 2018–2022 (KILOTON)
  • TABLE 33 OXIDIZING MARKET, BY REGION, 2023–2029 (KILOTON)
  • TABLE 34 OXIDIZING BIOCIDES MARKET, BY REGION, 2018–2022 (USD MILLION)
  • TABLE 35 OXIDIZING MARKET, BY REGION, 2023–2029 (USD MILLION)
  • TABLE 36 ADVANTAGES AND DISADVANTAGES OF NON-OXIDIZING BIOCIDES
  • TABLE 37 NON-OXIDIZING BIOCIDES MARKET, BY REGION, 2018–2022 (KILOTON)
  • TABLE 38 NON-OXIDIZING MARKET, BY REGION, 2023–2029 (KILOTON)
  • TABLE 39 NON-OXIDIZING BIOCIDES MARKET, BY REGION, 2018–2022 (USD MILLION)
  • TABLE 40 NON-OXIDIZING MARKET, BY REGION, 2023–2029 (USD MILLION)
  • TABLE 41 OTHER BIOCIDE TYPES MARKET, BY REGION, 2018–2022 (KILOTON)
  • TABLE 42 OTHER BIOCIDE TYPES MARKET, BY REGION, 2023–2029 (KILOTON)
  • TABLE 43 OTHER BIOCIDE TYPES MARKET, BY REGION, 2018–2022 (USD MILLION)
  • TABLE 44 OTHER BIOCIDE TYPES MARKET, BY REGION, 2023–2029 (USD MILLION)
  • TABLE 45 BIOCIDES MARKET, BY APPLICATION, 2018–2022 (KILOTON)
  • TABLE 46 MARKET, BY APPLICATION, 2023–2029 (KILOTON)
  • TABLE 47 BIOCIDES MARKET, BY APPLICATION, 2018–2022 (USD MILLION)
  • TABLE 48 MARKET, BY APPLICATION, 2023–2029 (USD MILLION)
  • TABLE 49 BIOCIDES MARKET IN WATER TREATMENT APPLICATIONS, BY REGION, 2018–2022 (KILOTON)
  • TABLE 50 MARKET IN WATER TREATMENT APPLICATIONS, BY REGION, 2023–2029 (KILOTON)
  • TABLE 51 BIOCIDES MARKET IN WATER TREATMENT APPLICATIONS, BY REGION, 2018–2022 (USD MILLION)
  • TABLE 52 MARKET IN WATER TREATMENT APPLICATIONS, BY REGION, 2023–2029 (USD MILLION)
  • TABLE 53 BIOCIDES MARKET IN MUNICIPAL WATER TREATMENT APPLICATIONS, BY REGION, 2018–2022 (KILOTON)
  • TABLE 54 MARKET IN MUNICIPAL WATER TREATMENT APPLICATIONS, BY REGION, 2023–2029 (KILOTON)
  • TABLE 55 BIOCIDES MARKET IN MUNICIPAL WATER TREATMENT APPLICATIONS, BY REGION, 2018–2022 (USD MILLION)
  • TABLE 56 MARKET IN MUNICIPAL WATER TREATMENT APPLICATIONS, BY REGION, 2023–2029 (USD MILLION)
  • TABLE 57 BIOCIDES MARKET IN OIL & GAS WATER TREATMENT APPLICATIONS, BY REGION, 2018–2022 (KILOTON)
  • TABLE 58 MARKET IN OIL & GAS WATER TREATMENT APPLICATIONS, BY REGION, 2023–2029 (KILOTON)
  • TABLE 59 BIOCIDES MARKET IN OIL & GAS WATER TREATMENT APPLICATIONS, BY REGION, 2018–2022 (USD MILLION)
  • TABLE 60 MARKET IN OIL & GAS WATER TREATMENT APPLICATIONS, BY REGION, 2023–2029 (USD MILLION)
  • TABLE 61 BIOCIDES MARKET IN POWER PLANT WATER TREATMENT APPLICATIONS, BY REGION, 2018–2022 (KILOTON)
  • TABLE 62 MARKET IN POWER PLANT WATER TREATMENT APPLICATIONS, BY REGION, 2023–2029 (KILOTON)
  • TABLE 63 BIOCIDES MARKET IN POWER PLANT WATER TREATMENT APPLICATIONS, BY REGION, 2018–2022 (USD MILLION)
  • TABLE 64 MARKET IN POWER PLANT WATER TREATMENT APPLICATIONS, BY REGION, 2023–2029 (USD MILLION)
  • TABLE 65 BIOCIDES MARKET IN PULP & PAPER WATER TREATMENT APPLICATIONS, BY REGION, 2018–2022 (KILOTON)
  • TABLE 66 MARKET IN PULP & PAPER WATER TREATMENT APPLICATIONS, BY REGION, 2023–2029 (KILOTON)
  • TABLE 67 BIOCIDES MARKET IN PULP & PAPER WATER TREATMENT APPLICATIONS, BY REGION, 2018–2022 (USD MILLION)
  • TABLE 68 MARKET IN PULP & PAPER WATER TREATMENT APPLICATIONS, BY REGION, 2023–2029 (USD MILLION)
  • TABLE 69 BIOCIDES MARKET IN SWIMMING POOL WATER TREATMENT APPLICATIONS, BY REGION, 2018–2022 (KILOTON)
  • TABLE 70 MARKET IN SWIMMING POOL WATER TREATMENT APPLICATIONS, BY REGION, 2023–2029 (KILOTON)
  • TABLE 71 BIOCIDES MARKET IN SWIMMING POOL WATER TREATMENT APPLICATIONS, BY REGION, 2018–2022 (USD MILLION)
  • TABLE 72 MARKET IN SWIMMING POOL WATER TREATMENT APPLICATIONS, BY REGION, 2023–2029 (USD MILLION)
  • TABLE 73 BIOCIDES MARKET IN MINING WATER TREATMENT APPLICATIONS, BY REGION, 2018–2022 (KILOTON)
  • TABLE 74 MARKET IN MINING WATER TREATMENT APPLICATIONS, BY REGION, 2023–2029 (KILOTON)
  • TABLE 75 BIOCIDES MARKET IN MINING WATER TREATMENT APPLICATIONS, BY REGION, 2018–2022 (USD MILLION)
  • TABLE 76 MARKET IN MINING WATER TREATMENT APPLICATIONS, BY REGION, 2023–2029 (USD MILLION)
  • TABLE 77 BIOCIDES MARKET IN OTHER WATER TREATMENT APPLICATIONS, BY REGION, 2018–2022 (KILOTON)
  • TABLE 78 MARKET IN OTHER WATER TREATMENT APPLICATIONS, BY REGION, 2023–2029 (KILOTON)
  • TABLE 79 BIOCIDES MARKET IN OTHER WATER TREATMENT APPLICATIONS, BY REGION, 2018–2022 (USD MILLION)
  • TABLE 80 MARKET IN OTHER WATER TREATMENT APPLICATIONS, BY REGION, 2023–2029 (USD MILLION)
  • TABLE 81 BIOCIDES MARKET IN INDUSTRIAL & INSTITUTIONAL CLEANING AND HOME CARE APPLICATIONS, BY REGION, 2018–2022 (KILOTON)
  • TABLE 82 MARKET IN INDUSTRIAL & INSTITUTIONAL CLEANING AND HOME CARE APPLICATIONS, BY REGION, 2023–2029 (KILOTON)
  • TABLE 83 BIOCIDES MARKET IN INDUSTRIAL & INSTITUTIONAL CLEANING AND HOME CARE APPLICATIONS, BY REGION, 2018–2022 (USD MILLION)
  • TABLE 84 MARKET IN INDUSTRIAL & INSTITUTIONAL CLEANING AND HOME CARE APPLICATIONS, BY REGION, 2023–2029 (USD MILLION)
  • TABLE 85 BIOCIDES MARKET IN WOOD PRESERVATIVES APPLICATIONS, BY REGION, 2018–2022 (KILOTON)
  • TABLE 86 MARKET IN WOOD PRESERVATIVES APPLICATIONS, BY REGION, 2023–2029 (KILOTON)
  • TABLE 87 BIOCIDES MARKET IN WOOD PRESERVATIVES APPLICATIONS, BY REGION, 2018–2022 (USD MILLION)
  • TABLE 88 MARKET IN WOOD PRESERVATIVES APPLICATIONS, BY REGION, 2023–2029 (USD MILLION)
  • TABLE 89 BIOCIDES MARKET IN PAINTS & COATINGS APPLICATIONS, BY REGION, 2018–2022 (KILOTON)
  • TABLE 90 MARKET IN PAINTS & COATINGS APPLICATIONS, BY REGION, 2023–2029 (KILOTON)
  • TABLE 91 BIOCIDES MARKET IN PAINTS & COATINGS APPLICATIONS, BY REGION, 2018–2022 (USD MILLION)
  • TABLE 92 MARKET IN PAINTS & COATINGS APPLICATIONS, BY REGION, 2023–2029 (USD MILLION)
  • TABLE 93 BIOCIDES MARKET IN OTHER APPLICATIONS, BY REGION, 2018–2022 (KILOTON)
  • TABLE 94 MARKET IN OTHER APPLICATIONS, BY REGION, 2023–2029 (KILOTON)
  • TABLE 95 BIOCIDES MARKET IN OTHER APPLICATIONS, BY REGION, 2018–2022 (USD MILLION)
  • TABLE 96 MARKET IN OTHER APPLICATIONS, BY REGION, 2023–2029 (USD MILLION)
  • TABLE 97 BIOCIDES MARKET, BY REGION, 2018–2022 (KILOTON)
  • TABLE 98 MARKET, BY REGION, 2023–2029 (KILOTON)
  • TABLE 99 BIOCIDES MARKET, BY REGION, 2018–2022 (USD MILLION)
  • TABLE 100 MARKET, BY REGION, 2023–2029 (USD MILLION)
  • TABLE 101 ASIA PACIFIC: BIOCIDES MARKET, BY TYPE, 2018–2022 (KILOTON)
  • TABLE 102 ASIA PACIFIC: MARKET, BY TYPE, 2023–2029 (KILOTON)
  • TABLE 103 ASIA PACIFIC: BIOCIDES MARKET, BY TYPE, 2018–2022 (USD MILLION)
  • TABLE 104 ASIA PACIFIC: MARKET, BY TYPE, 2023–2029 (USD MILLION)
  • TABLE 105 ASIA PACIFIC: BIOCIDES MARKET, BY APPLICATION, 2018–2022 (KILOTON)
  • TABLE 106 ASIA PACIFIC: MARKET, BY APPLICATION, 2023–2029 (KILOTON)
  • TABLE 107 ASIA PACIFIC: BIOCIDES MARKET, BY APPLICATION, 2018–2022 (USD MILLION)
  • TABLE 108 ASIA PACIFIC: MARKET, BY APPLICATION, 2023–2029 (USD MILLION)
  • TABLE 109 ASIA PACIFIC: BIOCIDES MARKET, BY COUNTRY, 2018–2022 (KILOTON)
  • TABLE 110 ASIA PACIFIC: MARKET, BY COUNTRY, 2023–2029 (KILOTON)
  • TABLE 111 ASIA PACIFIC: BIOCIDES MARKET, BY COUNTRY, 2018–2022 (USD MILLION)
  • TABLE 112 ASIA PACIFIC: MARKET, BY COUNTRY, 2023–2029 (USD MILLION)
  • TABLE 113 CHINA: BIOCIDES MARKET, BY APPLICATION, 2018–2022 (KILOTON)
  • TABLE 114 CHINA: MARKET, BY APPLICATION, 2023–2029 (KILOTON)
  • TABLE 115 CHINA: BIOCIDES MARKET, BY APPLICATION, 2018–2022 (USD MILLION)
  • TABLE 116 CHINA: MARKET, BY APPLICATION, 2023–2029 (USD MILLION)
  • TABLE 117 INDIA: BIOCIDES MARKET, BY APPLICATION, 2018–2022 (KILOTON)
  • TABLE 118 INDIA: MARKET, BY APPLICATION, 2023–2029 (KILOTON)
  • TABLE 119 INDIA: BIOCIDES MARKET, BY APPLICATION, 2018–2022 (USD MILLION)
  • TABLE 120 INDIA: MARKET, BY APPLICATION, 2023–2029 (USD MILLION)
  • TABLE 121 JAPAN: BIOCIDES MARKET, BY APPLICATION, 2018–2022 (KILOTON)
  • TABLE 122 JAPAN: MARKET, BY APPLICATION, 2023–2029 (KILOTON)
  • TABLE 123 JAPAN: BIOCIDES MARKET, BY APPLICATION, 2018–2022 (USD MILLION)
  • TABLE 124 JAPAN: MARKET, BY APPLICATION, 2023–2029 (USD MILLION)
  • TABLE 125 SOUTH KOREA: BIOCIDES MARKET, BY APPLICATION, 2018–2022 (KILOTON)
  • TABLE 126 SOUTH KOREA: MARKET, BY APPLICATION, 2023–2029 (KILOTON)
  • TABLE 127 SOUTH KOREA: BIOCIDES MARKET, BY APPLICATION, 2018–2022 (USD MILLION)
  • TABLE 128 SOUTH KOREA: MARKET, BY APPLICATION, 2023–2029 (USD MILLION)
  • TABLE 129 INDONESIA: BIOCIDES MARKET, BY APPLICATION, 2018–2022 (KILOTON)
  • TABLE 130 INDONESIA: MARKET, BY APPLICATION, 2023–2029 (KILOTON)
  • TABLE 131 INDONESIA: BIOCIDES MARKET, BY APPLICATION, 2018–2022 (USD MILLION)
  • TABLE 132 INDONESIA: MARKET, BY APPLICATION, 2023–2029 (USD MILLION)
  • TABLE 133 AUSTRALIA AND NEW ZEALAND: BIOCIDES MARKET, BY APPLICATION, 2018–2022 (KILOTON)
  • TABLE 134 AUSTRALIA AND NEW ZEALAND: MARKET, BY APPLICATION, 2023–2029 (KILOTON)
  • TABLE 135 AUSTRALIA AND NEW ZEALAND: BIOCIDES MARKET, BY APPLICATION, 2018–2022 (USD MILLION)
  • TABLE 136 AUSTRALIA AND NEW ZEALAND: MARKET, BY APPLICATION, 2023–2029 (USD MILLION)
  • TABLE 137 EUROPE: BIOCIDES MARKET, BY TYPE, 2018–2022 (KILOTON)
  • TABLE 138 EUROPE: MARKET, BY TYPE, 2023–2029 (KILOTON)
  • TABLE 139 EUROPE: BIOCIDES MARKET, BY TYPE, 2018–2022 (USD MILLION)
  • TABLE 140 EUROPE: MARKET, BY TYPE, 2023–2029 (USD MILLION)
  • TABLE 141 EUROPE: BIOCIDES MARKET, BY APPLICATION, 2018–2022 (KILOTON)
  • TABLE 142 EUROPE: MARKET, BY APPLICATION, 2023–2029 (KILOTON)
  • TABLE 143 EUROPE: BIOCIDES MARKET, BY APPLICATION, 2018–2022 (USD MILLION)
  • TABLE 144 EUROPE: MARKET, BY APPLICATION, 2023–2029 (USD MILLION)
  • TABLE 145 EUROPE: BIOCIDES MARKET, BY COUNTRY, 2018–2022 (KILOTON)
  • TABLE 146 EUROPE: MARKET, BY COUNTRY, 2023–2029 (KILOTON)
  • TABLE 147 EUROPE: BIOCIDES MARKET, BY COUNTRY, 2018–2022 (USD MILLION)
  • TABLE 148 EUROPE: MARKET, BY COUNTRY, 2023–2029 (USD MILLION)
  • TABLE 149 GERMANY: BIOCIDES MARKET, BY APPLICATION, 2018–2022 (KILOTON)
  • TABLE 150 GERMANY: MARKET, BY APPLICATION, 2023–2029 (KILOTON)
  • TABLE 151 GERMANY: BIOCIDES MARKET, BY APPLICATION, 2018–2022 (USD MILLION)
  • TABLE 152 GERMANY: MARKET, BY APPLICATION, 2023–2029 (USD MILLION)
  • TABLE 153 FRANCE: BIOCIDES MARKET, BY APPLICATION, 2018–2022 (KILOTON)
  • TABLE 154 FRANCE: MARKET, BY APPLICATION, 2023–2029 (KILOTON)
  • TABLE 155 FRANCE: BIOCIDES MARKET, BY APPLICATION, 2018–2022 (USD MILLION)
  • TABLE 156 FRANCE: MARKET, BY APPLICATION, 2023–2029 (USD MILLION)
  • TABLE 157 ITALY: BIOCIDES MARKET, BY APPLICATION, 2018–2022 (KILOTON)
  • TABLE 158 ITALY: MARKET, BY APPLICATION, 2023–2029 (KILOTON)
  • TABLE 159 ITALY: BIOCIDES MARKET, BY APPLICATION, 2018–2022 (USD MILLION)
  • TABLE 160 ITALY: MARKET, BY APPLICATION, 2023–2029 (USD MILLION)
  • TABLE 161 UK: BIOCIDES MARKET, BY APPLICATION, 2018–2022 (KILOTON)
  • TABLE 162 UK: MARKET, BY APPLICATION, 2023–2029 (KILOTON)
  • TABLE 163 UK: BIOCIDES MARKET, BY APPLICATION, 2018–2022 (USD MILLION)
  • TABLE 164 UK: MARKET, BY APPLICATION, 2023–2029 (USD MILLION)
  • TABLE 165 RUSSIA: BIOCIDES MARKET, BY APPLICATION, 2018–2022 (KILOTON)
  • TABLE 166 RUSSIA: MARKET, BY APPLICATION, 2023–2029 (KILOTON)
  • TABLE 167 RUSSIA: BIOCIDES MARKET, BY APPLICATION, 2018–2022 (USD MILLION)
  • TABLE 168 RUSSIA: MARKET, BY APPLICATION, 2023–2029 (USD MILLION)
  • TABLE 169 NORTH AMERICA: BIOCIDES MARKET, BY TYPE, 2018–2022 (KILOTON)
  • TABLE 170 NORTH AMERICA: MARKET, BY TYPE, 2023–2029 (KILOTON)
  • TABLE 171 NORTH AMERICA: BIOCIDES MARKET, BY TYPE, 2018–2022 (USD MILLION)
  • TABLE 172 NORTH AMERICA: MARKET, BY TYPE, 2023–2029 (USD MILLION)
  • TABLE 173 NORTH AMERICA: BIOCIDES MARKET, BY APPLICATION, 2018–2022 (KILOTON)
  • TABLE 174 NORTH AMERICA: MARKET, BY APPLICATION, 2023–2029 (KILOTON)
  • TABLE 175 NORTH AMERICA: BIOCIDES MARKET, BY APPLICATION, 2018–2022 (USD MILLION)
  • TABLE 176 NORTH AMERICA: MARKET, BY APPLICATION, 2023–2029 (USD MILLION)
  • TABLE 177 NORTH AMERICA: BIOCIDES MARKET, BY COUNTRY, 2018–2022 (KILOTON)
  • TABLE 178 NORTH AMERICA: MARKET, BY COUNTRY, 2023–2029 (KILOTON)
  • TABLE 179 NORTH AMERICA: BIOCIDES MARKET, BY COUNTRY, 2018–2022 (USD MILLION)
  • TABLE 180 NORTH AMERICA: MARKET, BY COUNTRY, 2023–2029 (USD MILLION)
  • TABLE 181 US: BIOCIDES MARKET, BY APPLICATION, 2018–2022 (KILOTON)
  • TABLE 182 US: MARKET, BY APPLICATION, 2023–2029 (KILOTON)
  • TABLE 183 US: BIOCIDES MARKET, BY APPLICATION, 2018–2022 (USD MILLION)
  • TABLE 184 US: MARKET, BY APPLICATION, 2023–2029 (USD MILLION)
  • TABLE 185 CANADA: BIOCIDES MARKET, BY APPLICATION, 2018–2022 (KILOTON)
  • TABLE 186 CANADA: MARKET, BY APPLICATION, 2023–2029 (KILOTON)
  • TABLE 187 CANADA: BIOCIDES MARKET, BY APPLICATION, 2018–2022 (USD MILLION)
  • TABLE 188 CANADA: MARKET, BY APPLICATION, 2023–2029 (USD MILLION)
  • TABLE 189 MEXICO: BIOCIDES MARKET, BY APPLICATION, 2018–2022 (KILOTON)
  • TABLE 190 MEXICO: MARKET, BY APPLICATION, 2023–2029 (KILOTON)
  • TABLE 191 MEXICO: BIOCIDES MARKET, BY APPLICATION, 2018–2022 (USD MILLION)
  • TABLE 192 MEXICO: MARKET, BY APPLICATION, 2023–2029 (USD MILLION)
  • TABLE 193 MIDDLE EAST & AFRICA: BIOCIDES MARKET, BY TYPE, 2018–2022 (KILOTON)
  • TABLE 194 MIDDLE EAST & AFRICA: MARKET, BY TYPE, 2023–2029 (KILOTON)
  • TABLE 195 MIDDLE EAST & AFRICA: BIOCIDES MARKET, BY TYPE, 2018–2022 (USD MILLION)
  • TABLE 196 MIDDLE EAST & AFRICA: MARKET, BY TYPE, 2023–2029 (USD MILLION)
  • TABLE 197 MIDDLE EAST & AFRICA: BIOCIDES MARKET, BY APPLICATION, 2018–2022 (KILOTON)
  • TABLE 198 MIDDLE EAST & AFRICA: MARKET, BY APPLICATION, 2023–2029 (KILOTON)
  • TABLE 199 MIDDLE EAST & AFRICA: BIOCIDES MARKET, BY APPLICATION, 2018–2022 (USD MILLION)
  • TABLE 200 MIDDLE EAST & AFRICA: MARKET, BY APPLICATION, 2023–2029 (USD MILLION)
  • TABLE 201 MIDDLE EAST & AFRICA: BIOCIDES MARKET, BY COUNTRY, 2018–2022 (KILOTON)
  • TABLE 202 MIDDLE EAST & AFRICA: MARKET, BY COUNTRY, 2023–2029 (KILOTON)
  • TABLE 203 MIDDLE EAST & AFRICA: BIOCIDES MARKET, BY COUNTRY, 2018–2022 (USD MILLION)
  • TABLE 204 MIDDLE EAST & AFRICA: MARKET, BY COUNTRY, 2023–2029 (USD MILLION)
  • TABLE 205 SAUDI ARABIA: BIOCIDES MARKET, BY APPLICATION, 2018–2022 (KILOTON)
  • TABLE 206 SAUDI ARABIA: MARKET, BY APPLICATION, 2023–2029 (KILOTON)
  • TABLE 207 SAUDI ARABIA: BIOCIDES MARKET, BY APPLICATION, 2018–2022 (USD MILLION)
  • TABLE 208 SAUDI ARABIA: MARKET, BY APPLICATION, 2023–2029 (USD MILLION)
  • TABLE 209 UAE: BIOCIDES MARKET, BY APPLICATION, 2018–2022 (KILOTON)
  • TABLE 210 UAE: MARKET, BY APPLICATION, 2023–2029 (KILOTON)
  • TABLE 211 UAE: BIOCIDES MARKET, BY APPLICATION, 2018–2022 (USD MILLION)
  • TABLE 212 UAE: MARKET, BY APPLICATION, 2023–2029 (USD MILLION)
  • TABLE 213 IRAN: BIOCIDES MARKET, BY APPLICATION, 2018–2022 (KILOTON)
  • TABLE 214 IRAN: MARKET, BY APPLICATION, 2023–2029 (KILOTON)
  • TABLE 215 IRAN: BIOCIDES MARKET, BY APPLICATION, 2018–2022 (USD MILLION)
  • TABLE 216 IRAN: MARKET, BY APPLICATION, 2023–2029 (USD MILLION)
  • TABLE 217 SOUTH AFRICA: BIOCIDES MARKET, BY APPLICATION, 2018–2022 (KILOTON)
  • TABLE 218 SOUTH AFRICA: MARKET, BY APPLICATION, 2023–2029 (KILOTON)
  • TABLE 219 SOUTH AFRICA: BIOCIDES MARKET, BY APPLICATION, 2018–2022 (USD MILLION)
  • TABLE 220 SOUTH AFRICA: MARKET, BY APPLICATION, 2023–2029 (USD MILLION)
  • TABLE 221 SOUTH AMERICA: BIOCIDES MARKET, BY TYPE, 2018–2022 (KILOTON)
  • TABLE 222 SOUTH AMERICA: MARKET, BY TYPE, 2023–2029 (KILOTON)
  • TABLE 223 SOUTH AMERICA: BIOCIDES MARKET, BY TYPE, 2018–2022 (USD MILLION)
  • TABLE 224 SOUTH AMERICA: MARKET, BY TYPE, 2023–2029 (USD MILLION)
  • TABLE 225 SOUTH AMERICA: BIOCIDES MARKET, BY APPLICATION, 2018–2022 (KILOTON)
  • TABLE 226 SOUTH AMERICA: MARKET, BY APPLICATION, 2023–2029 (KILOTON)
  • TABLE 227 SOUTH AMERICA: BIOCIDES MARKET, BY APPLICATION, 2018–2022 (USD MILLION)
  • TABLE 228 SOUTH AMERICA: MARKET, BY APPLICATION, 2023–2029 (USD MILLION)
  • TABLE 229 SOUTH AMERICA: BIOCIDES MARKET, BY COUNTRY, 2018–2022 (KILOTON)
  • TABLE 230 SOUTH AMERICA: MARKET, BY COUNTRY, 2023–2029 (KILOTON)
  • TABLE 231 SOUTH AMERICA: BIOCIDES MARKET, BY COUNTRY, 2018–2022 (USD MILLION)
  • TABLE 232 SOUTH AMERICA: MARKET, BY COUNTRY, 2023–2029 (USD MILLION)
  • TABLE 233 BRAZIL: BIOCIDES MARKET, BY APPLICATION, 2018–2022 (KILOTON)
  • TABLE 234 BRAZIL: MARKET, BY APPLICATION, 2023–2029 (KILOTON)
  • TABLE 235 BRAZIL: BIOCIDES MARKET, BY APPLICATION, 2018–2022 (USD MILLION)
  • TABLE 236 BRAZIL: MARKET, BY APPLICATION, 2023–2029 (USD MILLION)
  • TABLE 237 ARGENTINA: BIOCIDES MARKET, BY APPLICATION, 2018–2022 (KILOTON)
  • TABLE 238 ARGENTINA: MARKET, BY APPLICATION, 2023–2029 (KILOTON)
  • TABLE 239 ARGENTINA: BIOCIDES MARKET, BY APPLICATION, 2018–2022 (USD MILLION)
  • TABLE 240 ARGENTINA: MARKET, BY APPLICATION, 2023–2029 (USD MILLION)
  • TABLE 241 BIOCIDES MARKET: DEGREE OF COMPETITION
  • TABLE 242 MARKET: REGION FOOTPRINT
  • TABLE 243 BIOCIDES MARKET: TYPE FOOTPRINT
  • TABLE 244 MARKET: APPLICATION FOOTPRINT
  • TABLE 245 BIOCIDES MARKET: DETAILED LIST OF KEY STARTUPS/SMES
  • TABLE 246 MARKET: COMPETITIVE BENCHMARKING OF KEY STARTUPS/SMES
  • TABLE 247 BIOCIDES MARKET: DEALS, JANUARY 2019–JUNE 2024
  • TABLE 248 MARKET: EXPANSIONS, JANUARY 2019–JUNE 2024
  • TABLE 249 BIOCIDES MARKET: PRODUCT LAUNCHES, JANUARY 2019–JUNE 2024
  • TABLE 250 MARKET: OTHER DEVELOPMENTS, JANUARY 2019–JUNE 2024
  • TABLE 251 LANXESS AG: COMPANY OVERVIEW
  • TABLE 252 LANXESS AG: PRODUCTS/SOLUTIONS/SERVICES OFFERED
  • TABLE 253 LANXESS AG: DEALS, JANUARY 2019–JUNE 2024
  • TABLE 254 VEOLIA GROUP: COMPANY OVERVIEW
  • TABLE 255 VEOLIA GROUP: PRODUCTS/SOLUTIONS/SERVICES OFFERED
  • TABLE 256 VEOLIA GROUP: DEALS, JANUARY 2019–JUNE 2024
  • TABLE 257 VEOLIA GROUP: EXPANSIONS, JANUARY 2019–JUNE 2024
  • TABLE 258 ARXADA AG: COMPANY OVERVIEW
  • TABLE 259 ARXADA AG: PRODUCTS/SOLUTIONS/SERVICES OFFERED
  • TABLE 260 ARXADA AG: DEALS, JANUARY 2019–JUNE 2024
  • TABLE 261 ECOLAB INC.: COMPANY OVERVIEW
  • TABLE 262 ECOLAB INC.: PRODUCTS/SOLUTIONS/SERVICES OFFERED
  • TABLE 263 ECOLAB INC.: DEALS, JANUARY 2019–JUNE 2024
  • TABLE 264 ECOLAB INC.: EXPANSIONS, JANUARY 2019–JUNE 2024
  • TABLE 265 ECOLAB INC.: OTHER DEVELOPMENTS, JANUARY 2019–JUNE 2024
  • TABLE 266 NOURYON: COMPANY OVERVIEW
  • TABLE 267 NOURYON: PRODUCTS/SOLUTIONS/SERVICES OFFERED
  • TABLE 268 NOURYON: DEALS, JANUARY 2019–JUNE 2024
  • TABLE 269 NOURYON: EXPANSIONS, JANUARY 2019–JUNE 2024
  • TABLE 270 GENERAL ELECTRIC COMPANY: COMPANY OVERVIEW
  • TABLE 271 GENERAL ELECTRIC COMPANY: PRODUCTS/SOLUTIONS/SERVICES OFFERED
  • TABLE 272 EVONIK INDUSTRIES AG: COMPANY OVERVIEW
  • TABLE 273 EVONIK INDUSTRIES AG: PRODUCTS/SOLUTIONS/SERVICES OFFERED
  • TABLE 274 SOLVAY SA: COMPANY OVERVIEW
  • TABLE 275 SOLVAY SA: PRODUCTS/SOLUTIONS/SERVICES OFFERED
  • TABLE 276 SOLVAY SA: DEALS, JANUARY 2019–JUNE 2024
  • TABLE 277 CLARIANT AG: COMPANY OVERVIEW
  • TABLE 278 CLARIANT AG: PRODUCTS/SOLUTIONS/SERVICES OFFERED
  • TABLE 279 ITALMATCH CHEMICALS S.P.A.: COMPANY OVERVIEW
  • TABLE 280 ITALMATCH CHEMICALS S.P.A.: PRODUCTS/SOLUTIONS/SERVICES OFFERED
  • TABLE 281 ITALMATCH CHEMICALS S.P.A.: PRODUCT LAUNCHES, JANUARY 2019–JUNE 2024
  • TABLE 282 ITALMATCH CHEMICALS S.P.A.: DEALS, JANUARY 2019–JUNE 2024
  • TABLE 283 SOLENIS: COMPANY OVERVIEW
  • TABLE 284 SOLENIS: PRODUCTS/SOLUTIONS/SERVICES OFFERED
  • TABLE 285 SOLENIS: DEALS, JANUARY 2019–JUNE 2024
  • TABLE 286 KEMIRA OYJ: COMPANY OVERVIEW
  • TABLE 287 STEPAN COMPANY: COMPANY OVERVIEW
  • TABLE 288 DANAHER CORPORATION: COMPANY OVERVIEW
  • TABLE 289 ALBEMARLE CORPORATION: COMPANY OVERVIEW
  • TABLE 290 FMC CORPORATION: COMPANY OVERVIEW
  • TABLE 291 ICL GROUP: COMPANY OVERVIEW
  • TABLE 292 BASF SE: COMPANY OVERVIEW
  • TABLE 293 CES ENERGY SOLUTIONS CORP.: COMPANY OVERVIEW
  • TABLE 294 ARKEMA SA: COMPANY OVERVIEW
  • TABLE 295 THE LUBRIZOL CORPORATION: COMPANY OVERVIEW
  • TABLE 296 THOR GROUP LIMITED: COMPANY OVERVIEW
  • TABLE 297 CHEMICREA INC.: COMPANY OVERVIEW
  • TABLE 298 MERCK KGAA: COMPANY OVERVIEW
  • TABLE 299 ACCEPTA WATER TREATMENT: COMPANY OVERVIEW
  • TABLE 300 WATER TREATMENT CHEMICALS MARKET, BY REGION, 2018–2021 (USD MILLION)
  • TABLE 301 WATER TREATMENT CHEMICALS MARKET, BY REGION, 2022–2027 (USD MILLION)
  • TABLE 302 WATER TREATMENT CHEMICALS MARKET, BY REGION, 2018–2021 (KILOTON)
  • TABLE 303 WATER TREATMENT CHEMICALS MARKET, BY REGION, 2022–2027 (KILOTON)
  • TABLE 304 NORTH AMERICA: WATER TREATMENT CHEMICALS MARKET, BY COUNTRY, 2018–2021 (USD MILLION)
  • TABLE 305 NORTH AMERICA: WATER TREATMENT CHEMICALS MARKET, BY COUNTRY, 2022–2027 (USD MILLION)
  • TABLE 306 NORTH AMERICA: WATER TREATMENT CHEMICALS MARKET, BY COUNTRY, 2018–2021 (KILOTON)
  • TABLE 307 NORTH AMERICA: WATER TREATMENT CHEMICALS MARKET, BY COUNTRY, 2022–2027 (KILOTON)
  • TABLE 308 EUROPE: WATER TREATMENT CHEMICALS MARKET, BY COUNTRY, 2018–2021 (USD MILLION)
  • TABLE 309 EUROPE: WATER TREATMENT CHEMICALS MARKET, BY COUNTRY, 2022–2027 (USD MILLION)
  • TABLE 310 EUROPE: WATER TREATMENT CHEMICALS MARKET, BY COUNTRY, 2018–2021 (KILOTON)
  • TABLE 311 EUROPE: WATER TREATMENT CHEMICALS MARKET, BY COUNTRY, 2022–2027 (KILOTON)
  • TABLE 312 ASIA PACIFIC: WATER TREATMENT CHEMICALS MARKET, BY COUNTRY, 2018–2021 (USD MILLION)
  • TABLE 313 ASIA PACIFIC: WATER TREATMENT CHEMICALS MARKET, BY COUNTRY, 2022–2027 (USD MILLION)
  • TABLE 314 ASIA PACIFIC: WATER TREATMENT CHEMICALS MARKET, BY COUNTRY, 2018–2021 (KILOTON)
  • TABLE 315 ASIA PACIFIC: WATER TREATMENT CHEMICALS MARKET, BY COUNTRY, 2022–2027 (KILOTON)
  • TABLE 316 MIDDLE EAST & AFRICA: WATER TREATMENT CHEMICALS MARKET, BY COUNTRY, 2018–2021 (USD MILLION)
  • TABLE 317 MIDDLE EAST & AFRICA: WATER TREATMENT CHEMICALS MARKET, BY COUNTRY, 2022–2027 (USD MILLION)
  • TABLE 318 MIDDLE EAST & AFRICA: WATER TREATMENT CHEMICALS MARKET, BY COUNTRY, 2018–2021 (KILOTON)
  • TABLE 319 MIDDLE EAST & AFRICA: WATER TREATMENT CHEMICALS MARKET, BY COUNTRY, 2022–2027 (KILOTON)
  • TABLE 320 SOUTH AMERICA: WATER TREATMENT CHEMICALS MARKET, BY COUNTRY, 2018–2021 (USD MILLION)
  • TABLE 321 SOUTH AMERICA: WATER TREATMENT CHEMICALS MARKET, BY COUNTRY, 2022–2027 (USD MILLION)
  • TABLE 322 SOUTH AMERICA: WATER TREATMENT CHEMICALS MARKET, BY COUNTRY, 2018–2021 (KILOTON)
  • TABLE 323 SOUTH AMERICA: WATER TREATMENT CHEMICALS MARKET, BY COUNTRY, 2022–2027 (KILOTON)
LIST OF FIGURES
 
  • FIGURE 1 BIOCIDES MARKET: RESEARCH DESIGN
  • FIGURE 2 MARKET SIZE ESTIMATION - APPROACH 1 (SUPPLY-SIDE): COMBINED MARKET SHARE OF KEY PLAYERS
  • FIGURE 3 MARKET SIZE ESTIMATION - BOTTOM-UP (SUPPLY SIDE): REVENUE FROM SALE OF BIOCIDES
  • FIGURE 4 MARKET SIZE ESTIMATION METHODOLOGY: APPROACH 2 – BOTTOM-UP (DEMAND SIDE): PRODUCTS SOLD AND THEIR AVERAGE SELLING PRICES
  • FIGURE 5 BIOCIDES MARKET: DATA TRIANGULATION
  • FIGURE 6 MARKET CAGR PROJECTIONS FROM SUPPLY SIDE
  • FIGURE 7 MARKET GROWTH PROJECTIONS FROM DEMAND SIDE: DRIVERS AND OPPORTUNITIES
  • FIGURE 8 NON-OXIDIZING BIOCIDES TO DOMINATE MARKET DURING FORECAST PERIOD
  • FIGURE 9 WATER TREATMENT TO REGISTER HIGHEST GROWTH DURING FORECAST PERIOD
  • FIGURE 10 NORTH AMERICA ACCOUNTED FOR LARGEST MARKET SHARE IN 2023
  • FIGURE 11 INCREASING DEMAND FOR WATER TREATMENT TO DRIVE BIOCIDES MARKET DURING FORECAST PERIOD
  • FIGURE 12 WATER TREATMENT TO BE FASTEST-GROWING APPLICATION DURING FORECAST PERIOD
  • FIGURE 13 CHINA ACCOUNTED FOR LARGEST SHARE OF BIOCIDES MARKET IN 2023
  • FIGURE 14 NON-OXIDIZING BIOCIDES ACCOUNTED FOR LARGEST SHARE IN ALL REGIONS IN 2023
  • FIGURE 15 NORTH AMERICA TO DOMINATE MARKET DURING FORECAST PERIOD
  • FIGURE 16 IRAN TO REGISTER HIGHEST CAGR DURING FORECAST PERIOD
  • FIGURE 17 DRIVERS, RESTRAINTS, OPPORTUNITIES, AND CHALLENGES IN BIOCIDES MARKET
  • FIGURE 18 BIOCIDES MARKET: PORTER’S FIVE FORCES ANALYSIS
  • FIGURE 19 BIOCIDES MARKET: SUPPLY CHAIN ANALYSIS
  • FIGURE 20 INFLUENCE OF STAKEHOLDERS IN BUYING PROCESS FOR TOP 3 APPLICATIONS
  • FIGURE 21 KEY BUYING CRITERIA FOR TOP 3 APPLICATIONS
  • FIGURE 22 AVERAGE SELLING PRICE TREND OF KEY PLAYERS FOR TOP 3 APPLICATIONS
  • FIGURE 23 AVERAGE SELLING PRICE TREND OF BIOCIDES, BY REGION
  • FIGURE 24 REVENUE SHIFT FOR BIOCIDES MARKET
  • FIGURE 25 BIOCIDES MARKET: ECOSYSTEM
  • FIGURE 26 IMPORT OF BIOCIDES, BY KEY COUNTRY (2017–2022)
  • FIGURE 27 EXPORT OF BIOCIDES, BY KEY COUNTRY (2017–2022)
  • FIGURE 28 LIST OF BIOCIDE PATENTS
  • FIGURE 29 TOP PATENT OWNERS IN LAST 11 YEARS
  • FIGURE 30 LEGAL STATUS OF PATENTS
  • FIGURE 31 MAXIMUM PATENTS FILED BY COMPANIES IN US
  • FIGURE 32 NON-OXIDIZING BIOCIDES ESTIMATED TO ACCOUNT FOR LARGEST SHARE IN 2024
  • FIGURE 33 WATER TREATMENT APPLICATION TO GROW AT HIGHEST CAGR DURING FORECAST PERIOD
  • FIGURE 34 MUNICIPAL WATER TREATMENT SEGMENT TO GROW AT HIGHEST CAGR DURING FORECAST PERIOD
  • FIGURE 35 MIDDLE EAST & AFRICA TO REGISTER HIGHEST GROWTH DURING FORECAST PERIOD
  • FIGURE 36 ASIA PACIFIC: BIOCIDES MARKET SNAPSHOT
  • FIGURE 37 EUROPE: BIOCIDES MARKET SNAPSHOT
  • FIGURE 38 NORTH AMERICA: BIOCIDES MARKET SNAPSHOT
  • FIGURE 39 LANXESS AG LED BIOCIDES MARKET IN 2023
  • FIGURE 40 REVENUE ANALYSIS OF KEY COMPANIES FOR LAST 5 YEARS
  • FIGURE 41 BIOCIDES MARKET: COMPANY EVALUATION MATRIX (KEY PLAYERS), 2023
  • FIGURE 42 BIOCIDES MARKET: COMPANY FOOTPRINT
  • FIGURE 43 BIOCIDES MARKET: COMPANY EVALUATION MATRIX (STARTUPS/SMES), 2023
  • FIGURE 44 BRAND/PRODUCT COMPARISON
  • FIGURE 45 EV/EBITDA OF KEY MANUFACTURERS OF BIOCIDES
  • FIGURE 46 ENTERPRISE VALUATION (EV) OF KEY PLAYERS IN BIOCIDES MARKET
  • FIGURE 47 LANXESS AG: COMPANY SNAPSHOT
  • FIGURE 48 VEOLIA GROUP: COMPANY SNAPSHOT
  • FIGURE 49 ECOLAB INC.: COMPANY SNAPSHOT
  • FIGURE 50 GENERAL ELECTRIC COMPANY: COMPANY SNAPSHOT
  • FIGURE 51 EVONIK INDUSTRIES AG: COMPANY SNAPSHOT
  • FIGURE 52 SOLVAY SA: COMPANY SNAPSHOT
  • FIGURE 53 CLARIANT AG: COMPANY SNAPSHOT


The study involved four major activities in estimating the market size for biocides market. Intensive secondary research was done to gather information on the market, the peer market, and the parent market. The next step was to validate these findings, assumptions, and sizing with industry experts across the value chain through primary research. Both top-down and bottom-up approaches were employed to estimate the complete market size. Post that, the market breakdown and data triangulation procedures were used to estimate the market size of the segments and subsegments.

Secondary Research

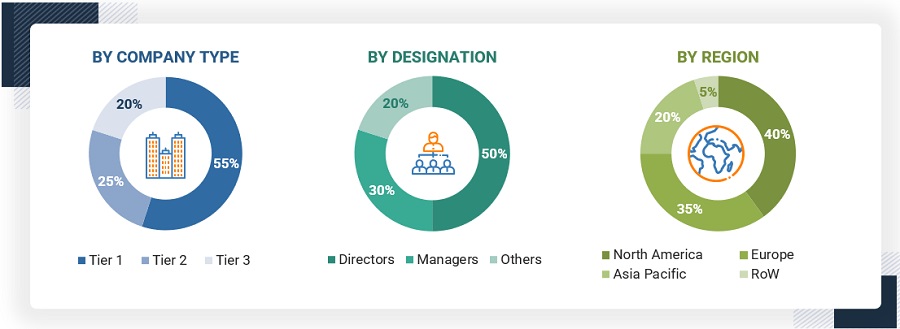
Secondary sources used in this study included annual reports, press releases, and investor presentations of companies; white papers; certified publications; articles from recognized authors; and gold standard & silver standard websites such as Factiva, ICIS, Bloomberg, and others. The findings of this study were verified through primary research by conducting extensive interviews with key officials such as CEOs, VPs, directors, and other executives. The breakdown of profiles of the primary interviewees is illustrated in the figure below:

Primary Research

The biocides market comprises several stakeholders, such as raw material suppliers, end-product manufacturers, and regulatory organizations in the supply chain. The demand side of this market is characterized from key opinion leaders in various applications for the biocides. The supply side is characterized by advancements in technology and diverse application industries. Various primary sources from both the supply and demand sides of the market were interviewed to obtain qualitative and quantitative information.

Breakdown Of Primary Participants
Biocides Market Size, and Share

Note: Tier 1, Tier 2, and Tier 3 companies are classified based on their market revenue in 2023 available in the public domain, product portfolios, and geographical presence.

Other designations include consultants and sales, marketing, and procurement managers.

To know about the assumptions considered for the study, download the pdf brochure

COMPANY NAME

DESIGNATION

LANXESS AG

Global Strategy & Innovation Manager

Veolia Group

Technical Sales Manager

Arxada AG

Senior Supervisor

Ecolab Inc.

Production Supervisor

Nouryon

Production Manager

Market Size Estimation

Bottom-up approaches were used to estimate and validate the total size of the biocides market. These methods were also used extensively to estimate the size of various subsegments in the market. The research methodology used to estimate the market size includes the following:

  • The key players in the industry have been identified through extensive secondary research.
  • The supply chain of the industry has been determined through primary and secondary research.
  • All percentage shares, splits, and breakdowns have been determined using secondary sources and verified through primary sources.
  • All possible parameters that affect the markets covered in this research study have been accounted for, viewed in extensive detail, verified through primary research, and analyzed to obtain the final quantitative and qualitative data.

Biocides market: Bottom-Up Approach

Biocides Market Size, and Share

To know about the assumptions considered for the study, Request for Free Sample Report

Biocides market: Top-Down Approach

Biocides Market Size, and Share

Data Triangulation

After arriving at the overall market size—using the market size estimation processes as explained above—the market was split into respective segments and subsegments. To realize the overall market engineering process and arrive at the exact statistics of each market segment and subsegment, the data triangulation, and market breakdown procedures were employed, wherever applicable. The data was triangulated by studying several factors and trends from both the demand and supply sides in the biocides industry.

Market Definition

Biocides are substances used to kill or inhibit all harmful life forms when introduced in sufficient concentration and duration. They are primarily used to kill harmful organisms and control bacterial or fungal growth.

According to the DG Health and Consumers of European Commission, Biocides Directive (98/8/EC), biocidal products are intended to destroy, render harmless, prevent the action of or otherwise exert a controlling effect on any harmful organism by chemical or biological means. The directive range covers 23 product types, from drinking water disinfectants, wood preservatives, and insecticides to antifouling products.

Key Stakeholders

  • Biocides manufacturers
  • Raw material manufacturers
  • Government planning commissions and research organizations
  • Industry associations
  • Applications
  • R&D institutions

Report Objectives

  • To analyze and forecast the size of the biocides market in terms of value
  • To provide detailed information regarding key factors, such as drivers, restraints, challenges, and opportunities influencing the growth of the market
  • To define, describe, and segment the biocides market based on type and application
  • To forecast the size of the market segments for regions such as Asia Pacific, North America, Europe, Middle East & Africa, and South America
  • To strategically analyze the segmented markets with respect to individual growth trends, prospects, and contribution to the overall market
  • To identify and analyze opportunities for stakeholders in the market
  • To strategically profile key players and comprehensively analyze their core competencies

Available Customizations

Along with the given market data, MarketsandMarkets offers customizations according to the company’s specific needs. The following customization options are available for the report:

Regional Analysis

  • Further breakdown of a region with respect to a particular country or additional type and application

Company Information

  • Detailed analysis and profiles of additional market players (up to five)
Custom Market Research Services

We will customize the research for you, in case the report listed above does not meet with your exact requirements. Our custom research will comprehensively cover the business information you require to help you arrive at strategic and profitable business decisions.

Request Customization

Instant Answers with GPT - Ask Now!

Ask real questions. Get complete answers !
Report Code
CH 2155
Published ON
Aug, 2024
Choose License Type
BUY NOW
  • SHARE
X
Request Customization
Speak to Analyst
Speak to Analyst
OR FACE-TO-FACE MEETING
PERSONALIZE THIS RESEARCH
  • Triangulate with your Own Data
  • Get Data as per your Format and Definition
  • Gain a Deeper Dive on a Specific Application, Geography, Customer or Competitor
  • Any level of Personalization
REQUEST A FREE CUSTOMIZATION
LET US HELP YOU!
  • What are the Known and Unknown Adjacencies Impacting the Biocides Market
  • What will your New Revenue Sources be?
  • Who will be your Top Customer; what will make them switch?
  • Defend your Market Share or Win Competitors
  • Get a Scorecard for Target Partners
CUSTOMIZED WORKSHOP REQUEST
knowledgestore logo

Want to explore hidden markets that can drive new revenue in Biocides Market?

Find Hidden Markets
  • Call Us
  • +1-888-600-6441 (Corporate office hours)
  • +1-888-600-6441 (US/Can toll free)
  • +44-800-368-9399 (UK office hours)
CONNECT WITH US
ABOUT TRUST ONLINE
©2024 MarketsandMarkets Research Private Ltd. All rights reserved
DMCA.com Protection Status
Website Feedback