Wood Preservatives Market by Formulation (Water-Based, Oil-Based, Solvent-Based), Application (Residential, Commercial, Industrial), and Region (North America, APAC, Europe, South America, Middle Eastand Africa) - Global Forecast to 2025
Updated on : April 01, 2024
Wood Preservatives Market
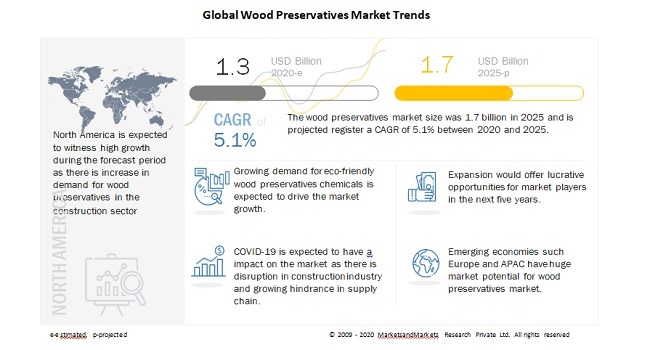
The global wood preservatives market was valued at USD 1.3 billion in 2020 and is projected to reach USD 1.7 billion by 2025, growing at 5.1% cagr from 2020 to 2025. The driving factors for the market is the increasing demand for eco-friendly wood preservatives chemicals and rapid urbanization & increasing disposable income in emerging countries.
To know about the assumptions considered for the study, Request for Free Sample Report
COVID-19 Impact on the Wood Preservatives Market
The global wood preservatives market includes major Tier I and II manufacturers like as Koppers (US), Lonza (Switzerland), Lanxess (Germany), Cabot Microelectronics (US) and BASF Wolman (Germany). These players have their facilities spread across various countries across Asia Pacific, Europe, North America, South America, and Middle East & Africa. COVID-19 has impacted their businesses as well.
These players have announced the suspension of production due to the lowered demand, supply chain bottlenecks, and to protect the safety of their employees in the US, France, Germany, Italy, and Spain during the COVID-19 pandemic. As a result, the demand for wood preservatives is expected to decline in 2020. Manufacturers are likely to adjust production to prevent bottlenecks and plan production according to demand from tier 1 manufacturers.
Wood Preservatives Market Dynamics
Driver: Rapid urbanization and increasing disposable income in emerging countries
There is a growing demand for interior design where wood is the most important raw material of the structure component and display in the interior space. There is an increasing demand for modern interior design in various forms such as wall body, wooden mural, wood carving, wood trim, skirting line, baluster, wood floor, armrest and ceiling so on. Hence will drive the demand of wood which will further increase the demand for wood preservatives and drive the market.
Restraint: Increasing restrictions on the use of hazardous chemicals such as chromium, arsenic and creosote
Arsenic and chromium are widespread environmental contaminants that affects the global health due to the carcinogenicity and toxicity. According to National Center for Biotechnology Information (NCBI), chromium and arsenic exposure in the population resides high risk to environment. Wood preservatives that contain chromated arsenicals include preservatives containing copper, chromium and arsenic. Wood has been pressure treated with chromated arsenicals in order to protect wood from rotting due to insects and microbial agent attack and also the wood-boring marine invertebrates.
Longer exposures to the vapors of the creosotes might cause irritation of the respiratory tract. Cancer of the scrotum and skin cancer have resulted from long exposure to low levels of these chemical mixtures, especially through the direct contact with the skin during treatment of wood. Hence, these chemicals are classified by EPA into RUP (Restricted Use Product). They also determined that CCA treated wood would not be used for picnic tables, new garden furniture, patio, children’s play equipment, exterior seating, domestic decking and handrails.
Opportunity: Emerging technologies for wood preservation
The players such as Troy, Janssen Pharmaceutica, Koppers in the market are putting continuous efforts to develop the new chemicals such as ACQ, borates, copper azole, copper naphthenate, copper-HDO (Bis-(Ncyclohexyldiazeniumdioxy-copper)) and polymeric betaine which will be in compliance with the rules and regulations of environmental agencies and which will be more effective for the wood preservations. New products such as micronized copper azoles and other water-based products are coming in the market which presents growth opportunities in the wood preservatives market
Challenges: Creating awareness about the advantages of wood preservatives in emerging markets
African and Asian countries have a great potential for wood preservatives consumption. The large populations in these regions provide ample opportunities to cater to the demand for wood preservatives. The amount of wood used in the emerging countries is high, but the use of wood preservatives is comparatively lower. Hence, the awareness about the benefits of wood preservatives is necessary in these regions. The increase in such awareness is the primary challenge for the market players in these regions. Companies such as Troy, BASF, Bayer, Koppers are participating in seminars and exhibitions, along with media-based advertisements, which will help to overcome challenge of limited awareness about the various uses and advantages of wood preservatives.
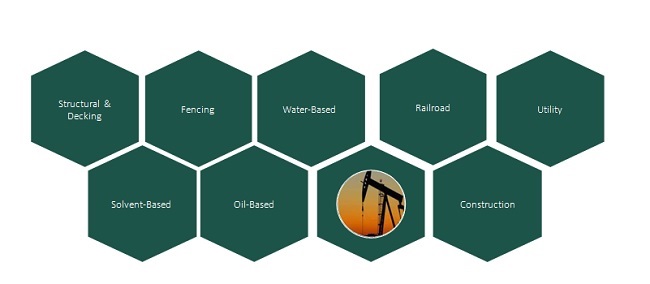
Wood Preservatives Market Ecosystem
To know about the assumptions considered for the study, download the pdf brochure
“The wood preservatives market is projected to register a CAGR of 5.1% during the forecast period, in terms of value.”
The market is witnessing moderate growth, owing to increasing application, infrastructural development, and growing demand for these wood preservatives in the Asia Pacific, North America and Europe. Wood preservatives are largely used in the construction & infrastructure industry. The increasing use of wood preservatives in these industries and the rising construction activities is driving the wood preservatives market. Restriction on plant cutting and the use of hazardous chemicals such as chromium, arsenic and creosote.
“Water-Based Wood Preservatives segment is expected to lead the wood preservatives market during the forecast period.”
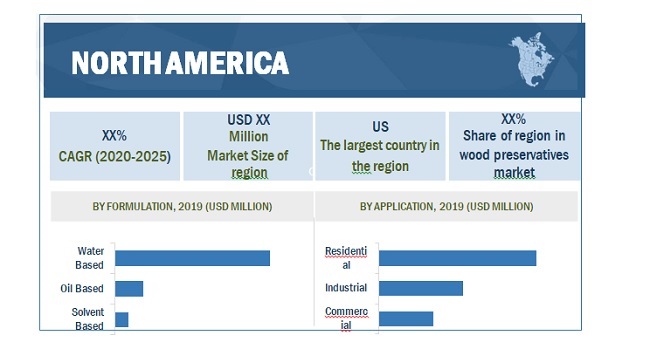
The water-based will continue to lead the wood preservatives market, accounting for a share of 75.6% of the overall market, in 2019 terms of value. This was due to the increasing demand for water-based wood preservatives in the decking, fencing, and landscaping sub-applications are expected to witness high growth in the next five years. The effectiveness of the copper-based wood preservatives has increased their demand in the wood preservatives market. Most of the copper-based wood preservatives are water-based formulations. Therefore, the water-based wood preservatives market is expected to dominate, globally, during the forecast period.
“North America is the largest market for wood preservatives market.”
North America accounted for the largest share of the wood preservatives market in 2020. The demand for wood preservatives is increasing in North America due to the increased usage of wood in the residential and industrial sectors. The rising construction industry supported by heavy investments for infrastructural developments, is providing new opportunities for the wood preservatives manufacturers operating in this region.
Wood Preservatives Market Players
Wood preservatives is a diversified and competitive market with a large number of global players and few regional and local players. Koppers (US), Lonza (Switzerland), Lanxess (Germany), Cabot Microelectronics (US), BASF Wolman (Germany) and Troy (US) are some of the key players in the market.
Wood Preservatives Market Report Scope
|
Report Metric |
Details |
|
Market Size Available for years |
2018-2025 |
|
Base year considered |
2019 |
|
Forecast period |
2020–2025 |
|
Forecast units |
Value (USD Million) and Volume (Kiloton) |
|
Segments covered |
By Formulation, By Application & By Region |
By Formulation
- Water-Based Wood Preservatives
- Solvent-Based Wood Preservatives
- Oil-Based Wood Preservatives
By Application
- Residential
- Commercial
- Industrial
By Region
- North America
- Asia Pacific
- Europe
- South America
- Middle East and Africa
Recent Developments
- In February 2020, Koppers plans to expand the copper naphthenate wood preservative market. This will help the company to grow its presence in wood preservation markets. In addition, the company also focuses on in-house manufacturing capabilities of the copper
- In December 2019, Lanxess acquired Itibanyl Produtos Especiais Ltda. (IPEL) (Brazil) which is a manufacturer of biocide. This will help strengthen chemicals portfolio and material protection products business unit of LANXESS is reinforcing its global presence which will include wood protection
- In January 2019, Troy introduced TroyCare LSB Natural Preservatives offering superior broad- spectrum efficacy to other natural preservatives, as well as the performance at lower use levels for exceptionally low cost-in-use
Frequently Asked Questions (FAQ):
Does this report cover volume tables in addition to the value tables?
Yes, volume tables are provided for each segment except offering.
Which countries are considered in the European region?
The report includes the following European countries
- Germany
- UK
- Sweden
- Italy
- Spain
- Russia
- France
- Poland
- Belgium
- The Netherlands
- Finland
- Norway
- Rest of Europe
What is the COVID-19 impact on the wood preservatives market?
Industry experts believe that COVID-19 would have an impact on wood preservatives market as there is an impact on demand for wood preservatives in various application such as residential, commercial and industrial. Furthermore, they also believe that the market will rebound in Q4 in 2020.
What are some of the uses of wood preservatives?
Wood Preservatives are largely used in the residential & commercial applications by the construction industries that include fencing, structural & decking, and landscaping. .
To speak to our analyst for a discussion on the above findings, click Speak to Analyst

TABLE OF CONTENTS
1 INTRODUCTION (Page No. - 19)
1.1 OBJECTIVES OF THE STUDY
1.2 MARKET DEFINITION
1.3 MARKET SCOPE
1.3.1 WOOD PRESERVATIVES MARKET SEGMENTATION
1.3.2 REGIONS COVERED
1.3.3 YEARS CONSIDERED FOR THE STUDY
1.4 CURRENCY
1.5 UNIT CONSIDERED
1.6 LIMITATIONS
1.7 STAKEHOLDERS
1.8 SUMMARY OF CHANGES
2 RESEARCH METHODOLOGY (Page No. - 24)
2.1 RESEARCH DATA
2.1.1 SECONDARY DATA
2.1.1.1 Key data from secondary sources
2.1.2 PRIMARY DATA
2.1.2.1 Key data from primary sources
2.1.2.2 Breakdown of primary interviews
2.2 BASE NUMBER CALCULATION
2.2.1 SUPPLY-SIDE APPROACH
2.3 MARKET SIZE ESTIMATION
2.3.1 MARKET SIZE ESTIMATION METHODOLOGY: BOTTOM-UP APPROACH
2.3.2 MARKET SIZE ESTIMATION METHODOLOGY: TOP-DOWN APPROACH
2.4 DATA TRIANGULATION
2.5 ASSUMPTIONS
3 EXECUTIVE SUMMARY (Page No. - 31)
4 PREMIUM INSIGHTS (Page No. - 34)
4.1 ATTRACTIVE OPPORTUNITIES IN WOOD PRESERVATIVES MARKET
4.2 WOOD PRESERVATIVES MARKET, BY REGION
4.3 NORTH AMERICA: WOOD PRESERVATIVES MARKET, BY COUNTRY AND APPLICATION
4.4 WOOD PRESERVATIVES MARKET: MAJOR COUNTRIES
5 MARKET OVERVIEW (Page No. - 36)
5.1 INTRODUCTION
5.2 MARKET DYNAMICS
5.2.1 DRIVERS
5.2.1.1 Rapid urbanization and increasing disposable incomes in emerging economies
5.2.1.2 Demand for eco-friendly wood preservative chemicals
5.2.2 RESTRAINTS
5.2.2.1 Increasing restrictions on the use of chromium, arsenic, creosote, and other hazardous chemicals
5.2.2.2 Growing restrictions on plant cutting
5.2.3 OPPORTUNITIES
5.2.3.1 Emerging technologies for wood preservation
5.2.3.2 Increasing use of wood for interior decorative purposes and wooden flooring in buildings
5.2.3.3 Growth of wood lumber market
5.2.3.4 Growing demand for wood composites
5.2.4 CHALLENGES
5.2.4.1 Creating awareness about the advantages of wood preservatives in emerging markets
5.3 PORTER'S FIVE FORCES ANALYSIS
5.3.1 THREAT OF SUBSTITUTES
5.3.2 THREAT OF NEW ENTRANTS
5.3.3 BARGAINING POWER OF SUPPLIERS
5.3.4 BARGAINING POWER OF BUYERS
5.3.5 INTENSITY OF COMPETITIVE RIVALRY
5.4 DETAILED REGULATION ANALYSIS IMPACTING DEMAND FOR WOOD PRESERVATIVES
5.4.1 COUNTRY LEVEL ANALYSIS OF VARIOUS REGULATIONS IMPACTING DEMAND
5.4.2 OTHER ADJACENT REGULATIONS (SUCH AS LABELING STANDARDS) IMPACTING DEMAND
5.5 MACROECONOMIC INDICATORS
5.5.1 TRENDS OF INFRASTRUCTURE & CONSTRUCTION INDUSTRY
5.5.2 TRENDS OF RAILWAY APPLICATION
5.6 VALUE CHAIN ANALYSIS
5.6.1 VALUE CHAIN OF WOOD PRESERVATIVES MARKET
5.7 IMPACT OF COVID-19 ON WOOD PRESERVATIVES MARKET
5.7.1 COVID-19 IMPACT ON CONSTRUCTION AND INFRASTRUCTURE SECTORS
5.7.2 COVID-19 IMPACT ON CHEMICAL INDUSTRY
6 WOOD PRESERVATIVES MARKET, BY FORMULATION (Page No. - 53)
6.1 INTRODUCTION
6.2 WATER-BASED WOOD PRESERVATIVES
6.2.1 NEED FOR DRY AND CLEAN WOOD SURFACE TO DRIVE THE DEMAND
6.2.2 COPPER-BASED WATERBORNE WOOD PRESERVATIVES
6.2.2.1 Copper azoles
6.2.2.1.1 Tebuconazole
6.2.2.1.2 Propiconazole
6.2.2.1.3 Cyproconazole
6.2.2.1.4 Micronized copper
6.2.2.2 Ammoniacal copper zinc arsenate
6.2.2.3 Chromated copper arsenate
6.2.2.4 Alkaline Copper Quaternary (ACQ) Compounds
6.2.2.5 Copper- HDO (Bis- (Ncyclohexyldiazeniumdioxy- copper))
6.2.2.6 Others
6.2.3 NON-COPPER-BASED WATERBORNE WOOD PRESERVATIVES
6.2.3.1 Borates
6.2.3.2 Triadimefon
6.3 SOLVENT-BASED WOOD PRESERVATIVES
6.3.1 MINIMAL SWELLING IN WOOD TO BOOST DEMAND
6.3.2 COPPER NAPHTHENATE
6.3.3 IPBC
6.3.4 SYNTHETIC PYRETHROIDS
6.3.5 PENTACHLOROPHENOL
6.4 OIL-BASED WOOD PRESERVATIVES
6.4.1 NEED TO PROTECT FROM WEATHERING AND INSECTS TO DRIVE THE MARKET FOR THESE PRESERVATIVES
6.4.2 CREOSOTE
6.4.3 OTHERS
7 WOOD PRESERVATIVES MARKET, BY APPLICATION (Page No. - 65)
7.1 INTRODUCTION
7.2 RESIDENTIAL
7.2.1 GROWING DEMAND FOR WOOD IN HOME INTERIORS TO DRIVE THE MARKET FOR WOOD PRESERVATIVES
7.3 COMMERCIAL
7.3.1 INCREASING DEMAND FOR WOOD FOR DECKING TO DRIVE THE DEMAND FOR WOOD PRESERVATIVES
7.3.2 FENCING
7.3.3 STRUCTURAL & DECKING
7.3.4 LANDSCAPING
7.3.5 OTHERS
7.4 INDUSTRIAL
7.4.1 WOODEN POLES TO DRIVE THE MARKET IN THIS SEGMENT
7.4.2 UTILITY
7.4.3 RAILROAD
7.4.4 OTHERS
8 WOOD PRESERVATIVES MARKET, BY REGION (Page No. - 74)
8.1 INTRODUCTION
8.2 NORTH AMERICA
8.2.1 IMPACT OF COVID-19 IN NORTH AMERICA
8.2.2 US
8.2.2.1 Governmental regulations and increase in demand for housing and construction projects to drive the market
8.2.3 CANADA
8.2.3.1 Governmental regulations for wood preservation to drive the market
8.2.4 MEXICO
8.2.4.1 Growing building & construction sector with private investments to fuel the market
8.3 EUROPE
8.3.1 IMPACT OF COVID-19 ON EUROPE
8.3.2 GERMANY
8.3.2.1 Rapid growth in building & construction industry to drive the market
8.3.3 FRANCE
8.3.3.1 Growth in construction activities to fuel the market
8.3.4 UK
8.3.4.1 Increasing adoption of timber for interior applications to be the market driver
8.3.5 RUSSIA
8.3.5.1 Growing transport infrastructure and utilities projects to drive the market
8.3.6 ITALY
8.3.6.1 Need for maintenance of existing buildings and increase in investment in residential projects to drive the market
8.3.7 SPAIN
8.3.7.1 Growing demand of new house and development of rail infrastructure to drive the market
8.3.8 POLAND
8.3.8.1 Upgradation of aging infrastructure and increasing demand in outdoor applications to drive the market
8.3.9 BELGIUM
8.3.9.1 Energy efficiency and green construction to drive the market
8.3.10 THE NETHERLANDS
8.3.10.1 Increasing customer expenditure and the demand for decking to govern the market
8.3.11 SWEDEN
8.3.11.1 Growing focus on softwood in interior design to drive the market
8.3.12 FINLAND
8.3.12.1 Urbanization and the growing construction sector to propel the market
8.3.13 NORWAY
8.3.13.1 Growing construction of timber bridges and wooden houses to drive the market
8.3.14 REST OF EUROPE
8.4 APAC
8.4.1 IMPACT OF COVID-19 ON APAC
8.4.2 CHINA
8.4.2.1 Rapid urbanization and infrastructural development to drive the market
8.4.3 JAPAN
8.4.3.1 Growing infrastructure sector and increasing credit easing measures to drive the market
8.4.4 INDIA
8.4.4.1 Increasing investments and growing constructions to drive the market
8.4.5 SOUTH KOREA
8.4.5.1 Growth in building and construction sector to support market growth
8.4.6 INDONESIA
8.4.6.1 Furniture sector and growth in interior design to drive the market
8.4.7 MALAYSIA
8.4.7.1 Growth in wooden furniture market and government policy support to propel the market
8.4.8 AUSTRALIA & NEW ZEALAND
8.4.8.1 Growth in outdoor timber to drive the market
8.4.9 REST OF APAC
8.5 MIDDLE EAST & AFRICA
8.5.1 IMPACT OF COVID-19 ON MIDDLE EAST & AFRICA
8.5.2 SAUDI ARABIA
8.5.2.1 Growing real estate developments and increasing demand for residential properties to propel the market
8.5.3 SOUTH AFRICA
8.5.3.1 Growth in furniture industry, along with the investment in sustainable infrastructure, to drive the market
8.5.4 UAE
8.5.4.1 Growing focus on various construction projects to drive the market
8.5.5 REST OF THE MIDDLE EAST & AFRICA
8.6 SOUTH AMERICA
8.6.1 IMPACT OF COVID-19 ON SOUTH AMERICA
8.6.2 BRAZIL
8.6.2.1 Urbanization and renovation of houses to fuel the market
8.6.3 ARGENTINA
8.6.3.1 Growing focus on government initiative and investments in public and private sectors to favor the market
8.6.4 REST OF SOUTH AMERICA
9 COMPETITIVE LANDSCAPE (Page No. - 163)
9.1 OVERVIEW
9.2 MARKET SHARE ANALYSIS
9.3 COMPETITIVE SCENARIO
9.3.1 EXPANSION
9.3.2 MERGER & ACQUISITION
9.3.3 NEW PRODUCT LAUNCH
10 COMPANY PROFILES (Page No. - 168)
10.1 KOPPERS
10.1.1 BUSINESS OVERVIEW
10.1.2 PRODUCTS OFFERED
10.1.3 RECENT DEVELOPMENTS
10.1.4 SWOT ANALYSIS
10.1.5 WINNING IMPERATIVES
10.1.6 CURRENT FOCUS AND STRATEGIES
10.1.7 THREAT FROM COMPETITION
10.1.8 RIGHT TO WIN
10.2 LONZA
10.2.1 BUSINESS OVERVIEW
10.2.2 PRODUCTS OFFERED
10.2.3 SWOT ANALYSIS
10.2.4 WINNING IMPERATIVES
10.2.5 CURRENT FOCUS AND STRATEGIES
10.2.6 THREAT FROM COMPETITION
10.2.7 RIGHT TO WIN
10.3 LANXESS
10.3.1 BUSINESS OVERVIEW
10.3.2 PRODUCTS OFFERED
10.3.3 RECENT DEVELOPMENTS
10.3.4 SWOT ANALYSIS
10.3.5 WINNING IMPERATIVES
10.3.6 CURRENT FOCUS AND STRATEGIES
10.3.7 THREAT FROM COMPETITION
10.3.8 RIGHT TO WIN
10.4 CABOT MICROELECTRONICS
10.4.1 BUSINESS OVERVIEW
10.4.2 PRODUCTS OFFERED
10.4.3 RECENT DEVELOPMENTS
10.4.4 SWOT ANALYSIS
10.4.5 WINNING IMPERATIVES
10.4.6 CURRENT FOCUS AND STRATEGIES
10.4.7 THREAT FROM COMPETITION
10.4.8 RIGHT TO WIN
10.5 BASF WOLMAN
10.5.1 BUSINESS OVERVIEW
10.5.2 PRODUCTS OFFERED
10.5.3 RECENT DEVELOPMENTS
10.5.4 SWOT ANALYSIS
10.5.5 WINNING IMPERATIVES
10.5.6 CURRENT FOCUS AND STRATEGIES
10.5.7 THREAT FROM COMPETITION
10.5.8 RIGHT TO WIN
10.6 TROY
10.6.1 BUSINESS OVERVIEW
10.6.2 PRODUCTS OFFERED
10.6.3 RECENT DEVELOPMENTS
10.6.4 MNM VIEW
10.7 REMMERS
10.7.1 BUSINESS OVERVIEW
10.7.2 PRODUCTS OFFERED
10.7.3 RECENT DEVELOPMENTS
10.7.4 MNM VIEW
10.8 COPPER CARE WOOD PRESERVATIVES
10.8.1 BUSINESS OVERVIEW
10.8.2 PRODUCTS OFFERED
10.8.3 MNM VIEW
10.9 RÜTGERS ORGANICS
10.9.2 PRODUCTS OFFERED
10.9.3 MNM VIEW
10.1 VIANCE
10.10.1 BUSINESS OVERVIEW
10.10.2 PRODUCTS OFFERED
10.10.3 RECENT DEVELOPMENTS
10.10.4 MNM VIEW
10.11 JANSSEN PHARMACEUTICA
10.11.1 PRODUCTS OFFERED
10.11.2 MNM VIEW
10.12 OTHER COMPANIES
10.12.1 BORAX
10.12.2 BUCKMAN LABORATORIES INTERNATIONAL
10.12.3 WYKAMOL GROUP
10.12.4 KURT OBERMEIER
10.12.5 DOLPHIN BAY
10.12.6 QUALITY BORATE
10.12.7 TIMBERLIFE
10.12.8 LADA ORGANICS
10.12.9 JUBILANT
10.12.10 PARIKH ENTERPRISES
10.12.11 AADINATH CHEMICAL INDUSTRIES
10.12.12 NISUS
10.12.13 ADVANCE AGRISEARCH LIMITED
11 APPENDIX (Page No. - 197)
11.1 DISCUSSION GUIDE
11.2 KNOWLEDGE STORE: MARKETSANDMARKETS' SUBSCRIPTION PORTAL
11.3 AVAILABLE CUSTOMIZATIONS
11.4 RELATED REPORTS
LIST OF TABLES (249 Tables)
TABLE 1 TRENDS AND FORECAST OF GDP BEFORE COVID-19 OUTBREAK, 2016-2019 (USD MILLION)
TABLE 2 CONSTRUCTION INDUSTRY (BEFORE COVID-19 OUTBREAK): GDP CONTRIBUTION, BY COUNTRY, 2014-2019 (USD BILLION)
TABLE 3 WOOD PRESERVATIVES MARKET SIZE, BY FORMULATION, 2018-2025 (USD MILLION)
TABLE 4 WOOD PRESERVATIVES MARKET SIZE, BY FORMULATION, 2018-2025 (KILOTON)
TABLE 5 WATER-BASED WOOD PRESERVATIVES MARKET SIZE, BY REGION, 2018-2025 (USD MILLION)
TABLE 6 WATER-BASED WOOD PRESERVATIVES MARKET SIZE, BY REGION, 2018-2025 (KILOTON)
TABLE 7 WATER-BASED WOOD PRESERVATIVES MARKET SIZE, BY SUB-FORMULATION, 2018-2025 (USD MILLION)
TABLE 8 WATER-BASED WOOD PRESERVATIVES MARKET SIZE, BY SUB-FORMULATION, 2018-2025 (KILOTON)
TABLE 9 SOLVENT-BASED WOOD PRESERVATIVES MARKET SIZE, BY REGION, 2018-2025 (USD MILLION)
TABLE 10 SOLVENT-BASED WOOD PRESERVATIVES MARKET SIZE, BY REGION, 2018-2025 (KILOTON)
TABLE 11 SOLVENT-BASED WOOD PRESERVATIVES MARKET SIZE, BY SUB-FORMULATION, 2018-2025 (USD MILLION)
TABLE 12 SOLVENT-BASED WOOD PRESERVATIVES MARKET SIZE, BY SUB-FORMULATION, 2018-2025 (KILOTON)
TABLE 13 OIL-BASED WOOD PRESERVATIVES MARKET SIZE, BY REGION, 2018-2025 (USD MILLION)
TABLE 14 OIL-BASED WOOD PRESERVATIVES MARKET SIZE, BY REGION, 2018-2025 (KILOTON)
TABLE 15 OIL-BASED WOOD PRESERVATIVES MARKET SIZE, BY SUB-FORMULATION, 2018-2025 (USD MILLION)
TABLE 16 OIL-BASED WOOD PRESERVATIVES MARKET SIZE, BY SUB-FORMULATION, 2018-2025 (KILOTON)
TABLE 17 WOOD PRESERVATIVES MARKET SIZE, BY APPLICATION, 2018-2025 (USD MILLION)
TABLE 18 WOOD PRESERVATIVES MARKET SIZE, BY APPLICATION, 2018-2025 (KILOTON)
TABLE 19 RESIDENTIAL: WOOD PRESERVATIVES MARKET SIZE, BY REGION, 2018-2025 (USD MILLION)
TABLE 20 RESIDENTIAL: WOOD PRESERVATIVES MARKET SIZE, BY REGION, 2018-2025 (KILOTON)
TABLE 21 COMMERCIAL: WOOD PRESERVATIVES MARKET SIZE, BY REGION, 2018-2025 (USD MILLION)
TABLE 22 COMMERCIAL: WOOD PRESERVATIVES MARKET SIZE, BY REGION, 2018-2025 (KILOTON)
TABLE 23 RESIDENTIAL: WOOD PRESERVATIVES MARKET SIZE, BY SUB-APPLICATION, 2018-2025 (USD MILLION)
TABLE 24 RESIDENTIAL: WOOD PRESERVATIVES MARKET SIZE, BY SUB-APPLICATION, 2018-2025 (KILOTON)
TABLE 25 COMMERCIAL: WOOD PRESERVATIVES MARKET SIZE, BY SUB-APPLICATION, 2018-2025 (USD MILLION)
TABLE 26 COMMERCIAL: WOOD PRESERVATIVES MARKET SIZE, BY SUB-APPLICATION, 2018-2025 (KILOTON)
TABLE 27 INDUSTRIAL: WOOD PRESERVATIVES MARKET SIZE, BY REGION, 2018-2025 (USD MILLION)
TABLE 28 INDUSTRIAL: WOOD PRESERVATIVES MARKET SIZE, BY REGION, 2018-2025 (KILOTON)
TABLE 29 INDUSTRIAL: WOOD PRESERVATIVES MARKET SIZE, BY SUB-APPLICATION, 2018-2025 (USD MILLION)
TABLE 30 INDUSTRIAL: WOOD PRESERVATIVES MARKET SIZE, BY SUB-APPLICATION, 2018-2025 (KILOTON)
TABLE 31 WOOD PRESERVATIVES MARKET SIZE, BY REGION, 2018-2025 (USD MILLION)
TABLE 32 WOOD PRESERVATIVES MARKET SIZE, BY REGION, 2018-2025 (KILOTON)
TABLE 33 NORTH AMERICA: WOOD PRESERVATIVES MARKET SIZE, BY COUNTRY, 2018-2025 (USD MILLION)
TABLE 34 NORTH AMERICA: WOOD PRESERVATIVES MARKET SIZE, BY COUNTRY, 2018-2025 (KILOTON)
TABLE 35 NORTH AMERICA: WOOD PRESERVATIVES MARKET SIZE, BY FORMULATION, 2018-2025 (USD MILLION)
TABLE 36 NORTH AMERICA: WOOD PRESERVATIVES MARKET SIZE, BY FORMULATION, 2018-2025 (KILOTON)
TABLE 37 NORTH AMERICA: WATER-BASED WOOD PRESERVATIVES MARKET SIZE, BY SUB-FORMULATION, 2018-2025 (USD MILLION)
TABLE 38 NORTH AMERICA: WATER-BASED WOOD PRESERVATIVES MARKET SIZE, BY SUB-FORMULATION, 2018-2025 (KILOTON)
TABLE 39 NORTH AMERICA: OIL-BASED WOOD PRESERVATIVES MARKET SIZE, BY SUB-FORMULATION, 2018-2025 (USD MILLION)
TABLE 40 NORTH AMERICA: OIL-BASED WOOD PRESERVATIVES MARKET SIZE, BY SUB-FORMULATION, 2018-2025 (KILOTON)
TABLE 41 NORTH AMERICA: SOLVENT-BASED WOOD PRESERVATIVES MARKET SIZE, BY SUB-FORMULATION, 2018-2025 (USD MILLION)
TABLE 42 NORTH AMERICA: SOLVENT-BASED WOOD PRESERVATIVES MARKET SIZE, BY SUB-FORMULATION, 2018-2025 (KILOTON)
TABLE 43 NORTH AMERICA: WOOD PRESERVATIVES MARKET SIZE, BY APPLICATION, 2018-2025 (USD MILLION)
TABLE 44 NORTH AMERICA: WOOD PRESERVATIVES MARKET SIZE, BY APPLICATION, 2018-2025 (KILOTON)
TABLE 45 NORTH AMERICA: WOOD PRESERVATIVES MARKET SIZE IN RESIDENTIAL SEGMENT, BY-SUB-APPLICATION, 2018-2025 (USD MILLION)
TABLE 46 NORTH AMERICA: WOOD PRESERVATIVES MARKET SIZE IN RESIDENTIAL SEGMENT, BY SUB-APPLICATION, 2018-2025 (KILOTON)
TABLE 47 NORTH AMERICA: WOOD PRESERVATIVES MARKET SIZE IN COMMERCIAL SEGMENT, BY SUB-APPLICATION, 2018-2025 (USD MILLION)
TABLE 48 NORTH AMERICA: WOOD PRESERVATIVES MARKET SIZE IN COMMERCIAL SEGMENT, BY SUB-APPLICATION, 2018-2025 (KILOTON)
TABLE 49 NORTH AMERICA: WOOD PRESERVATIVES MARKET SIZE IN INDUSTRIAL SEGMENT, BY SUB-APPLICATION, 2018-2025 (USD MILLION)
TABLE 50 NORTH AMERICA: WOOD PRESERVATIVES MARKET SIZE IN INDUSTRIAL SEGMENT, BY SUB-APPLICATION, 2018-2025 (KILOTON)
TABLE 51 US: WOOD PRESERVATIVES MARKET SIZE, BY FORMULATION, 2018-2025 (USD MILLION)
TABLE 52 US: WOOD PRESERVATIVES MARKET SIZE, BY FORMULATION, 2018-2025 (KILOTON)
TABLE 53 US: WOOD PRESERVATIVES MARKET SIZE, BY APPLICATION, 2018-2025 (USD MILLION)
TABLE 54 US: WOOD PRESERVATIVES MARKET SIZE, BY APPLICATION, 2018-2025 (KILOTON)
TABLE 55 CANADA: WOOD PRESERVATIVES MARKET SIZE, BY FORMULATION, 2018-2025 (USD MILLION)
TABLE 56 CANADA: WOOD PRESERVATIVES MARKET SIZE, BY FORMULATION, 2018-2025 (KILOTON)
TABLE 57 CANADA: WOOD PRESERVATIVES MARKET SIZE, BY APPLICATION, 2018-2025 (USD MILLION)
TABLE 58 CANADA: WOOD PRESERVATIVES MARKET SIZE, BY APPLICATION, 2018-2025 (KILOTON)
TABLE 59 MEXICO: WOOD PRESERVATIVES MARKET SIZE, BY FORMULATION, 2018-2025 (USD MILLION)
TABLE 60 MEXICO: WOOD PRESERVATIVES MARKET SIZE, BY FORMULATION, 2018-2025 (KILOTON)
TABLE 61 MEXICO: WOOD PRESERVATIVES MARKET SIZE, BY APPLICATION, 2018-2025 (USD MILLION)
TABLE 62 MEXICO: WOOD PRESERVATIVES MARKET SIZE, BY APPLICATION, 2018-2025 (KILOTON)
TABLE 63 EUROPE: WOOD PRESERVATIVES MARKET SIZE, BY COUNTRY, 2018-2025 (USD MILLION)
TABLE 64 EUROPE: WOOD PRESERVATIVES MARKET SIZE, BY COUNTRY, 2018-2025 (KILOTON)
TABLE 65 EUROPE: WOOD PRESERVATIVES MARKET SIZE, BY FORMULATION, 2018-2025 (USD MILLION)
TABLE 66 EUROPE: WOOD PRESERVATIVES MARKET SIZE, BY FORMULATION, 2018-2025 (KILOTON)
TABLE 67 EUROPE: WATER-BASED WOOD PRESERVATIVES MARKET SIZE, BY SUB-FORMULATION, 2018-2025 (USD MILLION)
TABLE 68 EUROPE: WATER-BASED WOOD PRESERVATIVES MARKET SIZE, BY SUB-FORMULATION, 2018-2025 (KILOTON)
TABLE 69 EUROPE: OIL-BASED WOOD PRESERVATIVES MARKET SIZE, BY SUB-FORMULATION 2018-2025 (USD MILLION)
TABLE 70 EUROPE: OIL-BASED WOOD PRESERVATIVES MARKET SIZE, BY SUB-FORMULATION, 2018-2025 (KILOTON)
TABLE 71 EUROPE: SOLVENT-BASED WOOD PRESERVATIVES MARKET SIZE, BY SUB-FORMULATION, 2018-2025 (USD MILLION)
TABLE 72 EUROPE: SOLVENT-BASED WOOD PRESERVATIVES MARKET SIZE, BY SUB-FORMULATION, 2018-2025 (KILOTON)
TABLE 73 EUROPE: WOOD PRESERVATIVES MARKET SIZE, BY APPLICATION, 2018-2025 (USD MILLION)
TABLE 74 EUROPE: WOOD PRESERVATIVES MARKET SIZE, BY APPLICATION, 2018-2025 (KILOTON)
TABLE 75 EUROPE: WOOD PRESERVATIVES MARKET SIZE IN RESIDENTIAL APPLICATION, BY SUB-APPLICATION, 2018-2025 (USD MILLION)
TABLE 76 EUROPE: WOOD PRESERVATIVES MARKET SIZE IN RESIDENTIAL APPLICATION, BY SUB-APPLICATION 2018-2025 (KILOTON)
TABLE 77 EUROPE: WOOD PRESERVATIVES MARKET SIZE IN COMMERCIAL APPLICATION, BY SUB-APPLICATION, 2018-2025 (USD MILLION)
TABLE 78 EUROPE: WOOD PRESERVATIVES MARKET SIZE IN COMMERCIAL APPLICATION, BY SUB-APPLICATION, 2018-2025 (KILOTON)
TABLE 79 EUROPE: WOOD PRESERVATIVES MARKET SIZE IN INDUSTRIAL APPLICATION, BY SUB-APPLICATION, 2018-2025 (USD MILLION)
TABLE 80 EUROPE: WOOD PRESERVATIVES MARKET SIZE IN INDUSTRIAL APPLICATION, BY SUB-APPLICATION, 2018-2025 (KILOTON)
TABLE 81 GERMANY: WOOD PRESERVATIVES MARKET SIZE, BY FORMULATION, 2018-2025 (USD MILLION)
TABLE 82 GERMANY: WOOD PRESERVATIVES MARKET SIZE, BY FORMULATION, 2018-2025 (KILOTON)
TABLE 83 GERMANY: WOOD PRESERVATIVES MARKET SIZE, BY APPLICATION, 2018-2025 (USD MILLION)
TABLE 84 GERMANY: WOOD PRESERVATIVES MARKET SIZE, BY APPLICATION, 2018-2025 (KILOTON)
TABLE 85 FRANCE: WOOD PRESERVATIVES MARKET SIZE, BY FORMULATION, 2018-2025 (USD MILLION)
TABLE 86 FRANCE: WOOD PRESERVATIVES MARKET SIZE, BY FORMULATION, 2018-2025 (KILOTON)
TABLE 87 FRANCE: WOOD PRESERVATIVES MARKET SIZE, BY APPLICATION, 2018-2025 (USD MILLION)
TABLE 88 FRANCE: WOOD PRESERVATIVES MARKET SIZE, BY APPLICATION, 2018-2025 (KILOTON)
TABLE 89 UK: WOOD PRESERVATIVES MARKET SIZE, BY FORMULATION, 2018-2025 (USD MILLION)
TABLE 90 UK: WOOD PRESERVATIVES MARKET SIZE, BY FORMULATION, 2018-2025 (KILOTON)
TABLE 91 UK: WOOD PRESERVATIVES MARKET SIZE, BY APPLICATION, 2018-2025 (USD MILLION)
TABLE 92 UK: WOOD PRESERVATIVES MARKET SIZE, BY APPLICATION, 2018-2025 (KILOTON)
TABLE 93 RUSSIA: WOOD PRESERVATIVES MARKET SIZE, BY FORMULATION, 2018-2025 (USD MILLION)
TABLE 94 RUSSIA: WOOD PRESERVATIVES MARKET SIZE, BY FORMULATION, 2018-2025 (KILOTON)
TABLE 95 RUSSIA: WOOD PRESERVATIVES MARKET SIZE, BY APPLICATION, 2018-2025 (USD MILLION)
TABLE 96 RUSSIA: WOOD PRESERVATIVES MARKET SIZE, BY APPLICATION, 2018-2025 (KILOTON)
TABLE 97 ITALY: WOOD PRESERVATIVES MARKET SIZE, BY FORMULATION, 2018-2025 (USD MILLION)
TABLE 98 ITALY: WOOD PRESERVATIVES MARKET SIZE, BY FORMULATION, 2018-2025 (KILOTON)
TABLE 99 ITALY: WOOD PRESERVATIVES MARKET SIZE, BY APPLICATION, 2018-2025 (USD MILLION)
TABLE 100 ITALY: WOOD PRESERVATIVES MARKET SIZE, BY APPLICATION, 2018-2025 (KILOTON)
TABLE 101 SPAIN: WOOD PRESERVATIVES MARKET SIZE, BY FORMULATION, 2018-2025 (USD MILLION)
TABLE 102 SPAIN: WOOD PRESERVATIVES MARKET SIZE, BY FORMULATION, 2018-2025 (KILOTON)
TABLE 103 SPAIN: WOOD PRESERVATIVES MARKET SIZE, BY APPLICATION, 2018-2025 (USD MILLION)
TABLE 104 SPAIN: WOOD PRESERVATIVES MARKET SIZE, BY APPLICATION, 2018-2025 (KILOTON)
TABLE 105 POLAND: WOOD PRESERVATIVES MARKET SIZE, BY FORMULATION, 2018-2025 (USD MILLION)
TABLE 106 POLAND: WOOD PRESERVATIVES MARKET SIZE, BY FORMULATION, 2018-2025 (KILOTON)
TABLE 107 POLAND: WOOD PRESERVATIVES MARKET SIZE, BY APPLICATION, 2018-2025 (USD MILLION)
TABLE 108 POLAND: WOOD PRESERVATIVES MARKET SIZE, BY APPLICATION, 2018-2025 (KILOTON)
TABLE 109 BELGIUM: WOOD PRESERVATIVES MARKET SIZE, BY FORMULATION, 2018-2025 (USD MILLION)
TABLE 110 BELGIUM: WOOD PRESERVATIVES MARKET SIZE, BY FORMULATION, 2018-2025 (KILOTON)
TABLE 111 BELGIUM: WOOD PRESERVATIVES MARKET SIZE, BY APPLICATION, 2018-2025 (USD MILLION)
TABLE 112 BELGIUM: WOOD PRESERVATIVES MARKET SIZE, BY APPLICATION, 2018-2025 (KILOTON)
TABLE 113 THE NETHERLANDS: WOOD PRESERVATIVES MARKET SIZE, BY FORMULATION, 2018-2025 (USD MILLION)
TABLE 114 THE NETHERLANDS: WOOD PRESERVATIVES MARKET SIZE, BY FORMULATION, 2018-2025 (KILOTON)
TABLE 115 THE NETHERLANDS: WOOD PRESERVATIVES MARKET SIZE, BY APPLICATION, 2018-2025 (USD MILLION)
TABLE 116 THE NETHERLANDS: WOOD PRESERVATIVES MARKET SIZE, BY APPLICATION, 2018-2025 (KILOTON)
TABLE 117 SWEDEN: WOOD PRESERVATIVES MARKET SIZE, BY FORMULATION, 2018-2025 (USD MILLION)
TABLE 118 SWEDEN: WOOD PRESERVATIVES MARKET SIZE, BY FORMULATION, 2018-2025 (KILOTON)
TABLE 119 SWEDEN: WOOD PRESERVATIVES MARKET SIZE, BY APPLICATION, 2018-2025 (USD MILLION)
TABLE 120 SWEDEN: WOOD PRESERVATIVES MARKET SIZE, BY APPLICATION, 2018-2025 (KILOTON)
TABLE 121 FINLAND: WOOD PRESERVATIVES MARKET SIZE, BY FORMULATION, 2018-2025 (USD MILLION)
TABLE 122 FINLAND: WOOD PRESERVATIVES MARKET SIZE, BY FORMULATION, 2018-2025 (KILOTON)
TABLE 123 FINLAND: WOOD PRESERVATIVES MARKET SIZE, BY APPLICATION, 2018-2025 (USD MILLION)
TABLE 124 FINLAND: WOOD PRESERVATIVES MARKET SIZE, BY APPLICATION, 2018-2025 (KILOTON)
TABLE 125 NORWAY: WOOD PRESERVATIVES MARKET SIZE, BY FORMULATION, 2018-2025 (USD MILLION)
TABLE 126 NORWAY: WOOD PRESERVATIVES MARKET SIZE, BY FORMULATION, 2018-2025 (KILOTON)
TABLE 127 NORWAY: WOOD PRESERVATIVES MARKET SIZE, BY APPLICATION, 2018-2025 (USD MILLION)
TABLE 128 NORWAY: WOOD PRESERVATIVES MARKET SIZE, BY APPLICATION, 2018-2025 (KILOTON)
TABLE 129 REST OF EUROPE: WOOD PRESERVATIVES MARKET SIZE, BY FORMULATION, 2018-2025 (USD MILLION)
TABLE 130 REST OF EUROPE: WOOD PRESERVATIVES MARKET SIZE, BY FORMULATION, 2018-2025 (KILOTON)
TABLE 131 REST OF EUROPE: WOOD PRESERVATIVES MARKET SIZE, BY APPLICATION, 2018-2025 (USD MILLION)
TABLE 132 REST OF EUROPE: WOOD PRESERVATIVES MARKET SIZE, BY APPLICATION, 2018-2025 (KILOTON)
TABLE 133 APAC: WOOD PRESERVATIVES MARKET SIZE, BY COUNTRY, 2018-2025 (USD MILLION)
TABLE 134 APAC: WOOD PRESERVATIVES MARKET SIZE, BY COUNTRY, 2018-2025 (KILOTON)
TABLE 135 APAC: WOOD PRESERVATIVES MARKET SIZE, BY FORMULATION, 2018-2025 (USD MILLION)
TABLE 136 APAC: WOOD PRESERVATIVES MARKET SIZE, BY FORMULATION, 2018-2025 (KILOTON)
TABLE 137 APAC: WATER-BASED WOOD PRESERVATIVES MARKET SIZE, BY SUB-FORMULATION, 2018-2025 (USD MILLION)
TABLE 138 APAC: WATER-BASED WOOD PRESERVATIVES MARKET SIZE, BY SUB-FORMULATION, 2018-2025 (KILOTON)
TABLE 139 APAC: OIL-BASED WOOD PRESERVATIVES MARKET SIZE, BY SUB-FORMULATION, 2018-2025 (USD MILLION)
TABLE 140 APAC: OIL-BASED WOOD PRESERVATIVES MARKET SIZE, BY SUB-FORMULATION, 2018-2025 (KILOTON)
TABLE 141 APAC: SOLVENT-BASED WOOD PRESERVATIVES MARKET SIZE, BY SUB-FORMULATION, 2018-2025 (USD MILLION)
TABLE 142 APAC: SOLVENT-BASED WOOD PRESERVATIVES MARKET SIZE, BY SUB-FORMULATION, 2018-2025 (KILOTON)
TABLE 143 APAC: WOOD PRESERVATIVES MARKET SIZE, BY APPLICATION, 2018-2025 (USD MILLION)
TABLE 144 APAC: WOOD PRESERVATIVES MARKET SIZE, BY APPLICATION, 2018-2025 (KILOTON)
TABLE 145 APAC: WOOD PRESERVATIVES MARKET SIZE IN RESIDENTIAL SEGMENT, BY SUB-APPLICATION, 2018-2025 (USD MILLION)
TABLE 146 APAC: WOOD PRESERVATIVES MARKET SIZE IN RESIDENTIAL APPLICATION, BY SUB-APPLICATION, 2018-2025 (KILOTON)
TABLE 147 APAC: WOOD PRESERVATIVES MARKET SIZE IN COMMERCIAL APPLICATION, BY SUB-APPLICATION, 2018-2025 (USD MILLION)
TABLE 148 APAC: WOOD PRESERVATIVES MARKET SIZE IN COMMERCIAL APPLICATION, BY SUB-APPLICATION, 2018-2025 (KILOTON)
TABLE 149 APAC: WOOD PRESERVATIVES MARKET SIZE IN INDUSTRIAL APPLICATION, BY SUB-APPLICATION, 2018-2025 (USD MILLION)
TABLE 150 APAC: WOOD PRESERVATIVES MARKET SIZE IN INDUSTRIAL APPLICATION, BY SUB-APPLICATION, 2018-2025 (KILOTON)
TABLE 151 CHINA: WOOD PRESERVATIVES MARKET SIZE, BY FORMULATION, 2018-2025 (USD MILLION)
TABLE 152 CHINA: WOOD PRESERVATIVES MARKET SIZE, BY FORMULATION, 2018-2025 (KILOTON)
TABLE 153 CHINA: WOOD PRESERVATIVES MARKET SIZE, BY APPLICATION, 2018-2025 (USD MILLION)
TABLE 154 CHINA: WOOD PRESERVATIVES MARKET SIZE, BY APPLICATION, 2018-2025 (KILOTON)
TABLE 155 JAPAN: WOOD PRESERVATIVES MARKET SIZE, BY FORMULATION, 2018-2025 (USD MILLION)
TABLE 156 JAPAN: WOOD PRESERVATIVES MARKET SIZE, BY FORMULATION, 2018-2025 (KILOTON)
TABLE 157 JAPAN: WOOD PRESERVATIVES MARKET SIZE, BY APPLICATION, 2018-2025 (USD MILLION)
TABLE 158 JAPAN: WOOD PRESERVATIVES MARKET SIZE, BY APPLICATION, 2018-2025 (KILOTON)
TABLE 159 INDIA: WOOD PRESERVATIVES MARKET SIZE, BY FORMULATION, 2018-2025 (USD MILLION)
TABLE 160 INDIA: WOOD PRESERVATIVES MARKET SIZE, BY FORMULATION, 2018-2025 (KILOTON)
TABLE 161 INDIA: WOOD PRESERVATIVES MARKET SIZE, BY APPLICATION, 2018-2025 (USD MILLION)
TABLE 162 INDIA: WOOD PRESERVATIVES MARKET SIZE, BY APPLICATION, 2018-2025 (KILOTON)
TABLE 163 SOUTH KOREA: WOOD PRESERVATIVES MARKET SIZE, BY FORMULATION, 2018-2025 (USD MILLION)
TABLE 164 SOUTH KOREA: WOOD PRESERVATIVES MARKET SIZE, BY FORMULATION, 2018-2025 (KILOTON)
TABLE 165 SOUTH KOREA: WOOD PRESERVATIVES MARKET SIZE, BY APPLICATION, 2018-2025 (USD MILLION)
TABLE 166 SOUTH KOREA: WOOD PRESERVATIVES MARKET SIZE, BY APPLICATION, 2018-2025 (KILOTON)
TABLE 167 INDONESIA: WOOD PRESERVATIVES MARKET SIZE, BY FORMULATION, 2018-2025 (USD MILLION)
TABLE 168 INDONESIA: WOOD PRESERVATIVES MARKET SIZE, BY FORMULATION, 2018-2025 (KILOTON)
TABLE 169 INDONESIA: WOOD PRESERVATIVES MARKET SIZE, BY APPLICATION, 2018-2025 (USD MILLION)
TABLE 170 INDONESIA: WOOD PRESERVATIVES MARKET SIZE, BY APPLICATION, 2018-2025 (KILOTON)
TABLE 171 MALAYSIA: WOOD PRESERVATIVES MARKET SIZE, BY FORMULATION, 2018-2025 (USD MILLION)
TABLE 172 MALAYSIA: WOOD PRESERVATIVES MARKET SIZE, BY FORMULATION, 2018-2025 (KILOTON)
TABLE 173 MALAYSIA: WOOD PRESERVATIVES MARKET SIZE, BY APPLICATION, 2018-2025 (USD MILLION)
TABLE 174 MALAYSIA: WOOD PRESERVATIVES MARKET SIZE, BY APPLICATION, 2018-2025 (KILOTON)
TABLE 175 AUSTRALIA & NEW ZEALAND: WOOD PRESERVATIVES MARKET SIZE, BY FORMULATION, 2018-2025 (USD MILLION)
TABLE 176 AUSTRALIA & NEW ZEALAND: WOOD PRESERVATIVES MARKET SIZE, BY FORMULATION, 2018-2025 (KILOTON)
TABLE 177 AUSTRALIA & NEW ZEALAND: WOOD PRESERVATIVES MARKET SIZE, BY APPLICATION, 2018-2025 (USD MILLION)
TABLE 178 AUSTRALIA & NEW ZEALAND: WOOD PRESERVATIVES MARKET SIZE, BY APPLICATION, 2018-2025 (KILOTON)
TABLE 179 REST OF APAC: WOOD PRESERVATIVES MARKET SIZE, BY FORMULATION, 2018-2025 (USD MILLION)
TABLE 180 REST OF APAC: WOOD PRESERVATIVES MARKET SIZE, BY FORMULATION, 2018-2025 (KILOTON)
TABLE 181 REST OF APAC: WOOD PRESERVATIVES MARKET SIZE, BY APPLICATION, 2018-2025 (USD MILLION)
TABLE 182 REST OF APAC: WOOD PRESERVATIVES MARKET SIZE, BY APPLICATION, 2018-2025 (KILOTON)
TABLE 183 MIDDLE EAST & AFRICA: WOOD PRESERVATIVES MARKET SIZE, BY COUNTRY, 2018-2025 (USD MILLION)
TABLE 184 MIDDLE EAST & AFRICA: WOOD PRESERVATIVES MARKET SIZE, BY COUNTRY, 2018-2025 (KILOTON)
TABLE 185 MIDDLE EAST & AFRICA: WOOD PRESERVATIVES MARKET SIZE, BY FORMULATION, 2018-2025 (USD MILLION)
TABLE 186 MIDDLE EAST & AFRICA: WOOD PRESERVATIVES MARKET SIZE, BY FORMULATION, 2018-2025 (KILOTON)
TABLE 187 MIDDLE EAST & AFRICA: WATER-BASED WOOD PRESERVATIVES MARKET SIZE, BY SUB-FORMULATION, 2018-2025 (USD MILLION)
TABLE 188 MIDDLE EAST & AFRICA: WATER-BASED WOOD PRESERVATIVES MARKET SIZE, BY SUB-FORMULATION, 2018-2025 (KILOTON)
TABLE 189 MIDDLE EAST & AFRICA: OIL-BASED WOOD PRESERVATIVES MARKET SIZE, BY SUB-FORMULATION, 2018-2025 (USD MILLION)
TABLE 190 MIDDLE EAST & AFRICA: OIL-BASED WOOD PRESERVATIVES MARKET SIZE, BY SUB-FORMULATION, 2018-2025 (KILOTON)
TABLE 191 MIDDLE EAST & AFRICA: SOLVENT-BASED WOOD PRESERVATIVES MARKET SIZE, BY SUB-FORMULATION, 2018-2025 (USD MILLION)
TABLE 192 MIDDLE EAST & AFRICA: SOLVENT-BASED WOOD PRESERVATIVES MARKET SIZE, BY SUB-FORMULATION, 2018-2025 (KILOTON)
TABLE 193 MIDDLE EAST & AFRICA: WOOD PRESERVATIVES MARKET SIZE, BY APPLICATION, 2018-2025 (USD MILLION)
TABLE 194 MIDDLE EAST & AFRICA: WOOD PRESERVATIVES MARKET SIZE, BY APPLICATION, 2018-2025 (KILOTON)
TABLE 195 MIDDLE EAST & AFRICA: WOOD PRESERVATIVES MARKET SIZE IN RESIDENTIAL APPLICATIONS, BY SUB-APPLICATION, 2018-2025 (USD MILLION)
TABLE 196 MIDDLE EAST & AFRICA: WOOD PRESERVATIVES MARKET SIZE IN RESIDENTIAL APPLICATION, BY SUB-APPLICATION, 2018-2025 (KILOTON)
TABLE 197 MIDDLE EAST & AFRICA: WOOD PRESERVATIVES MARKET SIZE IN COMMERCIAL APPLICATION, BY SUB-APPLICATION, 2018-2025 (USD MILLION)
TABLE 198 MIDDLE EAST & AFRICA: WOOD PRESERVATIVES MARKET SIZE IN COMMERCIAL APPLICATION, BY SUB-APPLICATION, 2018-2025 (KILOTON)
TABLE 199 MIDDLE EAST & AFRICA: WOOD PRESERVATIVES MARKET SIZE IN INDUSTRIAL APPLICATION, BY SUB-APPLICATION, 2018-2025 (USD MILLION)
TABLE 200 MIDDLE EAST & AFRICA: WOOD PRESERVATIVES MARKET SIZE IN INDUSTRIAL APPLICATION, BY SUB-APPLICATION, 2018-2025 (KILOTON)
TABLE 201 SAUDI ARABIA: WOOD PRESERVATIVES MARKET SIZE, BY FORMULATION, 2018-2025 (USD MILLION)
TABLE 202 SAUDI ARABIA: WOOD PRESERVATIVES MARKET SIZE, BY FORMULATION, 2018-2025 (KILOTON)
TABLE 203 SAUDI ARABIA: WOOD PRESERVATIVES MARKET SIZE, BY APPLICATION, 2018-2025 (USD MILLION)
TABLE 204 SAUDI ARABIA: WOOD PRESERVATIVES MARKET SIZE, BY APPLICATION, 2018-2025 (KILOTON)
TABLE 205 SOUTH AFRICA: WOOD PRESERVATIVES MARKET SIZE, BY FORMULATION, 2018-2025 (USD MILLION)
TABLE 206 SOUTH AFRICA: WOOD PRESERVATIVES MARKET SIZE, BY FORMULATION, 2018-2025 (KILOTON)
TABLE 207 SOUTH AFRICA: WOOD PRESERVATIVES MARKET SIZE, BY APPLICATION, 2018-2025 (USD MILLION)
TABLE 208 SOUTH AFRICA: WOOD PRESERVATIVES MARKET SIZE, BY APPLICATION, 2018-2025 (KILOTON)
TABLE 209 UAE: WOOD PRESERVATIVES MARKET SIZE, BY FORMULATION, 2018-2025 (USD MILLION)
TABLE 210 UAE: WOOD PRESERVATIVES MARKET SIZE, BY FORMULATION, 2018-2025 (KILOTON)
TABLE 211 UAE: WOOD PRESERVATIVES MARKET SIZE, BY APPLICATION, 2018-2025 (USD MILLION)
TABLE 212 UAE: WOOD PRESERVATIVES MARKET SIZE, BY APPLICATION, 2018-2025 (KILOTON)
TABLE 213 REST OF MIDDLE EAST & AFRICA: WOOD PRESERVATIVES MARKET SIZE, BY FORMULATION, 2020-2025 (USD MILLION)
TABLE 214 REST OF MIDDLE EAST & AFRICA: WOOD PRESERVATIVES MARKET SIZE, BY FORMULATION, 2018-2025 (KILOTON)
TABLE 215 REST OF MIDDLE EAST & AFRICA: WOOD PRESERVATIVES MARKET SIZE, BY APPLICATION, 2018-2025 (USD MILLION)
TABLE 216 REST OF MIDDLE EAST & AFRICA: WOOD PRESERVATIVES MARKET SIZE, BY APPLICATION, 2018-2025 (KILOTON)
TABLE 217 SOUTH AMERICA: WOOD PRESERVATIVES MARKET SIZE, BY COUNTRY, 2018-2025 (USD MILLION)
TABLE 218 SOUTH AMERICA: WOOD PRESERVATIVES MARKET SIZE, BY COUNTRY, 2018-2025 (KILOTON)
TABLE 219 SOUTH AMERICA: WOOD PRESERVATIVES MARKET SIZE, BY FORMULATION, 2018-2025 (USD MILLION)
TABLE 220 SOUTH AMERICA: WOOD PRESERVATIVES MARKET SIZE, BY FORMULATION, 2018-2025 (KILOTON)
TABLE 221 SOUTH AMERICA: WATER-BASED WOOD PRESERVATIVES MARKET SIZE, BY SUB-FORMULATION, 2018-2025 (USD MILLION)
TABLE 222 SOUTH AMERICA: WATER-BASED WOOD PRESERVATIVES MARKET SIZE, BY SUB-FORMULATION, 2018-2025 (KILOTON)
TABLE 223 SOUTH AMERICA: OIL-BASED WOOD PRESERVATIVES MARKET SIZE, BY SUB-FORMULATION, 2018-2025 (USD MILLION)
TABLE 224 SOUTH AMERICA: OIL-BASED WOOD PRESERVATIVES MARKET SIZE, BY SUB-FORMULATION, 2018-2025 (KILOTON)
TABLE 225 SOUTH AMERICA: SOLVENT-BASED WOOD PRESERVATIVES MARKET SIZE, BY SUB-FORMULATION, 2018-2025 (USD MILLION)
TABLE 226 SOUTH AMERICA: SOLVENT-BASED WOOD PRESERVATIVES MARKET SIZE, BY SUB-FORMULATION, 2018-2025 (KILOTON)
TABLE 227 SOUTH AMERICA: WOOD PRESERVATIVES MARKET SIZE, BY APPLICATION, 2018-2025 (USD MILLION)
TABLE 228 SOUTH AMERICA: WOOD PRESERVATIVES MARKET SIZE, BY APPLICATION, 2018-2025 (KILOTON)
TABLE 229 SOUTH AMERICA: WOOD PRESERVATIVES MARKET SIZE IN RESIDENTIAL APPLICATION, BY SUB-APPLICATION, 2018-2025 (USD MILLION)
TABLE 230 SOUTH AMERICA: WOOD PRESERVATIVES MARKET SIZE IN RESIDENTIAL APPLICATION, BY SUB-APPLICATION, 2018-2025 (KILOTON)
TABLE 231 SOUTH AMERICA: WOOD PRESERVATIVES MARKET SIZE IN COMMERCIAL APPLICATION, BY SUB-APPLICATION, 2018-2025 (USD MILLION)
TABLE 232 SOUTH AMERICA: WOOD PRESERVATIVES MARKET SIZE IN COMMERCIAL APPLICATION, BY SUB-APPLICATION, 2018-2025 (KILOTON)
TABLE 233 SOUTH AMERICA: WOOD PRESERVATIVES MARKET SIZE IN INDUSTRIAL APPLICATION, BY SUB-APPLICATION, 2018-2025 (USD MILLION)
TABLE 234 SOUTH AMERICA: WOOD PRESERVATIVES MARKET SIZE IN INDUSTRIAL APPLICATION, BY SUB-APPLICATION, 2018-2025 (KILOTON)
TABLE 235 BRAZIL: WOOD PRESERVATIVES MARKET SIZE, BY FORMULATION, 2018-2025 (USD MILLION)
TABLE 236 BRAZIL: WOOD PRESERVATIVES MARKET SIZE, BY FORMULATION, 2018-2025 (KILOTON)
TABLE 237 BRAZIL: WOOD PRESERVATIVES MARKET SIZE, BY APPLICATION, 2018-2025 (USD MILLION)
TABLE 238 BRAZIL: WOOD PRESERVATIVES MARKET SIZE, BY APPLICATION, 2018-2025 (KILOTON)
TABLE 239 ARGENTINA: WOOD PRESERVATIVES MARKET SIZE, BY FORMULATION, 2018-2025 (USD MILLION)
TABLE 240 ARGENTINA: WOOD PRESERVATIVES MARKET SIZE, BY FORMULATION, 2018-2025 (KILOTON)
TABLE 241 ARGENTINA: WOOD PRESERVATIVES MARKET SIZE, BY APPLICATION, 2018-2025 (USD MILLION)
TABLE 242 ARGENTINA: WOOD PRESERVATIVES MARKET SIZE, BY APPLICATION, 2018-2025 (KILOTON)
TABLE 243 REST OF SOUTH AMERICA: WOOD PRESERVATIVES MARKET SIZE, BY FORMULATION, 2018-2025 (USD MILLION)
TABLE 244 REST OF SOUTH AMERICA: WOOD PRESERVATIVES MARKET SIZE, BY FORMULATION, 2018-2025 (KILOTON)
TABLE 245 REST OF SOUTH AMERICA: WOOD PRESERVATIVES MARKET SIZE, BY APPLICATION, 2018-2025 (USD MILLION)
TABLE 246 REST OF SOUTH AMERICA: WOOD PRESERVATIVES MARKET SIZE, BY APPLICATION, 2018-2025 (KILOTON)
TABLE 247 EXPANSION, 2016-2020
TABLE 248 MERGER & ACQUISITION, 2016-2020
TABLE 249 NEW PRODUCT LAUNCH, 2016-2020
LIST OF FIGURES (30 Figures)
FIGURE 1 WOOD PRESERVATIVES MARKET: DATA TRIANGULATION
FIGURE 2 WATER-BASED SEGMENT DOMINATED THE WOOD PRESERVATIVES MARKET
FIGURE 3 RESIDENTIAL APPLICATION DOMINATED THE WOOD PRESERVATIVES MARKET
FIGURE 4 NORTH AMERICA DOMINATED THE WOOD PRESERVATIVES MARKET IN 2019
FIGURE 5 GROWING USAGE OF WOOD PRESERVATIVES IN END-USE APPLICATIONS TO DRIVE THE MARKET
FIGURE 6 NORTH AMERICA TO BE THE LARGEST MARKET BETWEEN 2020 AND 2025
FIGURE 7 US AND THE RESIDENTIAL SEGMENT ACCOUNTED FOR LARGEST SHARES
FIGURE 8 MEXICO, CANADA, AND INDIA TO BE FAST-GROWING MARKETS BETWEEN 2020 AND 2025
FIGURE 9 DRIVERS, RESTRAINTS, OPPORTUNITIES, AND CHALLENGES IN WOOD PRESERVATIVES MARKET
FIGURE 10 GDP GROWTH RATE FORECAST OF APAC COUNTRIES
FIGURE 11 WOOD PRESERVATIVES MARKET: PORTER'S FIVE FORCES ANALYSIS
FIGURE 12 LENGTH OF RAILWAY LINES (THOUSAND)
FIGURE 13 CHEMICAL PRODUCTION GROWTH OUTLOOK
FIGURE 14 WATER-BASED SEGMENT TO DOMINATE THE WOOD PRESERVATIVES MARKET
FIGURE 15 RESIDENTIAL SEGMENT TO DOMINATE THE WOOD PRESERVATIVES MARKET
FIGURE 16 APAC TO GROW AT THE HIGHEST RATE DURING FORECAST PERIOD
FIGURE 17 NORTH AMERICA: WOOD PRESERVATIVES MARKET SNAPSHOT
FIGURE 18 EUROPE: WOOD PRESERVATIVES MARKET SNAPSHOT
FIGURE 19 APAC: WOOD PRESERVATIVES MARKET SNAPSHOT
FIGURE 20 COMPANIES ADOPTED NEW PRODUCT DEVELOPMENT AND MERGER & ACQUISITION AS KEY GROWTH STRATEGIES BETWEEN 2016 AND 2020
FIGURE 21 GLOBAL WOOD PRESERVATIVES MARKET SHARE, BY COMPANY, 2019
FIGURE 22 KOPPERS: COMPANY SNAPSHOT
FIGURE 23 KOPPERS: SWOT ANALYSIS
FIGURE 24 LONZA: COMPANY SNAPSHOT
FIGURE 25 LONZA: SWOT ANALYSIS
FIGURE 26 LANXESS: COMPANY SNAPSHOT
FIGURE 27 LANXESS: SWOT ANALYSIS
FIGURE 28 CABOT MICROELECTRONICS: COMPANY SNAPSHOT
FIGURE 29 CABOT MICROELECTRONICS: SWOT ANALYSIS
FIGURE 30 BASF WOLMAN: SWOT ANALYSIS
The study involved four major activities in estimating the size of the wood preservatives market. Exhaustive secondary research was done to collect information on the market, peer market, and parent market. The next step was to validate these findings, assumptions, and sizing with industry experts across the value chain through primary research. Both top-down and bottom- up approaches were employed to estimate the total market size. After that, market breakdown and data triangulation were used to estimate the market size of segments and subsegments.
Secondary Research
In the secondary research process, various sources such as Hoovers, Bloomberg Businessweek, Factiva, World Bank, and Industry Journals were used. These secondary sources included annual reports, press releases & investor presentations of companies; white papers; certified publications; articles by recognized authors; and databases.
Primary Research
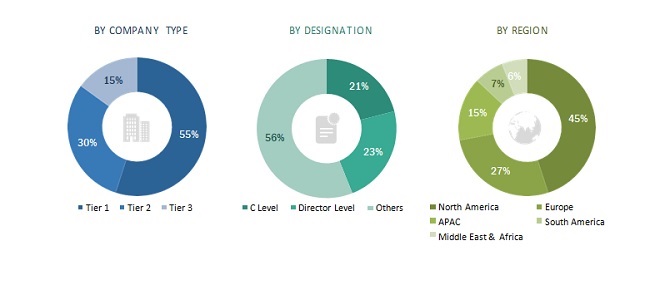
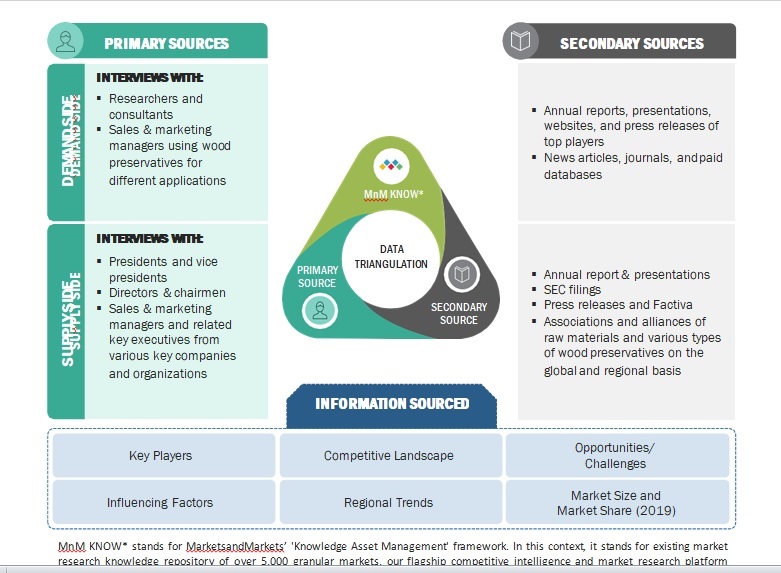
The wood preservatives market comprises several stakeholders, such as raw material suppliers, end-product manufacturers, and regulatory organizations in the supply chain. Developments in the wood preservatives market characterize the demand side. Market consolidation activities undertaken by manufacturers characterize the supply side. Various primary sources from both the supply and demand sides of the market were interviewed to obtain qualitative and quantitative information. Following is the breakdown of primary respondents:
To know about the assumptions considered for the study, download the pdf brochure
Market Size Estimation
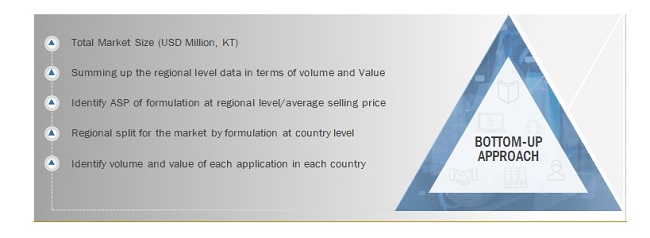
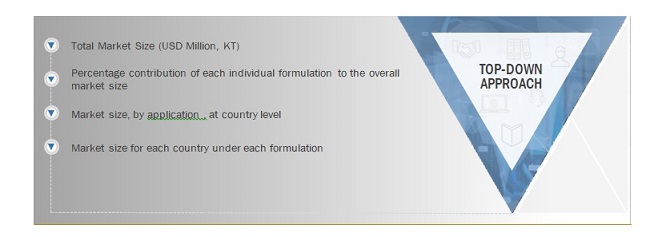
Both top-down and bottom-up approaches were used to estimate and validate the total size of the wood preservatives market. These methods were also used extensively to determine the size of various subsegments in the market. The research methodology used to estimate the market size includes the following:
- The key players in the industry and markets were identified through extensive secondary
- The industry’s supply chain and market size, in terms of value, were determined through primary and secondary research
- All percentage shares splits, and breakdowns were determined using secondary sources and verified through primary
Wood Preservatives Market: Bottom-Up Approach
To know about the assumptions considered for the study, Request for Free Sample Report
Wood Preservatives Market: Top-Down Approach
Data Triangulation
After arriving at the overall market size—using the market size estimation processes as explained above— the market was split into several segments and subsegments. To complete the overall market engineering process and arrive at the exact statistics of each market segment and subsegment, the data triangulation, and market breakdown procedures were employed, wherever applicable. The data was triangulated by studying various factors and trends from both the demand and supply sides in the wood preservatives market.
MnM KNOW* stands for MarketsandMarkets’ 'Knowledge Asset Management' framework. In this context, it stands for existing market research knowledge repository of over 5,000 granular markets, our flagship competitive intelligence and market research platform “Knowledge Store", subject matter experts, and independent consultants. MnM KNOW acts as an independent source that helps us validate information gathered from primary and secondary sources.
Report Objectives
- To define, describe, and forecast the wood preservatives market in terms of value and volume
- To provide detailed information about the key factors influencing the market growth, such as drivers, restraints, opportunities, and challenges
- To analyze and forecast the market size based on composition, chemistry, application, and technology
- To forecast the market size of five main regions, namely, North America, Europe, Asia Pacific (APAC), the Middle East & Africa, and South America (along with the key countries in each region)
- To strategically analyze the micromarkets1 with respect to individual growth trends, growth prospects, and contribution to the overall market
- To analyze the opportunities in the market for stakeholders and draw a competitive landscape for market leaders
- To analyze the competitive developments, such as expansion, mergers & acquisitions, new product developments, and agreement in the wood preservatives market
- To strategically profile the key players and comprehensively analyze their core competencies2
Note 1. Micromarkets are defined as subsegments of the wood preservatives market included in the report.
Note 2 : Corecompetencies2 ofthecompanies are determined in termsofproductofferings andbusiness strategies adopted by them to sustain in themarket.
Available Customizations:
With the given market data, MarketsandMarkets offers customizations according to the specific needs of the companies. The following customization options are available for the report:
Product Analysis
- Product matrix, which gives a detailed comparison of the product portfolio of each company
Regional Analysis
- Further breakdown of a region with respect to a particular country
Company Information
- Detailed analysis and profiling of additional market players (up to five).”


Growth opportunities and latent adjacency in Wood Preservatives Market