Bioactive Dressings Market by Product (Collagen, Alginate, Chitosan, Skin Substitute), Property (Antimicrobial, Non-antimicrobial), Application (Chronic Wounds (Diabetic Foot, Pressure Ulcers), Acute Wounds (Surgical, Burns))- Global Forecast to 2029
Market Growth Outlook Summary
The global bioactive dressings market growth forecasted to transform from USD 3.5 billion in 2024 to USD 5.8 billion by 2029, driven by a CAGR of 10.5%. The need for cutting-edge therapeutic solutions to address the growing incidence of chronic ewounds, such as diabetic ulcers, pressure ulcers, and venous leg ulcers, is driving the market for bioactive wound dressings. Further driving the market's growth are the aging population, the prevalence of diabetes, and increased knowledge of the need for proper wound care management. However, there is a dearth of knowledge and understanding so, the market will be somewhat be restrained by relationships between patients, medical professionals, and healthcare systems.
Bioactive Dressings Market Trends
To know about the assumptions considered for the study, Request for Free Sample Report
Bioactive Dressings Market Dynamics
Driver: Increasing prevalence of chronic wounds
The requirement for advanced wound care products, such as bioactive wound dressings, is increasing due to the growing prevalence of chronic wounds, like diabetic ulcers, pressure ulcers, and venous leg ulcers. Bioactive dressings promote much faster and more efficient healing. Amputations and infections are common consequences of diabetic foot ulcers, affecting 18.6 million people worldwide and 1.6 million people in the US each year. Approximately one-third of diabetics will develop diabetic foot ulcers at some point in their lives (Source: WHO, 2024). Each year, almost 2.5 million patients in the US are treated for pressure ulcers. The annual cost of caring for these patients ranges somewhere between USD 9.1 to USD 11.6 billion, with the cost of each treatment ranging from USD 20,900 to USD 151,700. Likewise, insufficient blood flow to the leg veins can lead to venous leg ulcers.
Restraint: Limited reimbursement policies
Globally, the reimbursement systems for bioactive wound dressings are not yet fully developed and standardized. Many countries (including Australia, the US, Singapore, Spain, parts of Italy, North Africa, and the Middle East) have no outpatient payments, forcing patients to pay out-of-pocket. Due to their limited commercial presence, these devices may not be available in countries such as Africa and India. These associations are partly covered by general social security in the UK, France, Denmark, and Germany. In contrast, the other part is covered by private insurers. Hospitals and suppliers mostly negotiate hospital costs for bioactive wound dressings, with clinical specialists deciding which products are available. The effective use of bioactive dressings requires professionals with the necessary training and interdisciplinary guidelines. However, the lack of education for nurses, especially general nurses, is still a major obstacle. The World Union of Wound Healing Societies (WUWHS) recommends strong educational initiatives to provide evidence-based best practices for modern wound care.
Opportunity: Growth potential of emerging countries
There is great growth potential for bioactive dressings in unexplored regions such as Asia Pacific and Latin America. Companies like Smith & Nephew are expanding in Singapore with a particular emphasis on medical education. Significant opportunities exist in emerging markets such as Saudi Arabia, the United Arab Emirates, Malaysia, Vietnam, Israel, India, and South Korea, which have low regulatory barriers, better healthcare infrastructures, and higher healthcare spending. The 7.3 million tourists from India's medical tourism sector in 2024 are expected to increase the demand for bioactive dressings. Hospitals will account for 80% of India's healthcare sector, which is expected to reach USD 372 billion by 2022. This expansion will also lead to a greater need for bioactive dressings in emerging markets.
Challenge: Navigating regulatory approval for bioactive dressings
Bioactive dressings must undergo rigorous regulatory scrutiny, including long and vast clinical studies and conformity with standards established by the US FDA and European EMA. This lengthy and high-cost approval process mostly delays the introduction of new products and limits market growth and the availability of effective inflammatory treatment solutions. Higher costs and long times usually discourage investment in new bioactive wound dressings. Around 8 million people worldwide suffer from wounds, and 2% of the population of the US suffers from chronic wounds. The increase in the number of deaths due to wound infections highlights the utmost need for advanced wound care dressings, including bioactive dressings. Manufacturers must be familiar with the regulatory requirements, as a lack of advanced dressings will adversely affect patient survival. In India, wound dressings are classified as Class A-D, requiring a CDSCO manufacturing license and strict regulatory procedures. This complexity creates important obstacles for manufacturers, delays market entry, and affects the outcome of patients.
Bioactive Dressings Market Ecosystem
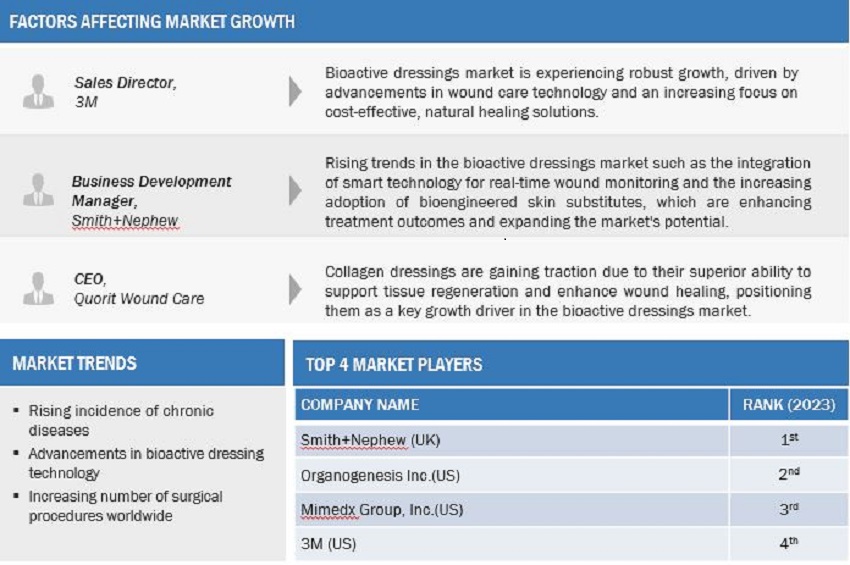
Prominent companies in this market include well-established, financially stable manufacturers of bioactive dressing products. These companies have been operating in the market for several years and possess diversified state-of-the-art technologies, product portfolios, and strong global sales and marketing networks. Prominent companies in this market include Smith+Nephew (UK), Organogenesis Inc. (US), MiMedx Group, Inc. (US), 3M (US), and Cardinal Health (US).
The bioactive dressings segment is expected to register the highest growth rate of the bioactive dressings industry, by type.
The bioactive dressings market is categorized into bioactive dressings and skin substitutes. In 2023, the bioactive dressings segment dominated the market. The large share of this segment can be attributed to the advanced wound capabilities of bioactive dressings mainly because of their properties, such as providing a moist environment, promoting cell proliferation, and enhancing tissue generation. Growth in this segment is also driven by the rising prevalence of chronic, surgical, and traumatic wounds, an increasing number of burn injuries, technological advancements in bioactive dressings, and increased spending on the treatment of chronic and surgical wounds.
In 2023, the chronic wounds segment dominated the bioactive dressings industry, by application.
The bioactive dressings market is segmented into acute and chronic wounds based on application. In 2023, the chronic wounds segment held the largest market share. Chronic wounds are injured tissues that do not heal within a normal time frame. Timely and effective treatment is essential to promote chronic wound healing. Growth in this segment is mainly driven by the growing elderly population and the rising incidence of chronic wounds, such as diabetic foot ulcers, pressure ulcers, and venous pressure ulcers. The increasing number of surgical procedures, mainly in the elderly population, is also contributing to the growth of this segment.
In 2023, hospitals & clinics dominated the bioactive dressings industry, by end user.
The bioactive dressings market is segmented by end users into hospitals & clinics, long-term care facilities, home care facilities, and other end users. In 2023, hospitals & clinics held the largest market share. The growth in this segment is mainly driven by the high demand for bioactive dressing products in hospitals & clinics, a large patient influx in these facilities settings, and also the accessibility of compensation. Only hospitals & clinics can provide the care and monitoring required in exceptionally severe cases. The increasing incidence of hospital-acquired wound infections is also contributing to market growth.
In 2023, North America dominated the bioactive dressings industry, by region.
By region, the bioactive dressings market is segmented into North America, Europe, Asia Pacific (APAC), Latin America (LATAM), the Middle East & Africa (MEA), and the GCC countries. In 2023, North America held the largest share and is expected to continue to dominate the market. This growth is attributed to the high prevalence of chronic wounds like diabetic foot ulcers, venous leg ulcers, and pressure ulcers, technological advances in bioactive dressing products, and increased healthcare expenditures in the region. Moreover, the growing elderly population in this region, who are more prone to chronic wounds, and high surgical rates, which mostly increase the incidence of post-surgical chronic wounds, are also driving the growth of this region.
To know about the assumptions considered for the study, download the pdf brochure
The bioactive dressings market is dominated by players such as Smith+Nephew (UK), Organogenesis Inc. (US), MiMedx Group, Inc. (US), 3M (US), and Cardinal Health (US).
Scope of the Bioactive Dressings Industry
Report Metric |
Details |
Market Revenue Size in 2024 |
USD 3.5 billion |
Projected Revenue Size by 2029 |
USD 5.8 billion |
Industry Growth Rate |
Poised to Grow at a CAGR of 10.5% |
Market Driver |
Increasing prevalence of chronic wounds |
Market Opportunity |
Growth potential of emerging countries |
This report categorizes the bioactive dressings market to forecast revenue and analyze trends in each of the following submarkets:
By Region
- North America
- Europe
- Asia Pacific
- Latin America
- Middle East & Africa
- GCC Countries
By Product Type
-
Bioactive Dressings
- Collagen Dressings
- Alginate Dressings
- Chitosan Dressings
- Honey Dressings
- Other Bioactive Dressings
-
Skin Substitutes
- Human Donor Tissue-derived Products
- Acellular Animal-derived Products
- Biosynthetic Products
By Property Type
- Antimicrobial Dressings
- Non-Antimicrobial Dressings
By Application
-
Chronic Wounds
- Diabetic Foot Ulcers
- Pressure Ulcers
- Venous Leg Ulcers
- Other Chronic Wounds
-
Acute Wounds
- Surgical Wounds
- Traumatic Wounds
- Burns
By End User
-
Hospitals & Clinics
- Inpatient Settings
- Outpatient Settings
- Home Care Settings
- Long Term Care Facilities
- Other End Users
Recent Developments of Bioactive Dressings Industry:
- With the acquisition of Kerecis (Ireland) in July 2023, Coloplast Corp (Denmark) obtained a long-term growth business with strong profitability expansion potential, well-positioned for long-term value creation.
- In August 2022, Organogenesis Inc. (US) received US FDA 510k Clearance for PuraPly MZ, a brand extension to the PuraPly product portfolio.
- In November 2021, Sanara MedTech Inc. (US) launched two new innovative products (FORTIFY TRG Tissue Repair Graft and FORTIFY FLOWABLE Extracellular Matrix) in partnership with Cook Biotech Inc. (US).
Frequently Asked Questions (FAQ):
What is the projected growth of the global bioactive dressings market between 2024 and 2029?
The global bioactive dressings market is expected to grow from USD 3.5 billion in 2024 to USD 5.8 billion by 2029, at a CAGR of 10.5%, driven by the growing need for advanced therapeutic solutions to treat chronic wounds such as diabetic ulcers, pressure ulcers, and venous leg ulcers.
What factors are driving the growth of the bioactive dressings market?
Key factors driving the market include the increasing prevalence of chronic wounds such as diabetic ulcers, pressure ulcers, and venous leg ulcers, along with the growing geriatric population and rising awareness regarding advanced wound care management.
What are the main challenges facing the bioactive dressings market?
Limited reimbursement policies, especially in developing countries, and a lack of proper education for healthcare professionals about bioactive dressings are major challenges hindering the market growth.
Which regions are expected to show significant growth in the bioactive dressings market?
Emerging markets such as Asia-Pacific, Latin America, and the Middle East & Africa offer significant growth opportunities due to rising healthcare spending, increasing awareness, and the need for advanced wound care solutions.
What types of products dominate the bioactive dressings market?
Bioactive dressings, including collagen, alginate, and chitosan dressings, dominate the market due to their ability to promote faster healing by providing a moist environment and promoting cell proliferation.
How do chronic wounds influence the bioactive dressings market?
The increasing incidence of chronic wounds, such as diabetic foot ulcers and pressure ulcers, significantly boosts the demand for bioactive dressings, which are essential for faster and effective wound healing.
What recent developments are influencing the bioactive dressings market?
Recent developments include Coloplast’s acquisition of Kerecis in 2023, which aims to expand bioactive dressing offerings and strengthen market presence in the advanced wound care sector.
What role do hospitals play in the bioactive dressings market?
Hospitals are the largest end-users of bioactive dressings, accounting for the highest share due to the large influx of patients with chronic wounds and the availability of advanced wound care solutions in hospital settings.
How does the aging population affect the bioactive dressings market?
The aging population, which is more susceptible to chronic wounds and infections, is driving the demand for bioactive dressings as these products offer effective wound healing solutions for elderly patients.
What technological advancements are shaping the bioactive dressings market?
Technological advancements in bioactive dressings, including innovations in collagen, alginate, and antimicrobial dressings, are improving wound healing efficiency and expanding the range of applications for chronic wound care.
To speak to our analyst for a discussion on the above findings, click Speak to Analyst
Exclusive indicates content/data unique to MarketsandMarkets and not available with any competitors.
- 5.1 INTRODUCTION
-
5.2 MARKET DYNAMICSDRIVERS- Rising prevalence of chronic wounds- Growing geriatric population- Increasing number of surgical procedures worldwide- Increasing incidence of burn injuries- Advancements in bioactive dressing technologyRESTRAINTS- High costs of bioactive dressing products- Limited reimbursement policiesOPPORTUNITIES- Growth potential of emerging countries- New product development- Strategic collaboration between market playersCHALLENGES- Difficult regulatory approval process- Lack of awareness and education
-
5.3 PRICING ANALYSISAVERAGE SELLING PRICE TREND OF BIOACTIVE DRESSINGSAVERAGE SELLING PRICE OF BIOACTIVE DRESSINGS, BY REGION
-
5.4 PATENT ANALYSISLIST OF MAJOR PATENTS
- 5.5 VALUE CHAIN ANALYSIS
- 5.6 SUPPLY CHAIN ANALYSIS
-
5.7 ECOSYSTEM ANALYSISBIOACTIVE DRESSINGS MARKET: ROLE IN ECOSYSTEM
-
5.8 PORTER’S FIVE FORCES ANALYSISTHREAT OF NEW ENTRANTSTHREAT OF SUBSTITUTESBARGAINING POWER OF BUYERSBARGAINING POWER OF SUPPLIERSDEGREE OF COMPETITION
-
5.9 KEY STAKEHOLDERS & BUYING CRITERIAKEY STAKEHOLDERS IN BUYING PROCESSBUYING CRITERIA
-
5.10 REGULATORY ANALYSISREGULATORY LANDSCAPE- North America- Europe- Asia Pacific- Latin America- Middle East- AfricaREGULATORY BODIES, GOVERNMENT AGENCIES, AND OTHER ORGANIZATIONS
-
5.11 TRADE ANALYSISTRADE ANALYSIS FOR WADDING, GAUZE, AND BANDAGES
-
5.12 TECHNOLOGY ANALYSISKEY TECHNOLOGIES- Kollagen technologyCOMPLEMENTARY TECHNOLOGIES- Bioactive microfiber gelling technologyADJACENT TECHNOLOGIES- Kerecis intact fish skin technology
- 5.13 KEY CONFERENCES & EVENTS, 2024–2025
- 5.14 TRENDS/DISRUPTIONS IMPACTING CUSTOMERS’ BUSINESSES
- 5.15 INVESTMENT & FUNDING SCENARIO
- 5.16 IMPACT OF AI ON BIOACTIVE DRESSINGS MARKET
- 6.1 INTRODUCTION
-
6.2 BIOACTIVE DRESSINGSCOLLAGEN DRESSINGS- Unique healing properties and biocompatibility to drive growthALGINATE DRESSINGS- Excellent absorption capacity to boost demand for alginate dressingsCHITOSAN DRESSINGS- Rising need for effective, natural wound healing options to support market growthHONEY DRESSINGS- Effective and natural wound care management to fuel growthOTHER BIOACTIVE DRESSINGS
-
6.3 SKIN SUBSTITUTESHUMAN DONOR TISSUE-DERIVED PRODUCTS- High efficacy of human donor tissue-derived products to support market demandACELLULAR ANIMAL-DERIVED PRODUCTS- Recognition of importance of ECM in wound treatment to boost development of acellular wound care biologicsBIOSYNTHETIC PRODUCTS- Increased bioburden of infected wounds to stimulate market growth
- 7.1 INTRODUCTION
-
7.2 NON-ANTIMICROBIAL DRESSINGSCOST-EFFECTIVENESS COMPARED TO ANTIMICROBIAL DRESSINGS TO BOOST MARKET
-
7.3 ANTIMICROBIAL DRESSINGSEFFECTIVENESS IN PREVENTING AND MANAGING INFECTIONS TO DRIVE GROWTH
- 8.1 INTRODUCTION
-
8.2 CHRONIC WOUNDSDIABETIC FOOT ULCERS- Increasing prevalence of diabetes to drive growthPRESSURE ULCERS- Growing geriatric population to drive demand for bioactive dressingsVENOUS LEG ULCERS- Rising prevalence of obesity to boost adoptionOTHER CHRONIC WOUNDS
-
8.3 ACUTE WOUNDSSURGICAL WOUNDS- Rising volume of surgical procedures to support market growthTRAUMATIC WOUNDS- Increasing number of road accidents to drive growthBURNS- High incidence of burn injuries to propel market growth
- 9.1 INTRODUCTION
-
9.2 HOSPITALS & CLINICSINPATIENT SETTINGS- Increasing hospital admissions due to HAIs to drive growthOUTPATIENT SETTINGS- Rising costs of inpatient facilities to drive demand for outpatient care settings
-
9.3 HOME CARE SETTINGSLOW COSTS AND CONVENIENCE TO DRIVE GROWTH
-
9.4 LONG-TERM CARE FACILITIESGROWTH IN GERIATRIC & VULNERABLE POPULATIONS TO BOOST DEMAND FOR BETTER LONG-TERM CARE
- 9.5 OTHER END USERS
- 10.1 INTRODUCTIONS
-
10.2 NORTH AMERICAUS- Rising prevalence of chronic diseases to drive marketCANADA- Growing awareness about diabetes and its associated complications to fuel market
-
10.3 EUROPEGERMANY- Rising focus on medical technology clusters to boost marketUK- Increasing prevalence of surgeries to aid growthFRANCE- Surge in elderly population to propel marketITALY- Improved life expectancy to support growthSPAIN- Increasing median age to augment growthREST OF EUROPE
-
10.4 ASIA PACIFICCHINA- Growing incidence of diabetic foot ulceration to drive marketJAPAN- Expanding hospital infrastructure to fuel marketINDIA- Booming medical tourism in India to boost marketREST OF ASIA PACIFIC
-
10.5 LATIN AMERICABRAZIL- Presence of large patient population to stimulate growthMEXICO- Growing awareness about effective wound care approaches to support growthREST OF LATIN AMERICA
-
10.6 MIDDLE EAST & AFRICAGROWING DEMAND FOR HEALTHCARE FACILITIES TO AID MARKET GROWTH
-
10.7 GCC COUNTRIESFAVORABLE HEALTHCARE INFRASTRUCTURE AND INITIATIVES TO BOOST MARKET
- 11.1 OVERVIEW
-
11.2 KEY PLAYER STRATEGY/RIGHT TO WINOVERVIEW OF STRATEGIES ADOPTED BY KEY PLAYERS IN BIOACTIVE DRESSINGS MARKET
- 11.3 REVENUE ANALYSIS
-
11.4 MARKET SHARE ANALYSISRANKING OF KEY MARKET PLAYERS
-
11.5 COMPANY EVALUATION MATRIX: KEY PLAYERS, 2023STARSEMERGING LEADERSPERVASIVE PLAYERSPARTICIPANTSCOMPANY FOOTPRINT: KEY PLAYERS, 2023- Company footprint- Product footprint- Property footprint- Application footprint- Region footprint
-
11.6 COMPANY EVALUATION MATRIX: STARTUPS/SMES, 2023PROGRESSIVE COMPANIESRESPONSIVE COMPANIESDYNAMIC COMPANIESSTARTING BLOCKSCOMPETITIVE BENCHMARKING: STARTUPS/SMES, 2023
-
11.7 COMPANY VALUATION & FINANCIAL METRICSFINANCIAL METRICSCOMPANY VALUATION
- 11.8 BRAND/PRODUCT COMPARISON
-
11.9 COMPETITIVE SCENARIOPRODUCT LAUNCHES AND APPROVALSDEALSEXPANSIONSOTHER DEVELOPMENTS
-
12.1 KEY PLAYERSSMITH+NEPHEW- Business overview- Products offered- Recent developments- MnM viewORGANOGENESIS INC.- Business overview- Products offered- Recent developments- MnM viewMIMEDX GROUP, INC.- Business overview- Products offered- Recent developments- MnM view3M- Business overview- Products offered- Recent developments- MnM viewCARDINAL HEALTH- Business overview- Products offered- MnM viewB. BRAUN SE- Business overview- Products offeredMÖLNLYCKE AB- Business overview- Products offeredCONVATEC INC.- Business overview- Products offered- Recent developmentsPAUL HARTMANN AG- Business overview- Products offeredCOLOPLAST CORP.- Business overview- Products offered- Recent developmentsINTEGRA LIFESCIENCES CORPORATION- Business overview- Products offered- Recent developmentsESSITY AKTIEBOLAG- Business overview- Products offered- Recent developmentsCOVALON TECHNOLOGIES LTD.- Business overview- Products offered- Recent developmentsSANARA MEDTECH- Business overview- Products offered- Recent developments
-
12.2 OTHER PLAYERSMEDLINE INDUSTRIES, INC.HOLLISTER INCORPORATEDL&R GROUPDERMARITE INDUSTRIES, LLCBIOTISSUELIFENET HEALTHADVANCIS MEDICALHUMAN BIOSCIENCESAMERX HEALTH CAREGENTELLAXIO BIOSOLUTIONS PVT. LTD.
- 13.1 DISCUSSION GUIDE
- 13.2 KNOWLEDGESTORE: MARKETSANDMARKETS’ SUBSCRIPTION PORTAL
- 13.3 CUSTOMIZATION OPTIONS
- 13.4 RELATED REPORTS
- 13.5 AUTHOR DETAILS
- TABLE 1 RISK ASSESSMENT ANALYSIS
- TABLE 2 AVERAGE COST OF TREATMENT FOR DIABETIC FOOT ULCERS
- TABLE 3 BIOACTIVE DRESSINGS MARKET: RECENT PRODUCT LAUNCHES
- TABLE 4 BIOACTIVE DRESSINGS MARKET: RECENT COLLABORATIONS OF NOTE
- TABLE 5 AVERAGE SELLING PRICE TREND OF BIOACTIVE DRESSINGS, BY PRODUCT, 2021–2023
- TABLE 6 AVERAGE SELLING PRICE OF BIOACTIVE DRESSINGS, BY REGION (2023)
- TABLE 7 BIOACTIVE DRESSINGS MARKET: PORTER’S FIVE FORCES ANALYSIS
- TABLE 8 INFLUENCE OF STAKEHOLDERS ON BUYING PROCESS OF BIOACTIVE DRESSINGS FOR END USERS (%)
- TABLE 9 KEY BUYING CRITERIA OF BIOACTIVE DRESSINGS FOR END USERS
- TABLE 10 NORTH AMERICA: LIST OF REGULATORY BODIES, GOVERNMENT AGENCIES, AND OTHER ORGANIZATIONS
- TABLE 11 ASIA PACIFIC: LIST OF REGULATORY BODIES, GOVERNMENT AGENCIES, AND OTHER ORGANIZATIONS
- TABLE 12 LATIN AMERICA: LIST OF REGULATORY BODIES, GOVERNMENT AGENCIES, AND OTHER ORGANIZATIONS
- TABLE 13 REST OF THE WORLD: LIST OF REGULATORY BODIES, GOVERNMENT AGENCIES, AND OTHER ORGANIZATIONS
- TABLE 14 IMPORT DATA FOR WADDING, GAUZE, AND BANDAGES, BY COUNTRY, 2019–2023 (USD MILLION)
- TABLE 15 EXPORT DATA FOR WADDING, GAUZE, AND BANDAGES, BY COUNTRY, 2019–2023 (USD MILLION)
- TABLE 16 BIOACTIVE DRESSINGS MARKET: DETAILED LIST OF CONFERENCES & EVENTS
- TABLE 17 BIOACTIVE DRESSINGS MARKET, BY PRODUCT, 2022–2029 (USD MILLION)
- TABLE 18 BIOACTIVE DRESSINGS MARKET, BY TYPE, 2022–2029 (USD MILLION)
- TABLE 19 BIOACTIVE DRESSINGS MARKET, BY REGION, 2022–2029 (USD MILLION)
- TABLE 20 NORTH AMERICA: BIOACTIVE DRESSINGS MARKET, BY COUNTRY, 2022–2029 (USD MILLION)
- TABLE 21 EUROPE: BIOACTIVE DRESSINGS MARKET, BY COUNTRY, 2022–2029 (USD MILLION)
- TABLE 22 ASIA PACIFIC: BIOACTIVE DRESSINGS MARKET, BY COUNTRY, 2022–2029 (USD MILLION)
- TABLE 23 LATIN AMERICA: BIOACTIVE DRESSINGS MARKET, BY COUNTRY, 2022–2029 (USD MILLION)
- TABLE 24 KEY PRODUCTS IN COLLAGEN DRESSINGS SEGMENT
- TABLE 25 COLLAGEN DRESSINGS MARKET, BY REGION, 2022–2029 (USD MILLION)
- TABLE 26 NORTH AMERICA: COLLAGEN DRESSINGS MARKET, BY COUNTRY, 2022–2029 (USD MILLION)
- TABLE 27 EUROPE: COLLAGEN DRESSINGS MARKET, BY COUNTRY, 2022–2029 (USD MILLION)
- TABLE 28 ASIA PACIFIC: COLLAGEN DRESSINGS MARKET, BY COUNTRY, 2022–2029 (USD MILLION)
- TABLE 29 LATIN AMERICA: COLLAGEN DRESSINGS MARKET, BY COUNTRY, 2022–2029 (USD MILLION)
- TABLE 30 KEY PRODUCTS IN ALGINATE DRESSINGS SEGMENT
- TABLE 31 ALGINATE DRESSINGS MARKET, BY REGION, 2022–2029 (USD MILLION)
- TABLE 32 NORTH AMERICA: ALGINATE DRESSINGS MARKET, BY COUNTRY, 2022–2029 (USD MILLION)
- TABLE 33 EUROPE: ALGINATE DRESSINGS MARKET, BY COUNTRY, 2022–2029 (USD MILLION)
- TABLE 34 ASIA PACIFIC: ALGINATE DRESSINGS MARKET, BY COUNTRY, 2022–2029 (USD MILLION)
- TABLE 35 LATIN AMERICA: ALGINATE DRESSINGS MARKET, BY COUNTRY, 2022–2029 (USD MILLION)
- TABLE 36 KEY PRODUCTS IN CHITOSAN DRESSINGS SEGMENT
- TABLE 37 CHITOSAN DRESSINGS MARKET, BY REGION, 2022–2029 (USD MILLION)
- TABLE 38 NORTH AMERICA: CHITOSAN DRESSINGS MARKET, BY COUNTRY, 2022–2029 (USD MILLION)
- TABLE 39 EUROPE: CHITOSAN DRESSINGS MARKET, BY COUNTRY, 2022–2029 (USD MILLION)
- TABLE 40 ASIA PACIFIC: CHITOSAN DRESSINGS MARKET, BY COUNTRY, 2022–2029 (USD MILLION)
- TABLE 41 LATIN AMERICA: CHITOSAN DRESSINGS MARKET, BY COUNTRY, 2022–2029 (USD MILLION)
- TABLE 42 KEY PRODUCTS IN HONEY DRESSINGS SEGMENT
- TABLE 43 HONEY DRESSINGS MARKET, BY REGION, 2022–2029 (USD MILLION)
- TABLE 44 NORTH AMERICA: HONEY DRESSINGS MARKET, BY COUNTRY, 2022–2029 (USD MILLION)
- TABLE 45 EUROPE: HONEY DRESSINGS MARKET, BY COUNTRY, 2022–2029 (USD MILLION)
- TABLE 46 ASIA PACIFIC: HONEY DRESSINGS MARKET, BY COUNTRY, 2022–2029 (USD MILLION)
- TABLE 47 LATIN AMERICA: HONEY DRESSINGS MARKET, BY COUNTRY, 2022–2029 (USD MILLION)
- TABLE 48 OTHER BIOACTIVE DRESSINGS MARKET, BY REGION, 2022–2029 (USD MILLION)
- TABLE 49 NORTH AMERICA: OTHER BIOACTIVE DRESSINGS MARKET, BY COUNTRY, 2022–2029 (USD MILLION)
- TABLE 50 EUROPE: OTHER BIOACTIVE DRESSINGS MARKET, BY COUNTRY, 2022–2029 (USD MILLION)
- TABLE 51 ASIA PACIFIC: OTHER BIOACTIVE DRESSINGS MARKET, BY COUNTRY, 2022–2029 (USD MILLION)
- TABLE 52 LATIN AMERICA: OTHER BIOACTIVE DRESSINGS MARKET, BY COUNTRY, 2022–2029 (USD MILLION)
- TABLE 53 KEY PRODUCTS IN SKIN SUBSTITUTES SEGMENT
- TABLE 54 SKIN SUBSTITUTES MARKET, BY TYPE, 2022–2029 (USD MILLION)
- TABLE 55 SKIN SUBSTITUTES MARKET, BY REGION, 2022–2029 (USD MILLION)
- TABLE 56 NORTH AMERICA: SKIN SUBSTITUTES MARKET, BY COUNTRY, 2022–2029 (USD MILLION)
- TABLE 57 EUROPE: SKIN SUBSTITUTES MARKET, BY COUNTRY, 2022–2029 (USD MILLION)
- TABLE 58 ASIA PACIFIC: SKIN SUBSTITUTES MARKET, BY COUNTRY, 2022–2029 (USD MILLION)
- TABLE 59 LATIN AMERICA: SKIN SUBSTITUTES MARKET, BY COUNTRY, 2022–2029 (USD MILLION)
- TABLE 60 KEY PRODUCTS IN HUMAN DONOR TISSUE-DERIVED PRODUCTS SEGMENT
- TABLE 61 HUMAN DONOR TISSUE-DERIVED PRODUCTS MARKET, BY REGION, 2022–2029 (USD MILLION)
- TABLE 62 NORTH AMERICA: HUMAN DONOR TISSUE-DERIVED PRODUCTS MARKET, BY COUNTRY, 2022–2029 (USD MILLION)
- TABLE 63 EUROPE: HUMAN DONOR TISSUE-DERIVED PRODUCTS MARKET, BY COUNTRY, 2022–2029 (USD MILLION)
- TABLE 64 ASIA PACIFIC: HUMAN DONOR TISSUE-DERIVED PRODUCTS MARKET, BY COUNTRY, 2022–2029 (USD MILLION)
- TABLE 65 LATIN AMERICA: HUMAN DONOR TISSUE-DERIVED PRODUCTS MARKET, BY COUNTRY, 2022–2029 (USD MILLION)
- TABLE 66 KEY PRODUCTS IN ACELLULAR ANIMAL-DERIVED PRODUCTS SEGMENT
- TABLE 67 ACELLULAR ANIMAL-DERIVED PRODUCTS MARKET, BY REGION, 2022–2029 (USD MILLION)
- TABLE 68 NORTH AMERICA: ACELLULAR ANIMAL-DERIVED PRODUCTS MARKET, BY COUNTRY, 2022–2029 (USD MILLION)
- TABLE 69 EUROPE: ACELLULAR ANIMAL-DERIVED PRODUCTS MARKET, BY COUNTRY, 2022–2029 (USD MILLION)
- TABLE 70 ASIA PACIFIC: ACELLULAR ANIMAL-DERIVED PRODUCTS MARKET, BY COUNTRY, 2022–2029 (USD MILLION)
- TABLE 71 LATIN AMERICA: ACELLULAR ANIMAL-DERIVED PRODUCTS MARKET, BY COUNTRY, 2022–2029 (USD MILLION)
- TABLE 72 BIOSYNTHETIC PRODUCTS MARKET, BY REGION, 2022–2029 (USD MILLION)
- TABLE 73 NORTH AMERICA: BIOSYNTHETIC PRODUCTS MARKET, BY COUNTRY, 2022–2029 (USD MILLION)
- TABLE 74 EUROPE: BIOSYNTHETIC PRODUCTS MARKET, BY COUNTRY, 2022–2029 (USD MILLION)
- TABLE 75 ASIA PACIFIC: BIOSYNTHETIC PRODUCTS MARKET, BY COUNTRY, 2022–2029 (USD MILLION)
- TABLE 76 LATIN AMERICA: BIOSYNTHETIC PRODUCTS MARKET, BY COUNTRY, 2022–2029 (USD MILLION)
- TABLE 77 BIOACTIVE DRESSINGS MARKET, BY PROPERTY TYPE, 2022–2029 (USD MILLION)
- TABLE 78 KEY PRODUCTS IN NON-ANTIMICROBIAL BIOACTIVE DRESSINGS MARKET
- TABLE 79 NON-ANTIMICROBIAL BIOACTIVE DRESSINGS MARKET, BY REGION, 2022–2029 (USD MILLION)
- TABLE 80 NORTH AMERICA: NON-ANTIMICROBIAL BIOACTIVE DRESSINGS MARKET, BY COUNTRY, 2022–2029 (USD MILLION)
- TABLE 81 EUROPE: NON-ANTIMICROBIAL BIOACTIVE DRESSINGS MARKET, BY COUNTRY, 2022–2029 (USD MILLION)
- TABLE 82 ASIA PACIFIC: NON-ANTIMICROBIAL BIOACTIVE DRESSINGS MARKET, BY COUNTRY, 2022–2029 (USD MILLION)
- TABLE 83 LATIN AMERICA: NON-ANTIMICROBIAL BIOACTIVE DRESSINGS MARKET, BY COUNTRY, 2022–2029 (USD MILLION)
- TABLE 84 KEY PRODUCTS IN ANTIMICROBIAL BIOACTIVE DRESSINGS MARKET
- TABLE 85 ANTIMICROBIAL BIOACTIVE DRESSINGS MARKET, BY REGION, 2022–2029 (USD MILLION)
- TABLE 86 NORTH AMERICA: ANTIMICROBIAL BIOACTIVE DRESSINGS MARKET, BY COUNTRY, 2022–2029 (USD MILLION)
- TABLE 87 EUROPE: ANTIMICROBIAL BIOACTIVE DRESSINGS MARKET, BY COUNTRY, 2022–2029 (USD MILLION)
- TABLE 88 ASIA PACIFIC: ANTIMICROBIAL BIOACTIVE DRESSINGS MARKET, BY COUNTRY, 2022–2029 (USD MILLION)
- TABLE 89 LATIN AMERICA: ANTIMICROBIAL BIOACTIVE DRESSINGS MARKET, BY COUNTRY, 2022–2029 (USD MILLION)
- TABLE 90 BIOACTIVE DRESSINGS MARKET, BY APPLICATION, 2022–2029 (USD MILLION)
- TABLE 91 BIOACTIVE DRESSINGS MARKET FOR CHRONIC WOUNDS, BY TYPE, 2022–2029 (USD MILLION)
- TABLE 92 BIOACTIVE DRESSINGS MARKET FOR CHRONIC WOUNDS, BY REGION, 2022–2029 (USD MILLION)
- TABLE 93 NORTH AMERICA: BIOACTIVE DRESSINGS MARKET FOR CHRONIC WOUNDS, BY COUNTRY, 2022–2029 (USD MILLION)
- TABLE 94 EUROPE: BIOACTIVE DRESSINGS MARKET FOR CHRONIC WOUNDS, BY COUNTRY, 2022–2029 (USD MILLION)
- TABLE 95 ASIA PACIFIC: BIOACTIVE DRESSINGS MARKET FOR CHRONIC WOUNDS, BY COUNTRY, 2022–2029 (USD MILLION)
- TABLE 96 LATIN AMERICA: BIOACTIVE DRESSINGS MARKET FOR CHRONIC WOUNDS, BY COUNTRY, 2022–2029 (USD MILLION)
- TABLE 97 TOTAL DIABETES-RELATED HEALTHCARE EXPENDITURE IN 2021
- TABLE 98 NUMBER OF PATIENTS DEVELOPING NEW CASES OF DIABETIC FOOT ULCERS, 2022–2029 (THOUSAND)
- TABLE 99 BIOACTIVE DRESSINGS MARKET FOR DIABETIC FOOT ULCERS, BY REGION, 2022–2029 (USD MILLION)
- TABLE 100 NORTH AMERICA: BIOACTIVE DRESSINGS MARKET FOR DIABETIC FOOT ULCERS, BY COUNTRY, 2022–2029 (USD MILLION)
- TABLE 101 EUROPE: BIOACTIVE DRESSINGS MARKET FOR DIABETIC FOOT ULCERS, BY COUNTRY, 2022–2029 (USD MILLION)
- TABLE 102 ASIA PACIFIC: BIOACTIVE DRESSINGS MARKET FOR DIABETIC FOOT ULCERS, BY COUNTRY, 2022–2029 (USD MILLION)
- TABLE 103 LATIN AMERICA: BIOACTIVE DRESSINGS MARKET FOR DIABETIC FOOT ULCERS, BY COUNTRY, 2022–2029 (USD MILLION)
- TABLE 104 BIOACTIVE DRESSINGS MARKET FOR PRESSURE ULCERS, BY REGION, 2022–2029 (USD MILLION)
- TABLE 105 NORTH AMERICA: BIOACTIVE DRESSINGS MARKET FOR PRESSURE ULCERS, BY COUNTRY, 2022–2029 (USD MILLION)
- TABLE 106 EUROPE: BIOACTIVE DRESSINGS MARKET FOR PRESSURE ULCERS, BY COUNTRY, 2022–2029 (USD MILLION)
- TABLE 107 ASIA PACIFIC: BIOACTIVE DRESSINGS MARKET FOR PRESSURE ULCERS, BY COUNTRY, 2022–2029 (USD MILLION)
- TABLE 108 LATIN AMERICA: BIOACTIVE DRESSINGS MARKET FOR PRESSURE ULCERS, BY COUNTRY, 2022–2029 (USD MILLION)
- TABLE 109 BIOACTIVE DRESSINGS MARKET FOR VENOUS LEG ULCERS, BY REGION, 2022–2029 (USD MILLION)
- TABLE 110 NORTH AMERICA: BIOACTIVE DRESSINGS MARKET FOR VENOUS LEG ULCERS, BY COUNTRY, 2022–2029 (USD MILLION)
- TABLE 111 EUROPE: BIOACTIVE DRESSINGS MARKET FOR VENOUS LEG ULCERS, BY COUNTRY, 2022–2029 (USD MILLION)
- TABLE 112 ASIA PACIFIC: BIOACTIVE DRESSINGS MARKET FOR VENOUS LEG ULCERS, BY COUNTRY, 2022–2029 (USD MILLION)
- TABLE 113 LATIN AMERICA: BIOACTIVE DRESSINGS MARKET FOR VENOUS LEG ULCERS, BY COUNTRY, 2022–2029 (USD MILLION)
- TABLE 114 BIOACTIVE DRESSINGS MARKET FOR OTHER CHRONIC WOUNDS, BY REGION, 2022–2029 (USD MILLION)
- TABLE 115 NORTH AMERICA: BIOACTIVE DRESSINGS MARKET FOR OTHER CHRONIC WOUNDS, BY COUNTRY, 2022–2029 (USD MILLION)
- TABLE 116 EUROPE: BIOACTIVE DRESSINGS MARKET FOR OTHER CHRONIC WOUNDS, BY COUNTRY, 2022–2029 (USD MILLION)
- TABLE 117 ASIA PACIFIC: BIOACTIVE DRESSINGS MARKET FOR OTHER CHRONIC WOUNDS, BY COUNTRY, 2022–2029 (USD MILLION)
- TABLE 118 LATIN AMERICA: BIOACTIVE DRESSINGS MARKET FOR OTHER CHRONIC WOUNDS, BY COUNTRY, 2022–2029 (USD MILLION)
- TABLE 119 BIOACTIVE DRESSINGS MARKET FOR ACUTE WOUNDS, BY TYPE, 2022–2029 (USD MILLION)
- TABLE 120 BIOACTIVE DRESSINGS MARKET FOR ACUTE WOUNDS, BY REGION, 2022–2029 (USD MILLION)
- TABLE 121 NORTH AMERICA: BIOACTIVE DRESSINGS MARKET FOR ACUTE WOUNDS, BY COUNTRY, 2022–2029 (USD MILLION)
- TABLE 122 EUROPE: BIOACTIVE DRESSINGS MARKET FOR ACUTE WOUNDS, BY COUNTRY, 2022–2029 (USD MILLION)
- TABLE 123 ASIA PACIFIC: BIOACTIVE DRESSINGS MARKET FOR ACUTE WOUNDS, BY COUNTRY, 2022–2029 (USD MILLION)
- TABLE 124 LATIN AMERICA: BIOACTIVE DRESSINGS MARKET FOR ACUTE WOUNDS, BY COUNTRY, 2022–2029 (USD MILLION)
- TABLE 125 BIOACTIVE DRESSINGS MARKET FOR SURGICAL WOUNDS, BY REGION, 2022–2029 (USD MILLION)
- TABLE 126 NORTH AMERICA: BIOACTIVE DRESSINGS MARKET FOR SURGICAL WOUNDS, BY COUNTRY, 2022–2029 (USD MILLION)
- TABLE 127 EUROPE: BIOACTIVE DRESSINGS MARKET FOR SURGICAL WOUNDS, BY COUNTRY, 2022–2029 (USD MILLION)
- TABLE 128 ASIA PACIFIC: BIOACTIVE DRESSINGS MARKET FOR SURGICAL WOUNDS, BY COUNTRY, 2022–2029 (USD MILLION)
- TABLE 129 LATIN AMERICA: BIOACTIVE DRESSINGS MARKET FOR SURGICAL WOUNDS, BY COUNTRY, 2022–2029 (USD MILLION)
- TABLE 130 BIOACTIVE DRESSINGS MARKET FOR TRAUMATIC WOUNDS, BY REGION, 2022–2029 (USD MILLION)
- TABLE 131 NORTH AMERICA: BIOACTIVE DRESSINGS MARKET FOR TRAUMATIC WOUNDS, BY COUNTRY, 2022–2029 (USD MILLION)
- TABLE 132 EUROPE: BIOACTIVE DRESSINGS MARKET FOR TRAUMATIC WOUNDS, BY COUNTRY, 2022–2029 (USD MILLION)
- TABLE 133 ASIA PACIFIC: BIOACTIVE DRESSINGS MARKET FOR TRAUMATIC WOUNDS, BY COUNTRY, 2022–2029 (USD MILLION)
- TABLE 134 LATIN AMERICA: BIOACTIVE DRESSINGS MARKET FOR TRAUMATIC WOUNDS, BY COUNTRY, 2022–2029 (USD MILLION)
- TABLE 135 BIOACTIVE DRESSINGS MARKET FOR BURNS, BY REGION, 2022–2029 (USD MILLION)
- TABLE 136 NORTH AMERICA: BIOACTIVE DRESSINGS MARKET FOR BURNS, BY COUNTRY, 2022–2029 (USD MILLION)
- TABLE 137 EUROPE: BIOACTIVE DRESSINGS MARKET FOR BURNS, BY COUNTRY, 2022–2029 (USD MILLION)
- TABLE 138 ASIA PACIFIC: BIOACTIVE DRESSINGS MARKET FOR BURNS, BY COUNTRY, 2022–2029 (USD MILLION)
- TABLE 139 LATIN AMERICA: BIOACTIVE DRESSINGS MARKET FOR BURNS, BY COUNTRY, 2022–2029 (USD MILLION)
- TABLE 140 BIOACTIVE DRESSINGS MARKET, BY END USER, 2022–2029 (USD MILLION)
- TABLE 141 TOTAL NUMBER OF HOSPITALS, BY COUNTRY, 2022
- TABLE 142 BIOACTIVE DRESSINGS MARKET FOR HOSPITALS & CLINICS, BY TYPE, 2022–2029 (USD MILLION)
- TABLE 143 BIOACTIVE DRESSINGS MARKET FOR HOSPITALS & CLINICS, BY REGION, 2022–2029 (USD MILLION)
- TABLE 144 NORTH AMERICA: BIOACTIVE DRESSINGS MARKET FOR HOSPITALS & CLINICS, BY COUNTRY, 2022–2029 (USD MILLION)
- TABLE 145 EUROPE: BIOACTIVE DRESSINGS MARKET FOR HOSPITALS & CLINICS, BY COUNTRY, 2022–2029 (USD MILLION)
- TABLE 146 ASIA PACIFIC: BIOACTIVE DRESSINGS MARKET FOR HOSPITALS & CLINICS, BY COUNTRY, 2022–2029 (USD MILLION)
- TABLE 147 LATIN AMERICA: BIOACTIVE DRESSINGS MARKET FOR HOSPITALS & CLINICS, BY COUNTRY, 2022–2029 (USD MILLION)
- TABLE 148 BIOACTIVE DRESSINGS MARKET FOR INPATIENT SETTINGS, BY REGION, 2022–2029 (USD MILLION)
- TABLE 149 NORTH AMERICA: BIOACTIVE DRESSINGS MARKET FOR INPATIENT SETTINGS, BY COUNTRY, 2022–2029 (USD MILLION)
- TABLE 150 EUROPE: BIOACTIVE DRESSINGS MARKET FOR INPATIENT SETTINGS, BY COUNTRY, 2022–2029 (USD MILLION)
- TABLE 151 ASIA PACIFIC: BIOACTIVE DRESSINGS MARKET FOR INPATIENT SETTINGS, BY COUNTRY, 2022–2029 (USD MILLION)
- TABLE 152 LATIN AMERICA: BIOACTIVE DRESSINGS MARKET FOR INPATIENT SETTINGS, BY COUNTRY, 2022–2029 (USD MILLION)
- TABLE 153 BIOACTIVE DRESSINGS MARKET FOR OUTPATIENT SETTINGS, BY REGION, 2022–2029 (USD MILLION)
- TABLE 154 NORTH AMERICA: BIOACTIVE DRESSINGS MARKET FOR OUTPATIENT SETTINGS, BY COUNTRY, 2022–2029 (USD MILLION)
- TABLE 155 EUROPE: BIOACTIVE DRESSINGS MARKET FOR OUTPATIENT SETTINGS, BY COUNTRY, 2022–2029 (USD MILLION)
- TABLE 156 ASIA PACIFIC: BIOACTIVE DRESSINGS MARKET FOR OUTPATIENT SETTINGS, BY COUNTRY, 2022–2029 (USD MILLION)
- TABLE 157 LATIN AMERICA: BIOACTIVE DRESSINGS MARKET FOR OUTPATIENT SETTINGS, BY COUNTRY, 2022–2029 (USD MILLION)
- TABLE 158 BIOACTIVE DRESSINGS MARKET FOR HOME CARE SETTINGS, BY REGION, 2022–2029 (USD MILLION)
- TABLE 159 NORTH AMERICA: BIOACTIVE DRESSINGS MARKET FOR HOME CARE SETTINGS, BY COUNTRY, 2022–2029 (USD MILLION)
- TABLE 160 EUROPE: BIOACTIVE DRESSINGS MARKET FOR HOME CARE SETTINGS, BY COUNTRY, 2022–2029 (USD MILLION)
- TABLE 161 ASIA PACIFIC: BIOACTIVE DRESSINGS MARKET FOR HOME CARE SETTINGS, BY COUNTRY, 2022–2029 (USD MILLION)
- TABLE 162 LATIN AMERICA: BIOACTIVE DRESSINGS MARKET FOR HOME CARE SETTINGS, BY COUNTRY, 2022–2029 (USD MILLION)
- TABLE 163 BIOACTIVE DRESSINGS MARKET FOR LONG-TERM CARE FACILITIES, BY REGION, 2022–2029 (USD MILLION)
- TABLE 164 NORTH AMERICA: BIOACTIVE DRESSINGS MARKET FOR LONG-TERM CARE FACILITIES, BY COUNTRY, 2022–2029 (USD MILLION)
- TABLE 165 EUROPE: BIOACTIVE DRESSINGS MARKET FOR LONG-TERM CARE FACILITIES, BY COUNTRY, 2022–2029 (USD MILLION)
- TABLE 166 ASIA PACIFIC: BIOACTIVE DRESSINGS MARKET FOR LONG-TERM CARE FACILITIES, BY COUNTRY, 2022–2029 (USD MILLION)
- TABLE 167 LATIN AMERICA: BIOACTIVE DRESSINGS MARKET FOR LONG-TERM CARE FACILITIES, BY COUNTRY, 2022–2029 (USD MILLION)
- TABLE 168 BIOACTIVE DRESSINGS MARKET FOR OTHER END USERS, BY REGION, 2022–2029 (USD MILLION)
- TABLE 169 NORTH AMERICA: BIOACTIVE DRESSINGS MARKET FOR OTHER END USERS, BY COUNTRY, 2022–2029 (USD MILLION)
- TABLE 170 EUROPE: BIOACTIVE DRESSINGS MARKET FOR OTHER END USERS, BY COUNTRY, 2022–2029 (USD MILLION)
- TABLE 171 ASIA PACIFIC: BIOACTIVE DRESSINGS MARKET FOR OTHER END USERS, BY COUNTRY, 2022–2029 (USD MILLION)
- TABLE 172 LATIN AMERICA: BIOACTIVE DRESSINGS MARKET FOR OTHER END USERS, BY COUNTRY, 2022–2029 (USD MILLION)
- TABLE 173 BIOACTIVE DRESSINGS MARKET, BY REGION, 2022–2029 (USD MILLION)
- TABLE 174 NORTH AMERICA: BIOACTIVE DRESSINGS MARKET, BY COUNTRY, 2022–2029 (USD MILLION)
- TABLE 175 NORTH AMERICA: BIOACTIVE DRESSINGS MARKET, BY PRODUCT, 2022–2029 (USD MILLION)
- TABLE 176 NORTH AMERICA: BIOACTIVE DRESSINGS MARKET, BY TYPE, 2022–2029 (USD MILLION)
- TABLE 177 NORTH AMERICA: SKIN SUBSTITUTES MARKET, BY TYPE, 2022–2029 (USD MILLION)
- TABLE 178 NORTH AMERICA: BIOACTIVE DRESSINGS MARKET, BY PROPERTY TYPE, 2022–2029 (USD MILLION)
- TABLE 179 NORTH AMERICA: BIOACTIVE DRESSINGS MARKET, BY APPLICATION, 2022–2029 (USD MILLION)
- TABLE 180 NORTH AMERICA: BIOACTIVE DRESSINGS MARKET FOR CHRONIC WOUNDS, BY TYPE, 2022–2029 (USD MILLION)
- TABLE 181 NORTH AMERICA: BIOACTIVE DRESSINGS MARKET FOR ACUTE WOUNDS, BY TYPE, 2022–2029 (USD MILLION)
- TABLE 182 NORTH AMERICA: BIOACTIVE DRESSINGS MARKET, BY END USER, 2022–2029 (USD MILLION)
- TABLE 183 NORTH AMERICA: BIOACTIVE DRESSINGS MARKET FOR HOSPITALS & CLINICS, BY TYPE, 2022–2029 (USD MILLION)
- TABLE 184 US: BIOACTIVE DRESSINGS MARKET, BY PRODUCT, 2022–2029 (USD MILLION)
- TABLE 185 US: BIOACTIVE DRESSINGS MARKET, BY TYPE, 2022–2029 (USD MILLION)
- TABLE 186 US: SKIN SUBSTITUTES MARKET, BY TYPE, 2022–2029 (USD MILLION)
- TABLE 187 US: BIOACTIVE DRESSINGS MARKET, BY PROPERTY TYPE, 2022–2029 (USD MILLION)
- TABLE 188 US: BIOACTIVE DRESSINGS MARKET, BY APPLICATION, 2022–2029 (USD MILLION)
- TABLE 189 US: BIOACTIVE DRESSINGS MARKET FOR CHRONIC WOUNDS, BY TYPE, 2022–2029 (USD MILLION)
- TABLE 190 US: BIOACTIVE DRESSINGS MARKET FOR ACUTE WOUNDS, BY TYPE, 2022–2029 (USD MILLION)
- TABLE 191 US: BIOACTIVE DRESSINGS MARKET, BY END USER, 2022–2029 (USD MILLION)
- TABLE 192 US: BIOACTIVE DRESSINGS MARKET FOR HOSPITALS & CLINICS, BY TYPE, 2022–2029 (USD MILLION)
- TABLE 193 DIABETES INCIDENCE IN CANADA, 2023 VS. 2032
- TABLE 194 CANADA: BIOACTIVE DRESSINGS MARKET, BY PRODUCT, 2022–2029 (USD MILLION)
- TABLE 195 CANADA: BIOACTIVE DRESSINGS MARKET, BY TYPE, 2022–2029 (USD MILLION)
- TABLE 196 CANADA: SKIN SUBSTITUTES MARKET, BY TYPE, 2022–2029 (USD MILLION)
- TABLE 197 CANADA: BIOACTIVE DRESSINGS MARKET, BY PROPERTY TYPE, 2022–2029 (USD MILLION)
- TABLE 198 CANADA: BIOACTIVE DRESSINGS MARKET, BY APPLICATION, 2022–2029 (USD MILLION)
- TABLE 199 CANADA: BIOACTIVE DRESSINGS MARKET FOR CHRONIC WOUNDS, BY TYPE, 2022–2029 (USD MILLION)
- TABLE 200 CANADA: BIOACTIVE DRESSINGS MARKET FOR ACUTE WOUNDS, BY TYPE, 2022–2029 (USD MILLION)
- TABLE 201 CANADA: BIOACTIVE DRESSINGS MARKET, BY END USER, 2022–2029 (USD MILLION)
- TABLE 202 CANADA: BIOACTIVE DRESSINGS MARKET FOR HOSPITALS & CLINICS, BY TYPE, 2022–2029 (USD MILLION)
- TABLE 203 EUROPE: HEALTHCARE EXPENDITURE, BY COUNTRY (% OF GDP)
- TABLE 204 PREVALENCE OF DIABETES IN EUROPE, 2021 VS. 2045
- TABLE 205 EUROPE: BIOACTIVE DRESSINGS MARKET, BY COUNTRY, 2022–2029 (USD MILLION)
- TABLE 206 EUROPE: BIOACTIVE DRESSINGS MARKET, BY PRODUCT, 2022–2029 (USD MILLION)
- TABLE 207 EUROPE: BIOACTIVE DRESSINGS MARKET, BY TYPE, 2022–2029 (USD MILLION)
- TABLE 208 EUROPE: SKIN SUBSTITUTES MARKET, BY TYPE, 2022–2029 (USD MILLION)
- TABLE 209 EUROPE: BIOACTIVE DRESSINGS MARKET, BY PROPERTY TYPE, 2022–2029 (USD MILLION)
- TABLE 210 EUROPE: BIOACTIVE DRESSINGS MARKET, BY APPLICATION, 2022–2029 (USD MILLION)
- TABLE 211 EUROPE: BIOACTIVE DRESSINGS MARKET FOR CHRONIC WOUNDS, BY TYPE, 2022–2029 (USD MILLION)
- TABLE 212 EUROPE: BIOACTIVE DRESSINGS MARKET FOR ACUTE WOUNDS, BY TYPE, 2022–2029 (USD MILLION)
- TABLE 213 EUROPE: BIOACTIVE DRESSINGS MARKET, BY END USER, 2022–2029 (USD MILLION)
- TABLE 214 EUROPE: BIOACTIVE DRESSINGS MARKET FOR HOSPITALS & CLINICS, BY TYPE, 2022–2029 (USD MILLION)
- TABLE 215 GERMANY: BIOACTIVE DRESSINGS MARKET, BY PRODUCT, 2022–2029 (USD MILLION)
- TABLE 216 GERMANY: BIOACTIVE DRESSINGS MARKET, BY TYPE, 2022–2029 (USD MILLION)
- TABLE 217 GERMANY: SKIN SUBSTITUTES MARKET, BY TYPE, 2022–2029 (USD MILLION)
- TABLE 218 GERMANY: BIOACTIVE DRESSINGS MARKET, BY PROPERTY TYPE, 2022–2029 (USD MILLION)
- TABLE 219 GERMANY: BIOACTIVE DRESSINGS MARKET, BY APPLICATION, 2022–2029 (USD MILLION)
- TABLE 220 GERMANY: BIOACTIVE DRESSINGS MARKET FOR CHRONIC WOUNDS, BY TYPE, 2022–2029 (USD MILLION)
- TABLE 221 GERMANY: BIOACTIVE DRESSINGS MARKET FOR ACUTE WOUNDS, BY TYPE, 2022–2029 (USD MILLION)
- TABLE 222 GERMANY: BIOACTIVE DRESSINGS MARKET, BY END USER, 2022–2029 (USD MILLION)
- TABLE 223 GERMANY: BIOACTIVE DRESSINGS MARKET FOR HOSPITALS & CLINICS, BY TYPE, 2022–2029 (USD MILLION)
- TABLE 224 UK: BIOACTIVE DRESSINGS MARKET, BY PRODUCT, 2022–2029 (USD MILLION)
- TABLE 225 UK: BIOACTIVE DRESSINGS MARKET, BY TYPE, 2022–2029 (USD MILLION)
- TABLE 226 UK: SKIN SUBSTITUTES MARKET, BY TYPE, 2022–2029 (USD MILLION)
- TABLE 227 UK: BIOACTIVE DRESSINGS MARKET, BY PROPERTY TYPE, 2022–2029 (USD MILLION)
- TABLE 228 UK: BIOACTIVE DRESSINGS MARKET, BY APPLICATION, 2022–2029 (USD MILLION)
- TABLE 229 UK: BIOACTIVE DRESSINGS MARKET FOR CHRONIC WOUNDS, BY TYPE, 2022–2029 (USD MILLION)
- TABLE 230 UK: BIOACTIVE DRESSINGS MARKET FOR ACUTE WOUNDS, BY TYPE, 2022–2029 (USD MILLION)
- TABLE 231 UK: BIOACTIVE DRESSINGS MARKET, BY END USER, 2022–2029 (USD MILLION)
- TABLE 232 UK: BIOACTIVE DRESSINGS MARKET FOR HOSPITALS & CLINICS, BY TYPE, 2022–2029 (USD MILLION)
- TABLE 233 FRANCE: BIOACTIVE DRESSINGS MARKET, BY PRODUCT, 2022–2029 (USD MILLION)
- TABLE 234 FRANCE: BIOACTIVE DRESSINGS MARKET, BY TYPE, 2022–2029 (USD MILLION)
- TABLE 235 FRANCE: SKIN SUBSTITUTES MARKET, BY TYPE, 2022–2029 (USD MILLION)
- TABLE 236 FRANCE: BIOACTIVE DRESSINGS MARKET, BY PROPERTY TYPE, 2022–2029 (USD MILLION)
- TABLE 237 FRANCE: BIOACTIVE DRESSINGS MARKET, BY APPLICATION, 2022–2029 (USD MILLION)
- TABLE 238 FRANCE: BIOACTIVE DRESSINGS MARKET FOR CHRONIC WOUNDS, BY TYPE, 2022–2029 (USD MILLION)
- TABLE 239 FRANCE: BIOACTIVE DRESSINGS MARKET FOR ACUTE WOUNDS, BY TYPE, 2022–2029 (USD MILLION)
- TABLE 240 FRANCE: BIOACTIVE DRESSINGS MARKET, BY END USER, 2022–2029 (USD MILLION)
- TABLE 241 FRANCE: BIOACTIVE DRESSINGS MARKET FOR HOSPITALS & CLINICS, BY TYPE, 2022–2029 (USD MILLION)
- TABLE 242 ITALY: BIOACTIVE DRESSINGS MARKET, BY PRODUCT, 2022–2029 (USD MILLION)
- TABLE 243 ITALY: BIOACTIVE DRESSINGS MARKET, BY TYPE, 2022–2029 (USD MILLION)
- TABLE 244 ITALY: SKIN SUBSTITUTES MARKET, BY TYPE, 2022–2029 (USD MILLION)
- TABLE 245 ITALY: BIOACTIVE DRESSINGS MARKET, BY PROPERTY TYPE, 2022–2029 (USD MILLION)
- TABLE 246 ITALY: BIOACTIVE DRESSINGS MARKET, BY APPLICATION, 2022–2029 (USD MILLION)
- TABLE 247 ITALY: BIOACTIVE DRESSINGS MARKET FOR CHRONIC WOUNDS, BY TYPE, 2022–2029 (USD MILLION)
- TABLE 248 ITALY: BIOACTIVE DRESSINGS MARKET FOR ACUTE WOUNDS, BY TYPE, 2022–2029 (USD MILLION)
- TABLE 249 ITALY: BIOACTIVE DRESSINGS MARKET, BY END USER, 2022–2029 (USD MILLION)
- TABLE 250 ITALY: BIOACTIVE DRESSINGS MARKET FOR HOSPITALS & CLINICS, BY TYPE, 2022–2029 (USD MILLION)
- TABLE 251 SPAIN: BIOACTIVE DRESSINGS MARKET, BY PRODUCT, 2022–2029 (USD MILLION)
- TABLE 252 SPAIN: BIOACTIVE DRESSINGS MARKET, BY TYPE, 2022–2029 (USD MILLION)
- TABLE 253 SPAIN: SKIN SUBSTITUTES MARKET, BY TYPE, 2022–2029 (USD MILLION)
- TABLE 254 SPAIN: BIOACTIVE DRESSINGS MARKET, BY PROPERTY TYPE, 2022–2029 (USD MILLION)
- TABLE 255 SPAIN: BIOACTIVE DRESSINGS MARKET, BY APPLICATION, 2022–2029 (USD MILLION)
- TABLE 256 SPAIN: BIOACTIVE DRESSINGS MARKET FOR CHRONIC WOUNDS, BY TYPE, 2022–2029 (USD MILLION)
- TABLE 257 SPAIN: BIOACTIVE DRESSINGS MARKET FOR ACUTE WOUNDS, BY TYPE, 2022–2029 (USD MILLION)
- TABLE 258 SPAIN: BIOACTIVE DRESSINGS MARKET, BY END USER, 2022–2029 (USD MILLION)
- TABLE 259 SPAIN: BIOACTIVE DRESSINGS MARKET FOR HOSPITALS & CLINICS, BY TYPE, 2022–2029 (USD MILLION)
- TABLE 260 REST OF EUROPE: BIOACTIVE DRESSINGS MARKET, BY PRODUCT, 2022–2029 (USD MILLION)
- TABLE 261 REST OF EUROPE: BIOACTIVE DRESSINGS MARKET, BY TYPE, 2022–2029 (USD MILLION)
- TABLE 262 REST OF EUROPE: SKIN SUBSTITUTES MARKET, BY TYPE, 2022–2029 (USD MILLION)
- TABLE 263 REST OF EUROPE: BIOACTIVE DRESSINGS MARKET, BY PROPERTY TYPE, 2022–2029 (USD MILLION)
- TABLE 264 REST OF EUROPE: BIOACTIVE DRESSINGS MARKET, BY APPLICATION, 2022–2029 (USD MILLION)
- TABLE 265 REST OF EUROPE: BIOACTIVE DRESSINGS MARKET FOR CHRONIC WOUNDS, BY TYPE, 2022–2029 (USD MILLION)
- TABLE 266 REST OF EUROPE: BIOACTIVE DRESSINGS MARKET FOR ACUTE WOUNDS, BY TYPE, 2022–2029 (USD MILLION)
- TABLE 267 REST OF EUROPE: BIOACTIVE DRESSINGS MARKET, BY END USER, 2022–2029 (USD MILLION)
- TABLE 268 REST OF EUROPE: BIOACTIVE DRESSINGS MARKET FOR HOSPITALS & CLINICS, BY TYPE, 2022–2029 (USD MILLION)
- TABLE 269 ASIA PACIFIC: BIOACTIVE DRESSINGS MARKET, BY COUNTRY, 2022–2029 (USD MILLION)
- TABLE 270 ASIA PACIFIC: BIOACTIVE DRESSINGS MARKET, BY PRODUCT, 2022–2029 (USD MILLION)
- TABLE 271 ASIA PACIFIC: BIOACTIVE DRESSINGS MARKET, BY TYPE, 2022–2029 (USD MILLION)
- TABLE 272 ASIA PACIFIC: SKIN SUBSTITUTES MARKET, BY TYPE, 2022–2029 (USD MILLION)
- TABLE 273 ASIA PACIFIC: BIOACTIVE DRESSINGS MARKET, BY PROPERTY TYPE, 2022–2029 (USD MILLION)
- TABLE 274 ASIA PACIFIC: BIOACTIVE DRESSINGS MARKET, BY APPLICATION, 2022–2029 (USD MILLION)
- TABLE 275 ASIA PACIFIC: BIOACTIVE DRESSINGS MARKET FOR CHRONIC WOUNDS, BY TYPE, 2022–2029 (USD MILLION)
- TABLE 276 ASIA PACIFIC: BIOACTIVE DRESSINGS MARKET FOR ACUTE WOUNDS, BY TYPE, 2022–2029 (USD MILLION)
- TABLE 277 ASIA PACIFIC: BIOACTIVE DRESSINGS MARKET, BY END USER, 2022–2029 (USD MILLION)
- TABLE 278 ASIA PACIFIC: BIOACTIVE DRESSINGS MARKET FOR HOSPITALS & CLINICS, BY TYPE, 2022–2029 (USD MILLION)
- TABLE 279 CHINA: BIOACTIVE DRESSINGS MARKET, BY PRODUCT, 2022–2029 (USD MILLION)
- TABLE 280 CHINA: BIOACTIVE DRESSINGS MARKET, BY TYPE, 2022–2029 (USD MILLION)
- TABLE 281 CHINA: SKIN SUBSTITUTES MARKET, BY TYPE, 2022–2029 (USD MILLION)
- TABLE 282 CHINA: BIOACTIVE DRESSINGS MARKET, BY PROPERTY TYPE, 2022–2029 (USD MILLION)
- TABLE 283 CHINA: BIOACTIVE DRESSINGS MARKET, BY APPLICATION, 2022–2029 (USD MILLION)
- TABLE 284 CHINA: BIOACTIVE DRESSINGS MARKET FOR CHRONIC WOUNDS, BY TYPE, 2022–2029 (USD MILLION)
- TABLE 285 CHINA: BIOACTIVE DRESSINGS MARKET FOR ACUTE WOUNDS, BY TYPE, 2022–2029 (USD MILLION)
- TABLE 286 CHINA: BIOACTIVE DRESSINGS MARKET, BY END USER, 2022–2029 (USD MILLION)
- TABLE 287 CHINA: BIOACTIVE DRESSINGS MARKET FOR HOSPITALS & CLINICS, BY TYPE, 2022–2029 (USD MILLION)
- TABLE 288 JAPAN: BIOACTIVE DRESSINGS MARKET, BY PRODUCT, 2022–2029 (USD MILLION)
- TABLE 289 JAPAN: BIOACTIVE DRESSINGS MARKET, BY TYPE, 2022–2029 (USD MILLION)
- TABLE 290 JAPAN: SKIN SUBSTITUTES MARKET, BY TYPE, 2022–2029 (USD MILLION)
- TABLE 291 JAPAN: BIOACTIVE DRESSINGS MARKET, BY PROPERTY TYPE, 2022–2029 (USD MILLION)
- TABLE 292 JAPAN: BIOACTIVE DRESSINGS MARKET, BY APPLICATION, 2022–2029 (USD MILLION)
- TABLE 293 JAPAN: BIOACTIVE DRESSINGS MARKET FOR CHRONIC WOUNDS, BY TYPE, 2022–2029 (USD MILLION)
- TABLE 294 JAPAN: BIOACTIVE DRESSINGS MARKET FOR ACUTE WOUNDS, BY TYPE, 2022–2029 (USD MILLION)
- TABLE 295 JAPAN: BIOACTIVE DRESSINGS MARKET, BY END USER, 2022–2029 (USD MILLION)
- TABLE 296 JAPAN: BIOACTIVE DRESSINGS MARKET FOR HOSPITALS & CLINICS, BY TYPE, 2022–2029 (USD MILLION)
- TABLE 297 INDIA: BIOACTIVE DRESSINGS MARKET, BY PRODUCT, 2022–2029 (USD MILLION)
- TABLE 298 INDIA: BIOACTIVE DRESSINGS MARKET, BY TYPE, 2022–2029 (USD MILLION)
- TABLE 299 INDIA: SKIN SUBSTITUTES MARKET, TYPE, 2022–2029 (USD MILLION)
- TABLE 300 INDIA: BIOACTIVE DRESSINGS MARKET, BY PROPERTY TYPE, 2022–2029 (USD MILLION)
- TABLE 301 INDIA: BIOACTIVE DRESSINGS MARKET, BY APPLICATION, 2022–2029 (USD MILLION)
- TABLE 302 INDIA: BIOACTIVE DRESSINGS MARKET FOR CHRONIC WOUNDS, BY TYPE, 2022–2029 (USD MILLION)
- TABLE 303 INDIA: BIOACTIVE DRESSINGS MARKET FOR ACUTE WOUNDS, BY TYPE, 2022–2029 (USD MILLION)
- TABLE 304 INDIA: BIOACTIVE DRESSINGS MARKET, BY END USER, 2022–2029 (USD MILLION)
- TABLE 305 INDIA: BIOACTIVE DRESSINGS MARKET FOR HOSPITALS & CLINICS, BY TYPE, 2022–2029 (USD MILLION)
- TABLE 306 REST OF ASIA PACIFIC: BIOACTIVE DRESSINGS MARKET, BY PRODUCT, 2022–2029 (USD MILLION)
- TABLE 307 REST OF ASIA PACIFIC: BIOACTIVE DRESSINGS MARKET, BY TYPE, 2022–2029 (USD MILLION),
- TABLE 308 REST OF ASIA PACIFIC: SKIN SUBSTITUTES MARKET, BY TYPE, 2022–2029 (USD MILLION)
- TABLE 309 REST OF ASIA PACIFIC: BIOACTIVE DRESSINGS MARKET, BY PROPERTY TYPE, 2022–2029 (USD MILLION)
- TABLE 310 REST OF ASIA PACIFIC: BIOACTIVE DRESSINGS MARKET, BY APPLICATION, 2022–2029 (USD MILLION)
- TABLE 311 REST OF ASIA PACIFIC: BIOACTIVE DRESSINGS MARKET FOR CHRONIC WOUNDS, BY TYPE, 2022–2029 (USD MILLION)
- TABLE 312 REST OF ASIA PACIFIC: BIOACTIVE DRESSINGS MARKET FOR ACUTE WOUNDS, BY TYPE, 2022–2029 (USD MILLION)
- TABLE 313 REST OF ASIA PACIFIC: BIOACTIVE DRESSINGS MARKET, BY END USER, 2022–2029 (USD MILLION)
- TABLE 314 REST OF ASIA PACIFIC: BIOACTIVE DRESSINGS MARKET FOR HOSPITALS & CLINICS, BY TYPE, 2022–2029 (USD MILLION)
- TABLE 315 LATIN AMERICA: BIOACTIVE DRESSINGS MARKET, BY COUNTRY, 2022–2029 (USD MILLION)
- TABLE 316 LATIN AMERICA: BIOACTIVE DRESSINGS MARKET, BY PRODUCT, 2022–2029 (USD MILLION)
- TABLE 317 LATIN AMERICA: BIOACTIVE DRESSINGS MARKET, BY TYPE, 2022–2029 (USD MILLION)
- TABLE 318 LATIN AMERICA: SKIN SUBSTITUTES MARKET, TYPE, 2022–2029 (USD MILLION)
- TABLE 319 LATIN AMERICA: BIOACTIVE DRESSINGS MARKET, BY PROPERTY TYPE, 2022–2029 (USD MILLION)
- TABLE 320 LATIN AMERICA: BIOACTIVE DRESSINGS MARKET, BY APPLICATION, 2022–2029 (USD MILLION)
- TABLE 321 LATIN AMERICA: BIOACTIVE DRESSINGS MARKET FOR CHRONIC WOUNDS, BY TYPE, 2022–2029 (USD MILLION)
- TABLE 322 LATIN AMERICA: BIOACTIVE DRESSINGS MARKET FOR ACUTE WOUNDS, BY TYPE, 2022–2029 (USD MILLION)
- TABLE 323 LATIN AMERICA: BIOACTIVE DRESSINGS MARKET, BY END USER, 2022–2029 (USD MILLION)
- TABLE 324 LATIN AMERICA: BIOACTIVE DRESSINGS MARKET FOR HOSPITALS & CLINICS, BY TYPE, 2022–2029 (USD MILLION)
- TABLE 325 BRAZIL: BIOACTIVE DRESSINGS MARKET, BY PRODUCT, 2022–2029 (USD MILLION)
- TABLE 326 BRAZIL: BIOACTIVE DRESSINGS MARKET, BY TYPE, 2022–2029 (USD MILLION)
- TABLE 327 BRAZIL: SKIN SUBSTITUTES MARKET, BY TYPE, 2022–2029 (USD MILLION)
- TABLE 328 BRAZIL: BIOACTIVE DRESSINGS MARKET, BY PROPERTY TYPE, 2022–2029 (USD MILLION)
- TABLE 329 BRAZIL: BIOACTIVE DRESSINGS MARKET, BY APPLICATION, 2022–2029 (USD MILLION)
- TABLE 330 BRAZIL: BIOACTIVE DRESSINGS MARKET FOR CHRONIC WOUNDS, BY TYPE, 2022–2029 (USD MILLION)
- TABLE 331 BRAZIL: BIOACTIVE DRESSINGS MARKET FOR ACUTE WOUNDS, BY TYPE, 2022–2029 (USD MILLION)
- TABLE 332 BRAZIL: BIOACTIVE DRESSINGS MARKET, BY END USER, 2022–2029 (USD MILLION)
- TABLE 333 BRAZIL: BIOACTIVE DRESSINGS MARKET FOR HOSPITALS & CLINICS, BY TYPE, 2022–2029 (USD MILLION)
- TABLE 334 MEXICO: BIOACTIVE DRESSINGS MARKET, BY PRODUCT, 2022–2029 (USD MILLION)
- TABLE 335 MEXICO: BIOACTIVE DRESSINGS MARKET, BY TYPE, 2022–2029 (USD MILLION)
- TABLE 336 MEXICO: SKIN SUBSTITUTES MARKET, BY TYPE, 2022–2029 (USD MILLION)
- TABLE 337 MEXICO: BIOACTIVE DRESSINGS MARKET, BY PROPERTY TYPE, 2022–2029 (USD MILLION)
- TABLE 338 MEXICO: BIOACTIVE DRESSINGS MARKET, BY APPLICATION, 2022–2029 (USD MILLION)
- TABLE 339 MEXICO: BIOACTIVE DRESSINGS MARKET FOR CHRONIC WOUNDS, BY TYPE, 2022–2029 (USD MILLION)
- TABLE 340 MEXICO: BIOACTIVE DRESSINGS MARKET FOR ACUTE WOUNDS, BY TYPE, 2022–2029 (USD MILLION)
- TABLE 341 MEXICO: BIOACTIVE DRESSINGS MARKET, BY END USER, 2022–2029 (USD MILLION)
- TABLE 342 MEXICO: BIOACTIVE DRESSINGS MARKET FOR HOSPITALS & CLINICS, BY TYPE, 2022–2029 (USD MILLION)
- TABLE 343 REST OF LATIN AMERICA: BIOACTIVE DRESSINGS MARKET, BY PRODUCT, 2022–2029 (USD MILLION)
- TABLE 344 REST OF LATIN AMERICA: BIOACTIVE DRESSINGS MARKET, BY TYPE, 2022–2029 (USD MILLION)
- TABLE 345 REST OF LATIN AMERICA: SKIN SUBSTITUTES MARKET, BY TYPE, 2022–2029 (USD MILLION)
- TABLE 346 REST OF LATIN AMERICA: BIOACTIVE DRESSINGS MARKET, BY PROPERTY TYPE, 2022–2029 (USD MILLION)
- TABLE 347 REST OF LATIN AMERICA: BIOACTIVE DRESSINGS MARKET, BY APPLICATION, 2022–2029 (USD MILLION)
- TABLE 348 REST OF LATIN AMERICA: BIOACTIVE DRESSINGS MARKET FOR CHRONIC WOUNDS, BY TYPE, 2022–2029 (USD MILLION)
- TABLE 349 REST OF LATIN AMERICA: BIOACTIVE DRESSINGS MARKET FOR ACUTE WOUNDS, BY TYPE, 2022–2029 (USD MILLION)
- TABLE 350 REST OF LATIN AMERICA: BIOACTIVE DRESSINGS MARKET, BY END USER, 2022–2029 (USD MILLION)
- TABLE 351 REST OF LATIN AMERICA: BIOACTIVE DRESSINGS MARKET FOR HOSPITALS & CLINICS, BY TYPE, 2022–2029 (USD MILLION)
- TABLE 352 DIABETES IN MIDDLE EAST & NORTH AFRICA, 2021
- TABLE 353 MIDDLE EAST & AFRICA: BIOACTIVE DRESSINGS MARKET, BY PRODUCT, 2022–2029 (USD MILLION)
- TABLE 354 MIDDLE EAST & AFRICA: BIOACTIVE DRESSINGS MARKET, BY TYPE, 2022–2029 (USD MILLION)
- TABLE 355 MIDDLE EAST & AFRICA: SKIN SUBSTITUTES MARKET, BY TYPE, 2022–2029 (USD MILLION)
- TABLE 356 MIDDLE EAST & AFRICA: BIOACTIVE DRESSINGS MARKET, BY PROPERTY TYPE, 2022–2029 (USD MILLION)
- TABLE 357 MIDDLE EAST & AFRICA: BIOACTIVE DRESSINGS MARKET, BY APPLICATION, 2022–2029 (USD MILLION)
- TABLE 358 MIDDLE EAST & AFRICA: BIOACTIVE DRESSINGS MARKET FOR CHRONIC WOUNDS, BY TYPE, 2022–2029 (USD MILLION)
- TABLE 359 MIDDLE EAST & AFRICA: BIOACTIVE DRESSINGS MARKET FOR ACUTE WOUNDS, BY TYPE, 2022–2029 (USD MILLION)
- TABLE 360 MIDDLE EAST & AFRICA: BIOACTIVE DRESSINGS MARKET, BY END USER, 2022–2029 (USD MILLION)
- TABLE 361 MIDDLE EAST & AFRICA: BIOACTIVE DRESSINGS MARKET FOR HOSPITALS & CLINICS, BY TYPE, 2022–2029 (USD MILLION)
- TABLE 362 GCC COUNTRIES: BIOACTIVE DRESSINGS MARKET, BY PRODUCT, 2022–2029 (USD MILLION)
- TABLE 363 GCC COUNTRIES: BIOACTIVE DRESSINGS MARKET, BY TYPE, 2022–2029 (USD MILLION)
- TABLE 364 GCC COUNTRIES: SKIN SUBSTITUTES MARKET, BY TYPE, 2022–2029 (USD MILLION)
- TABLE 365 GCC COUNTRIES: BIOACTIVE DRESSINGS MARKET, BY PROPERTY TYPE, 2022–2029 (USD MILLION)
- TABLE 366 GCC COUNTRIES: BIOACTIVE DRESSINGS MARKET, BY APPLICATION, 2022–2029 (USD MILLION)
- TABLE 367 GCC COUNTRIES: BIOACTIVE DRESSINGS MARKET FOR CHRONIC WOUNDS, BY TYPE, 2022–2029 (USD MILLION)
- TABLE 368 GCC COUNTRIES: BIOACTIVE DRESSINGS MARKET FOR ACUTE WOUNDS, BY TYPE, 2022–2029 (USD MILLION)
- TABLE 369 GCC COUNTRIES: BIOACTIVE DRESSINGS MARKET, BY END USER, 2022–2029 (USD MILLION)
- TABLE 370 GCC COUNTRIES: BIOACTIVE DRESSINGS MARKET FOR HOSPITALS & CLINICS, BY TYPE, 2022–2029 (USD MILLION)
- TABLE 371 OVERVIEW OF STRATEGIES DEPLOYED BY KEY COMPANIES IN BIOACTIVE DRESSINGS MARKET
- TABLE 372 BIOACTIVE DRESSINGS MARKET: DEGREE OF COMPETITION
- TABLE 373 BIOACTIVE DRESSINGS MARKET RANKING, BY KEY PLAYER, 2023
- TABLE 374 GLOBAL SKIN SUBSTITUTES MARKET RANKING, BY KEY PLAYER, 2023
- TABLE 375 BIOACTIVE DRESSINGS MARKET: PRODUCT FOOTPRINT
- TABLE 376 BIOACTIVE DRESSINGS MARKET: PROPERTY FOOTPRINT
- TABLE 377 BIOACTIVE DRESSINGS MARKET: APPLICATION FOOTPRINT
- TABLE 378 BIOACTIVE DRESSINGS MARKET: REGION FOOTPRINT
- TABLE 379 BIOACTIVE DRESSINGS MARKET: DETAILED LIST OF KEY STARTUP/SME PLAYERS
- TABLE 380 BIOACTIVE DRESSINGS MARKET: COMPETITIVE BENCHMARKING OF KEY EMERGING PLAYERS/STARTUPS
- TABLE 381 BIOACTIVE DRESSINGS MARKET: PRODUCT LAUNCHES AND APPROVALS, JANUARY 2021–JULY 2024
- TABLE 382 BIOACTIVE DRESSINGS MARKET: DEALS, JANUARY 2021–JULY 2024
- TABLE 383 BIOACTIVE DRESSINGS MARKET: EXPANSIONS, JANUARY 2021–JULY 2024
- TABLE 384 BIOACTIVE DRESSINGS MARKET: OTHER DEVELOPMENTS, JANUARY 2021–JULY 2024
- TABLE 385 SMITH+NEPHEW: COMPANY OVERVIEW
- TABLE 386 SMITH+NEPHEW: PRODUCTS OFFERED
- TABLE 387 SMITH+NEPHEW: EXPANSIONS, JANUARY 2021–JULY 2024
- TABLE 388 SMITH+NEPHEW: OTHER DEVELOPMENTS, JANUARY 2021–JULY 2024
- TABLE 389 ORGANOGENESIS INC.: COMPANY OVERVIEW
- TABLE 390 ORGANOGENESIS INC.: PRODUCTS OFFERED
- TABLE 391 ORGANOGENESIS INC.: PRODUCT APPROVALS, JANUARY 2021–JULY 2024
- TABLE 392 ORGANOGENESIS INC.: OTHER DEVELOPMENTS, JANUARY 2021–JULY 2024
- TABLE 393 MIMEDX GROUP, INC.: COMPANY OVERVIEW
- TABLE 394 MIMEDX GROUP, INC.: PRODUCTS OFFERED
- TABLE 395 MIMEDX GROUP, INC.: PRODUCT LAUNCHES AND APPROVALS, JANUARY 2021–JULY 2024
- TABLE 396 MIMEDX GROUP, INC.: DEALS, JANUARY 2021–JULY 2024
- TABLE 397 3M: COMPANY OVERVIEW
- TABLE 398 3M: PRODUCTS OFFERED
- TABLE 399 3M: OTHER DEVELOPMENTS, JANUARY 2021–JULY 2024
- TABLE 400 CARDINAL HEALTH: COMPANY OVERVIEW
- TABLE 401 CARDINAL HEALTH: PRODUCTS OFFERED
- TABLE 402 B. BRAUN SE: COMPANY OVERVIEW
- TABLE 403 B. BRAUN SE: PRODUCTS OFFERED
- TABLE 404 MÖLNLYCKE AB: COMPANY OVERVIEW
- TABLE 405 MÖLNLYCKE AB: PRODUCTS OFFERED
- TABLE 406 CONVATEC INC.: COMPANY OVERVIEW
- TABLE 407 CONVATEC INC.: PRODUCTS OFFERED
- TABLE 408 CONVATEC INC.: PRODUCT APPROVALS, JANUARY 2021–JULY 2024
- TABLE 409 CONVATEC INC.: DEALS, JANUARY 2021–JULY 2024
- TABLE 410 PAUL HARTMANN AG: COMPANY OVERVIEW
- TABLE 411 PAUL HARTMANN AG: PRODUCTS OFFERED
- TABLE 412 COLOPLAST CORP.: COMPANY OVERVIEW
- TABLE 413 COLOPLAST CORP.: PRODUCTS OFFERED
- TABLE 414 COLOPLAST CORP.: DEALS, JANUARY 2021–JULY 2024
- TABLE 415 INTEGRA LIFESCIENCES CORPORATION: COMPANY OVERVIEW
- TABLE 416 INTEGRA LIFESCIENCES CORPORATION: PRODUCTS OFFERED
- TABLE 417 INTEGRA LIFESCIENCES CORPORATION: DEALS, JANUARY 2021–JULY 2024
- TABLE 418 ESSITY AKTIEBOLAG: COMPANY OVERVIEW
- TABLE 419 ESSITY AKTIEBOLAG: PRODUCTS OFFERED
- TABLE 420 ESSITY AKTIEBOLAG: PRODUCT LAUNCHES, JANUARY 2021–JULY 2024
- TABLE 421 ESSITY AKTIEBOLAG: DEALS, JANUARY 2021–JULY 2024
- TABLE 422 COVALON TECHNOLOGIES LTD.: COMPANY OVERVIEW
- TABLE 423 COVALON TECHNOLOGIES LTD.: PRODUCTS OFFERED
- TABLE 424 COVALON TECHNOLOGIES LTD.: OTHER DEVELOPMENTS, JANUARY 2021–JULY 2024
- TABLE 425 SANARA MEDTECH: COMPANY OVERVIEW
- TABLE 426 SANARA MEDTECH: PRODUCTS OFFERED
- TABLE 427 SANARA MEDTECH: PRODUCT LAUNCHES, JANUARY 2021–JULY 2024
- TABLE 428 SANARA MEDTECH: DEALS, JANUARY 2021–JULY 2024
- TABLE 429 MEDLINE INDUSTRIES, INC.: COMPANY OVERVIEW
- TABLE 430 HOLLISTER INCORPORATED: COMPANY OVERVIEW
- TABLE 431 L&R GROUP: COMPANY OVERVIEW
- TABLE 432 DERMARITE INDUSTRIES, LLC: COMPANY OVERVIEW
- TABLE 433 BIOTISSUE: COMPANY OVERVIEW
- TABLE 434 LIFENET HEALTH: COMPANY OVERVIEW
- TABLE 435 ADVANCIS MEDICAL: COMPANY OVERVIEW
- TABLE 436 HUMAN BIOSCIENCES: COMPANY OVERVIEW
- TABLE 437 AMERX HEALTH CARE: COMPANY OVERVIEW
- TABLE 438 GENTELL: COMPANY OVERVIEW
- TABLE 439 AXIO BIOSOLUTIONS PVT. LTD.: COMPANY OVERVIEW
- FIGURE 1 MARKETS COVERED
- FIGURE 2 RESEARCH DESIGN METHODOLOGY
- FIGURE 3 BREAKDOWN OF PRIMARY INTERVIEWS: SUPPLY-SIDE AND DEMAND-SIDE PARTICIPANTS
- FIGURE 4 BREAKDOWN OF PRIMARY INTERVIEWS: BY COMPANY TYPE, DESIGNATION, AND REGION
- FIGURE 5 BOTTOM-UP APPROACH: COMPANY REVENUE ESTIMATION APPROACH
- FIGURE 6 CAGR PROJECTIONS: SUPPLY-SIDE ANALYSIS
- FIGURE 7 BIOACTIVE DRESSINGS MARKET: TOP-DOWN APPROACH
- FIGURE 8 DATA TRIANGULATION METHODOLOGY
- FIGURE 9 BIOACTIVE DRESSINGS MARKET, BY PRODUCT, 2024 VS. 2029 (USD MILLION)
- FIGURE 10 BIOACTIVE DRESSINGS MARKET, BY PROPERTY TYPE, 2024 VS. 2029 (USD MILLION)
- FIGURE 11 BIOACTIVE DRESSINGS MARKET, BY APPLICATION, 2024 VS. 2029 (USD MILLION)
- FIGURE 12 BIOACTIVE DRESSINGS MARKET, BY END USER, 2024 VS. 2029 (USD MILLION)
- FIGURE 13 BIOACTIVE DRESSINGS MARKET, BY REGION, 2024 VS. 2029 (USD MILLION)
- FIGURE 14 GROWING INCIDENCE OF CHRONIC DISEASES TO DRIVE MARKET
- FIGURE 15 SKIN SUBSTITUTES SEGMENT TO DOMINATE MARKET IN 2029
- FIGURE 16 COLLAGEN DRESSINGS SEGMENT TO LEAD MARKET DURING FORECAST PERIOD
- FIGURE 17 HUMAN DONOR TISSUE-DERIVED PRODUCTS TO DOMINATE MARKET DURING FORECAST PERIOD
- FIGURE 18 NON-ANTIMICROBIAL DRESSINGS SEGMENT TO DOMINATE MARKET DURING FORECAST PERIOD
- FIGURE 19 CHRONIC WOUNDS SEGMENT TO DOMINATE MARKET IN 2029
- FIGURE 20 DIABETIC FOOT ULCERS SEGMENT TO LEAD MARKET IN 2029
- FIGURE 21 SURGICAL WOUNDS SEGMENT TO LEAD MARKET IN 2029
- FIGURE 22 HOSPITALS & CLINICS SEGMENT TO DOMINATE MARKET IN 2029
- FIGURE 23 INPATIENT SETTINGS SEGMENT TO DOMINATE MARKET IN 2029
- FIGURE 24 ASIA PACIFIC TO REGISTER HIGHEST GROWTH RATE IN BIOACTIVE DRESSINGS MARKET DURING FORECAST PERIOD
- FIGURE 25 BIOACTIVE DRESSINGS MARKET: DRIVERS, RESTRAINTS, OPPORTUNITIES, AND CHALLENGES
- FIGURE 26 PATENT ANALYSIS FOR BIOACTIVE DRESSING PRODUCTS (JANUARY 2014–DECEMBER 2023)
- FIGURE 27 BIOACTIVE DRESSINGS MARKET: VALUE CHAIN ANALYSIS
- FIGURE 28 BIOACTIVE DRESSINGS MARKET: SUPPLY CHAIN ANALYSIS
- FIGURE 29 BIOACTIVE DRESSINGS MARKET: ECOSYSTEM ANALYSIS
- FIGURE 30 BIOACTIVE DRESSINGS MARKET: PORTER’S FIVE FORCES ANALYSIS
- FIGURE 31 INFLUENCE OF STAKEHOLDERS ON BUYING PROCESS OF BIOACTIVE DRESSINGS FOR END USERS
- FIGURE 32 KEY BUYING CRITERIA OF BIOACTIVE DRESSINGS FOR END USERS
- FIGURE 33 REVENUE SHIFT IN BIOACTIVE DRESSINGS MARKET
- FIGURE 34 NORTH AMERICA: BIOACTIVE DRESSINGS MARKET SNAPSHOT
- FIGURE 35 ASIA PACIFIC: BIOACTIVE DRESSINGS MARKET SNAPSHOT
- FIGURE 36 REVENUE ANALYSIS OF KEY PLAYERS IN BIOACTIVE DRESSINGS MARKET (2021–2023)
- FIGURE 37 MARKET SHARE ANALYSIS OF KEY PLAYERS IN BIOACTIVE DRESSINGS MARKET (2023)
- FIGURE 38 BIOACTIVE DRESSINGS MARKET: COMPANY EVALUATION MATRIX (KEY PLAYERS), 2023
- FIGURE 39 BIOACTIVE DRESSINGS MARKET: COMPANY FOOTPRINT
- FIGURE 40 BIOACTIVE DRESSINGS MARKET: COMPANY EVALUATION MATRIX (STARTUPS/SMES), 2023
- FIGURE 41 EV/EBITDA OF KEY VENDORS
- FIGURE 42 YEAR-TO-DATE (YTD) PRICE TOTAL RETURN AND 5-YEAR STOCK BETA OF KEY VENDORS
- FIGURE 43 BIOACTIVE DRESSINGS MARKET: BRAND/PRODUCT COMPARATIVE ANALYSIS
- FIGURE 44 SMITH+NEPHEW: COMPANY SNAPSHOT (2023)
- FIGURE 45 ORGANOGENESIS INC.: COMPANY SNAPSHOT (2023)
- FIGURE 46 MIMEDX GROUP, INC.: COMPANY SNAPSHOT (2023)
- FIGURE 47 3M: COMPANY SNAPSHOT (2023)
- FIGURE 48 CARDINAL HEALTH: COMPANY SNAPSHOT (2023)
- FIGURE 49 B. BRAUN SE: COMPANY SNAPSHOT (2023)
- FIGURE 50 MÖLNLYCKE AB: COMPANY SNAPSHOT (2023)
- FIGURE 51 CONVATEC INC.: COMPANY SNAPSHOT (2023)
- FIGURE 52 PAUL HARTMANN AG: COMPANY SNAPSHOT (2023)
- FIGURE 53 COLOPLAST CORP.: COMPANY SNAPSHOT (2023)
- FIGURE 54 INTEGRA LIFESCIENCES CORPORATION: COMPANY SNAPSHOT (2023)
- FIGURE 55 ESSITY AKTIEBOLAG: COMPANY SNAPSHOT (2023)
- FIGURE 56 COVALON TECHNOLOGIES LTD.: COMPANY SNAPSHOT (2023)
- FIGURE 57 SANARA MEDTECH: COMPANY SNAPSHOT (2023)
The objective of the study is to analyze the key market dynamics, such as drivers, opportunities, challenges, restraints, and key player strategies. To track company developments such as acquisitions, product launches, expansions, collaborations, agreements, and partnerships of the leading players, the competitive landscape of the bioactive dressings market to analyze market players on various parameters within the broad categories of business and product strategy. Top-down and bottom-up approaches were used to estimate the market size. To estimate the market size of segments and subsegments, the market breakdown and data triangulation were used.
The four steps involved in estimating the market size are:
Collecting Secondary Data
The secondary research data collection process involves the usage of secondary sources, directories, databases (such as Bloomberg Businessweek, Factiva, and D&B), annual reports, investor presentations, and SEC filings of companies. Secondary research was used to identify and collect information useful for the extensive, technical, market-oriented, and commercial study of the bioactive dressings market. A database of the key industry leaders was also prepared using secondary research.
Collecting Primary Data
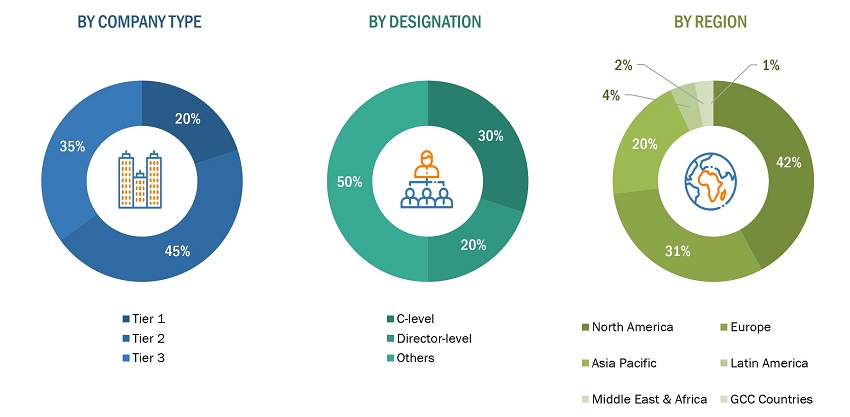
The primary research data was conducted after acquiring knowledge about the bioactive dressings market scenario through secondary research. A significant number of primary interviews were conducted with stakeholders from both the demand side (such as hospitals & clinics, home care settings, wound centers and research centers) and supply side (such as included various industry experts, such as Directors, Chief X Officers (CXOs), Vice Presidents (VPs) from business development, marketing, and product development teams, product manufacturers, wholesalers, channel partners, and distributors) across major countries of North America, Europe, Asia Pacific, the Middle East & Africa, and Latin America. Approximately 40% of the primary interviews were conducted with stakeholders from the demand side, while those from the supply side accounted for the remaining 60%. Primary data for this report was collected through questionnaires, emails, and telephonic interviews.
A breakdown of the primary respondents is provided below:
To know about the assumptions considered for the study, download the pdf brochure
Market Size Estimation
All major product manufacturers offering various bioactive dressings were identified at the global/regional level. Revenue mapping was done for the major players and was extrapolated to arrive at the global market value of each type of segment. The market value bioactive dressings market was also split into various segments and subsegments at the region and country level based on:
- Product mapping of various manufacturers for each type of bioactive dressings market at the regional and country-level
- Relative adoption pattern of each bioactive dressings market among key application segments at the regional and/or country-level
- Detailed primary research to gather qualitative and quantitative information related to segments and subsegments at the regional and/or country level
- Detailed secondary research to gauge the prevailing market trends at the regional and/or country level
Global Bioactive Dressings Market Size: Bottom-Up Approach
Global Bioactive Dressings Market Size: Top-Down Approach
To know about the assumptions considered for the study, Request for Free Sample Report
Data Triangulation
After arriving at the overall market size—using the market size estimation processes—the market was split into several segments and subsegments. To complete the overall market engineering process and arrive at the exact statistics of each market segment and subsegment, data triangulation and market breakdown procedures were employed, wherever applicable. The data was triangulated by studying various factors and trends from both the demand and supply sides in the bioactive dressings industry.
Market Definition
Bioactive dressings are special wound dressings designed to promote the healing process by creating an optimal environment for wound healing. They primarily maintain moisture balance, prevent infections, promote tissue regeneration and reduce inflammation. These dressings are enriched with active ingredients such as antimicrobials, growth factors and collagen that accelerate cell proliferation and promote the formation of new blood vessels, resulting in faster wound closure and healing.
Key Stakeholders
- Manufacturers and distributors of bioactive dressing products
- Wound care associations
- Research & development (R&D) companies
- Distributors of wound care devices
- Contract manufacturers of bioactive dressing products
- Research laboratories & academic institutes
- Healthcare institutes (hospitals & clinics, ambulatory surgical centers, home care settings, and long-term care facilities)
- Healthcare payers
- Government associations
- Venture capitalists & investors
Report Objectives
- To define, describe, segment, and forecast the bioactive dressings market by product type, property type, application, end user, and region
- To provide detailed information regarding the major factors influencing the market growth (drivers, restraints, opportunities, and challenges)
- To analyze micromarkets with respect to individual growth trends, prospects, and contributions to the overall market
- To analyze market opportunities for stakeholders and provide details of the competitive landscape for key players
- To forecast the size of the market segments with respect to six regions: North America, Europe, the Asia Pacific, Middle East & Africa, Latin America, and GCC countries
- To profile the key players and comprehensively analyze their product portfolios, market positions, and core competencies
- To track and analyze company developments such as product launches & approvals, acquisitions, agreements, and expansions in the bioactive dressings market
- To benchmark players within the bioactive dressings market using the Company Evaluation Matrix framework, which analyzes market players on various parameters within the broad categories of business strategy, market share, and product offerings
Available Customizations
MarketsandMarkets offers the following customizations for this market report:
Additional country-level analysis of the bioactive dressings market
Profiling of additional market players (up to 5)
Product Analysis
- Product matrix, which provides a detailed comparison of the product portfolio of each company in the Bioactive Dressings Market
Growth opportunities and latent adjacency in Bioactive Dressings Market