Autonomous Networks Market by Solutions (AI Networking, Artificial Intelligence for IT Operations (AIOPS), Network Management Tools, Network Function Virtualization (NFV), Software Defined Networking, Intent-Based Networking) - Global Forecast to 2029
[239 Pages Report] The Autonomous Networks Market size is estimated to be worth USD 7.0 billion in 2024. It is projected to reach USD 17.5 billion by 2029 at a Compound Annual Growth Rate (CAGR) of 20.1% during the forecast period. The autonomous networks market is expected to surge in the coming years substantially. This growth is fueled by critical trends such as the increasing demand for IoT connectivity, the necessity for real-time data processing, and the rising complexity of network architectures. These factors drive the adoption of autonomous solutions for enhanced efficiency, security, and scalability in network management.
To know about the assumptions considered for the study, Request for Free Sample Report
To know about the assumptions considered for the study, download the pdf brochure
Autonomous Networks Market Trends
Driver: Increased need for real-time data processing & analysis
The increasing demand for real-time data processing and analysis across various industries is driving the growth of autonomous networks. In sectors such as finance, healthcare, manufacturing, and transportation, the ability to quickly gather, process, and analyze data can lead to more informed decision-making and enhanced operational efficiencies. Autonomous networks facilitate this rapid data handling by leveraging advanced technologies like AI and machine learning to manage network resources and optimize data flow dynamically. This ensures that the necessary network bandwidth and computational power are available to process and analyze data in real-time. As a result, organizations can respond more promptly to critical insights and emerging trends, thereby gaining a competitive edge. The efficiency of autonomous networks in managing data-intensive tasks with minimal human intervention makes them necessary in environments where speed and accuracy are paramount.
Restraint: A high initial investment required to adopt this technology
Adopting autonomous networks often requires a significant initial investment, which is a major restraint in the market. This technology typically necessitates advanced hardware, such as sensors and robotics, and sophisticated software capable of artificial intelligence and machine learning. Additionally, integrating these technologies into existing systems often involves substantial upfront costs, including installation, testing, and training personnel. For many organizations, especially small and medium-sized enterprises, these costs can be prohibitively high, limiting the speed at which the technology is adopted and the scale at which it can be implemented. The financial risk associated with such a considerable initial outlay, combined with uncertain returns on investment, further contributes to the cautious approach many potential adopters take towards fully autonomous networks.
Opportunity: Edge computing optimization
In the autonomous networks market, edge computing optimization emerges as a significant opportunity due to its ability to reduce latency, enhance data processing speeds, and improve overall network efficiency. By distributing data processing tasks closer to the source of data generation—such as IoT devices and local servers—edge computing reduces the burden on central servers and minimizes data transit distances. This setup is particularly beneficial in autonomous networks where real-time decision-making is critical, such as autonomous vehicles and smart city infrastructures. Moreover, optimizing edge computing can lead to better management of bandwidth and enhanced privacy, as less data needs to be transmitted over long distances to central data centers. This optimization not only supports more scalable and responsive network architectures but also opens new business models and services that can leverage faster and more reliable network performance.
Challenge: Customer requirement interaction
In autonomous networks, understanding and effectively addressing customer requirements is crucial. However, it's often challenging due to several factors. Firstly, customers may have diverse and evolving needs, spanning network reliability, performance, security, and customization. Capturing these requirements accurately and translating them into network configurations can be complex. Additionally, customer demands can change rapidly based on industry trends, technological advancements, or organizational goals, necessitating continuous adaptation by autonomous networks. Establishing effective communication channels between customers and network operators is essential to gather feedback and ensure network configurations meet expectations. Without robust feedback loops, refining and optimizing autonomous network functionalities becomes difficult.
Ecosystem Of Autonomous Networks Market
The prominent players in the autonomous networks market include Ericsson (Sweden), Nokia (Finland), NEC Corporation (Japan), Huawei Technologies Co., Ltd (China), Hewlett Packard Enterprise (US), Cisco Systems (US), IBM Corporation (US), Ciena (US), Extreme Networks (US), Arista Networks (US), Broadcom (US), ZTE Corporation (China), Allied Telesis (Japan) and so on. These companies have been operating in the market for several years and possess a diversified product portfolio and state-of-the-art technologies with a well-established geographic footprint.
Based on offering, the services segment is expected to hold a higher growth rate during the forecast period
In the forecasted period from 2024 to 2029, the services segment of the autonomous networks market is expected to grow significantly, especially in consulting, support & maintenance, and system integration & deployment services. This growth is driven by a few key factors. As more businesses adopt autonomous network solutions, they'll need expert help to set them up. Consulting services will advise them on the best ways to do this. Additionally, as these technologies become more complex, ongoing support and maintenance will be crucial for running them smoothly. This means there will be a higher demand for support & maintenance services. Also, because setting up these networks can be tricky, businesses need help integrating them into their existing systems. System Integration & deployment services will be in demand to make this process easier. Overall, the growth of these services highlights their essential role in helping businesses adopt and succeed with autonomous networks in the years ahead.
By offering, the solutions segment is expected to register the largest market share during the forecast period.
Within the projected 2024-2029 forecast period, the solutions segment is anticipated to hold the largest market share in the autonomous networks market due to several compelling factors. The increasing complexity of network infrastructures necessitates comprehensive solutions that can autonomously manage and optimize operations, integrating advanced technologies such as artificial intelligence and machine learning to adapt to evolving network conditions and demands. This demand is further fueled by the growing adoption of automation across industries, driven by the need for efficiency and cost-effectiveness. Additionally, the rise of emerging technologies like 5G, IoT, and edge computing requires robust and adaptive network management systems, enhancing the relevance and uptake of autonomous network solutions. Furthermore, regulatory pressures and the need for improved cybersecurity also drive organizations to invest in comprehensive autonomous network solutions to ensure compliance and protect sensitive data. Overall, the solutions segment is poised to lead the market due to its ability to address the multifaceted challenges of modern network management effectively.
North America is estimated to have the largest market size during the forecast period
North America is set to dominate the autonomous networks market between 2024 and 2029 due to several key factors. North America possesses a highly developed telecommunications infrastructure, with widespread adoption of advanced technologies such as 5G. This technological advancement creates a fertile ground for implementing autonomous networks, which rely on robust connectivity and low latency. Moreover, the region is home to many leading technology companies and startups focused on innovation in networking and automation, fostering a competitive landscape that drives rapid advancements in autonomous network solutions. Additionally, North America has a conducive regulatory environment that encourages investment in emerging technologies, further stimulating growth in the autonomous networks market. Lastly, the region's large and diverse consumer base, coupled with increasing demand for seamless connectivity and digital services, provides a substantial market opportunity for autonomous network providers to thrive and expand their operations.
Market Players:
The major players in the autonomous network's market are Ericsson (Sweden), Nokia (Finland), NEC Corporation (Japan), Huawei Technologies Co., Ltd (China), Hewlett Packard Enterprise (US), Cisco Systems (US), IBM Corporation (US), Ciena Corporation (US), Extreme Networks (US), Arista Networks (US), Broadcom (US), ZTE Corporation (China), Allied Telesis (Japan), Logic Monitor (US), SolarWinds Worldwide(US), BMC Software (US), Drivenets (Israel), Versa Networks (US), Arrcus (US), Intraway (Argentina), Augtera (US), Auvik Networks (Canada), Infovista (France), and Innovile (Turkey). These players have adopted various growth strategies, such as partnerships, agreements and collaborations, new product launches and enhancements, and acquisitions to expand ktheir passenger information system market footprint.
Want to explore hidden markets that can drive new revenue in Autonomous Networks Market?
Scope of the Report
Want to explore hidden markets that can drive new revenue in Autonomous Networks Market?
Report Metrics |
Details |
Market size available for years |
2018-2029 |
Base year considered |
2023 |
Forecast period |
2024–2029 |
Forecast units |
Value (USD) Billion |
Segments Covered |
by Solutions (AI Networking, Artificial Intelligence for IT Operations (AIOPS), Network Management Tools, Network Function Virtualization (NFV), Software Defined Networking, Intent-Based Networking) - Global Forecast to 2029 |
Region covered |
North America, Europe, Asia Pacific, Middle East & Africa, and Latin America. |
Companies covered |
Ericsson (Sweden), Nokia (Finland), NEC Corporation (Japan), Huawei Technologies Co., Ltd (China), Hewlett Packard Enterprise (US), Cisco Systems (US), IBM Corporation (US), Ciena (US), Extreme Networks (US), Arista Networks (US), Broadcom (US), ZTE Corporation (China), Allied Telesis (Japan), Logic Monitor (US), SolarWinds Worldwide (US), BMC Software (US), Drivenets (Israel), Versa Networks (US), Arrcus (US), Intraway (Argentina), Augtera (US), Auvik Networks (Canada), Infovista (France), and Innovile (Turkey). |
Autonomous Networks Market Highlights
This research report categorizes the Autonomous Networks Market to forecast revenues and analyze trends in each of the following submarkets:
Segment |
Subsegment |
Based on offering: |
|
Based on end user: |
|
By Region: |
|
Recent Development
- In December 2023, Ericsson and AT&T collaborated in an industry-defining roughly USD 14 billion five-year network transformation and digitalization strategic agreement to pioneer the path to programmable and intelligent networks of the future.
Frequently Asked Questions (FAQ):
What is the Autonomous Networks Market?
An autonomous network is a communication network that can operate and optimize itself without human intervention. This type of network relies on advanced technologies such as machine learning algorithms, artificial intelligence, and automation to enable efficient and reliable operations. An autonomous network is a new model that uses built-in artificial intelligence (AI), machine learning (ML), and advanced analytics to automate operations and functions.
What is the market size of the autonomous networks market?
The autonomous networks market is estimated at USD 7.0 billion in 2024 to USD 17.5 billion by 2029, at a Compound Annual Growth Rate (CAGR) of 20.1% from 2024 to 2029.
What are the major drivers in the autonomous networks market?
The major drivers in the autonomous networks market are the rapid advancement of artificial intelligence (AI) and machine learning (ML) technologies, the deployment of 5G networks, the growing emphasis on network security and reliability, digital transformation across various industries, and the need for real-time data processing and analytics.
Who are the key players operating in the autonomous networks market?
The key market players profiled in the autonomous network's market are Ericsson (Sweden), Nokia (Finland), NEC Corporation (Japan), Huawei Technologies Co., Ltd (China), Hewlett Packard Enterprise (US), Cisco Systems (US), IBM Corporation (US), Ciena (US), Extreme Networks (US), Arista Networks (US), Broadcom (US), ZTE Corporation (China), Allied Telesis (Japan), Logic Monitor (US), SolarWinds Worldwide(US), BMC Software (US), Drivenets (Israel), Versa Networks (US), Arrcus (US), Intraway (Argentina), Augtera (US), Auvik Networks (Canada), Infovista (France), and Innovile (Turkey).
What are the critical technology trends prevailing in the autonomous networks market?
The key technology trends in autonomous networks include AI and machine learning for automation, 5G technology deployment, Edge computing for real-time processing, IoT applications driving network management, and enhanced network security solutions. .
To speak to our analyst for a discussion on the above findings, click Speak to Analyst
Exclusive indicates content/data unique to MarketsandMarkets and not available with any competitors.
- 5.1 INTRODUCTION
-
5.2 MARKET DYNAMICSDRIVERS- Rise of IoT devices- Increased need for real-time data processing & analysisRESTRAINTS- High initial investment- Lack of standardization- Increased connectivity and automation elevating potential for cybersecurity risksOPPORTUNITIES- Edge computing optimization- Network slicingCHALLENGES- Difficulties in comprehending customers’ requirements- Challenges regarding alignment of network configurations with business objectives
- 5.3 BRIEF HISTORY OF AUTONOMOUS NETWORKS
- 5.4 ECOSYSTEM ANALYSIS
-
5.5 CASE STUDY ANALYSISVEJTHANI HOSPITAL USED HUAWEI’S WI-FI 6 NETWORK TO BECOME SMART HOSPITALAI-DRIVEN NETWORKING FROM JUNIPER IMPROVED NETWORK VISIBILITY AND CONTROL FOR UNIVERSITY OF OXFORDCHINA MOBILE COMMUNICATIONS COMPANY ENHANCED BROADBAND EXPERIENCE WITH NOKIA AVA AI AND ANALYTICSHEILONGJIANG INTERNATIONAL UNIVERSITY BUILT GREEN CAMPUS NETWORK WITH HUAWEI’S IMASTER NCE-CAMPUSINSIGHT
- 5.6 VALUE CHAIN ANALYSIS
-
5.7 REGULATORY LANDSCAPEREGULATORY BODIES, GOVERNMENT AGENCIES, AND OTHER ORGANIZATIONS- Institute of Electrical and Electronics Engineers (IEEE)- International Telecommunication Union (ITU)- North America- Europe- Asia Pacific- Middle East & Africa- Latin America
-
5.8 PRICING ANALYSISINDICATIVE PRICING ANALYSIS, BY SOLUTIONAVERAGE PRICING ANALYSIS, BY SOLUTION
-
5.9 TECHNOLOGY ANALYSISKEY TECHNOLOGIES- ML and AI- SDNCOMPLEMENTARY TECHNOLOGIES- IoT- Edge computingADJACENT TECHNOLOGIES- 5G infrastructure- Network Functions Virtualization (NFV)
-
5.10 PATENT ANALYSISLIST OF MAJOR PATENTS
-
5.11 PORTER’S FIVE FORCES ANALYSISTHREAT OF NEW ENTRANTSTHREAT OF SUBSTITUTESBARGAINING POWER OF SUPPLIERSBARGAINING POWER OF BUYERSINTENSITY OF COMPETITIVE RIVALRY
- 5.12 TRENDS/DISRUPTIONS IMPACTING CUSTOMERS’ BUSINESSES
-
5.13 KEY STAKEHOLDERS AND BUYING CRITERIAKEY STAKEHOLDERS IN BUYING PROCESSBUYING CRITERIA
- 5.14 KEY CONFERENCES AND EVENTS
-
5.15 TECHNOLOGY ROADMAP FOR MARKETSHORT-TERM ROADMAP (2023–2025)MID-TERM ROADMAP (2026–2028)LONG-TERM ROADMAP (2029–2030)
-
5.16 BEST PRACTICES IN MARKETCONTINUOUS MONITORING AND ANALYSISSELF-CONFIGURATION AND OPTIMIZATIONRESILIENCE AND FAULT TOLERANCEINTENT-BASED NETWORKING (IBN)ROBUST SECURITY MEASURES
-
5.17 CURRENT AND EMERGING BUSINESS MODELSSUBSCRIPTION MODELAS-A-SERVICE (AAS) MODELPLATFORM MODELOPEN-SOURCE MODELPAY-PER-USE MODEL
- 5.18 MARKET: TOOLS, FRAMEWORKS, AND TECHNIQUES
- 5.19 INVESTMENT AND FUNDING SCENARIO
-
6.1 INTRODUCTIONOFFERINGS: MARKET DRIVERS
-
6.2 SOLUTIONSAI NETWORKING- AI networking in autonomous networks to streamline performance, automate tasks, and boost overall network management efficiencyAIOPS- AIOPS to optimize network performance, ensure reliability, and reduce need for human interventionNETWORK MANAGEMENT TOOLS- Network management tools to efficiently manage complex networks, enhance agility, and deliver superior user experiencesOTHER SOLUTIONS
-
6.3 SERVICESCONSULTING- Consulting services to offer expert guidance and support to businesses aiming to implement or optimize autonomous network solutionsSYSTEM INTEGRATION & DEPLOYMENT- System integration & deployment services to streamline hardware, software, & automation and configure software elementsSUPPORT & MAINTENANCE- Support & maintenance services to troubleshoot, ensure smooth operation and optimal performance, and prevent downtime
-
7.1 INTRODUCTIONEND USERS: MARKET DRIVERS
-
7.2 SERVICE PROVIDERSSERVICE PROVIDERS TO USE AUTONOMOUS NETWORKING TO AUTOMATE NETWORK CONFIGURATION, OPTIMIZATION, TROUBLESHOOTING, AND SECURITY TASKS WITHOUT HUMAN INTERVENTION
-
7.3 VERTICALSAUTONOMOUS NETWORKS TO AUTOMATE PROCESSES, ENHANCE CONNECTIVITY, AND DRIVE INNOVATION ACROSS SECTORSHOSPITALITY- Autonomous networks to enhance guest experiences and operational efficiency and streamline operations in hotels and resortsEDUCATION- Autonomous networks to ensure access to educational resources anytime and provide reliable and secure connectivityGOVERNMENT- Autonomous networks to improve communication, enhance security, and optimize service delivery in government agenciesHEALTHCARE- Autonomous networks to enable telemedicine, electronic health records, and medical device connectivity while ensuring data securityTRANSPORTATION & LOGISTICS- Autonomous networks to optimize operations, improve efficiency, and enhance safety across various modes of transportation and supply chainsOTHER VERTICALS
- 8.1 INTRODUCTION
-
8.2 NORTH AMERICANORTH AMERICA: MARKET DRIVERSNORTH AMERICA: RECESSION IMPACTUS- Advanced technological infrastructure, strong presence of major players offering tailored solutions, and robust regulatory environment to drive marketCANADA- Well-developed telecommunications infrastructure, expanding digital economy, and government initiatives and industry partnerships to propel market
-
8.3 EUROPEEUROPE: AUTONOMOUS NETWORKS MARKET DRIVERSEUROPE: RECESSION IMPACTUK- Advanced telecommunications infrastructure, strong focus on digital innovation, and presence of major players to spur market growthGERMANY- Robust industrial base, emphasis on technological innovation, thriving start-up ecosystem, and government support to foster market growthFRANCE- Presence of major players offering tailored solutions to meet diverse business and consumer needs amidst strong digital transformation efforts to accelerate market growthITALY- Presence of major vendors, growing demand for digital solutions, and technological advancements to boost demand for autonomous network solutionsSPAIN- Government initiatives promoting digitalization across sectors and presence of major vendors to fuel market growthREST OF EUROPE
-
8.4 ASIA PACIFICASIA PACIFIC: AUTONOMOUS NETWORKS MARKET DRIVERSASIA PACIFIC: RECESSION IMPACTCHINA- Rapid technological advancements, operational efficiency, and cost reduction networks to boost demand for autonomous networks solutionsJAPAN- Enhanced network performance, strategic investments in digital infrastructure, aging population, and shrinking workforce to drive marketINDIA- Increased demand for connectivity, rapidly growing digital economy, and government initiatives to spur market growthANZ- Strong regulatory environment promoting competition and innovation and government initiatives aimed at expanding digital connectivity to foster market growthREST OF ASIA PACIFIC
-
8.5 MIDDLE EAST & AFRICAMIDDLE EAST & AFRICA: AUTONOMOUS NETWORKS MARKET DRIVERSMIDDLE EAST & AFRICA: RECESSION IMPACTGCC COUNTRIES- Collaborations between government entities and private companies to overcome financial and technical challenges to propel market- UAE- KSA- Rest of GCC CountriesSOUTH AFRICA- South Africa’s unique socio-economic landscape, widespread connectivity issues, and cybersecurity concerns to fuel market growthREST OF MIDDLE EAST & AFRICA
-
8.6 LATIN AMERICALATIN AMERICA: AUTONOMOUS NETWORKS MARKET DRIVERSLATIN AMERICA: RECESSION IMPACTBRAZIL- Increasing digitization efforts, government investments in telecommunications infrastructure, and focus on smart city initiatives to foster market growthMEXICO- Growing demand for high-speed internet and increasing adoption of digital technologies to boost demand for autonomous network solutionsREST OF LATIN AMERICA
- 9.1 INTRODUCTION
-
9.2 KEY PLAYER STRATEGIES/RIGHT TO WINOVERVIEW OF STRATEGIES ADOPTED BY KEY AUTONOMOUS NETWORKS VENDORS
- 9.3 REVENUE ANALYSIS
-
9.4 MARKET SHARE ANALYSISMARKET RANKING ANALYSIS
-
9.5 COMPANY EVALUATION MATRIX: KEY PLAYERS, 2023STARSEMERGING LEADERSPERVASIVE PLAYERSPARTICIPANTSCOMPANY FOOTPRINT: KEY PLAYERS, 2023
-
9.6 COMPANY EVALUATION MATRIX: START-UPS/SMES, 2023PROGRESSIVE COMPANIESRESPONSIVE COMPANIESDYNAMIC COMPANIESSTARTING BLOCKSCOMPETITIVE BENCHMARKING
-
9.7 COMPETITIVE SCENARIO AND TRENDSPRODUCT LAUNCHESDEALS
- 9.8 BRAND/PRODUCT COMPARISON ANALYSIS
- 9.9 COMPANY VALUATION AND FINANCIAL METRICS OF KEY AUTONOMOUS NETWORKS PROVIDERS
-
10.1 KEY PLAYERSNOKIA- Business overview- Products/Solutions/Services offered- Recent developments- MnM viewHEWLETT PACKARD ENTERPRISE (HPE)- Business overview- Products/Solutions/Services offered- Recent developments- MnM viewCISCO SYSTEMS, INC.- Business overview- Products/Solutions/Services offered- Recent developments- MnM viewARISTA NETWORKS- Business overview- Products/Solutions/Services offered- Recent developments- MnM viewBROADCOM- Business overview- Products/Solutions/Services offered- Recent developments- MnM viewERICSSON- Business overview- Products/Solutions/Services offeredNEC CORPORATION- Business overview- Products/Solutions/Services offered- Recent developmentsHUAWEI TECHNOLOGIES CO., LTD.- Business overview- Products/Solutions/Services offered- Recent developmentsIBM CORPORATION- Business overview- Products/Solutions/Services offeredCIENA CORPORATION- Business overview- Products/Solutions/Services offeredEXTREME NETWORKS- Business overview- Products/Solutions/Services offeredZTE CORPORATIONALLIED TELESIS, INC.LOGIC MONITOR INC.SOLARWINDS WORLDWIDE, LLC.BMC SOFTWARE
-
10.2 START-UPS/SMESDRIVENETSVERSA NETWORKSARRCUS INC.INTRAWAYAUGTERA NETWORKS, INC.AUVIK NETWORKSINFOVISTAINNOVILE
-
11.1 INTRODUCTIONLIMITATIONS
-
11.2 NETWORK AUTOMATION MARKETMARKET DEFINITIONMARKET OVERVIEW- Network automation market, by component- Network automation market, by solution- Network automation market, by professional service- Network automation market, by network type- Network automation market, by deployment mode- Network automation market, by end user- Network automation market, by organization size- Network automation market, by enterprise vertical- Network automation market, by region
-
11.3 NETWORK MANAGEMENT SYSTEM MARKETMARKET DEFINITIONMARKET OVERVIEW- Network management system market, by component- Network management system market, by solution- Network management system market, by service- Network management system market, by deployment type- Network management system market, by organization size- Network management system market, by end user- Network management system market, by service provider- Network management system market, by vertical- Network management system market, by region
- 12.1 DISCUSSION GUIDE
- 12.2 KNOWLEDGESTORE: MARKETSANDMARKETS’ SUBSCRIPTION PORTAL
- 12.3 CUSTOMIZATION OPTIONS
- 12.4 RELATED REPORTS
- 12.5 AUTHOR DETAILS
- TABLE 1 USD EXCHANGE RATES, 2021–2023
- TABLE 2 KEY PRIMARY INTERVIEW PARTICIPANTS
- TABLE 3 RESEARCH ASSUMPTIONS
- TABLE 4 RISK ASSESSMENT
- TABLE 5 AUTONOMOUS NETWORKS MARKET: ECOSYSTEM
- TABLE 6 NORTH AMERICA: LIST OF REGULATORY BODIES, GOVERNMENT AGENCIES, AND OTHER ORGANIZATIONS
- TABLE 7 EUROPE: LIST OF REGULATORY BODIES, GOVERNMENT AGENCIES, AND OTHER ORGANIZATIONS
- TABLE 8 ASIA PACIFIC: LIST OF REGULATORY BODIES, GOVERNMENT AGENCIES, AND OTHER ORGANIZATIONS
- TABLE 9 ROW: LIST OF REGULATORY BODIES, GOVERNMENT AGENCIES, AND OTHER ORGANIZATIONS
- TABLE 10 INDICATIVE PRICING ANALYSIS OF AUTONOMOUS NETWORKS, BY SOLUTION (USD)
- TABLE 11 AVERAGE PRICING ANALYSIS OF KEY PLAYERS, BY SOLUTION (USD)
- TABLE 12 PORTER’S FIVE FORCES’ IMPACT ON MARKET
- TABLE 13 INFLUENCE OF STAKEHOLDERS ON BUYING PROCESS FOR END USERS
- TABLE 14 KEY BUYING CRITERIA FOR NETWORK OPERATORS
- TABLE 15 MARKET: LIST OF KEY CONFERENCES AND EVENTS, 2024–2025
- TABLE 16 MARKET, BY OFFERING, 2018–2023 (USD MILLION)
- TABLE 17 MARKET, BY OFFERING, 2024–2029 (USD MILLION)
- TABLE 18 SOLUTIONS: AUTONOMOUS NETWORKS MARKET, BY REGION, 2018–2023 (USD MILLION)
- TABLE 19 SOLUTIONS: MARKET, BY REGION, 2024–2029 (USD MILLION)
- TABLE 20 AUTONOMOUS NETWORKS MARKET, BY SOLUTION 2018–2023 (USD MILLION)
- TABLE 21 MARKET, BY SOLUTION, 2024–2029 (USD MILLION)
- TABLE 22 AI NETWORKING: MARKET, BY REGION, 2018–2023 (USD MILLION)
- TABLE 23 AI NETWORKING: MARKET, BY REGION, 2024–2029 (USD MILLION)
- TABLE 24 AIOPS: MARKET, BY REGION, 2018–2023 (USD MILLION)
- TABLE 25 AIOPS: MARKET, BY REGION, 2024–2029 (USD MILLION)
- TABLE 26 NETWORK MANAGEMENT TOOLS: MARKET, BY REGION, 2018–2023 (USD MILLION)
- TABLE 27 NETWORK MANAGEMENT TOOLS: MARKET, BY REGION, 2024–2029 (USD MILLION)
- TABLE 28 OTHER SOLUTIONS: MARKET, BY REGION, 2018–2023 (USD MILLION)
- TABLE 29 OTHER SOLUTIONS: MARKET, BY REGION, 2024–2029 (USD MILLION)
- TABLE 30 SERVICES: MARKET, BY REGION, 2018–2023 (USD MILLION)
- TABLE 31 SERVICES: AUTONOMOUS NETWORKS MARKET, BY REGION, 2024–2029 (USD MILLION)
- TABLE 32 MARKET, BY SERVICE, 2018–2023 (USD MILLION)
- TABLE 33 MARKET, BY SERVICE, 2024–2029 (USD MILLION)
- TABLE 34 CONSULTING: MARKET, BY REGION, 2018–2023 (USD MILLION)
- TABLE 35 CONSULTING: MARKET, BY REGION, 2024–2029 (USD MILLION)
- TABLE 36 SYSTEM INTEGRATION & DEPLOYMENT: MARKET, BY REGION, 2018–2023 (USD MILLION)
- TABLE 37 SYSTEM INTEGRATION & DEPLOYMENT: MARKET, BY REGION, 2024–2029 (USD MILLION)
- TABLE 38 SUPPORT & MAINTENANCE: MARKET, BY REGION, 2018–2023 (USD MILLION)
- TABLE 39 SUPPORT & MAINTENANCE: MARKET, BY REGION, 2024–2029 (USD MILLION)
- TABLE 40 MARKET, BY END USER, 2018–2023 (USD MILLION)
- TABLE 41 MARKET, BY END USER, 2024–2029 (USD MILLION)
- TABLE 42 SERVICE PROVIDERS: MARKET, BY REGION, 2018–2023 (USD MILLION)
- TABLE 43 SERVICE PROVIDERS: MARKET, BY REGION, 2024–2029 (USD MILLION)
- TABLE 44 MARKET, BY VERTICAL, 2018–2023 (USD MILLION)
- TABLE 45 MARKET, BY VERTICAL, 2024–2029 (USD MILLION)
- TABLE 46 HOSPITALITY: AUTONOMOUS NETWORKS MARKET, BY REGION, 2018–2023 (USD MILLION)
- TABLE 47 HOSPITALITY: MARKET, BY REGION, 2024–2029 (USD MILLION)
- TABLE 48 EDUCATION: MARKET, BY REGION, 2018–2023 (USD MILLION)
- TABLE 49 EDUCATION: MARKET, BY REGION, 2024–2029 (USD MILLION)
- TABLE 50 GOVERNMENT: MARKET, BY REGION, 2018–2023 (USD MILLION)
- TABLE 51 GOVERNMENT: MARKET, BY REGION, 2024–2029 (USD MILLION)
- TABLE 52 HEALTHCARE: MARKET, BY REGION, 2018–2023 (USD MILLION)
- TABLE 53 HEALTHCARE: MARKET, BY REGION, 2024–2029 (USD MILLION)
- TABLE 54 TRANSPORTATION & LOGISTICS: MARKET, BY REGION, 2018–2023 (USD MILLION)
- TABLE 55 TRANSPORTATION & LOGISTICS: MARKET, BY REGION, 2024–2029 (USD MILLION)
- TABLE 56 OTHER VERTICALS: MARKET, BY REGION, 2018–2023 (USD MILLION)
- TABLE 57 OTHER VERTICALS: MARKET, BY REGION, 2024–2029 (USD MILLION)
- TABLE 58 MARKET, BY REGION, 2018–2023 (USD MILLION)
- TABLE 59 MARKET, BY REGION, 2024–2029 (USD MILLION)
- TABLE 60 NORTH AMERICA: AUTONOMOUS NETWORKS MARKET, BY OFFERING, 2018–2023 (USD MILLION)
- TABLE 61 NORTH AMERICA: MARKET, BY OFFERING, 2024–2029 (USD MILLION)
- TABLE 62 NORTH AMERICA: MARKET, BY SOLUTION, 2018–2023 (USD MILLION)
- TABLE 63 NORTH AMERICA: MARKET, BY SOLUTION, 2024–2029 (USD MILLION)
- TABLE 64 NORTH AMERICA: MARKET, BY SERVICE, 2018–2023 (USD MILLION)
- TABLE 65 NORTH AMERICA: MARKET, BY SERVICE, 2024–2029 (USD MILLION)
- TABLE 66 NORTH AMERICA: MARKET, BY END USER, 2018–2023 (USD MILLION)
- TABLE 67 NORTH AMERICA: MARKET, BY END USER, 2024–2029 (USD MILLION)
- TABLE 68 NORTH AMERICA: MARKET, BY VERTICAL, 2018–2023 (USD MILLION)
- TABLE 69 NORTH AMERICA: MARKET, BY VERTICAL, 2024–2029 (USD MILLION)
- TABLE 70 NORTH AMERICA: MARKET, BY COUNTRY, 2018–2023 (USD MILLION)
- TABLE 71 NORTH AMERICA: MARKET, BY COUNTRY, 2024–2029 (USD MILLION)
- TABLE 72 US: AUTONOMOUS NETWORKS MARKET, BY OFFERING, 2018–2023 (USD MILLION)
- TABLE 73 US: MARKET, BY OFFERING, 2024–2029 (USD MILLION)
- TABLE 74 US: MARKET, BY SOLUTION, 2018–2023 (USD MILLION)
- TABLE 75 US: MARKET, BY SOLUTION, 2024–2029 (USD MILLION)
- TABLE 76 US: MARKET, BY SERVICE, 2018–2023 (USD MILLION)
- TABLE 77 US: MARKET, BY SERVICE, 2024–2029 (USD MILLION)
- TABLE 78 US: MARKET, BY END USER, 2018–2023 (USD MILLION)
- TABLE 79 US: MARKET, BY END USER, 2024–2029 (USD MILLION)
- TABLE 80 US: MARKET, BY VERTICAL, 2018–2023 (USD MILLION)
- TABLE 81 US: MARKET, BY VERTICAL, 2024–2029 (USD MILLION)
- TABLE 82 EUROPE: AUTONOMOUS NETWORKS MARKET, BY OFFERING, 2018–2023 (USD MILLION)
- TABLE 83 EUROPE: MARKET, BY OFFERING, 2024–2029 (USD MILLION)
- TABLE 84 EUROPE: MARKET, BY SOLUTION, 2018–2023 (USD MILLION)
- TABLE 85 EUROPE: MARKET, BY SOLUTION, 2024–2029 (USD MILLION)
- TABLE 86 EUROPE: MARKET, BY SERVICE, 2018–2023 (USD MILLION)
- TABLE 87 EUROPE: MARKET, BY SERVICE, 2024–2029 (USD MILLION)
- TABLE 88 EUROPE: MARKET, BY END USER, 2018–2023 (USD MILLION)
- TABLE 89 EUROPE: MARKET, BY END USER, 2024–2029 (USD MILLION)
- TABLE 90 EUROPE: MARKET, BY VERTICAL, 2018–2023 (USD MILLION)
- TABLE 91 EUROPE: MARKET, BY VERTICAL, 2024–2029 (USD MILLION)
- TABLE 92 EUROPE: MARKET, BY COUNTRY, 2018–2023 (USD MILLION)
- TABLE 93 EUROPE: MARKET, BY COUNTRY, 2024–2029 (USD MILLION)
- TABLE 94 UK: AUTONOMOUS NETWORKS MARKET, BY OFFERING, 2018–2023 (USD MILLION)
- TABLE 95 UK: MARKET, BY OFFERING, 2024–2029 (USD MILLION)
- TABLE 96 UK: MARKET, BY SOLUTION, 2018–2023 (USD MILLION)
- TABLE 97 UK: MARKET, BY SOLUTION, 2024–2029 (USD MILLION)
- TABLE 98 UK: MARKET, BY SERVICE, 2018–2023 (USD MILLION)
- TABLE 99 UK: MARKET, BY SERVICE, 2024–2029 (USD MILLION)
- TABLE 100 UK: MARKET, BY END USER, 2018–2023 (USD MILLION)
- TABLE 101 UK: MARKET, BY END USER, 2024–2029 (USD MILLION)
- TABLE 102 UK: MARKET, BY VERTICAL, 2018–2023 (USD MILLION)
- TABLE 103 UK: MARKET, BY VERTICAL, 2024–2029 (USD MILLION)
- TABLE 104 ASIA PACIFIC: AUTONOMOUS NETWORKS MARKET, BY OFFERING, 2018–2023 (USD MILLION)
- TABLE 105 ASIA PACIFIC: MARKET, BY OFFERING, 2024–2029 (USD MILLION)
- TABLE 106 ASIA PACIFIC: MARKET, BY SOLUTION, 2018–2023 (USD MILLION)
- TABLE 107 ASIA PACIFIC: MARKET, BY SOLUTION, 2024–2029 (USD MILLION)
- TABLE 108 ASIA PACIFIC: MARKET, BY SERVICE, 2018–2023 (USD MILLION)
- TABLE 109 ASIA PACIFIC: MARKET, BY SERVICE, 2024–2029 (USD MILLION)
- TABLE 110 ASIA PACIFIC: MARKET, BY END USER, 2018–2023 (USD MILLION)
- TABLE 111 ASIA PACIFIC: MARKET, BY END USER, 2024–2029 (USD MILLION)
- TABLE 112 ASIA PACIFIC: MARKET, BY VERTICAL, 2018–2023 (USD MILLION)
- TABLE 113 ASIA PACIFIC: MARKET, BY VERTICAL, 2024–2029 (USD MILLION)
- TABLE 114 ASIA PACIFIC: MARKET, BY COUNTRY, 2018–2023 (USD MILLION)
- TABLE 115 ASIA PACIFIC: MARKET, BY COUNTRY, 2024–2029 (USD MILLION)
- TABLE 116 CHINA: AUTONOMOUS NETWORKS MARKET, BY OFFERING, 2018–2023 (USD MILLION)
- TABLE 117 CHINA: MARKET, BY OFFERING, 2024–2029 (USD MILLION)
- TABLE 118 CHINA: MARKET, BY SOLUTION, 2018–2023 (USD MILLION)
- TABLE 119 CHINA: MARKET, BY SOLUTION, 2024–2029 (USD MILLION)
- TABLE 120 CHINA: MARKET, BY SERVICE, 2018–2023 (USD MILLION)
- TABLE 121 CHINA: MARKET, BY SERVICE, 2024–2029 (USD MILLION)
- TABLE 122 CHINA: MARKET, BY END USER, 2018–2023 (USD MILLION)
- TABLE 123 CHINA: MARKET, BY END USER, 2024–2029 (USD MILLION)
- TABLE 124 CHINA: MARKET, BY VERTICAL, 2018–2023 (USD MILLION)
- TABLE 125 CHINA: MARKET, BY VERTICAL, 2024–2029 (USD MILLION)
- TABLE 126 MIDDLE EAST & AFRICA: AUTONOMOUS NETWORKS MARKET, BY OFFERING, 2018–2023 (USD MILLION)
- TABLE 127 MIDDLE EAST & AFRICA: MARKET, BY OFFERING, 2024–2029 (USD MILLION)
- TABLE 128 MIDDLE EAST & AFRICA: MARKET, BY SOLUTION, 2018–2023 (USD MILLION)
- TABLE 129 MIDDLE EAST & AFRICA: MARKET, BY SOLUTION, 2024–2029 (USD MILLION)
- TABLE 130 MIDDLE EAST & AFRICA: MARKET, BY SERVICE, 2018–2023 (USD MILLION)
- TABLE 131 MIDDLE EAST & AFRICA: MARKET, BY SERVICE, 2024–2029 (USD MILLION)
- TABLE 132 MIDDLE EAST & AFRICA: MARKET, BY END USER, 2018–2023 (USD MILLION)
- TABLE 133 MIDDLE EAST & AFRICA: MARKET, BY END USER, 2024–2029 (USD MILLION)
- TABLE 134 MIDDLE EAST & AFRICA: MARKET, BY VERTICAL, 2018–2023 (USD MILLION)
- TABLE 135 MIDDLE EAST & AFRICA: MARKET, BY VERTICAL, 2024–2029 (USD MILLION)
- TABLE 136 MIDDLE EAST & AFRICA: MARKET, BY SUBREGION, 2018–2023 (USD MILLION)
- TABLE 137 MIDDLE EAST & AFRICA: MARKET, BY SUBREGION, 2024–2029 (USD MILLION)
- TABLE 138 GCC COUNTRIES: AUTONOMOUS NETWORKS MARKET, BY OFFERING, 2018–2023 (USD MILLION)
- TABLE 139 GCC COUNTRIES: MARKET, BY OFFERING, 2024–2029 (USD MILLION)
- TABLE 140 GCC COUNTRIES: MARKET, BY SOLUTION, 2018–2023 (USD MILLION)
- TABLE 141 GCC COUNTRIES: MARKET, BY SOLUTION, 2024–2029 (USD MILLION)
- TABLE 142 GCC COUNTRIES: MARKET, BY SERVICE, 2018–2023 (USD MILLION)
- TABLE 143 GCC COUNTRIES: MARKET, BY SERVICE, 2024–2029 (USD MILLION)
- TABLE 144 GCC COUNTRIES: MARKET, BY END USER, 2018–2023 (USD MILLION)
- TABLE 145 GCC COUNTRIES: MARKET, BY END USER, 2024–2029 (USD MILLION)
- TABLE 146 GCC COUNTRIES: MARKET, BY VERTICAL, 2018–2023 (USD MILLION)
- TABLE 147 GCC COUNTRIES: MARKET, BY VERTICAL, 2024–2029 (USD MILLION)
- TABLE 148 GCC COUNTRIES: MARKET, BY COUNTRY, 2018–2023 (USD MILLION)
- TABLE 149 GCC COUNTRIES: MARKET, BY COUNTRY, 2024–2029 (USD MILLION)
- TABLE 150 LATIN AMERICA: AUTONOMOUS NETWORKS MARKET, BY OFFERING, 2018–2023 (USD MILLION)
- TABLE 151 LATIN AMERICA: MARKET, BY OFFERING, 2024–2029 (USD MILLION)
- TABLE 152 LATIN AMERICA: MARKET, BY SOLUTION, 2018–2023 (USD MILLION)
- TABLE 153 LATIN AMERICA: MARKET, BY SOLUTION, 2024–2029 (USD MILLION)
- TABLE 154 LATIN AMERICA: MARKET, BY SERVICE, 2018–2023 (USD MILLION)
- TABLE 155 LATIN AMERICA: MARKET, BY SERVICE, 2024–2029 (USD MILLION)
- TABLE 156 LATIN AMERICA: MARKET, BY END USER, 2018–2023 (USD MILLION)
- TABLE 157 LATIN AMERICA: MARKET, BY END USER, 2024–2029 (USD MILLION)
- TABLE 158 LATIN AMERICA: MARKET, BY VERTICAL, 2018–2023 (USD MILLION)
- TABLE 159 LATIN AMERICA: MARKET, BY VERTICAL, 2024–2029 (USD MILLION)
- TABLE 160 LATIN AMERICA: MARKET, BY COUNTRY, 2018–2023 (USD MILLION)
- TABLE 161 LATIN AMERICA: MARKET, BY COUNTRY, 2024–2029 (USD MILLION)
- TABLE 162 BRAZIL: AUTONOMOUS NETWORKS MARKET, BY OFFERING, 2018–2023 (USD MILLION)
- TABLE 163 BRAZIL: MARKET, BY OFFERING, 2024–2029 (USD MILLION)
- TABLE 164 BRAZIL: MARKET, BY SOLUTION, 2018–2023 (USD MILLION)
- TABLE 165 BRAZIL: MARKET, BY SOLUTION, 2024–2029 (USD MILLION)
- TABLE 166 BRAZIL: MARKET, BY SERVICE, 2018–2023 (USD MILLION)
- TABLE 167 BRAZIL: MARKET, BY SERVICE, 2024–2029 (USD MILLION)
- TABLE 168 BRAZIL: MARKET, BY END USER, 2018–2023 (USD MILLION)
- TABLE 169 BRAZIL: MARKET, BY END USER, 2024–2029 (USD MILLION)
- TABLE 170 BRAZIL: MARKET, BY VERTICAL, 2018–2023 (USD MILLION)
- TABLE 171 BRAZIL: MARKET, BY VERTICAL, 2024–2029 (USD MILLION)
- TABLE 172 MARKET: DEGREE OF COMPETITION
- TABLE 173 OFFERING FOOTPRINT
- TABLE 174 END-USER FOOTPRINT
- TABLE 175 REGIONAL FOOTPRINT
- TABLE 176 MARKET: KEY START-UPS/SMES
- TABLE 177 MARKET: COMPETITIVE BENCHMARKING OF KEY START-UPS/SMES
- TABLE 178 MARKET: PRODUCT LAUNCHES, FEBRUARY 2022–APRIL 2024
- TABLE 179 AUTONOMOUS NETWORKS MARKET: DEALS, FEBRUARY 2020–MAY 2024
- TABLE 180 NOKIA: BUSINESS OVERVIEW
- TABLE 181 NOKIA: PRODUCTS/SOLUTIONS/SERVICES OFFERED
- TABLE 182 NOKIA: DEALS
- TABLE 183 HPE: BUSINESS OVERVIEW
- TABLE 184 HPE: PRODUCTS/SOLUTIONS/SERVICES OFFERED
- TABLE 185 HPE: PRODUCT LAUNCHES
- TABLE 186 HPE: DEALS
- TABLE 187 CISCO SYSTEMS, INC.: BUSINESS OVERVIEW
- TABLE 188 CISCO SYSTEMS, INC.: PRODUCTS/SOLUTIONS/SERVICES OFFERED
- TABLE 189 CISCO SYSTEMS, INC.: DEALS
- TABLE 190 ARISTA NETWORKS: BUSINESS OVERVIEW
- TABLE 191 ARISTA NETWORKS: PRODUCTS/SOLUTIONS/SERVICES OFFERED
- TABLE 192 ARISTA NETWORKS: PRODUCT LAUNCHES
- TABLE 193 ARISTA NETWORKS: DEALS
- TABLE 194 BROADCOM: BUSINESS OVERVIEW
- TABLE 195 BROADCOM: PRODUCTS/SOLUTIONS/SERVICES OFFERED
- TABLE 196 BROADCOM: PRODUCT LAUNCHES
- TABLE 197 BROADCOM: DEALS
- TABLE 198 ERICSSON: BUSINESS OVERVIEW
- TABLE 199 ERICSSON: PRODUCTS/SOLUTIONS/SERVICES OFFERED
- TABLE 200 ERICSSON: DEALS
- TABLE 201 NEC CORPORATION: BUSINESS OVERVIEW
- TABLE 202 NEC CORPORATION: PRODUCTS/SOLUTIONS/SERVICES OFFERED
- TABLE 203 NEC CORPORATION: PRODUCT LAUNCHES
- TABLE 204 NEC CORPORATION: DEALS
- TABLE 205 HUAWEI TECHNOLOGIES CO., LTD.: BUSINESS OVERVIEW
- TABLE 206 HUAWEI TECHNOLOGIES CO., LTD.: PRODUCTS/SOLUTIONS/SERVICES OFFERED
- TABLE 207 HUAWEI TECHNOLOGIES CO., LTD.: PRODUCT LAUNCHES
- TABLE 208 IBM CORPORATION: BUSINESS OVERVIEW
- TABLE 209 IBM CORPORATION: PRODUCTS/SOLUTIONS/SERVICES OFFERED
- TABLE 210 CIENA CORPORATION: BUSINESS OVERVIEW
- TABLE 211 CIENA CORPORATION: PRODUCTS/SOLUTIONS/SERVICES OFFERED
- TABLE 212 EXTREME NETWORKS: BUSINESS OVERVIEW
- TABLE 213 EXTREME NETWORKS: PRODUCTS/SOLUTIONS/SERVICES OFFERED
- TABLE 214 NETWORK AUTOMATION MARKET, BY COMPONENT, 2014–2019 (USD MILLION)
- TABLE 215 NETWORK AUTOMATION MARKET, BY COMPONENT, 2020–2025 (USD MILLION)
- TABLE 216 NETWORK AUTOMATION MARKET, BY SOLUTION, 2014–2019 (USD MILLION)
- TABLE 217 NETWORK AUTOMATION MARKET, BY SOLUTION, 2020–2025 (USD MILLION)
- TABLE 218 NETWORK AUTOMATION MARKET, BY PROFESSIONAL SERVICE, 2014–2019 (USD MILLION)
- TABLE 219 NETWORK AUTOMATION MARKET, BY PROFESSIONAL SERVICE, 2020–2025 (USD MILLION)
- TABLE 220 NETWORK AUTOMATION MARKET, BY NETWORK TYPE, 2014–2019 (USD MILLION)
- TABLE 221 NETWORK AUTOMATION MARKET, BY NETWORK TYPE, 2020–2025 (USD MILLION)
- TABLE 222 NETWORK AUTOMATION MARKET, BY DEPLOYMENT MODE, 2014–2019 (USD MILLION)
- TABLE 223 NETWORK AUTOMATION MARKET, BY DEPLOYMENT MODE, 2020–2025 (USD MILLION)
- TABLE 224 NETWORK AUTOMATION MARKET, BY END USER, 2014–2019 (USD MILLION)
- TABLE 225 NETWORK AUTOMATION MARKET, BY END USER, 2020–2025 (USD MILLION)
- TABLE 226 NETWORK AUTOMATION MARKET, BY ORGANIZATION SIZE, 2014–2019 (USD MILLION)
- TABLE 227 NETWORK AUTOMATION MARKET, BY ORGANIZATION SIZE, 2020–2025 (USD MILLION)
- TABLE 228 NETWORK AUTOMATION MARKET, BY ENTERPRISE VERTICAL, 2014–2019 (USD MILLION)
- TABLE 229 NETWORK AUTOMATION MARKET, BY ENTERPRISE VERTICAL, 2020–2025 (USD MILLION)
- TABLE 230 NETWORK AUTOMATION MARKET, BY REGION, 2014–2019 (USD MILLION)
- TABLE 231 NETWORK AUTOMATION MARKET, BY REGION, 2020–2025 (USD MILLION)
- TABLE 232 NETWORK MANAGEMENT SYSTEM MARKET, BY COMPONENT, 2016–2021 (USD MILLION)
- TABLE 233 NETWORK MANAGEMENT SYSTEM MARKET, BY COMPONENT, 2022–2027 (USD MILLION)
- TABLE 234 NETWORK MANAGEMENT SOLUTIONS MARKET, BY TYPE, 2016–2021 (USD MILLION)
- TABLE 235 NETWORK MANAGEMENT SOLUTIONS MARKET, BY TYPE, 2022–2027 (USD MILLION)
- TABLE 236 NETWORK MANAGEMENT SERVICES MARKET, BY TYPE, 2016–2021 (USD MILLION)
- TABLE 237 NETWORK MANAGEMENT SERVICES MARKET, BY TYPE, 2022–2027 (USD MILLION)
- TABLE 238 NETWORK MANAGEMENT SYSTEM MARKET, BY DEPLOYMENT TYPE, 2016–2021 (USD MILLION)
- TABLE 239 NETWORK MANAGEMENT SYSTEM MARKET, BY DEPLOYMENT TYPE, 2022–2027 (USD MILLION)
- TABLE 240 NETWORK MANAGEMENT SYSTEM MARKET, BY ORGANIZATION SIZE, 2016–2021 (USD MILLION)
- TABLE 241 NETWORK MANAGEMENT SYSTEM MARKET, BY ORGANIZATION SIZE, 2022–2027 (USD MILLION)
- TABLE 242 NETWORK MANAGEMENT SYSTEM MARKET, BY END USER, 2016–2021 (USD MILLION)
- TABLE 243 NETWORK MANAGEMENT SYSTEM MARKET, BY END USER, 2022–2027 (USD MILLION)
- TABLE 244 NETWORK MANAGEMENT SYSTEM MARKET, BY SERVICE PROVIDER, 2016–2021 (USD MILLION)
- TABLE 245 NETWORK MANAGEMENT SYSTEM MARKET, BY SERVICE PROVIDER, 2022–2027 (USD MILLION)
- TABLE 246 NETWORK MANAGEMENT SYSTEM MARKET, BY VERTICAL, 2016–2021 (USD MILLION)
- TABLE 247 NETWORK MANAGEMENT SYSTEM MARKET, BY VERTICAL, 2022–2027 (USD MILLION)
- TABLE 248 NETWORK MANAGEMENT SYSTEM MARKET, BY REGION, 2016–2021 (USD MILLION)
- TABLE 249 NETWORK MANAGEMENT SYSTEM MARKET, BY REGION, 2022–2027 (USD MILLION)
- FIGURE 1 AUTONOMOUS NETWORKS MARKET SEGMENTATION
- FIGURE 2 MARKET: RESEARCH DESIGN
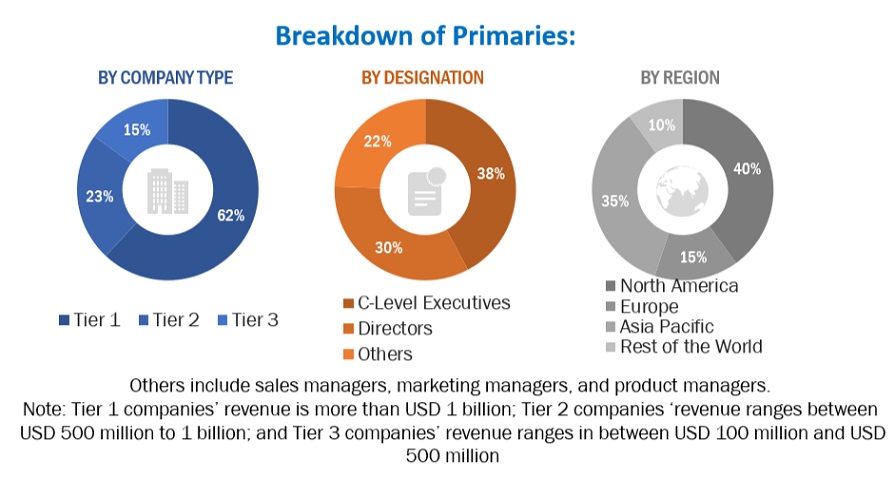
- FIGURE 3 BREAKDOWN OF PRIMARY INTERVIEWS: BY COMPANY TYPE, DESIGNATION, AND REGION
- FIGURE 4 DATA TRIANGULATION
- FIGURE 5 TOP-DOWN APPROACH
- FIGURE 6 MARKET SIZE ESTIMATION METHODOLOGY – APPROACH 1 (SUPPLY SIDE): REVENUE OF VENDORS IN MARKET
- FIGURE 7 BOTTOM-UP APPROACH
- FIGURE 8 MARKET SIZE ESTIMATION METHODOLOGY: DEMAND-SIDE ANALYSIS
- FIGURE 9 BOTTOM-UP (SUPPLY SIDE) ANALYSIS: COLLECTIVE REVENUE FROM SOLUTIONS/SERVICES OF MARKET
- FIGURE 10 MARKET TO WITNESS SIGNIFICANT GROWTH DURING FORECAST PERIOD
- FIGURE 11 AUTONOMOUS NETWORKS MARKET: REGIONAL SNAPSHOT
- FIGURE 12 AGING NETWORK INFRASTRUCTURE AND RISING DEMAND FOR NETWORK EFFICIENCY AND AUTOMATION TO DRIVE MARKET
- FIGURE 13 TOP GROWING SEGMENTS IN MARKET IN 2024
- FIGURE 14 SERVICES SEGMENT TO HOLD HIGHER GROWTH RATE DURING FORECAST PERIOD
- FIGURE 15 SERVICE PROVIDERS SEGMENT TO ACCOUNT FOR LARGER MARKET SHARE IN 2024
- FIGURE 16 SOLUTIONS AND SERVICE PROVIDERS SEGMENTS TO ACCOUNT FOR LARGEST MARKET SHARES IN NORTH AMERICA IN 2024
- FIGURE 17 DRIVERS, RESTRAINTS, OPPORTUNITIES, AND CHALLENGES: MARKET
- FIGURE 18 EVOLUTION OF AUTONOMOUS NETWORKS
- FIGURE 19 KEY PLAYERS IN MARKET ECOSYSTEM
- FIGURE 20 MARKET: VALUE CHAIN ANALYSIS
- FIGURE 21 AVERAGE PRICING ANALYSIS OF KEY PLAYERS, BY SOLUTION (USD)
- FIGURE 22 LIST OF MAJOR PATENTS FOR AUTONOMOUS NETWORKS
- FIGURE 23 AUTONOMOUS NETWORKS MARKET: DISRUPTIONS IMPACTING CUSTOMERS’ BUSINESSES
- FIGURE 24 INFLUENCE OF STAKEHOLDERS ON BUYING PROCESS FOR END USERS
- FIGURE 25 KEY BUYING CRITERIA FOR TOP NETWORK OPERATORS
- FIGURE 26 SERVICES SEGMENT TO GROW AT HIGHER CAGR DURING FORECAST PERIOD
- FIGURE 27 VERTICALS SEGMENT TO GROW AT HIGHER CAGR DURING FORECAST PERIOD
- FIGURE 28 NORTH AMERICA: MARKET SNAPSHOT
- FIGURE 29 ASIA PACIFIC: MARKET SNAPSHOT
- FIGURE 30 REVENUE ANALYSIS FOR KEY COMPANIES IN PAST FIVE YEARS
- FIGURE 31 SHARE OF LEADING COMPANIES IN MARKET, 2023
- FIGURE 32 MARKET RANKING ANALYSIS OF TOP FIVE PLAYERS
- FIGURE 33 MARKET: COMPANY EVALUATION MATRIX (KEY PLAYERS), 2023
- FIGURE 34 OVERALL COMPANY FOOTPRINT
- FIGURE 35 AUTONOMOUS NETWORKS MARKET: COMPANY EVALUATION MATRIX (START-UPS/SMES), 2023
- FIGURE 36 BRAND/PRODUCT COMPARISON ANALYSIS
- FIGURE 37 FINANCIAL METRICS OF KEY AUTONOMOUS NETWORKS VENDORS
- FIGURE 38 COMPANY VALUATION OF KEY AUTONOMOUS NETWORKS VENDORS
- FIGURE 39 NOKIA: COMPANY SNAPSHOT
- FIGURE 40 HPE: COMPANY SNAPSHOT
- FIGURE 41 CISCO SYSTEMS, INC.: COMPANY SNAPSHOT
- FIGURE 42 ARISTA NETWORKS: COMPANY SNAPSHOT
- FIGURE 43 BROADCOM: COMPANY SNAPSHOT
- FIGURE 44 ERICSSON: COMPANY SNAPSHOT
- FIGURE 45 NEC CORPORATION: COMPANY SNAPSHOT
- FIGURE 46 HUAWEI TECHNOLOGIES CO., LTD.: COMPANY SNAPSHOT
- FIGURE 47 IBM CORPORATION: COMPANY SNAPSHOT
- FIGURE 48 CIENA CORPORATION: COMPANY SNAPSHOT
- FIGURE 49 EXTREME NETWORKS: COMPANY SNAPSHOT
This research study involved the extensive use of secondary sources, directories, and databases, such as Dun & Bradstreet (D&B) Hoovers and Bloomberg BusinessWeek, to identify and collect information useful for a technical, market-oriented, and commercial study of the autonomous networks market. The primary sources have been mainly industry experts from the core and related industries and preferred suppliers, manufacturers, distributors, service providers, technology developers, alliances, and organizations related to all segments of the value chain of this market. In-depth interviews have been conducted with various primary respondents, including key industry participants, subject matter experts, C-level executives of key market players, and industry consultants to obtain and verify critical qualitative and quantitative information.
Secondary Research
The market for companies offering autonomous networks solutions and services to different verticals has been estimated and projected based on the secondary data made available through paid and unpaid sources, as well as by analyzing their product portfolios in the ecosystem of the autonomous networks market. It also involved rating company products based on their performance and quality. In the secondary research process, various sources such as Autonomous Networks Summit 2024, and Network Automation Congress 2023 have been referred to for identifying and collecting information for this study on the autonomous networks market. The secondary sources included annual reports, press releases investor presentations of companies, white papers, journals, and certified publications and articles by recognized authors, directories, and databases. Secondary research has been mainly used to obtain key information about the supply chain of the market, the total pool of key players, market classification, segmentation according to industry trends to the bottommost level, regional markets, and key developments from both market- and technology-oriented perspectives that have been further validated by primary sources.
Primary Research
In the primary research process, various primary sources from both the supply and demand sides were interviewed to obtain qualitative and quantitative information on the market. The primary sources from the supply side included various industry experts, including Chief Experience Officers (CXOs); Vice Presidents (VPs); directors from business development, marketing, and product development/innovation teams; related key executives from autonomous networks solution vendors, SIs, professional service providers, and industry associations; and key opinion leaders. Primary interviews were conducted to gather insights, such as market statistics, revenue data collected from solutions and services, market breakups, market size estimations, market forecasts, and data triangulation. Primary research also helped understand various trends related to technologies, applications, deployments, and regions. Stakeholders from the demand side, such as Chief Information Officers (CIOs), Chief Technology Officers (CTOs), Chief Strategy Officers (CSOs), and end users using autonomous networks solutions, were interviewed to understand the buyer’s perspective on suppliers, products, service providers, and their current usage of autonomous networks solutions which would impact the overall autonomous networks market.
To know about the assumptions considered for the study, download the pdf brochure
Market Size Estimation
Multiple approaches were adopted to estimate and forecast the size of the autonomous networks market. The first approach involves estimating market size by summing up the revenue generated by companies through the sale of autonomous networks offerings.
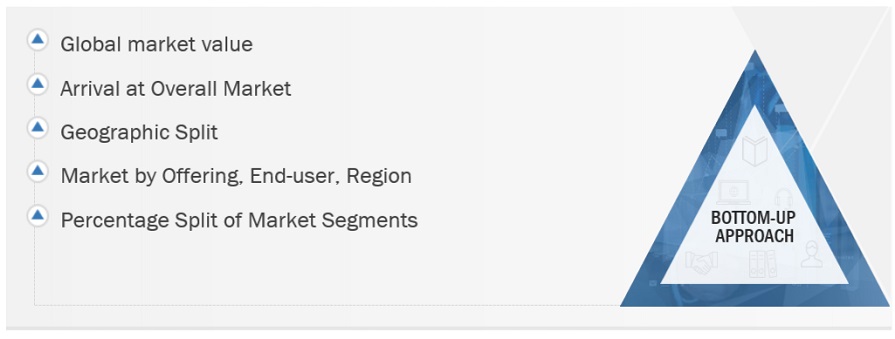
Both top-down and bottom-up approaches were used to estimate and validate the total size of the autonomous networks market. These methods were extensively used to estimate the size of various segments in the market. The research methodology used to estimate the market size includes the following:
- Key players in the market have been identified through extensive secondary research.
- In terms of value, the industry’s supply chain and market size have been determined through primary and secondary research processes.
- All percentage shares, splits, and breakups have been determined using secondary sources and verified through primary sources.
Autonomous Networks Market Size: Bottom-Up Approach
To know about the assumptions considered for the study, Request for Free Sample Report
Autonomous Networks Market Size: Top-Down Approach
Data Triangulation
After arriving at the overall market size, the autonomous networks market was divided into several segments and subsegments. A data triangulation procedure was used to complete the overall market engineering process and arrive at the exact statistics for all segments and subsegments, wherever applicable. The data was triangulated by studying various factors and trends from the demand and supply sides. Along with data triangulation and market breakdown, the market size was validated by the top-down and bottom-up approaches.
Market Definition
An autonomous network refers to a communication network that can operate and optimize itself without human intervention. This type of network relies on advanced technologies such as machine learning algorithms, artificial intelligence, and automation to enable efficient and reliable operations. An autonomous network is a new model that uses built in artificial intelligence (AI), machine learning (ML), and advanced analytics to automate its operations and functions.
Key Stakeholders
- Autonomous Networks solution providers
- Telecommunication providers
- Cloud service providers
- Third-party network testing service providers
- Enterprise data center professionals
- Information Technology (IT) suppliers
- Consultancy firms and advisory firms
- Regulatory agencies
- Technology consultants
Report Objectives
- To determine and forecast the global autonomous networks market based on offering, end-user, and region from 2024 to 2029, and analyze the various macro and microeconomic factors that affect the market growth
- To forecast the size of the market segments with respect to five key regions: North America, Europe, Asia Pacific (APAC), Latin America, and Middle East and Africa (MEA)
- To provide detailed information related to the major factors (drivers, opportunities, and challenges) influencing the growth of the market
- To analyze each submarket with respect to the individual growth trends, prospects, and contributions to the total market
- To analyze opportunities in the market for stakeholders by identifying the high-growth segments of the autonomous networks market
- To profile the key market players comprising top vendors and startups, provide comparative analysis based on business overviews, regional presence, product offerings, business strategies, and key financials, and illustrate the competitive landscape
- To track and analyze competitive developments, such as mergers and acquisitions, product developments, partnerships and collaborations, and Research & Development (R&D) activities, in the market
Available Customizations
With the given market data, MarketsandMarkets offers customizations as per the company’s specific needs. The following customization options are available for the report:
Country-wise information
- Analysis for additional countries (up to five)
Company Information
- Detailed analysis and profiling of additional market players (up to 5)
Geographic Analysis
- Further breakup of the Asia Pacific market into countries contributing 75% to the regional market size
- Further breakup of the North American market into countries contributing 75% to the regional market size
- Further breakup of the Latin American market into countries contributing 75% to the regional market size
- Further breakup of the Middle East & Africa market into countries contributing 75% to the regional market size
- Further breakup of the European market into countries contributing 75% to the regional market size
Growth opportunities and latent adjacency in Autonomous Networks Market