Automotive Paints Market Size, Share & Trends [2030]

Automotive Paints Market by Type (E-coat, Primer, Basecoat, Clearcoat), Resin (PU, Epoxy, Acrylic), Technology (Solvent, Water, Powder), Paint Equipment (Airless, Electrostatic), Texture, Content, ICE & EVs, Refinish and Region - Global Forecast to 2028

Report Code: AT 2118 Dec, 2023, by marketsandmarkets.com

[319 Pages Report] The automotive paints market is projected to grow from USD 8.4 billion in 2023 to USD 9.9 billion by 2028, at a CAGR of 3.2%. The key factors driving the automotive paints is increase in production of passenger cars, EVS and increase in sales of SUVs is driving. Also, there is increase in adoption for powder coating and water-borne coating technologies in automotive sector to reduce the environmental impact. Hence these factors is driving the automotive paints market.

Automotive Paints Market

To know about the assumptions considered for the study, Request for Free Sample Report

Automotive Paints Market Opportunities

To know about the assumptions considered for the study, download the pdf brochure

Market Dynamics

DRIVER: Stringent emission regulations has forced key players to produce sustainable and low-VOC paints

As environmental concerns and regulations intensify, the automotive industry is facing increasing pressure to reduce its environmental footprint. One of the key areas of focus is reducing volatile organic compound (VOC) emissions from automotive paints, which are a significant contributor to air pollution. To address this challenge, governing bodies worldwide are implementing stringent emission norms that mandate lower VOC content in automotive paints. These stringent emission norms are having a profound impact on the automotive paints industry, forcing manufacturers to invest heavily in research and development (R&D) to develop new, low-VOC paints. The primary focus of R&D efforts is on developing innovative technologies that significantly reduce VOC emissions from automotive paints. This includes advancements in waterborne paints, which use water as the primary solvent instead of traditional organic solvents, resulting in lower VOC emissions. Additionally, high-solids paints, which contain a higher concentration of solids and less solvent, are being explored as a promising alternative.

The overall impact of stringent emission norms on the automotive paints industry is undeniably positive. These norms are acting as a catalyst for innovation, driving manufacturers to invest in R&D and develop new, environmentally friendly, and durable automotive paints. To comply with the stringent emission norms set by governing bodies, key players in the automotive paint industry are investing heavily in research and development (R&D) to develop new, low-VOC paints and enhance the overall sustainability of their products. There was a significant shift towards waterborne paints, which utilize water as the primary solvent instead of traditional organic solvents, resulting in substantially lower VOC emissions. Companies like Axalta Coating Systems, LLC, PPG Industries, Inc., and BASF SE are actively investing in developing waterborne paint technologies that meet the performance and durability requirements of the automotive industry.

Overall, the stringent emission norms are a key driving force behind the R&D surge in the automotive paints industry. These norms are pushing manufacturers to develop innovative solutions that reduce VOC emissions, enhance paint durability, and promote sustainable practices. This R&D drive is shaping the future of automotive paints, ensuring a more environmentally conscious and technologically advanced industry.

RESTRAINT: Advancements in autonomous technologies reduce accidents, restricting refinish market

An increase in road accidents is a pressing concern for automobile manufacturers and governments. The National Highway Traffic Safety Administration (NHTSA) reported a increase of 0.3% in traffic-related fatalities in the US in 2022, estimating that approximately 42,795 individuals lost their lives in crashes. On average, this equated to 117 deaths occurring daily on the roads throughout the year. Over the past decade, there has been a significant surge of 30% in traffic fatalities, resulting in nearly 10,000 more deaths compared to the figures in 2013, which stood at 32,893. However, the automotive industry is witnessing a rapid integration of safety features. The demand for these features will increase exponentially in the coming years.

New safety features such as ADAS, pedestrian detection systems, and automated emergency calling (eCall) are making vehicles safer than before. In response, the number of accidents is declining, which, in turn, is restricting the growth of the automotive refinish market. A study by the NHTSA found that autonomous emergency braking (AEB) systems can reduce rear-end collisions by up to 40%. Another study by the Insurance Institute for Highway Safety (IIHS) found that lane departure warning (LDW) systems can reduce lane departure crashes by up to 11%. A study by the National Institute of Justice also suggests that eCall systems can reduce the time it takes for emergency services to arrive at the scene of a crash by up to 50%.

The advent of ADAs and autonomous driving along with vehicle connectivity are aimed towards reducing the number of accidents, which may affect the aftermarket consumption of automotive paints.

OPPORTUNITY: Booming sales of SUVs

The popularity of SUVs can be attributed to their versatility, offering spaciousness, comfort, and security due to their larger size and higher driving position. They cater to diverse consumer needs, both for urban and off-road use. The evolution of SUV designs has seen a shift towards more stylish and sleek models, appealing to a wider demographic beyond traditional off-road enthusiasts. This increased demand for SUVs has significantly impacted the automotive paints market. These vehicles require more paint due to their larger surface areas and come in a wide array of colors and finishes. As a result, automotive paint manufacturers have a significant opportunity to meet the demands of this expanding market segment.

Additionally, SUVs are often used in challenging environments, such as off-road trails and dusty roads, which means they need to be protected with durable and scratch-resistant paint. Automotive paint manufacturers are developing new products to meet these needs, such as ceramic-infused paints that are harder and more scratch-resistant than traditional paints. The demand for more unique and eye-catching paint colors and finishes is also increasing, as SUVs are often associated with luxury and adventure. In response, automotive paint manufacturers are developing new colors and finishes, including matte, satin, and pearlescent paints.

According to MarketsandMarkets analysis, the SUV market was worth 885.8 billion in 2022 and is expected to reach up to 1,221.5 billion in 2027 at a CAGR of 6.6%. This surge in SUV popularity has stimulated the automotive paint industry, creating new opportunities for paint manufacturers to cater to the growing demands of SUV owners and the automotive market. By developing new and innovative products, automotive paint manufacturers are well-positioned to capitalize on the growth of the SUV market in the coming years.

CHALLENGE: Rapidly changing consumer preferences

The automotive paint industry serves both OEMs and the aftermarket. The demand for paints from OEMs has increased due to the rise in vehicle production, while the aftermarket has seen an increase in demand due to shifting consumer preferences and an increase in the number of vehicles on the road. Customers are becoming more aware of leading paint brands and are upgrading from local automotive paint manufacturers to premium manufacturers like Axalta, AkzoNobel, and Sherwin-Williams. Emerging economies are playing a crucial role in changing consumer preferences. Rapid income growth, increasing urbanization, a larger share of the young population, and a preference for spending rather than saving are some of the macro indicators. These factors have led to the rapid growth of the automotive industry, which is reflected in the automotive paints market.

Over time, consumer preferences for colors are also changing. Customers are now choosing organized players as they are becoming more conscious of brand and product quality. People are changing the paint on their vehicles to make a style statement. OEMs are providing cars with various pleasant colors as customers demand more variety in colors. However, it is challenging for paint manufacturers and OEMs to meet the varied demands of customers in different markets. Hence, they have to stick to a limited product portfolio, which may not be able to fulfill the needs of all customers in the market. Therefore, catering to the preferences of a large customer base is a challenge for the automotive paint industry.

Automotive Paint Market Ecosystem.

The major companies in the automotive paints market have the latest technologies, diversified portfolios, and strong distribution networks globally. The major players in the automotive paints market include Axalta Coating System, LLC. (US), PPG Industries, Inc. (US), Akzo Nobel N.V. (Netherlands), The Sherwin Williams Company (US), and BASF SE (Germany).

Top Companies in Automotive Paints Market

The solvent-borne paint segment, by technology type, holds the largest market share.

Solvent-borne paints have traditionally held the highest market share in automotive paint technology due to several advantages that have made them the preferred choice for many automotive manufacturers. While waterborne paints are gaining traction due to their environmental benefits, solvent-borne paints still offer several advantages such as superior durability & adhesion, easier to spray, faster drying time, and has wider range of colors and finishes that make them a popular choice.

For instance, A study by the Automotive Industry Action Group found that solvent-borne paints typically dry within 15-30 minutes, while waterborne paints can take up to several hours to fully cure. This difference in drying time can significantly impact production throughput. Also, solvent-borne paints generally exhibit better flow and leveling properties compared to waterborne paints, which gets spread more evenly on the surface, resulting in a smoother and more uniform finish. Hence, due to despite emergence of waterborne paints, solvent-borne paints continue to hold a significant share of the automotive paint market due to their superior performance, efficiency, and versatility, making them a crucial component in the automotive manufacturing process.

The electrostatic spray gun is the fastest-growing segment in painting equipment type for automotive paint market.

Electrostatic spray guns are rapidly gaining traction as the preferred choice for automotive paint applications due to their ability to improve efficiency, minimize paint waste, and improve overall paint quality. This has propelled them to become the fastest-growing segment in the automotive paints market. Electrostatic spray guns utilize an electrostatic charge to attract paint particles towards the target surface, resulting in a transfer efficiency of up to 98%. This significantly exceeds the 40-60% efficiency of conventional spray guns. The improved transfer efficiency translates into reduced paint waste, lower material costs, and minimized environmental impact. A study by the National Institute for Occupational Safety and Health (NIOSH) revealed that electrostatic spray guns can reduce paint consumption by up to 50%, leading to substantial cost savings for automotive manufacturers.

The electrostatic charge ensures an even distribution of paint particles, resulting in a smoother, more uniform finish. This minimizes defects like runs and sags, enhancing the overall appearance and durability of vehicles. The faster drying times and reduced overspray associated with electrostatic spray guns enable quicker production cycles and reduced downtime for automotive manufacturers. This efficiency boost contributes to increased productivity and lower production costs. Hence, the electrostatic spray guns have revolutionized the automotive paints market due to their ability to enhance transfer efficiency, minimize paint waste, improve paint quality, and increase production efficiency. These advantages have solidified their position as the fastest-growing segment in the market, driving their rapid adoption and transforming automotive painting processes worldwide.

Epoxy Resin holds the second largest market share automotive resin type of automotive paints.

Epoxy resin is the second most widely used resin type in automotive paints after polyurethane. It is a thermosetting resin, which means that it undergoes an irreversible chemical reaction when cured, resulting in a hard, durable film. Epoxy resins are known for their excellent adhesion, corrosion resistance, and chemical resistance. They are also relatively hard and have good impact resistance.  Epoxy resin is a versatile and valuable material for automotive paints. It is expected to continue to be a major player in the automotive paint market for many years to come.

The refinishing of vehicles is a significant driving force behind the expanding market for epoxy resins in automotive paints. Epoxy paints provide several advantages over conventional paints, making them a popular choice for refinishing damaged or aged vehicles. Epoxy resins have also been favored for vehicle refinishing by both professional body shops and DIY enthusiasts. According to a primary, the refinishing market is expected to continue expanding in the coming years, driven by the increasing demand for durable, environmentally friendly, and high-performance paint solutions. Hence due to these factors has epoxy resin holds the second largest market for automobile resin type.

Asia Pacific holds the largest share in the automotive paints market.

The rapid adoption of electric vehicles (EVs) in the Asia Pacific region is driving demand for specialized automotive paints that can withstand the unique challenges of EV batteries and lightweight materials. Governments across the region are incentivizing EV adoption through subsidies and tax breaks, further fueling the demand for EV-specific paints. For instance, China, the world's largest EV market, offers generous subsidies to EV manufacturers and consumers. This has led to an explosion in EV sales, with China accounting for over 60% of global EV sales in 2022 according to The International Council on Clean Transport (ICCT). Similarly, India is also implementing policies to promote EV adoption. The Indian government has set ambitious targets for EV sales, aiming to have 30% of all new car sales be EVs by 2030.

Also, the rising popularity of SUVs in the Asia Pacific region is fueling the demand for automotive paints. On the same note, the market for SUVs in projected to grow from USD 885.8 billion in 2022 to USD 1,221.7 billion in 2027. SUVs are larger and more complex vehicles than traditional passenger cars, requiring more paint to cover their extensive surfaces. This region has major key players namely,  Nippon Paint Holdings Company LTD (Japan), PPG Asian (India), Kansai Paint Co Ltd (Japan), Berger Paints (India), KCC Corporation (South Korea). These players are actively acquiring the other small players or investing in technology to cater the increasing demand from the automakers. For instance, Nippon Paint is establishing a new manufacturing facility in Okayama, Japan, and has started the production form the second half of 2023 for manufacturing a range of coatings, including auto OEM topcoats, plastic coatings, and other specialized coatings. Hence these factors is driving the automotive paints market in Asia Pacific region.

Asia Pacific Automotive Paints Market Size, and Share

Key Market Players

Major manufacturers in the Automotive paints market include PPG Industries LLC. (US), Axalta Coating Systems LLC, (US), Akzo Nobel N.V. (Netherlands), BASF SE (Germany), The Sherwin Williams Company (US), Valspar (US), DOW Chemical (US), 3M (US), and KCC (South Korea).

Want to explore hidden markets that can drive new revenue in Automotive Paints Market?

Scope of the Report

Report Attribute

Details

Market size available for years

2019–2028

Base year considered

2022

Market Growth forecast 

USD 9.89 Billion by 2028 from USD 8.45 Billion in 2023 at 3.2% CAGR

Forecast period

2023–2028

Forecast units

Value (USD Million/Billion)

Segments Covered

By Paint type, ByTechnology type, By Resin type, By Texture type, By Electric & Hybrid Vehicle type, By Vehicle type, By Content type, By Resin Refinish Paint type, By Painting Equipment

Geographies covered

Asia Pacific, North America, Europe, and Rest of the World.

Top Players

PPG Industries LLC. (US), Axalta Coating Systems LLC, (US), Akzo Nobel N.V. (Netherlands), BASF SE (Germany), The Sherwin Williams Company (US), Valspar (US), DOW Chemical (US), 3M (US), and KCC (South Korea).
A total of 20 other major players covered

With the given market data, MarketsandMarkets offers customizations per the company’s specific needs.

The study segments the usage based insurance market:

Automotive Paints Market, By Paint Type
  • Electrocoat
  • Basecoat
  • Primer
  • Clearcoat
Automotive Paints Market, By Technology Type
  • Solvent Borne
  • Waterborne
  • Powder Coating
Automotive Paints Market, By Resin Type
  • Polyurethane
  • Epoxy
  • Acrylic
  • Other Resins
Automotive Paints Market, By Texture Type
  • Solid Texture
  • Metallic Texture
  • Matte Finish Paints
  • Pearlescent Paints
  • Solar Reflective Paints
Automotive Paints Market, By Content Type
  • Petroleum-Based Solvent
  • Resins & Binders
  • Pigments & Colorants
  • Silicone Polymers & Other Additives
Automotive Paints Market, By Painting Equipment Type
  • Airless Spray Gun
  • Electrostatic Spray Gun
Automotive Paints Market, By Vehicle Type
  • Passenger Car
  • Light Commercial Vehicle
  • Trucks
  • Buses
Electric And Hybrid Vehicle Paint Market, By Region
  • Battery Electric Vehicle
  • Hybrid Electric Vehicle
  • Feul Cell Eletcric Vehicle
Automotive Refinish Paints Market, By Resin Type
  • Polyurethane
  • Epoxy
  • Acrylic
  • Other Resins
Automotive Paints Market, By Region
  • North America
  • Europe
  • Asia Pacific
  • Rest of the World

Recent Developments

  • In June 2023, PPG industries, Inc. launched PPG ENVIRO-PRIME EPIC 200R, a suite of electrocoating (e-coat) products that cure at lower temperatures than competing technologies. The products provide sustainability benefits for customers, including lower energy use and reduced CO2 emissions at manufacturing facilities. PPG ENVIRO-PRIME EPIC 200R electro coat products cure at temperatures as low as 150°C (302°F), which is significantly lower than the typical cure temperatures of 180°C (356°F) or higher for conventional e-coats. This lower cure temperature helps to reduce energy consumption by up to 25%. In addition, the lower cure temperature helps to reduce CO2 emissions by up to 20%.
  • In August 2023, Axalta announced adding RADAR-compliant color formulas to its global online color databases - ChromaWeb, Phoenix Cloud, and Standowin iQ Cloud. ADAS sensors are often located behind painted plastic surfaces on cars, and the coating layers can directly influence the signal emitted and received by the ADAS sensors. Some colors, such as those with high concentrations of aluminum flakes, can interfere with RADAR sensors. Axalta has developed RADAR-compliant color formulas for colors that are known to interfere with RADAR sensors.
  • In December 2022, BASF launched its first biomass balance automotive coatings in China. The first product, ColorBrite Airspace Blue ReSource basecoat, is certified by REDcert² using a biomass balance approach. It was made from renewable raw materials used in the production of the basecoat and allocated to the product through a mass balance system. This results in a reduction of the product's carbon footprint by 20%. BASF has also received biomass certification for its resins plant in Caojing and its paint manufacturing sites in Minhang and Caojing, operated by BASF Shanghai Coatings Co., Ltd.
  • In mArch 2022, The Sherwin Willaims Company introduced Collision Core is a comprehensive solution that includes applications for color retrieval, body shop management, and performance management. The suite is designed to help shops overcome critical industry challenges, such as skilled labor shortages, rising costs, complex repair processes, and customer satisfaction..

Frequently Asked Questions (FAQ):

To speak to our analyst for a discussion on the above findings, click Speak to Analyst

Exclusive indicates content/data unique to MarketsandMarkets and not available with any competitors.

INTRODUCTION
26
RESEARCH METHODOLOGY
36
EXECUTIVE SUMMARY
47
PREMIUM INSIGHTS
50
MARKET OVERVIEW
56
  • 5.1 INTRODUCTION
  • 5.2 MARKET DYNAMICS
    DRIVERS
    - Rising production of sustainable automotive paints due to stringent emission regulations
    - Expansion of established players in refinish paints market
    RESTRAINTS
    - Reduced number of accidents and refinish jobs due to advancements in autonomous technologies
    OPPORTUNITY
    - Emergence of innovative paint technologies
    - Growing popularity of SUVs
    CHALLENGES
    - Lack of adequate waste management infrastructure in developing countries
    - Rapidly changing consumer preferences
    - Decline in vehicle sales
  • 5.3 TRENDS AND DISRUPTIONS IMPACTING CUSTOMERS’ BUSINESSES
  • 5.4 TECHNOLOGY ANALYSIS
    NANO-CERAMIC COATINGS
    SMART PAINTS
    SELF-CLEANING PAINTS
    DRESS UP
    SELF-HEALING WRAPS
    PAINT ATOMIZERS
    SMART AUTOMOTIVE PAINT BOOTHS
    ANTIMICROBIAL COATINGS
    IMPACT OF ELECTRIC VEHICLES ON AUTOMOTIVE PAINTS MARKET
  • 5.5 CASE STUDIES
    MITSUBISHI CHEMICAL GROUP
    POPULAR PAINTS
    TWIN CITY FAN
  • 5.6 POPULARITY OF AUTOMOTIVE COLORS WORLDWIDE
    POPULAR AUTOMOTIVE COLORS
    VEHICLE DEPRECIATION VALUE BASED ON COLORS
    NEW COLOR TRENDS BY AUTOMAKERS
  • 5.7 PATENT ANALYSIS
  • 5.8 TRADE ANALYSIS
    IMPORT DATA
    EXPORT DATA
  • 5.9 SUPPLY CHAIN ANALYSIS
  • 5.10 ECOSYSTEM MAPPING
  • 5.11 PRICING ANALYSIS
  • 5.12 TARIFF AND REGULATORY LANDSCAPE
    TARIFF RELATED TO AUTOMOTIVE PAINTS
    REGULATORY BODIES, GOVERNMENT AGENCIES, AND OTHER ORGANIZATIONS
  • 5.13 KEY STAKEHOLDERS AND BUYING CRITERIA
    STAKEHOLDERS IN BUYING PROCESS
    KEY BUYING CRITERIA
  • 5.14 KEY CONFERENCES AND EVENTS, 2023–2024
AUTOMOTIVE PAINTS MARKET, BY PAINT TYPE
88
  • 6.1 INTRODUCTION
    INDUSTRY INSIGHTS
  • 6.2 ELECTROCOAT
    FOCUS ON REDUCING VOC EMISSIONS TO DRIVE GROWTH
  • 6.3 PRIMER
    SHIFT TOWARD WATER-BORNE FORMULATIONS TO DRIVE GROWTH
  • 6.4 BASE COAT
    UPCOMING INNOVATIVE TECHNOLOGIES TO DRIVE GROWTH
  • 6.5 CLEAR COAT
    INCREASING USE OF LIGHTWEIGHT MATERIALS TO DRIVE GROWTH
AUTOMOTIVE PAINTS MARKET, BY TECHNOLOGY
98
  • 7.1 INTRODUCTION
    INDUSTRY INSIGHTS
  • 7.2 SOLVENT-BORNE
    AVAILABILITY OF DIVERSE COLORS AND FINISHES TO DRIVE GROWTH
  • 7.3 WATER-BORNE
    RISE IN ENVIRONMENTAL CONCERNS TO DRIVE GROWTH
  • 7.4 POWDER COATING
    COST-EFFECTIVENESS AND LESS MAINTENANCE REQUIREMENTS TO DRIVE GROWTH
AUTOMOTIVE PAINTS MARKET, BY RESIN TYPE
106
  • 8.1 INTRODUCTION
  • 8.2 POLYURETHANE
    DURABILITY AND CORROSION RESISTANCE PROPERTIES TO DRIVE GROWTH
  • 8.3 EPOXY
    EXTENSIVE USE IN VEHICLE REFINISHING TO DRIVE GROWTH
  • 8.4 ACRYLIC
    INCREASING DEMAND FOR WATER-BORNE COATINGS TO DRIVE GROWTH
  • 8.5 OTHER RESINS
AUTOMOTIVE PAINTS MARKET, BY TEXTURE
115
  • 9.1 INTRODUCTION
    INDUSTRY INSIGHTS
  • 9.2 SOLID
    DEVELOPMENT OF NEW PIGMENT TECHNOLOGIES TO DRIVE GROWTH
  • 9.3 METALLIC
    RISING PREMIUM CAR SALES TO DRIVE GROWTH
  • 9.4 MATTE FINISH
    CONSUMER PREFERENCE FOR LIMITED-EDITION VEHICLES TO DRIVE GROWTH
  • 9.5 PEARLESCENT
    PERSONALIZATION TREND IN HIGH-PERFORMANCE VEHICLES TO DRIVE GROWTH
  • 9.6 SOLAR REFLECTIVE
    INNOVATIONS FOR SOLAR HEAT REDUCTION IN AUTOMOTIVE PAINTS TO DRIVE GROWTH
AUTOMOTIVE PAINTS MARKET, BY CONTENT
124
  • 10.1 INTRODUCTION
  • 10.2 ELECTROCOAT, BY CONTENT
  • 10.3 SOLVENT-BORNE PAINT, BY CONTENT
  • 10.4 WATER-BORNE PAINT, BY CONTENT
AUTOMOTIVE PAINTS MARKET, BY PAINTING EQUIPMENT TECHNIQUE
133
  • 11.1 INTRODUCTION
    INDUSTRY INSIGHTS
  • 11.2 AIRLESS SPRAY GUN
    GROWING POPULARITY OF WATER-BORNE PAINTS TO DRIVE GROWTH
  • 11.3 ELECTROSTATIC SPRAY GUN
    STRICT ENVIRONMENTAL REGULATIONS TO DRIVE GROWTH
AUTOMOTIVE PAINTS MARKET, BY VEHICLE TYPE
138
  • 12.1 INTRODUCTION
    INDUSTRY INSIGHTS
  • 12.2 PASSENGER CAR
    RISE IN DEMAND FOR COMPACT AND MID-SIZED SUVS TO DRIVE GROWTH
  • 12.3 LIGHT COMMERCIAL VEHICLE (LCV)
    BOOMING E-COMMERCE AND LOGISTICS INDUSTRIES TO DRIVE GROWTH
  • 12.4 TRUCK
    INCREASE IN VEHICLE SALES AND MAINTENANCE SERVICES TO DRIVE GROWTH
  • 12.5 BUS
    EXPANDING TOURISM INDUSTRY TO DRIVE GROWTH
ELECTRIC & HYBRID VEHICLE PAINTS MARKET, BY VEHICLE TYPE
149
  • 13.1 INTRODUCTION
    INDUSTRY INSIGHTS
  • 13.2 BATTERY ELECTRIC VEHICLE (BEV)
    GOVERNMENT INCENTIVES AND POLICIES TO DRIVE GROWTH
  • 13.3 FUEL CELL ELECTRIC VEHICLE (FCEV)
    HYDROGEN FUEL INFRASTRUCTURE DEVELOPMENT TO DRIVE GROWTH
  • 13.4 PLUG-IN HYBRID VEHICLE (PHEV)
    CHANGING CUSTOMER PREFERENCES TO DRIVE GROWTH
AUTOMOTIVE REFINISH PAINTS MARKET, BY RESIN TYPE
158
  • 14.1 INTRODUCTION
  • 14.2 POLYURETHANE
    DIY CAR CARE TREND TO DRIVE GROWTH
  • 14.3 EPOXY
    RESTORATION OF CLASSIC CARS AND SPECIAL PERFORMANCE VEHICLES TO DRIVE GROWTH
  • 14.4 ACRYLIC
    REGULATORY COMPLIANCE TO LOWER DEMAND
  • 14.5 OTHER RESINS
AUTOMOTIVE PAINTS MARKET, BY REGION
168
  • 15.1 INTRODUCTION
    INDUSTRY INSIGHTS
  • 15.2 NORTH AMERICA
    US
    - Rise of electric and autonomous vehicles to drive growth
    MEXICO
    - Robust automotive manufacturing base to drive growth
    CANADA
    - Extreme climatic conditions to drive growth
  • 15.3 ASIA PACIFIC
    CHINA
    - Large-scale vehicle production to drive growth
    JAPAN
    - Rising popularity of Kei cars to drive growth
    SOUTH KOREA
    - Presence of prominent automotive paint manufacturers to drive growth
    INDIA
    - Vehicle Scrappage Policy to drive growth
    REST OF ASIA PACIFIC
  • 15.4 EUROPE
    GERMANY
    - Rising production of premium cars to drive growth
    FRANCE
    - Favorable government policies for electric vehicles to drive growth
    UK
    - Zero Emission Vehicle mandate to drive growth
    ITALY
    - Aging fleet renewal to drive growth
    SPAIN
    - Tourism and recreational activities to drive growth
    RUSSIA
    - Robust automobile manufacturing industry to drive growth
    REST OF EUROPE
  • 15.5 REST OF THE WORLD (ROW)
    BRAZIL
    - Increasing sales of ethanol-based vehicles to drive growth
    SOUTH AFRICA
    - Emergence of digital design tools and customization services to drive growth
    OTHERS
COMPETITIVE LANDSCAPE
207
  • 16.1 OVERVIEW
  • 16.2 MARKET SHARE ANALYSIS, 2022
  • 16.3 REVENUE ANALYSIS, 2020 VS. 2022
  • 16.4 AUTOMOTIVE PAINTS MARKET: COMPANY EVALUATION MATRIX, 2022
    STARS
    EMERGING LEADERS
    PERVASIVE PLAYERS
    PARTICIPANTS
  • 16.5 COMPANY FOOTPRINT
  • 16.6 AUTOMOTIVE REFINISH PAINTS MARKET: COMPANY EVALUATION MATRIX, 2022
    STARS
    EMERGING LEADERS
    PERVASIVE PLAYERS
    PARTICIPANTS
  • 16.7 COMPANY FOOTPRINT
  • 16.8 COMPETITIVE SCENARIO
    PRODUCT DEVELOPMENTS, 2022–2023
    DEALS, 2022–2023
    OTHERS, 2022–2023
  • 16.9 RIGHT TO WIN, 2022–2023
COMPANY PROFILES
235
  • 17.1 KEY PLAYERS
    PPG INDUSTRIES, INC.
    - Business overview
    - Products offered
    - Recent developments
    - MnM view
    BASF SE
    - Business overview
    - Products offered
    - Recent developments
    - MnM view
    AXALTA COATING SYSTEMS, LLC
    - Business overview
    - Products offered
    - Recent developments
    - MnM view
    AKZO NOBEL N.V.
    - Business overview
    - Products offered
    - Recent developments
    - MnM view
    THE SHERWIN-WILLIAMS COMPANY
    - Business overview
    - Products offered
    - Recent developments
    - MnM view
    KANSAI PAINT CO., LTD.
    - Business overview
    - Products offered
    - Recent developments
    SOLVAY
    - Business overview
    - Products offered
    - Recent developments
    NIPPON PAINT HOLDINGS CO., LTD.
    - Business overview
    - Products offered
    - Recent developments
    COVESTRO AG
    - Business overview
    - Products offered
    - Recent developments
    CLARIANT
    - Business overview
    - Products offered
    - Recent developments
  • 17.2 OTHER PLAYERS
    JOTUN
    SKSHU PAINT CO., LTD.
    KCC CORPORATION
    DONGLAI COATING TECHNOLOGY (SHANGHAI) CO., LTD.
    DUPONT
    STANDOX
    NEXA AUTOCOLOR
    3M
    WACKER CHEMIE AG
    PPG ASIANPAINTS
RECOMMENDATIONS BY MARKETSANDMARKETS
296
  • 18.1 ASIA PACIFIC TO BE MAJOR MARKET FOR AUTOMOTIVE PAINTS
  • 18.2 ENVIRONMENT FRIENDLINESS AND BETTER STRENGTH-TO-WEIGHT RATIO TO DRIVE POLYURETHANE SEGMENT
  • 18.3 CONCLUSION
APPENDIX
298
  • 19.1 INSIGHTS FROM INDUSTRY EXPERTS
  • 19.2 DISCUSSION GUIDE
  • 19.3 KNOWLEDGESTORE: MARKETSANDMARKETS’ SUBSCRIPTION PORTAL
  • 19.4 CUSTOMIZATION OPTIONS
    ADDITIONAL COMPANY PROFILES
    ELECTRIC & HYBRID VEHICLE PAINTS MARKET, BY VEHICLE TYPE, AT COUNTRY LEVEL
    - BEV
    - FCEV
    - PHEV
  • 19.5 RELATED REPORTS
  • 19.6 AUTHOR DETAILS
LIST OF TABLES
 
  • TABLE 1 AUTOMOTIVE PAINTS MARKET DEFINITION, BY PAINT TYPE
  • TABLE 2 MARKET DEFINITION, BY TECHNOLOGY
  • TABLE 3 MARKET DEFINITION, BY RESIN TYPE
  • TABLE 4 MARKET DEFINITION, BY TEXTURE
  • TABLE 5 MARKET DEFINITION, BY CONTENT
  • TABLE 6 MARKET DEFINITION, BY PAINTING EQUIPMENT TECHNIQUE
  • TABLE 7 MARKET DEFINITION, BY VEHICLE TYPE
  • TABLE 8 ELECTRIC & HYBRID VEHICLE PAINTS MARKET DEFINITION, BY VEHICLE TYPE
  • TABLE 9 AUTOMOTIVE REFINISH PAINTS MARKET DEFINITION, BY RESIN TYPE
  • TABLE 10 INCLUSIONS AND EXCLUSIONS
  • TABLE 11 CURRENCY EXCHANGE RATES
  • TABLE 12 VOC CONTENT LIMITS IN AUTOMOTIVE COATINGS
  • TABLE 13 SAFETY FEATURES IMPOSED BY KEY COUNTRIES
  • TABLE 14 VEHICLE DEPRECIATION VALUE BASED ON COLORS
  • TABLE 15 NEW VEHICLE COLOR TRENDS BY AUTOMAKERS
  • TABLE 16 INNOVATIONS AND PATENTS, 2020–2023
  • TABLE 17 US: IMPORT, BY COUNTRY (%)
  • TABLE 18 CHINA: IMPORT, BY COUNTRY (%)
  • TABLE 19 GERMANY: IMPORT, BY COUNTRY (%)
  • TABLE 20 BELGIUM: IMPORT, BY COUNTRY (%)
  • TABLE 21 NETHERLANDS: IMPORT, BY COUNTRY (%)
  • TABLE 22 CANADA: IMPORT, BY COUNTRY (%)
  • TABLE 23 GERMANY: EXPORT, BY COUNTRY (%)
  • TABLE 24 JAPAN: EXPORT, BY COUNTRY (%)
  • TABLE 25 US: EXPORT, BY COUNTRY (%)
  • TABLE 26 BELGIUM: EXPORT, BY COUNTRY (%)
  • TABLE 27 NETHERLANDS: EXPORT, BY COUNTRY (%)
  • TABLE 28 ROLE OF COMPANIES IN SUPPLY CHAIN
  • TABLE 29 AVERAGE SELLING PRICE TREND OF AUTOMOTIVE PAINTS, BY VEHICLE TYPE, 2022 (USD)
  • TABLE 30 AVERAGE SELLING PRICE TREND OF AUTOMOTIVE PAINTS, BY REGION, 2022 (USD)
  • TABLE 31 TARIFF RELATED TO AUTOMOTIVE PAINTS
  • TABLE 32 REGULATORY BODIES, GOVERNMENT AGENCIES, AND OTHER ORGANIZATIONS
  • TABLE 33 INFLUENCE OF STAKEHOLDERS ON BUYING PROCESS FOR AUTOMOTIVE PAINTS
  • TABLE 34 KEY BUYING CRITERIA FOR AUTOMOTIVE PAINTS
  • TABLE 35 KEY CONFERENCES AND EVENTS, 2023–2024
  • TABLE 36 AUTOMOTIVE PAINTS MARKET, BY PAINT TYPE, 2019–2022 (THOUSAND GALLONS)
  • TABLE 37 MARKET, BY PAINT TYPE, 2023–2028 (THOUSAND GALLONS)
  • TABLE 38 MARKET, BY PAINT TYPE, 2019–2022 (USD MILLION)
  • TABLE 39 MARKET, BY PAINT TYPE, 2023–2028 (USD MILLION)
  • TABLE 40 ELECTROCOAT: MARKET, BY REGION, 2019–2022 (THOUSAND GALLONS)
  • TABLE 41 ELECTROCOAT: MARKET, BY REGION, 2023–2028 (THOUSAND GALLONS)
  • TABLE 42 ELECTROCOAT: MARKET, BY REGION, 2019–2022 (USD MILLION)
  • TABLE 43 ELECTROCOAT: MARKET, BY REGION, 2023–2028 (USD MILLION)
  • TABLE 44 PRIMER: MARKET, BY REGION, 2019–2022 (THOUSAND GALLONS)
  • TABLE 45 PRIMER: MARKET, BY REGION, 2023–2028 (THOUSAND GALLONS)
  • TABLE 46 PRIMER: MARKET, BY REGION, 2019–2022 (USD MILLION)
  • TABLE 47 PRIMER: MARKET, BY REGION, 2023–2028 (USD MILLION)
  • TABLE 48 VEHICLES WITH SPECIAL EFFECT FINISHES
  • TABLE 49 BASE COAT: MARKET, BY REGION, 2019–2022 (THOUSAND GALLONS)
  • TABLE 50 BASE COAT: MARKET, BY REGION, 2023–2028 (THOUSAND GALLONS)
  • TABLE 51 BASE COAT: MARKET, BY REGION, 2019–2022 (USD MILLION)
  • TABLE 52 BASE COAT: MARKET, BY REGION, 2023–2028 (USD MILLION)
  • TABLE 53 CLEAR COAT: MARKET, BY REGION, 2019–2022 (THOUSAND GALLONS)
  • TABLE 54 CLEAR COAT: MARKET, BY REGION, 2023–2028 (THOUSAND GALLONS)
  • TABLE 55 CLEAR COAT: MARKET, BY REGION, 2019–2022 (USD MILLION)
  • TABLE 56 CLEAR COAT: MARKET, BY REGION, 2023–2028 (USD MILLION)
  • TABLE 57 COMPARISON BETWEEN AUTOMOTIVE PAINT TECHNOLOGIES
  • TABLE 58 MARKET, BY TECHNOLOGY, 2019–2022 (THOUSAND GALLONS)
  • TABLE 59 AUTOMOTIVE PAINTS MARKET, BY TECHNOLOGY, 2023–2028 (THOUSAND GALLONS)
  • TABLE 60 MARKET, BY TECHNOLOGY, 2019–2022 (USD MILLION)
  • TABLE 61 MARKET, BY TECHNOLOGY, 2023–2028 (USD MILLION)
  • TABLE 62 SOLVENT-BORNE: MARKET, BY REGION, 2019–2022 (THOUSAND GALLONS)
  • TABLE 63 SOLVENT-BORNE: MARKET, BY REGION, 2023–2028 (THOUSAND GALLONS)
  • TABLE 64 SOLVENT-BORNE: MARKET, BY REGION, 2019–2022 (USD MILLION)
  • TABLE 65 SOLVENT-BORNE: MARKET, BY REGION, 2023–2028 (USD MILLION)
  • TABLE 66 WATER-BORNE: MARKET, BY REGION, 2019–2022 (THOUSAND GALLONS)
  • TABLE 67 WATER-BORNE: MARKET, BY REGION, 2023–2028 (THOUSAND GALLONS)
  • TABLE 68 WATER-BORNE: MARKET, BY REGION, 2019–2022 (USD MILLION)
  • TABLE 69 WATER-BORNE: MARKET, BY REGION, 2023–2028 (USD MILLION)
  • TABLE 70 POWDER COATING: MARKET, BY REGION, 2019–2022 (THOUSAND GALLONS)
  • TABLE 71 POWDER COATING: MARKET, BY REGION, 2023–2028 (THOUSAND GALLONS)
  • TABLE 72 POWDER COATING: MARKET, BY REGION, 2019–2022 (USD MILLION)
  • TABLE 73 POWDER COATING: MARKET, BY REGION, 2023–2028 (USD MILLION)
  • TABLE 74 MARKET, BY RESIN TYPE, 2019–2022 (MILLION GALLONS)
  • TABLE 75 MARKET, BY RESIN TYPE, 2023–2028 (MILLION GALLONS)
  • TABLE 76 AUTOMOTIVE PAINTS MARKET, BY RESIN TYPE, 2019–2022 (USD MILLION)
  • TABLE 77 MARKET, BY RESIN TYPE, 2023–2028 (USD MILLION)
  • TABLE 78 POLYURETHANE: MARKET, BY REGION, 2019–2022 (MILLION GALLONS)
  • TABLE 79 POLYURETHANE: MARKET, BY REGION, 2023–2028 (MILLION GALLONS)
  • TABLE 80 POLYURETHANE: MARKET, BY REGION, 2019–2022 (USD MILLION)
  • TABLE 81 POLYURETHANE: MARKET, BY REGION, 2023–2028 (USD MILLION)
  • TABLE 82 EPOXY: MARKET, BY REGION, 2019–2022 (MILLION GALLONS)
  • TABLE 83 EPOXY: MARKET, BY REGION, 2023–2028 (MILLION GALLONS)
  • TABLE 84 EPOXY: MARKET, BY REGION, 2019–2022 (USD MILLION)
  • TABLE 85 EPOXY: MARKET, BY REGION, 2023–2028 (USD MILLION)
  • TABLE 86 ACRYLIC: MARKET, BY REGION, 2019–2022 (MILLION GALLONS)
  • TABLE 87 ACRYLIC: MARKET, BY REGION, 2023–2028 (MILLION GALLONS)
  • TABLE 88 ACRYLIC: MARKET, BY REGION, 2019–2022 (USD MILLION)
  • TABLE 89 ACRYLIC: MARKET, BY REGION, 2023–2028 (USD MILLION)
  • TABLE 90 OTHER RESINS: MARKET, BY REGION, 2019–2022 (MILLION GALLONS)
  • TABLE 91 OTHER RESINS: MARKET, BY REGION, 2023–2028 (MILLION GALLONS)
  • TABLE 92 OTHER RESINS: MARKET, BY REGION, 2019–2022 (USD MILLION)
  • TABLE 93 OTHER RESINS: MARKET, BY REGION, 2023–2028 (USD MILLION)
  • TABLE 94 MARKET, BY TEXTURE, 2019–2022 (THOUSAND UNITS)
  • TABLE 95 MARKET, BY TEXTURE, 2023–2028 (THOUSAND UNITS)
  • TABLE 96 VEHICLES WITH SOLID TEXTURE, 2023
  • TABLE 97 SOLID: MARKET, BY REGION, 2019–2022 (THOUSAND UNITS)
  • TABLE 98 SOLID: MARKET, BY REGION, 2023–2028 (THOUSAND UNITS)
  • TABLE 99 VEHICLES WITH METALLIC TEXTURE, 2023
  • TABLE 100 METALLIC: MARKET, BY REGION, 2019–2022 (THOUSAND UNITS)
  • TABLE 101 METALLIC: MARKET, BY REGION, 2023–2028 (THOUSAND UNITS)
  • TABLE 102 VEHICLES WITH MATTE FINISH TEXTURE, 2023
  • TABLE 103 MATTE FINISH: MARKET, BY REGION, 2019–2022 (THOUSAND UNITS)
  • TABLE 104 MATTE FINISH: MARKET, BY REGION, 2023–2028 (THOUSAND UNITS)
  • TABLE 105 PEARLESCENT: MARKET, BY REGION, 2019–2022 (THOUSAND UNITS)
  • TABLE 106 PEARLESCENT: MARKET, BY REGION, 2023–2028 (THOUSAND UNITS)
  • TABLE 107 SOLAR REFLECTIVE: MARKET, BY REGION, 2019–2022 (THOUSAND UNITS)
  • TABLE 108 SOLAR REFLECTIVE: MARKET, BY REGION, 2023–2028 (THOUSAND UNITS)
  • TABLE 109 AUTOMOTIVE ELECTROCOAT MARKET, BY CONTENT, 2019–2022 (THOUSAND GALLONS)
  • TABLE 110 AUTOMOTIVE ELECTROCOAT MARKET, BY CONTENT, 2023–2028 (THOUSAND GALLONS)
  • TABLE 111 AUTOMOTIVE SOLVENT-BORNE BASE COAT MARKET, BY CONTENT, 2019–2022 (THOUSAND GALLONS)
  • TABLE 112 AUTOMOTIVE SOLVENT-BORNE BASE COAT MARKET, BY CONTENT, 2023–2028 (THOUSAND GALLONS)
  • TABLE 113 AUTOMOTIVE SOLVENT-BORNE CLEAR COAT MARKET, BY CONTENT, 2019–2022 (THOUSAND GALLONS)
  • TABLE 114 AUTOMOTIVE SOLVENT-BORNE CLEAR COAT MARKET, BY CONTENT, 2023–2028 (THOUSAND GALLONS)
  • TABLE 115 AUTOMOTIVE WATER-BORNE BASE COAT MARKET, BY CONTENT, 2019–2022 (THOUSAND GALLONS)
  • TABLE 116 AUTOMOTIVE WATER-BORNE BASE COAT MARKET, BY CONTENT, 2023–2028 (THOUSAND GALLONS)
  • TABLE 117 AUTOMOTIVE WATER-BORNE CLEAR COAT MARKET, BY CONTENT, 2019–2022 (THOUSAND GALLONS)
  • TABLE 118 AUTOMOTIVE WATER-BORNE CLEAR COAT MARKET, BY CONTENT, 2023–2028 (THOUSAND GALLONS)
  • TABLE 119 AUTOMOTIVE PAINTS EQUIPMENT MARKET, BY REGION, 2019–2022 (UNITS)
  • TABLE 120 AUTOMOTIVE PAINTS EQUIPMENT MARKET, BY REGION, 2023–2028 (UNITS)
  • TABLE 121 AIRLESS SPRAY GUN: AUTOMOTIVE PAINTS EQUIPMENT MARKET, BY REGION, 2019–2022 (UNITS)
  • TABLE 122 AIRLESS SPRAY GUN: AUTOMOTIVE PAINTS EQUIPMENT MARKET, BY REGION, 2023–2028 (UNITS)
  • TABLE 123 ELECTROSTATIC SPRAY GUN: AUTOMOTIVE PAINTS EQUIPMENT MARKET, BY REGION, 2019–2022 (UNITS)
  • TABLE 124 ELECTROSTATIC SPRAY GUN: AUTOMOTIVE PAINTS EQUIPMENT MARKET, BY REGION, 2023–2028 (UNITS)
  • TABLE 125 MARKET, BY VEHICLE TYPE, 2019–2022 (MILLION GALLONS)
  • TABLE 126 MARKET, BY VEHICLE TYPE, 2023–2028 (MILLION GALLONS)
  • TABLE 127 MARKET, BY VEHICLE TYPE, 2019–2022 (USD MILLION)
  • TABLE 128 MARKET, BY VEHICLE TYPE, 2023–2028 (USD MILLION)
  • TABLE 129 PASSENGER CAR: MARKET, BY REGION, 2019–2022 (THOUSAND GALLONS)
  • TABLE 130 PASSENGER CAR: MARKET, BY REGION, 2023–2028 (THOUSAND GALLONS)
  • TABLE 131 PASSENGER CAR: MARKET, BY REGION, 2019–2022 (USD MILLION)
  • TABLE 132 PASSENGER CAR: MARKET, BY REGION, 2023–2028 (USD MILLION)
  • TABLE 133 LIGHT COMMERCIAL VEHICLE: MARKET, BY REGION, 2019–2022 (THOUSAND GALLONS)
  • TABLE 134 LIGHT COMMERCIAL VEHICLE: MARKET, BY REGION, 2023–2028 (THOUSAND GALLONS)
  • TABLE 135 LIGHT COMMERCIAL VEHICLE: MARKET, BY REGION 2019–2022 (USD MILLION)
  • TABLE 136 LIGHT COMMERCIAL VEHICLE: MARKET, BY REGION, 2023–2028 (USD MILLION)
  • TABLE 137 TRUCK: MARKET, BY REGION, 2019–2022 (THOUSAND GALLONS)
  • TABLE 138 TRUCK: MARKET, BY REGION, 2023–2028 (THOUSAND GALLONS)
  • TABLE 139 TRUCK: MARKET, BY REGION, 2019–2022 (USD MILLION)
  • TABLE 140 TRUCK: MARKET, BY REGION, 2023–2028 (USD MILLION)
  • TABLE 141 BUS: MARKET, BY REGION, 2019–2022 (THOUSAND GALLONS)
  • TABLE 142 BUS: MARKET, BY REGION, 2023–2028 (THOUSAND GALLONS)
  • TABLE 143 BUS: MARKET, BY REGION, 2019–2022 (USD MILLION)
  • TABLE 144 BUS: MARKET, BY REGION, 2023–2028 (USD MILLION)
  • TABLE 145 ELECTRIC & HYBRID VEHICLE PAINTS MARKET, BY VEHICLE TYPE, 2019–2022 (THOUSAND UNITS)
  • TABLE 146 ELECTRIC & HYBRID VEHICLE PAINTS MARKET, BY VEHICLE TYPE, 2023–2028 (THOUSAND UNITS)
  • TABLE 147 ELECTRIC & HYBRID VEHICLE PAINTS MARKET, BY VEHICLE TYPE, 2019–2022 (USD MILLION)
  • TABLE 148 ELECTRIC & HYBRID VEHICLE PAINTS MARKET, BY VEHICLE TYPE, 2023–2028 (USD MILLION)
  • TABLE 149 BEV: ELECTRIC & HYBRID VEHICLE PAINTS MARKET, BY REGION, 2019–2022 (THOUSAND UNITS)
  • TABLE 150 BEV: ELECTRIC & HYBRID VEHICLE PAINTS MARKET, BY REGION, 2023–2028 (THOUSAND UNITS)
  • TABLE 151 BEV: ELECTRIC & HYBRID VEHICLE PAINTS MARKET, BY REGION, 2019–2022 (USD MILLION)
  • TABLE 152 BEV: ELECTRIC & HYBRID VEHICLE PAINTS MARKET, BY REGION, 2023–2028 (USD MILLION)
  • TABLE 153 FCEV: ELECTRIC & HYBRID VEHICLE PAINTS MARKET, BY REGION, 2019–2022 (THOUSAND UNIT)
  • TABLE 154 FCEV: ELECTRIC & HYBRID VEHICLE PAINTS MARKET, BY REGION, 2023–2028 (THOUSAND UNIT)
  • TABLE 155 FCEV: ELECTRIC & HYBRID VEHICLE PAINTS MARKET, BY REGION, 2019–2022 (USD MILLION)
  • TABLE 156 FCEV: ELECTRIC & HYBRID VEHICLE PAINTS MARKET, BY REGION, 2023–2028 (USD MILLION)
  • TABLE 157 PHEV: ELECTRIC & HYBRID VEHICLE PAINTS MARKET, BY REGION, 2019–2022 (THOUSAND UNITS)
  • TABLE 158 PHEV: ELECTRIC & HYBRID VEHICLE PAINTS MARKET, BY REGION, 2023–2028 (THOUSAND UNITS)
  • TABLE 159 PHEV: ELECTRIC & HYBRID VEHICLE PAINTS MARKET, BY REGION, 2019–2022 (USD MILLION)
  • TABLE 160 PHEV: ELECTRIC & HYBRID VEHICLE PAINTS MARKET, BY REGION, 2023–2028 (USD MILLION)
  • TABLE 161 AUTOMOTIVE REFINISH PAINTS MARKET, BY RESIN TYPE, 2019–2022 (MILLION GALLONS)
  • TABLE 162 AUTOMOTIVE REFINISH PAINTS MARKET, BY RESIN TYPE, 2023–2028 (MILLION GALLONS)
  • TABLE 163 AUTOMOTIVE REFINISH PAINTS MARKET, BY RESIN TYPE, 2019–2022 (USD MILLION)
  • TABLE 164 AUTOMOTIVE REFINISH PAINTS MARKET, BY RESIN TYPE, 2023–2028 (USD MILLION)
  • TABLE 165 POLYURETHANE: AUTOMOTIVE REFINISH PAINTS MARKET, BY REGION, 2019–2022 (MILLION GALLONS)
  • TABLE 166 POLYURETHANE: AUTOMOTIVE REFINISH PAINTS MARKET, BY REGION, 2023–2028 (MILLION GALLONS)
  • TABLE 167 POLYURETHANE: AUTOMOTIVE REFINISH PAINTS MARKET, BY REGION, 2019–2022 (USD MILLION)
  • TABLE 168 POLYURETHANE: AUTOMOTIVE REFINISH PAINTS MARKET, BY REGION, 2023–2028 (USD MILLION)
  • TABLE 169 EPOXY: AUTOMOTIVE REFINISH PAINTS MARKET, BY REGION, 2019–2022 (MILLION GALLONS)
  • TABLE 170 EPOXY: AUTOMOTIVE REFINISH PAINTS MARKET, BY REGION, 2023–2028 (MILLION GALLONS)
  • TABLE 171 EPOXY: AUTOMOTIVE REFINISH PAINTS MARKET, BY REGION, 2019–2022 (USD MILLION)
  • TABLE 172 EPOXY: AUTOMOTIVE REFINISH PAINTS MARKET, BY REGION, 2023–2028 (USD MILLION)
  • TABLE 173 ACRYLIC: AUTOMOTIVE REFINISH PAINTS MARKET, BY REGION, 2019–2022 (MILLION GALLONS)
  • TABLE 174 ACRYLIC: AUTOMOTIVE REFINISH PAINTS MARKET, BY REGION, 2023–2028 (MILLION GALLONS)
  • TABLE 175 ACRYLIC: AUTOMOTIVE REFINISH PAINTS MARKET, BY REGION, 2019–2022 (USD MILLION)
  • TABLE 176 ACRYLIC: AUTOMOTIVE REFINISH PAINTS MARKET, BY REGION, 2023–2028 (USD MILLION)
  • TABLE 177 OTHER RESINS: AUTOMOTIVE REFINISH PAINTS MARKET, BY REGION, 2019–2022 (MILLION GALLONS)
  • TABLE 178 OTHER RESINS: AUTOMOTIVE REFINISH PAINTS MARKET, BY REGION, 2023–2028 (MILLION GALLONS)
  • TABLE 179 OTHER RESINS: AUTOMOTIVE REFINISH PAINTS MARKET, BY REGION, 2019–2022 (USD MILLION)
  • TABLE 180 OTHER RESINS: AUTOMOTIVE REFINISH PAINTS MARKET, BY REGION, 2023–2028 (USD MILLION)
  • TABLE 181 MARKET, BY REGION, 2019–2022 (MILLION GALLONS)
  • TABLE 182 MARKET, BY REGION, 2023–2028 (MILLION GALLONS)
  • TABLE 183 MARKET, BY REGION, 2019–2022 (USD MILLION)
  • TABLE 184 MARKET, BY REGION, 2023–2028 (USD MILLION)
  • TABLE 185 NORTH AMERICA: MARKET, BY COUNTRY, 2019–2022 (THOUSAND GALLONS)
  • TABLE 186 NORTH AMERICA: MARKET, BY COUNTRY, 2023–2028 (THOUSAND GALLONS)
  • TABLE 187 NORTH AMERICA: MARKET, BY COUNTRY, 2019–2022 (USD MILLION)
  • TABLE 188 NORTH AMERICA: MARKET, BY COUNTRY, 2023–2028 (USD MILLION)
  • TABLE 189 US: MARKET, BY VEHICLE TYPE, 2019–2022 (THOUSAND GALLONS)
  • TABLE 190 US: MARKET, BY VEHICLE TYPE, 2023–2028 (THOUSAND GALLONS)
  • TABLE 191 US: MARKET, BY VEHICLE TYPE, 2019–2022 (USD MILLION)
  • TABLE 192 US: MARKET, BY VEHICLE TYPE, 2023–2028 (USD MILLION)
  • TABLE 193 MEXICO: MARKET, BY VEHICLE TYPE, 2019–2022 (MILLION GALLONS)
  • TABLE 194 MEXICO: MARKET, BY VEHICLE TYPE, 2023–2028 (MILLION GALLONS)
  • TABLE 195 MEXICO: MARKET, BY VEHICLE TYPE, 2019–2022 (USD MILLION)
  • TABLE 196 MEXICO: MARKET, BY VEHICLE TYPE, 2023–2028 (USD MILLION)
  • TABLE 197 CANADA: MARKET, BY VEHICLE TYPE, 2019–2022 (MILLION GALLONS)
  • TABLE 198 CANADA: MARKET, BY VEHICLE TYPE, 2023–2028 (MILLION GALLONS)
  • TABLE 199 CANADA: MARKET, BY VEHICLE TYPE, 2019–2022 (USD MILLION)
  • TABLE 200 CANADA: MARKET, BY VEHICLE TYPE, 2023–2028 (USD MILLION)
  • TABLE 201 ASIA PACIFIC: MARKET, BY COUNTRY, 2019–2022 (THOUSAND GALLONS)
  • TABLE 202 ASIA PACIFIC: MARKET, BY COUNTRY, 2023–2028 (THOUSAND GALLONS)
  • TABLE 203 ASIA PACIFIC: MARKET, BY COUNTRY, 2019–2022 (USD MILLION)
  • TABLE 204 ASIA PACIFIC: MARKET, BY COUNTRY, 2023–2028 (USD MILLION)
  • TABLE 205 CHINA: MARKET, BY VEHICLE TYPE, 2019–2022 (MILLION GALLONS)
  • TABLE 206 CHINA: MARKET, BY VEHICLE TYPE, 2023–2028 (MILLION GALLONS)
  • TABLE 207 CHINA: MARKET, BY VEHICLE TYPE, 2019–2022 (USD MILLION)
  • TABLE 208 CHINA: MARKET, BY VEHICLE TYPE, 2023–2028 (USD MILLION)
  • TABLE 209 JAPAN: MARKET, BY VEHICLE TYPE, 2019–2022 (THOUSAND GALLONS)
  • TABLE 210 JAPAN: MARKET, BY VEHICLE TYPE, 2023–2028 (THOUSAND GALLONS)
  • TABLE 211 JAPAN: MARKET, BY VEHICLE TYPE, 2019–2022 (USD MILLION)
  • TABLE 212 JAPAN: MARKET, BY VEHICLE TYPE, 2023–2028 (USD MILLION)
  • TABLE 213 SOUTH KOREA: MARKET, BY VEHICLE TYPE, 2019–2022 (THOUSAND GALLONS)
  • TABLE 214 SOUTH KOREA: MARKET, BY VEHICLE TYPE, 2023–2028 (THOUSAND GALLONS)
  • TABLE 215 SOUTH KOREA: MARKET, BY VEHICLE TYPE, 2019–2022 (USD MILLION)
  • TABLE 216 SOUTH KOREA: MARKET, BY VEHICLE TYPE, 2023–2028 (USD MILLION)
  • TABLE 217 INDIA: MARKET, BY VEHICLE TYPE, 2019–2022 (THOUSAND GALLONS)
  • TABLE 218 INDIA: MARKET, BY VEHICLE TYPE, 2023–2028 (THOUSAND GALLONS)
  • TABLE 219 INDIA: MARKET, BY VEHICLE TYPE, 2019–2022 (USD MILLION)
  • TABLE 220 INDIA: MARKET, BY VEHICLE TYPE, 2023–2028 (USD MILLION)
  • TABLE 221 REST OF ASIA PACIFIC: MARKET, BY VEHICLE TYPE, 2019–2022 (THOUSAND GALLONS)
  • TABLE 222 REST OF ASIA PACIFIC: MARKET, BY VEHICLE TYPE, 2023–2028 (THOUSAND GALLONS)
  • TABLE 223 REST OF ASIA PACIFIC: MARKET, BY VEHICLE TYPE, 2019–2022 (USD MILLION)
  • TABLE 224 REST OF ASIA PACIFIC: MARKET, BY VEHICLE TYPE, 2023–2028 (USD MILLION)
  • TABLE 225 EUROPE: MARKET, BY COUNTRY, 2019–2022 (THOUSAND GALLONS)
  • TABLE 226 EUROPE: MARKET, BY COUNTRY, 2023–2028 (THOUSAND GALLONS)
  • TABLE 227 EUROPE: MARKET, BY COUNTRY, 2019–2022 (USD MILLION)
  • TABLE 228 EUROPE: MARKET, BY COUNTRY, 2023–2028 (USD MILLION)
  • TABLE 229 GERMANY: MARKET, BY VEHICLE TYPE, 2019–2022 (THOUSAND GALLONS)
  • TABLE 230 GERMANY: MARKET, BY VEHICLE TYPE, 2023–2028 (THOUSAND GALLONS)
  • TABLE 231 GERMANY: MARKET, BY VEHICLE TYPE, 2019–2022 (USD MILLION)
  • TABLE 232 GERMANY: MARKET, BY VEHICLE TYPE, 2023–2028 (USD MILLION)
  • TABLE 233 FRANCE: MARKET, BY VEHICLE TYPE, 2019–2022 (THOUSAND GALLONS)
  • TABLE 234 FRANCE: MARKET, BY VEHICLE TYPE, 2023–2028 (THOUSAND GALLONS)
  • TABLE 235 FRANCE: MARKET, BY VEHICLE TYPE, 2019–2022 (USD MILLION)
  • TABLE 236 FRANCE: MARKET, BY VEHICLE TYPE, 2023–2028 (USD MILLION)
  • TABLE 237 UK: MARKET, BY VEHICLE TYPE, 2019–2022 (THOUSAND GALLONS)
  • TABLE 238 UK: MARKET, BY VEHICLE TYPE, 2023–2028 (THOUSAND GALLONS)
  • TABLE 239 UK: MARKET, BY VEHICLE TYPE, 2019–2022 (USD MILLION)
  • TABLE 240 UK: MARKET, BY VEHICLE TYPE, 2023–2028 (USD MILLION)
  • TABLE 241 ITALY: MARKET, BY VEHICLE TYPE, 2019–2022 (THOUSAND GALLONS)
  • TABLE 242 ITALY: MARKET, BY VEHICLE TYPE, 2023–2028 (THOUSAND GALLONS)
  • TABLE 243 ITALY: MARKET, BY VEHICLE TYPE, 2019–2022 (USD MILLION)
  • TABLE 244 ITALY: MARKET, BY VEHICLE TYPE, 2023–2028 (USD MILLION)
  • TABLE 245 SPAIN: MARKET, BY VEHICLE TYPE, 2019–2022 (THOUSAND GALLONS)
  • TABLE 246 SPAIN: MARKET, BY VEHICLE TYPE, 2023–2028 (THOUSAND GALLONS)
  • TABLE 247 SPAIN: MARKET, BY VEHICLE TYPE, 2019–2022 (USD MILLION)
  • TABLE 248 SPAIN: MARKET, BY VEHICLE TYPE, 2023–2028 (USD MILLION)
  • TABLE 249 RUSSIA: MARKET, BY VEHICLE TYPE, 2019–2022 (THOUSAND GALLONS)
  • TABLE 250 RUSSIA: MARKET, BY VEHICLE TYPE, 2023–2028 (THOUSAND GALLONS)
  • TABLE 251 RUSSIA: MARKET, BY VEHICLE TYPE, 2019–2022 (USD MILLION)
  • TABLE 252 RUSSIA: MARKET, BY VEHICLE TYPE, 2023–2028 (USD MILLION)
  • TABLE 253 REST OF EUROPE: MARKET, BY VEHICLE TYPE, 2019–2022 (THOUSAND GALLONS)
  • TABLE 254 REST OF EUROPE: MARKET, BY VEHICLE TYPE, 2023–2028 (THOUSAND GALLONS)
  • TABLE 255 REST OF EUROPE: MARKET, BY VEHICLE TYPE, 2019–2022 (USD MILLION)
  • TABLE 256 REST OF EUROPE: MARKET, BY VEHICLE TYPE, 2023–2028 (USD MILLION)
  • TABLE 257 REST OF THE WORLD: MARKET, BY COUNTRY, 2019–2022 (THOUSAND GALLONS)
  • TABLE 258 REST OF THE WORLD: MARKET, BY COUNTRY, 2023–2028 (THOUSAND GALLONS)
  • TABLE 259 REST OF THE WORLD: MARKET, BY COUNTRY, 2019–2022 (USD MILLION)
  • TABLE 260 REST OF THE WORLD: MARKET, BY COUNTRY, 2023–2028 (USD MILLION)
  • TABLE 261 BRAZIL: MARKET, BY VEHICLE TYPE, 2019–2022 (THOUSAND GALLONS)
  • TABLE 262 BRAZIL: MARKET, BY VEHICLE TYPE, 2023–2028 (THOUSAND GALLONS)
  • TABLE 263 BRAZIL: MARKET, BY VEHICLE TYPE, 2019–2022 (USD MILLION)
  • TABLE 264 BRAZIL: MARKET, BY VEHICLE TYPE, 2023–2028 (USD MILLION)
  • TABLE 265 SOUTH AFRICA: MARKET, BY VEHICLE TYPE, 2019–2022 (THOUSAND GALLONS)
  • TABLE 266 SOUTH AFRICA: MARKET, BY VEHICLE TYPE, 2023–2028 (THOUSAND GALLONS)
  • TABLE 267 SOUTH AFRICA: MARKET, BY VEHICLE TYPE, 2019–2022 (USD MILLION)
  • TABLE 268 SOUTH AFRICA: MARKET, BY VEHICLE TYPE, 2023–2028 (USD MILLION)
  • TABLE 269 OTHERS: MARKET, BY VEHICLE TYPE, 2019–2022 (THOUSAND GALLONS)
  • TABLE 270 OTHERS: MARKET, BY VEHICLE TYPE, 2023–2028 (THOUSAND GALLONS)
  • TABLE 271 OTHERS: MARKET, BY VEHICLE TYPE, 2019–2022 (USD MILLION)
  • TABLE 272 OTHERS: MARKET, BY VEHICLE TYPE, 2023–2028 (USD MILLION)
  • TABLE 273 MARKET: COMPANY FOOTPRINT, 2022
  • TABLE 274 MARKET: TECHNOLOGY FOOTPRINT, 2022
  • TABLE 275 MARKET: REGION FOOTPRINT, 2022
  • TABLE 276 AUTOMOTIVE REFINISH PAINTS MARKET: COMPANY FOOTPRINT, 2022
  • TABLE 277 AUTOMOTIVE REFINISH PAINTS MARKET: TECHNOLOGY FOOTPRINT, 2022
  • TABLE 278 AUTOMOTIVE REFINISH PAINTS MARKET: REGION FOOTPRINT, 2022
  • TABLE 279 PRODUCT DEVELOPMENTS, 2022–2023
  • TABLE 280 DEALS, 2022–2023
  • TABLE 281 OTHERS, 2022–2023
  • TABLE 282 RIGHT TO WIN, 2022–2023
  • TABLE 283 PPG INDUSTRIES, INC.: COMPANY OVERVIEW
  • TABLE 284 PPG INDUSTRIES, INC.: PRODUCTS OFFERED
  • TABLE 285 PPG INDUSTRIES, INC.: PRODUCT DEVELOPMENTS
  • TABLE 286 PPG INDUSTRIES, INC.: DEALS
  • TABLE 287 PPG INDUSTRIES, INC.: OTHERS
  • TABLE 288 BASF SE: COMPANY OVERVIEW
  • TABLE 289 BASF SE: PRODUCTS OFFERED
  • TABLE 290 BASF SE: PRODUCT DEVELOPMENTS
  • TABLE 291 BASF SE: DEALS
  • TABLE 292 BASF SE: OTHERS
  • TABLE 293 AXALTA COATING SYSTEMS, LLC: COMPANY OVERVIEW
  • TABLE 294 AXALTA COATING SYSTEMS, LLC: PRODUCTS OFFERED
  • TABLE 295 AXALTA COATING SYSTEMS, LLC: PRODUCT DEVELOPMENTS
  • TABLE 296 AXALTA COATING SYSTEMS, LLC: DEALS
  • TABLE 297 AXALTA COATING SYSTEMS, LLC: OTHERS
  • TABLE 298 AKZO NOBEL N.V.: COMPANY OVERVIEW
  • TABLE 299 AKZO NOBEL N.V.: PRODUCTS OFFERED
  • TABLE 300 AKZO NOBEL N.V.: PRODUCT DEVELOPMENTS
  • TABLE 301 AKZO NOBEL N.V.: DEALS
  • TABLE 302 AKZO NOBEL N.V.: OTHERS
  • TABLE 303 THE SHERWIN-WILLIAMS COMPANY: COMPANY OVERVIEW
  • TABLE 304 THE SHERWIN-WILLIAMS COMPANY: PRODUCTS OFFERED
  • TABLE 305 THE SHERWIN-WILLIAMS COMPANY: PRODUCT DEVELOPMENTS
  • TABLE 306 THE SHERWIN-WILLIAMS COMPANY: DEALS
  • TABLE 307 THE SHERWIN-WILLIAMS COMPANY: OTHERS
  • TABLE 308 KANSAI PAINT CO., LTD.: COMPANY OVERVIEW
  • TABLE 309 KANSAI PAINT CO., LTD.: PRODUCTS OFFERED
  • TABLE 310 KANSAI PAINT CO., LTD.: DEALS
  • TABLE 311 SOLVAY: COMPANY OVERVIEW
  • TABLE 312 SOLVAY: PRODUCTS OFFERED
  • TABLE 313 SOLVAY: PRODUCT DEVELOPMENTS
  • TABLE 314 SOLVAY: OTHERS
  • TABLE 315 NIPPON PAINT HOLDINGS CO., LTD.: COMPANY OVERVIEW
  • TABLE 316 NIPPON PAINT HOLDINGS CO., LTD.: PRODUCTS OFFERED
  • TABLE 317 NIPPON PAINT HOLDINGS CO., LTD.: PRODUCT DEVELOPMENTS
  • TABLE 318 NIPPON PAINT HOLDINGS CO., LTD.: DEALS
  • TABLE 319 COVESTRO AG: COMPANY OVERVIEW
  • TABLE 320 COVESTRO AG: PRODUCTS OFFERED
  • TABLE 321 COVESTRO AG: PRODUCT DEVELOPMENTS
  • TABLE 322 COVESTRO AG: OTHERS
  • TABLE 323 CLARIANT: COMPANY OVERVIEW
  • TABLE 324 CLARIANT: PRODUCTS OFFERED
  • TABLE 325 CLARIANT: PRODUCT DEVELOPMENTS
  • TABLE 326 JOTUN: COMPANY OVERVIEW
  • TABLE 327 SKSHU PAINT CO., LTD.: COMPANY OVERVIEW
  • TABLE 328 KCC CORPORATION: COMPANY OVERVIEW
  • TABLE 329 DONGLAI COATING TECHNOLOGY (SHANGHAI) CO., LTD.: COMPANY OVERVIEW
  • TABLE 330 DUPONT: COMPANY OVERVIEW
  • TABLE 331 STANDOX: COMPANY OVERVIEW
  • TABLE 332 NEXA AUTOCOLOR: COMPANY OVERVIEW
  • TABLE 333 3M: COMPANY OVERVIEW
  • TABLE 334 WACKER CHEMIE AG: COMPANY OVERVIEW
  • TABLE 335 PPG ASIANPAINTS: COMPANY OVERVIEW
LIST OF FIGURES
 
  • FIGURE 1 AUTOMOTIVE PAINTS MARKET SEGMENTATION
  • FIGURE 2 RESEARCH DESIGN
  • FIGURE 3 RESEARCH DESIGN MODEL
  • FIGURE 4 BREAKDOWN OF PRIMARY INTERVIEWS
  • FIGURE 5 BOTTOM-UP APPROACH
  • FIGURE 6 TOP-DOWN APPROACH
  • FIGURE 7 DATA TRIANGULATION
  • FIGURE 8 MARKET OUTLOOK
  • FIGURE 9 WATER-BORNE SEGMENT TO GROW RAPIDLY DURING FORECAST PERIOD
  • FIGURE 10 POLYURETHANE TO BE LARGEST SEGMENT DURING FORECAST PERIOD
  • FIGURE 11 METALLIC TO SURPASS OTHER SEGMENTS DURING FORECAST PERIOD
  • FIGURE 12 INCREASE IN VEHICLE PRODUCTION TO DRIVE GROWTH
  • FIGURE 13 BASE COAT TO ACQUIRE MAXIMUM MARKET SHARE BY VALUE IN 2028
  • FIGURE 14 SOLVENT-BORNE TO BE LARGEST SEGMENT BY VALUE DURING FORECAST PERIOD
  • FIGURE 15 POLYURETHANE TO HOLD LARGEST MARKET SHARE BY VALUE IN 2028
  • FIGURE 16 METALLIC TO BE LARGEST SEGMENT BY VOLUME DURING FORECAST PERIOD
  • FIGURE 17 PASSENGER CAR TO SECURE LEADING MARKET POSITION BY VALUE DURING FORECAST PERIOD
  • FIGURE 18 PIGMENT & COLORANT TO RECORD HIGHEST CAGR DURING FORECAST PERIOD
  • FIGURE 19 BEV TO SURPASS OTHER SEGMENTS BY VALUE DURING FORECAST PERIOD
  • FIGURE 20 ASIA PACIFIC TO BE LARGEST MARKET DURING FORECAST PERIOD
  • FIGURE 21 POLYURETHANE TO SECURE LEADING MARKET POSITION DURING FORECAST PERIOD
  • FIGURE 22 ASIA PACIFIC TO BE LARGEST MARKET FOR ELECTROSTATIC SPRAY GUNS DURING FORECAST PERIOD
  • FIGURE 23 AUTOMOTIVE PAINTS MARKET DYNAMICS
  • FIGURE 24 AUTOMOTIVE COAT PROCESS: CONVENTIONAL VS. ADVANCED
  • FIGURE 25 GLOBAL SUV PRODUCTION DATA, 2018–2022
  • FIGURE 26 TRENDS AND DISRUPTIONS IMPACTING CUSTOMERS’ BUSINESSES
  • FIGURE 27 COLORS SOLD GLOBALLY
  • FIGURE 28 COLORS WIDELY USED IN AUTOMOBILES (%)
  • FIGURE 29 NORTH AMERICA: COLOR PREFERENCES, BY VEHICLE TYPE
  • FIGURE 30 EUROPE: COLOR PREFERENCES, BY VEHICLE TYPE
  • FIGURE 31 SUPPLY CHAIN ANALYSIS
  • FIGURE 32 ECOSYSTEM MAPPING
  • FIGURE 33 KEY BUYING CRITERIA FOR AUTOMOTIVE PAINTS
  • FIGURE 34 AVERAGE THICKNESS OF AUTOMOTIVE PAINTS, BY LAYER (ΜM)
  • FIGURE 35 AUTOMOTIVE REFINISH PAINT SINGLE STAGING PROCESS, BY LAYER (ΜM)
  • FIGURE 36 AUTOMOTIVE PAINTS MARKET, BY PAINT TYPE, 2023–2028 (USD MILLION)
  • FIGURE 37 MARKET, BY TECHNOLOGY, 2023–2028 (USD MILLION)
  • FIGURE 38 MARKET, BY RESIN TYPE, 2023–2028 (USD MILLION)
  • FIGURE 39 MARKET, BY TEXTURE, 2023–2028 (THOUSAND UNITS)
  • FIGURE 40 AUTOMOTIVE ELECTROCOAT MARKET, BY CONTENT, 2023–2028 (THOUSAND GALLONS)
  • FIGURE 41 AUTOMOTIVE SOLVENT-BORNE BASE COAT MARKET, BY CONTENT, 2023–2028 (THOUSAND GALLONS)
  • FIGURE 42 AUTOMOTIVE SOLVENT-BORNE CLEAR COAT MARKET, BY CONTENT, 2023–2028 (THOUSAND GALLONS)
  • FIGURE 43 AUTOMOTIVE WATER-BORNE BASE COAT MARKET, BY CONTENT, 2023–2028 (THOUSAND GALLONS)
  • FIGURE 44 AUTOMOTIVE WATER-BORNE CLEAR COAT MARKET, BY CONTENT, 2023–2028 (THOUSAND GALLONS)
  • FIGURE 45 AUTOMOTIVE PAINTS EQUIPMENT MARKET, BY REGION, 2023–2028 (UNITS)
  • FIGURE 46 AUTOMOTIVE PAINTS MARKET, BY VEHICLE TYPE, 2023–2028 (USD MILLION)
  • FIGURE 47 ELECTRIC & HYBRID VEHICLE PAINTS MARKET, BY VEHICLE TYPE, 2023–2028 (USD BILLION)
  • FIGURE 48 AUTOMOTIVE REFINISH PAINTS MARKET, BY RESIN TYPE, 2023–2028 (USD MILLION)
  • FIGURE 49 MARKET, BY REGION, 2023–2028 (USD MILLION)
  • FIGURE 50 NORTH AMERICA: MARKET SNAPSHOT
  • FIGURE 51 ASIA PACIFIC: MARKET SNAPSHOT
  • FIGURE 52 MARKET SHARE OF KEY PLAYERS, 2022
  • FIGURE 53 REVENUE ANALYSIS OF KEY PLAYERS, 2020 VS. 2022
  • FIGURE 54 AUTOMOTIVE PAINTS MARKET: COMPANY EVALUATION MATRIX, 2022
  • FIGURE 55 AUTOMOTIVE REFINISH PAINTS MARKET: COMPANY EVALUATION MATRIX, 2022
  • FIGURE 56 PPG INDUSTRIES, INC.: COMPANY SNAPSHOT
  • FIGURE 57 BASF SE: COMPANY SNAPSHOT
  • FIGURE 58 AXALTA COATING SYSTEMS, LLC: COMPANY SNAPSHOT
  • FIGURE 59 AKZO NOBEL N.V.: COMPANY SNAPSHOT
  • FIGURE 60 THE SHERWIN-WILLIAMS COMPANY: COMPANY SNAPSHOT
  • FIGURE 61 KANSAI PAINT CO., LTD.: COMPANY SNAPSHOT
  • FIGURE 62 SOLVAY: COMPANY SNAPSHOT
  • FIGURE 63 NIPPON PAINT HOLDINGS CO., LTD.: COMPANY SNAPSHOT
  • FIGURE 64 COVESTRO AG: COMPANY SNAPSHOT
  • FIGURE 65 CLARIANT: COMPANY SNAPSHOT


Various secondary sources, directories, and databases have been used to identify and collect information for an extensive study of the automotive paints market. The study involved four main activities in estimating the current size of the automotive paints market: secondary research, validation through primary research, assumptions, and market analysis. Exhaustive secondary research was carried out to collect information on the market, such as the paint types as well as the upcoming technologies and trends. The next step was to validate these findings, assumptions, and market analysis with industry experts across the value chain through primary research. The top-down approach was employed to estimate the complete market size for different segments considered in this study.

Secondary Research

In the secondary research process, various secondary sources have been used to identify and collect information useful for an extensive commercial study of the automotive paint market. Secondary sources include company annual reports/presentations, press releases, industry association publications [such as publications on vehicle sales, EEA (European Energy Agency), IEA (International Energy Agency), ACEA (European Automobile Manufacturers Association), T&E (Transport and Environment), country-level automotive associations and trade organizations, and the US Department of Transportation (DOT)], Automotive paint related magazine articles, directories, technical handbooks, World Economic Outlook, trade websites, and technical articles. Additionally, secondary research has been carried out to understand the average cost of automotive paints consumed by vehicle type, and historic sales of vehicles.

Primary Research

In the primary research process, various primary sources from both the supply and demand sides were interviewed to obtain qualitative and quantitative information on the market. The primary sources from the supply side included industry experts such as CXOs, vice presidents, directors from business development, marketing, product development/innovation teams, and related key executives from various key companies. Various system integrators, industry associations, independent consultants/industry veterans, and key opinion leaders were also interviewed.

Primary interviews have been conducted to gather insights such as ICE vehicle and electric vehicle sales forecast, automotive paints market forecast, automotive paint regional penetration, future technology trends, and upcoming technologies for reducing the automotive painting. Data triangulation was then done with the information gathered from secondary research. Stakeholders from the demand as well as supply side have been interviewed to understand their views on the aforementioned points.

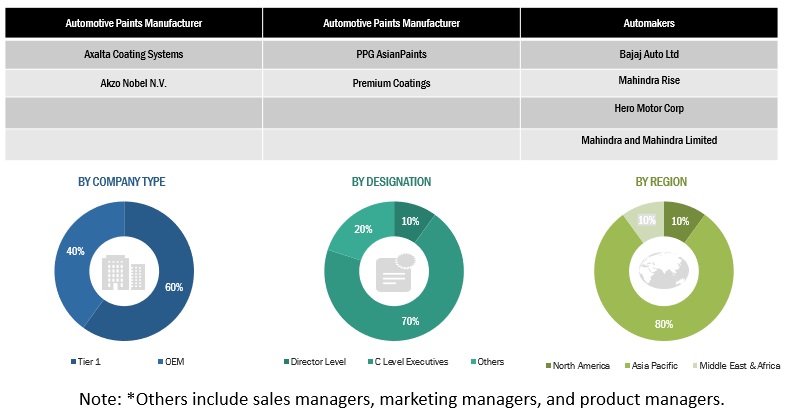
Primary interviews have been conducted with market experts from automotive paints manufacturers and automakers across four major regions, namely, North America, Europe, Asia Pacific, and the Rest of the World. A similar percentage of primary interviews have been conducted with the automotive paint providers and automotive paint technology providers, respectively. Primary data has been collected through questionnaires, emails, and telephonic interviews. In the canvassing of primaries, we have strived to cover various departments within organizations, such as sales and operations, to provide a holistic viewpoint in our report.

After interacting with industry experts, we have also conducted brief sessions with highly experienced independent consultants to reinforce the findings from our primaries. This, along with the in-house subject matter expert’s opinions, has led us to the findings as described in the remainder of this report.

Breakdown Of Primary Interviews: By Company Type & Designation
Automotive Paints  Market Size, and Share

To know about the assumptions considered for the study, download the pdf brochure

Market Size Estimation

A detailed market estimation approach was followed to estimate and validate the value of the automotive paints market and other dependent submarkets, as mentioned below:

  • Key players in the automotive paints market were identified through secondary research, and their global market shares were determined through primary and secondary research.
  • The research methodology included the study of annual and quarterly financial reports and regulatory filings of major market players (public) as well as interviews with industry experts for detailed market insights.
  • All industry-level penetration rates, percentage shares, splits, and breakdowns for the automotive paints market were determined using secondary sources and verified through primary sources.
  • All key macro indicators affecting the revenue growth of the market segments and sub-segments have been accounted for, viewed in extensive detail, verified through primary research, and analyzed to get the validated and verified quantitative and qualitative data.
  • The gathered market data was consolidated and added with detailed inputs, analyzed, and presented in this report.

Automotive Paints Market: Bottom-Up Approach
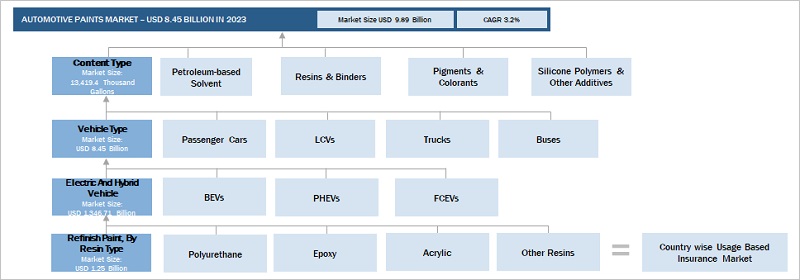
Automotive Paints  Market Bottom Up Approach

To know about the assumptions considered for the study, Request for Free Sample Report

Automotive Paints Market: Top-Down Approach

The top-down approach has been used to estimate and validate the size of the automotive paints market, by paint. The market share of each technology was derived at regional level through secondary research & insights from industry experts. Further, market was segmented based on market share for each paint type at regional level. The similar approach is used in, technology type, resin type, texture type, content type, and paint equipment type.
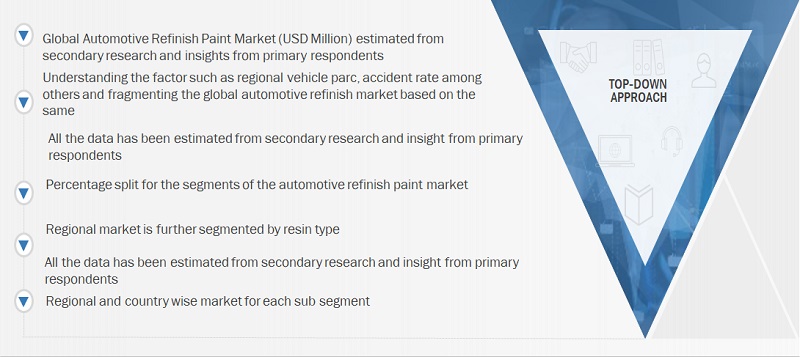
Automotive Paints  Market Top Down Approach

Bottom-Up Approach Automotive Paints By Technology At Regional Level
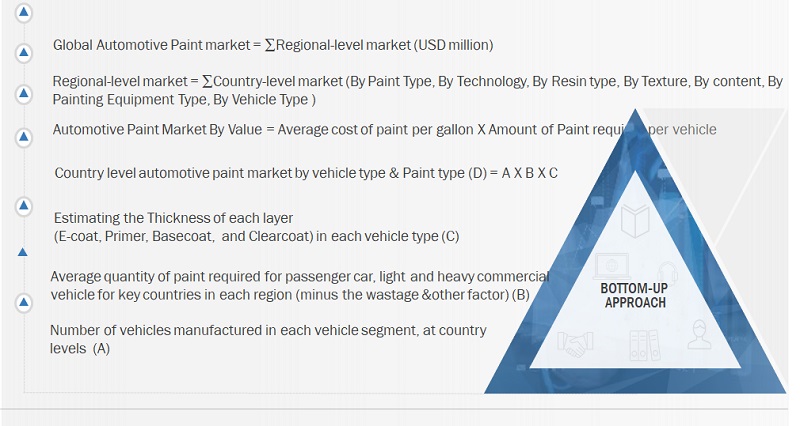
Automotive Paints Market Size, and Share

Data Triangulation

After arriving at the overall market size—using the market size estimation processes as explained above—the market was split into several segments and sub-segments. To complete the overall market engineering process and arrive at the exact statistics of each market segment and sub segment, data triangulation and market breakdown procedures were employed, wherever applicable. The data was triangulated by studying various factors and trends.

Market Definition

Automotive paint is a coating that provides an aesthetic appearance to the vehicle’s exterior body and protects it from external factors, such as rain, dust, and chemicals. Hence, the exterior paint is an integral part of the automotive industry. The demand for automotive paints is directly proportional to vehicle production and demand in the automotive industry.

Stakeholders

  • Manufacturers of various types of automotive paints
  • Raw material suppliers to automotive paint manufacturers
  • Manufacturers of automotive coating technologies
  • Dealers and distributors of automotive paints
  • Automotive original equipment manufacturers (OEMs)
  • Automobile industry as an end-user industry
  • Regional manufacturer associations and automobile associations
  • Government’s national and regional environmental regulatory agencies or organizations

Report Objectives

  • To define, describe, and forecast the automotive paints market, in terms of value
    (USD million), based on the following segments:
    • By Paint Type [Electrocoat, Basecoat, Primer, Clearcoat]
    • By Technology Type [Solvant Borne, Waterborne, Powder Coating]
    • By Resin Type [Polyurethane, Epoxy, Acrylic, Other Resins]
    • By Texture Type [Solid, Metallic, Matte, Pearlescent, Solar reflective]
    • By Electric and Hybrid Vehicle Type [HEV, PHEV, FCEV]
    • By Vehicle Type [Passenger cars, LCV, Trucks, Buses]
    • By Content Type [E-coat, Solvent-Borne Basecoat, Solvent-Borne Clearcoat, Waterborne Basecoat, Waterborne Clearcoat]
    • By Refinish Paints [Polyurethane, Epoxy, Acrylic, Other Resins]
    • By Painting Equipment type [Airless Spray Gun, Electrostatic Spray Gun]
    • By Region (Asia Pacific, Europe, North America, and RoW)
  • To understand the market dynamics (drivers, restraints, opportunities, and challenges) and conduct patent analysis, case study analysis, supply chain analysis, regulatory analysis, and ecosystem analysis.
  • To understand the dynamics of the market players and distinguish them into stars, emerging leaders, pervasive players, and participants according to their product portfolio strength and business strategies.
  • To strategically analyze markets with respect to individual growth trends, prospects, and contributions to the total market.
  • To understand the dynamics of competitors and distinguish them into stars, emerging leaders, pervasive players, and participants per the strength of their product portfolio and business strategies.
  • To analyze recent developments, such as agreements/partnerships/collaborations, joint ventures/mergers and acquisitions, geographic expansions, and product developments of key players in the automotive paints market.
  • To identify innovations and patents by assessing the intellectual property (IP) landscape for any particular product or technology.
  • To understand the general impact of the recession on the automotive paints market and how it will affect the overall economy of the country or region.

Available Customizations

Along with the market data, MarketsandMarkets offers customizations in accordance with company-specific needs.

The following customization options are available for the report:

Automotive Electric And Hybrid  Paint Market By Country And Vehicle Type

  • BEV
  • FCEV
  • PHEV

Additional Companies Profiled (Business Profile, Recent Developments, And Mnm Views)

Note: This will be further segmented by region.

Custom Market Research Services

We will customize the research for you, in case the report listed above does not meet with your exact requirements. Our custom research will comprehensively cover the business information you require to help you arrive at strategic and profitable business decisions.

Request Customization
Report Code
AT 2118
Published ON
Dec, 2023
Choose License Type
BUY NOW
  • SHARE
X
Request Customization
Speak to Analyst
Speak to Analyst
OR FACE-TO-FACE MEETING
PERSONALIZE THIS RESEARCH
  • Triangulate with your Own Data
  • Get Data as per your Format and Definition
  • Gain a Deeper Dive on a Specific Application, Geography, Customer or Competitor
  • Any level of Personalization
REQUEST A FREE CUSTOMIZATION
LET US HELP YOU!
  • What are the Known and Unknown Adjacencies Impacting the Automotive Paints Market
  • What will your New Revenue Sources be?
  • Who will be your Top Customer; what will make them switch?
  • Defend your Market Share or Win Competitors
  • Get a Scorecard for Target Partners
CUSTOMIZED WORKSHOP REQUEST
knowledgestore logo

Want to explore hidden markets that can drive new revenue in Automotive Paints Market?

Find Hidden Markets
  • Call Us
  • +1-888-600-6441 (Corporate office hours)
  • +1-888-600-6441 (US/Can toll free)
  • +44-800-368-9399 (UK office hours)
CONNECT WITH US
ABOUT TRUST ONLINE
©2024 MarketsandMarkets Research Private Ltd. All rights reserved
DMCA.com Protection Status
Website Feedback