Automotive Plastic Additives Market by Additives (Plasticizers, Anti-Scratch, Stabilizers, Antioxidants), Application (Exterior, Interior, Under the Hood), Plastic (PP, PUR, PVC, and ABS), Vehicle Type, EV Type, and Region - Global Forecast to 2022


The automotive plastic additives market is estimated to be USD 6.25 Billion in 2017 and is projected to grow at a CAGR of 6.52% during the forecast period. The base year for the report is 2016 and the forecast year is 2022. The objective of the study is to analyze and forecast (2017 to 2022) the market size, in terms of volume (kilotons) and value (USD million), of the automotive plastic additives market. Plastic has the capability to replace components made out of other materials such as metal and aluminium. The properties of plastic have been improved with the proper mix of plastic resins and compounds, which are a mix of additives, fillers, colorants, and agents. Due to the characteristics of compounds, plastics are now used in the automotive industry for different applications. The applications from exterior and interior to under the hood and electronics & electrical have been customized in plastic due to the compound’s functional properties. The applications in the automotive industry keep on increasing owing to the need for lightweight materials. Plastics are being used due to their excellent design flexibility and light weight. The report segments the market by plastic additives, automotive application, plastic type, and vehicle type based on region North America, Europe, Asia-Pacific, and the Rest of the World (RoW). A adetailed study of various market leaders has been done and opportunity analysis has been provided in the report.
Various secondary sources, such as Organisation Internationale des Constructeurs d'Automobiles (OICA), American Chemistry Council (ACC), Plastics Environmental Council (PEC), British Plastics Federation (BPF), and others), corporate filings (such as annual reports, investor presentations, and financial statements), and trade, business, and automotive associations. The secondary data has been collected and analyzed to arrive at the overall market size, which has been further validated through primary research. The primary sources experts from related industries, automotive plastic additives manufacturers, and additives experts have been interviewed to obtain and verify critical information, as well as to assess future prospects and market estimations.
The top-down approach has been used to estimate and validate the size of the global automotive plastic additives market. To determine the market size, in terms of volume, of the market, vehicle production numbers have been multiplied by region-level penetration of each type of plastic considered in the study. The region-level market size, in terms of volume, of plastics is then multiplied with the region-level penetration of each type of plastic additives. This results in the region-level market size, in terms of value. The summation of the region-level market gives the global market.
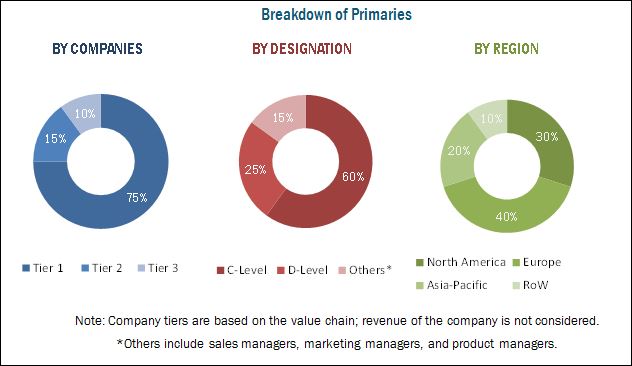
The figure given below illustrates the break-up of the profile of industry experts who participated in primary discussions.
To know about the assumptions considered for the study, download the pdf brochure
The automotive plastic additives market consists of various additives manufacturers such as BASF SE (Germany), ExxonMobil Corporation (U.S.), Covestro AG (Germany), The Dow Chemical Company (U.S.), Sabic (Saudi Arabia), and Akzo Nobel N.V. (Netherlands) among others.
Target Audience
- Automobile manufacturers
- Distributors and suppliers of plastic additives
- Industry associations and experts
- Plastic component manufacturers
- Additive manufacturers
Scope of the Report
-
By Region
- North America
- Europe
- Asia-Pacific
- RoW
-
By Plastic Additives
- Plasticizers
- Anti-Scratch
- Stabilizers
- Antioxidants
- Others
-
By Automotive Application
- Exterior
- Interior
- Under the Hood
- Electronics & Electrical
-
By Plastic
- Polypropylene (PP)
- Polyurethane (PUR)
- Poly-Vinyl Chloride (PVC)
- Acrylonitrile Butadiene Styrene (ABS)
-
By Vehicle Type
- Passenger Car
- Light Commercial Vehicle
- Heavy Commercial Vehicle
- Electric Vehicle
Available Customizations
- Automotive plastic additives Market, by vehicle type, by country, by application
- Profiling of additional market players (Up to 3)
The automotive plastic additives market is projected to grow at a CAGR of 6.52% during the forecast period, to reach USD 8.58 Billion by 2022. Rising demand for lightweight vehicles across the ecosystem have fueled the growth of the market globally. The growing trend of EVs is also a major factor that has contributed to the growth of this market. The electrification of vehicles in emerging countries such as China and India is driving the market for automotive plastic additives. The use of plastics in electric vehicles is more as compared to passenger cars, light commercial vehicles (LCV), and heavy commercial vehicles (HCV). The electrification of vehicles is increasing due to the lightweight of plastics and to cope with the stringent emission regulations. The increased use of plastic improves the energy management of a vehicle. Improvement in energy efficiency and fuel efficiency are the key drivers for the development of lightweight electric vehicles. However, there are some restraints for the market as the use of plastics could also impact health. The market is also challenging due to the stringent CAFE emission regulations.
The interior application segment is estimated to have the highest growth potential, and will further boost the demand for the market. This growth can be attributed to the demand for automotive plastic additives in interior application due to the high use of plastics. OEMs are strategizing to focus on consumer demands such as aesthetics, safety, comfort, vibrant colors, quality, and durability.
The automotive plastic additives for polypropylene is estimated to lead the automotive plastic additives market, by plastic type, during the forecast period. The high demand for the polypropylene additives market can be attributed to the wide use of polypropylene plastics than other plastics such as polyurethane, poly-vinyl chloride, and others.
Passenger cars are estimated to lead the market, by vehicle type. This is because the market is shifting toward luxury passenger cars with enhanced aesthetics, comfort, safety, and durability.
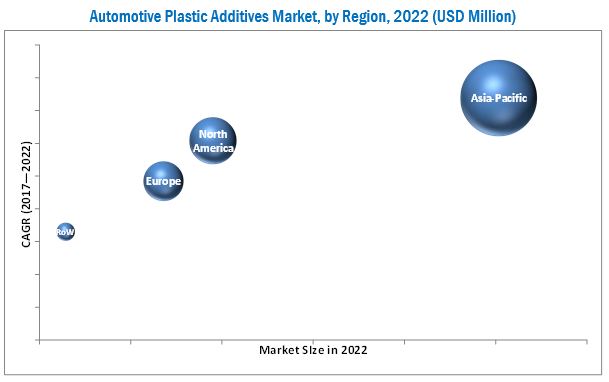
The Asia-Pacific region is estimated to be the largest market for automotive plastic additives during the forecast period, with China being the largest market for automotive plastic additives in the region. Furthermore, the electrification of vehicles is also driving the automotive plastic additives market in this region.
The key factors restraining the growth of the automotive plastic additives market include the impact on health and the Corporate Average Fuel Economy (CAFE) emission regulations. Volatile Organic Compounds (VOC) are emitted during the processing of plastics. High VOCs are harmful for health. In 2015, the CAFE standards were 39 miles per gallon (mpg) for cars and 23.5 mpg for trucks. For the year 2020, the CAFE standards rise to 49 mpg for cars and 25 mpg for trucks. Automakers must find ways to meet them. The market is dominated by many international as well as domestic players such as BASF SE (Germany), ExxonMobil Corporation (U.S.), Covestro AG (Germany), The Dow Chemical Company (U.S.), Sabic (Saudi Arabia), and Akzo Nobel N.V. (Netherlands) among others.
To speak to our analyst for a discussion on the above findings, click Speak to Analyst
 Exclusive indicates content/data unique to MarketsandMarkets and not available with any competitors.
Table of Contents
1 Introduction (Page No. - 17)
1.1 Objectives of the Study
1.2 Market Definition
1.3 Market Scope
1.3.1 Markets Covered
1.3.2 Years Considered for the Study
1.4 Currency
1.5 Package Size
1.6 Limitations
1.7 Stakeholders
2 Research Methodology (Page No. - 21)
2.1 Research Data
2.2 Secondary Data
2.3 Primary Data
2.3.1 Sampling Techniques & Data Collection Methods
2.3.2 Primary Participants
2.4 Data Triangulation
2.5 Factor Analysis
2.5.1 Introduction
2.5.2 Demand Side Analysis
2.5.2.1 Increasing Demand for Light Weight Vehicles
2.5.2.2 Design Flexibility
2.5.3 Supply Side Analysis
2.5.3.1 OEMs Focus on Safety, Comfort, and Aesthetics in Vehicle
2.5.3.2 Functional Advancements in Automotive Industry
2.6 Market Size Estimation
2.7 Assumptions
3 Executive Summary (Page No. - 30)
3.1 Introduction
4 Premium Insights (Page No. - 38)
4.1 Introduction
4.2 Opportunities in the Automotive Plastic Additives
4.3 Automotive Plastic Additives, By Region, 2017—2022
4.4 Automotive Plastic Additives, By Vehicle Type, 2017—2022
4.5 Automotive Plastic Additives, By Plastic Type, 2017—2022
4.6 Automotive Plastic Additives, By Automotive Application Type, 2017—2022
4.7 Automotive Plastic Additives, By Additive Type, 2017—2022
5 Market Overview (Page No. - 42)
5.1 Introduction
5.2 Market Segmentation
5.2.1 Automotive Plastic Additives Segmentation
5.3 Market Dynamics
5.3.1 Drivers
5.3.1.1 Innovation in Vehicle Design
5.3.1.2 Optimum Fuel Efficiency
5.3.1.3 Reduction in Production Costs
5.3.1.4 Safety and Security
5.3.2 Restraints
5.3.2.1 Effect on Health and Related Issues
5.3.3 Opportunities
5.3.3.1 Opportunities in 3D Printing Market
5.3.3.2 Reduction in Cost of Vehicle
5.3.3.3 Electrification of Vehicles
5.3.4 Challenges
5.3.4.1 Government Regulations to Meet Cafe Standards
6 Automotive Plastic Additives, By Plastic Additives (Page No. - 54)
6.1 Introduction
6.2 Automotive Plastic Additives, By Plastic Additives
6.2.1 Plasticizers: Automotive Plastic Additives, By Region
6.2.2 Anti-Scratch: Automotive Plastic Additives, By Region
6.2.3 Stabilizers: Automotive Plastic Additives, By Region
6.2.4 Antioxidants: Automotive Plastic Additives, By Region
6.2.5 Others: Automotive Plastic Additives, By Region
7 Automotive Plastic Additives, By Plastic Type (Page No. - 65)
7.1 Introduction
7.2 Polypropylene
7.2.1 Introduction
7.2.2 Automotive Plastic Additives for Polypropylene
7.2.3 Asia-Pacific: Automotive Plastic Additives for Polypropylene
7.2.4 Europe: Automotive Plastic Additives for Polypropylene
7.2.5 North America: Automotive Plastic Additives for Polypropylene
7.2.6 RoW: Automotive Plastic Additives for Polypropylene
7.3 Polyurethane (PUR)
7.3.1 Introduction
7.3.2 Automotive Plastic Additives for Polyurethane
7.3.3 Asia-Pacific: Automotive Plastic Additives for Polyurethane
7.3.4 Europe: Automotive Plastic Additives for Polyurethane
7.3.5 North America: Automotive Plastic Additives for Polyurethane
7.3.6 RoW: Automotive Plastic Additives for Polyurethane
7.4 Poly-Vinyl-Chloride (PVC)
7.4.1 Introduction
7.4.2 Automotive Plastic Additives for Poly-Vinyl-Chloride
7.4.3 Asia-Pacific: Automotive Plastic Additives for Poly-Vinyl-Chloride
7.4.4 Europe: Automotive Plastic Additives for Poly-Vinyl-Chloride
7.4.5 North America: Automotive Plastic Additives for Poly-Vinyl-Chloride
7.4.6 RoW: Automotive Plastic Additives for Poly-Vinyl-Chloride
7.5 Acrylonitrile Butadiene Styrene (ABS)
7.5.1 Introduction
7.5.2 Asia-Pacific: Automotive Plastic Additives for Acrylonitrile Butadiene Styrene
7.5.3 Europe: Automotive Plastic Additives for Acrylonitrile Butadiene Styrene
7.5.4 North America: Automotive Plastic Additives for Acrylonitrile Butadiene Styrene
7.5.5 RoW: Automotive Plastic Additives for Acrylonitrile Butadiene Styrene
8 Automotive Plastic Additives, By Automotive Application (Page No. - 91)
8.1 Introduction
8.2 Automotive Plastic Additives, By Automotive Application
8.2.1 Exterior Application: Automotive Plastic Additives, By Region
8.2.2 Interior Application: Automotive Plastic Additives, By Region
8.2.3 Under the Hood: Automotive Plastic Additives, By Region
8.2.4 Electronics and Electrical: Automotive Plastic Additives, By Region
9 Automotive Plastic Additives, By Vehicle Type (Page No. - 107)
9.1 Introduction
9.2 Passenger Cars
9.2.1 Introduction
9.2.2 Passenger Car: Automotive Plastic Additives
9.3 Light Commercial Vehicle (LCV)
9.3.1 Introduction
9.3.2 Light Commercial Vehicle: Automotive Plastic Additives
9.4 Heavy Commercial Vehicle (HCV)
9.4.1 Introduction
9.4.2 Heavy Commercial Vehicle: Automotive Plastic Additives
9.5 Electric Vehicle
9.5.1 Introduction
9.5.2 Automotive Plastic Additives for Electric Vehicle
9.5.2.1 Automotive Plastic Additives for Battery Electric Vehicle
9.5.2.2 Automotive Plastic Additives for Plug-In Hybrid Electric Vehicle
9.5.2.3 Automotive Plastic Additives for Hybrid Electric Vehicle
10 Automotive Plastic Additives, By Region (Page No. - 125)
10.1 Introduction
10.2 Automotive Plastic Additives, By Region
10.2.1 Asia-Pacific: Automotive Plastic Additives, By Country
10.2.2 Europe: Automotive Plastic Additives, By Country
10.2.3 North America: Automotive Plastic Additives, By Country
10.2.4 Rest of the World: Automotive Plastic Additives, By Country
11 Competitive Landscape (Page No. - 138)
11.1 Introduction
11.1.1 Vanguards
11.1.2 Innovators
11.1.3 Dynamic
11.1.4 Emerging
11.2 Competitive Benchmarking
11.2.1 Product Offerings (For All 18 Players)
11.2.2 Business Strategy (For All 18 Players)
11.3 Market Ranking Analysis: Automotive Plastic Additives
12 Company Profiles (Page No. - 142)
12.1 Exxon Mobil Corporation
12.1.1 Overview
12.1.2 Exxon Mobil Corporation: Product Offering Scorecard
12.1.3 Exxon Mobil Corporation: Business Strategy Scorecard
12.1.4 Recent Developments
12.2 BASF SE
12.2.1 Overview
12.2.2 BASF SE: Product Offering Scorecard
12.2.3 BASF SE: Business Strategy Scorecard
12.2.4 Recent Developments
12.3 The DOW Chemical Company
12.3.1 Overview
12.3.2 The DOW Chemical Company: Product Offering Scorecard
12.3.3 The DOW Chemical Company: Business Strategy Scorecard
12.3.4 Recent Developments
12.4 Sabic
12.4.1 Overview
12.4.2 Sabic: Product Offering Scorecard
12.4.3 Sabic: Business Strategy Scorecard
12.4.4 Recent Developments
12.5 Akzo Nobel Nv
12.5.1 Overview
12.5.2 Akzo Nobel Nv: Product Offering Scorecard
12.5.3 Akzo Nobel Nv: Business Strategy Scorecard
12.5.4 Recent Developments
12.6 Evonik Industries
12.6.1 Overview
12.6.2 Evonik Industries: Product Offering Scorecard
12.6.3 Evonik Industries: Business Strategy Scorecard
12.6.4 Recent Developments
12.7 Covestro AG
12.7.1 Overview
12.7.2 Covestro AG : Product Offering Scorecard
12.7.3 Covestro AG: Business Strategy Scorecard
12.7.4 Recent Developments
12.8 Solvay SA
12.8.1 Overview
12.8.2 Solvay SA: Product Offering Scorecard
12.8.3 Solvay SA: Business Strategy Scorecard
12.8.4 Recent Developments
12.9 Lanxess AG
12.9.1 Overview
12.9.2 Lanxess AG: Product Offering Scorecard
12.9.3 Lanxess AG: Business Strategy Scorecard
12.9.4 Recent Developments
12.10 Clariant AG
12.10.1 Overview
12.10.2 Clariant AG: Product Offering Scorecard
12.10.3 Clariant AG: Business Strategy Scorecard
12.10.4 Recent Developments
12.11 Kaneka Corporation
12.11.1 Overview
12.11.2 Kaneka Corporation: Product Offering Scorecard
12.11.3 Kaneka Corporation: Business Strategy Scorecard
12.11.4 Recent Developments
12.12 Polyone Corporation
12.12.1 Overview
12.12.2 Polyone Corporation: Product Offering Scorecard
12.12.3 Polyone Corporation: Business Strategy Scorecard
12.12.4 Recent Developments
13 Appendix (Page No. - 182)
13.1 Key Insights of Industry Experts
13.2 Discussion Guide
13.3 Introducting RT: Real Time Market Intelligence
13.4 Available Customizations
13.5 Related Reports
List of Tables (83 Tables)
Table 1 Additive Automotive Application
Table 2 Automotive Plastic Additives, By Plastic Additives, 2015–2022 (Kilotons)
Table 3 Automotive Plastic Additives, By Plastic Additives, 2015–2022 (USD Million)
Table 4 Plasticizers: Automotive Plastic Additives , By Region, 2015–2022 (Kilotons)
Table 5 Plasticizers: Automotive Plastic Additives , By Region, 2015–2022 (USD Million)
Table 6 Anti-Scratch: Automotive Plastic Additives, By Region, 2015–2022 (Kilotons)
Table 7 Anti-Scratch: Automotive Plastic Additives, By Region, 2015–2022 (USD Million)
Table 8 Stabilizers: Automotive Plastic Additives , By Region, 2015–2022 (Kilotons)
Table 9 Stabilizers: Automotive Plastic Additives , By Region, 2015–2022 (USD Million)
Table 10 Antioxidants: Automotive Plastic Additives, By Region, 2015–2022 (Kilotons)
Table 11 Antioxidants: Automotive Plastic Additives, By Region, 2015–2022 (USD Million)
Table 12 Others: Automotive Plastic Additives, By Region, 2015–2022 (Kilotons)
Table 13 Others: Automotive Plastic Additives, By Region, 2015–2022 (USD Million)
Table 14 Automotive Plastic Additives, By Plastic Type, 2015–2022 (Kilotons)
Table 15 Automotive Plastic Additives, By Plastic Type, 2015–2022 (USD Million)
Table 16 Polypropylene: Automotive Plastic Additives, By Region, 2015–2022 (Kilotons)
Table 17 Polypropylene: Automotive Plastic Additives, By Region (2015–2022) (USD Million)
Table 18 Asia-Pacific: Automotive Plastic Additives for Polypropylene, By Vehicle Type, 2015–2022 (Kilotons)
Table 19 Europe: Automotive Plastic Additives for Polypropylene, By Vehicle Type, 2015–2022 (Kilotons)
Table 20 North America: Automotive Plastic Additives for Polypropylene, By Vehicle Type, 2015–2022 (Kilotons)
Table 21 RoW: Automotive Plastic Additives for Polypropylene, By Vehicle Type, 2015–2022 (Kilotons)
Table 22 Polyurethane: Automotive Plastic Additives, By Region, 2015–2022 (Kilotons)
Table 23 Polyurethane: Additives Market, By Region (2015–2022) (USD Million)
Table 24 Asia-Pacific: Automotive Plastic Additives for Polyurethane, By Vehicle Type, 2015–2022 (Kilotons)
Table 25 Europe: Automotive Plastic Additives for Polyurethane, By Vehicle Type, 2015–2022 (Kilotons)
Table 26 North America: Automotive Plastic Additives for Polyurethane, By Vehicle Type, 2015–2022 (Kilotons)
Table 27 RoW: Automotive Plastic Additives for Polyurethane, By Vehicle Type, 2015–2022 (Kilotons)
Table 28 Poly-Vinyl-Chloride: Automotive Plastic Additives, By Region, 2015–2022 (Kilotons)
Table 29 Poly-Vinyl-Chloride: Additives Market, By Region (2015–2022) (USD Million)
Table 30 Asia-Pacific: Automotive Plastic Additives for Poly-Vinyl-Chloride, By Vehicle Type, 2015–2022 (Kilotons)
Table 31 Europe: Automotive Plastic Additives for Poly-Vinyl-Chloride, By Vehicle Type, 2015–2022 (Kilotons)
Table 32 North America: Automotive Plastic Additives for Poly-Vinyl-Chloride, By Vehicle Type, 2015–2022 (Kilotons)
Table 33 RoW: Automotive Plastic Additives for Poly-Vinyl-Chloride, By Vehicle Type, 2015–2022 (Kilotons)
Table 34 Acrylonitrile Butadiene Styrene: Automotive Plastic Additives, By Region, 2015–2022 (Kilotons)
Table 35 Acrylonitrile Butadiene Styrene: Automotive Plastic Additives, By Region (2015–2022) (USD Million)
Table 36 Asia-Pacific: Automotive Plastic Additives for Acrylonitrile Butadiene Styrene, By Vehicle Type, 2015–2022 (Kilotons)
Table 37 Europe: Automotive Plastic Additives for Acrylonitrile Butadiene Styrene, By Vehicle Type, 2015–2022 (Kilotons)
Table 38 North America: Automotive Plastic Additives for Acrylonitrile Butadiene Styrene, By Vehicle Type, 2015–2022 (Kilotons)
Table 39 RoW: Automotive Plastic Additives for Acrylonitrile Butadiene Styrene, By Vehicle Type, 2015–2022 (Kilotons)
Table 40 Automotive Plastic Additives, By Automotive Application, 2015–2022 (Kilotons)
Table 41 Automotive Plastic Additives, By Automotive Application, 2015–2022 (USD Million)
Table 42 Exterior Application: Automotive Plastic Additives, By Region, 2015—2022 (Kilotons)
Table 43 Exterior Application: Automotive Plastic Additives, By Region, 2015–2022 (USD Million)
Table 44 Exterior Application: Automotive Plastic Additives, By Component, 2015—2022 (Kilotons)
Table 45 Exterior Application: Automotive Plastic Additives, By Component, 2015–2022 (USD Million)
Table 46 Interior Application: Automotive Plastic Additives, By Region, 2015—2022 (Kilotons)
Table 47 Interior Application: Automotive Plastic Additives, By Region, 2015–2022 (USD Million)
Table 48 Interior Application: Automotive Plastic Additives, By Component, 2015–2022 (Kilotons)
Table 49 Interior Application: Automotive Plastic Additives, By Component, 2015–2022 (USD Million)
Table 50 Under the Hood Application: Automotive Plastic Additives, By Region, 2015–2022 (Kilotons)
Table 51 Under the Hood Application: Automotive Plastic Additives, By Region, 2015–2022 (USD Million)
Table 52 Under the Hood Application: Automotive Plastic Additives, By Component, 2015–2022 (Kilotons)
Table 53 Under the Hood Application: Automotive Plastic Additives, By Component, 2015–2022 (USD Million)
Table 54 Electronics and Electrical Application: Automotive Plastic Additives, By Region, 2015–2022 (Kilotons)
Table 55 Electronics and Electrical Application: Automotive Plastic Additives, By Region, 2015—2022 (USD Million)
Table 56 Electronics and Electrical Application: Automotive Plastic Additives, By Component, 2015–2022 (Kilotons)
Table 57 Electronics and Electrical: Automotive Plastic Additives, By Component, 2015–2022 (USD Million)
Table 58 Automotive Plastic Additives, By Vehicle Type, 2015–2022 (Kilotons)
Table 59 Automotive Plastic Additives, By Vehicle Type, 2015–2022 (USD Million)
Table 60 Passenger Car: Automotive Plastic Additives, By Region, 2015–2022 (Kilotons)
Table 61 Passenger Car: Automotive Additives Market, By Region (2015–2022) (USD Million)
Table 62 Light Commercial Vehicle: Automotive Plastic Additives, By Region, 2015–2022 (Kilotons)
Table 63 Light Commercial Vehicle: Automotive Additives Market, By Region (2015–2022) (USD Million)
Table 64 Heavy Commercial Vehicle: Automotive Plastic Additives, By Region, 2015–2022 (Kilotons)
Table 65 Heavy Commercial Vehicle: Automotive Additives Market, By Region (2015–2022) (USD Million)
Table 66 Electric Vehicle: Automotive Plastic Additives, By Region (2015–2022) (Kilotons)
Table 67 Electric Vehicle: Automotive Plastic Additives, By Region (2015–2022) (USD Million)
Table 68 Battery Electric Vehicle: Automotive Plastic Additives, By Region (2015–2022) (Kilotons)
Table 69 Battery Electric Vehicle: Automotive Plastic Additives, By Region (2015–2022) (USD Million)
Table 70 Plug-In Hybrid Electric Vehicle: Automotive Plastic Additives, By Region (2015–2022) (Kilotons)
Table 71 Plug-In Hybrid Electric Vehicle: Automotive Plastic Additives, By Region (2015–2022) (USD Million)
Table 72 Hybrid Electric Vehicle: Automotive Plastic Additives, By Region (2015–2022) (Kilotons)
Table 73 Hybrid Electric Vehicle: Automotive Plastic Additives, By Region (2015–2022) (USD Million)
Table 74 Automotive Plastic Additives, By Region, 2015–2022 (Kilotons)
Table 75 Automotive Plastic Additives, By Region, 2015–2022 (USD Million)
Table 76 Asia-Pacific: Automotive Plastic Additives, By Country, 2015–2022 (Kilotons)
Table 77 Asia-Pacific: Automotive Plastic Additives, By Country, 2015–2022 (USD Million)
Table 78 Europe: Automotive Plastic Additives, By Country, 2015–2022 (Kilotons)
Table 79 Europe: Automotive Plastic Additives, By Country, 2015–2022 (USD Million)
Table 80 North America: Automotive Plastic Additives, By Country, 2015–2022 (Kilotons)
Table 81 North America: Automotive Plastic Additives, By Country, 2015–2022 (USD Million)
Table 82 Rest of the World: Automotive Plastic Additives, By Country, 2015–2022 (Kilotons)
Table 83 Rest of the World: Automotive Plastic Additives, By Country, 2015–2022 (USD Million)
List of Figures (60 Figures)
Figure 1 Automotive Additives Market: Markets Covered
Figure 2 Research Design
Figure 3 Research Methodology Model
Figure 4 Breakdown of Primary Interviews: By Company Type, Designation, & Region
Figure 5 Average Percentage of Materials, By Average Vehicle Weight
Figure 6 Global Automotive Plastic Additives, By Plastic Additives: Top-Down Approach
Figure 7 Key Countries in the Automotive Plastic Additives (USD Million): China is Estimated to Be the Largest Market By 2022
Figure 8 Automotive Plastic Additives Outlook (2017—2022), By Application Type: Interior Application Segment to Grow at the Highest CAGR of 6.82% During the Forecast Period
Figure 9 Automotive Plastic Additives Outlook (2017—2022), By Vehicle Type: Electric Vehicle is the Fastest Growing Market Owing to Huge Vehicle Production Globally
Figure 10 Automotive Plastic Additives (2017—2022), By Plastic Additives: Antioxidants is the Fastest Growing Additive Owing to the Need to Prevent the Oxidation of Plastic
Figure 11 Automotive Plastic Additives, By Plastic Type (Volume): Polypropylene is Estimated to Acquire the Largest Market Share in 2022
Figure 12 Automotive Plastic Additives (2017—2022), By Region: Asia-Pacific is Estimated to Hold the Largest Market Share Owing to High Production of Automobiles in the Region
Figure 13 The Demand for Lightweight Vehicles is Expected to Drive the Automotive Plastic Additives
Figure 14 Asia-Pacific to Hold the Largest Market, By Value, for Automotive Additives
Figure 15 Passenger Cars to Hold the Largest Share, By Value, in the Automotive Plastic Additives By Vehicle Type
Figure 16 Polypropylene to Hold the Largest Share, By Value, in the Automotive Plastic Additives By Plastic Type
Figure 17 Interior to Hold the Largest Share, By Value, in the Automotive Plastic Additives, By Automotive Application Type
Figure 18 Antioxidants to Hold the Largest Share, By Value, in the Automotive Plastic Additives, By Plastic Additive Type
Figure 19 Automotive Plastic Additives
Figure 20 Automotive Plastic Additives: By Plastic Additive Type
Figure 21 Automotive Plastic Additives: By Vehicle Type
Figure 22 Automotive Plastic Additives: By Automotive Application
Figure 23 Automotive Plastic Additives: By Region
Figure 24 Automotive Plastic Additives: By Plastic Type
Figure 25 Automotive Plastic Additives: Market Dynamics
Figure 26 Antioxidants to Be the Largest Segment in Automotive Plastic Additives, By Plastic Additives, 2017—2022 (Kilotons)
Figure 27 Automotive Plastic Additives, By Vehicle Type, 2017 vs 2022 (USD Million)
Figure 28 Polypropylene Automotive Plastic Additives, By Region, 2017 vs 2022 (USD Million)
Figure 29 PUR Automotive Plastic Additives, By Region, 2015–2022 (USD Million)
Figure 30 PVC Automotive Plastic Additives, By Region, 2017 vs 2022 (USD Million)
Figure 31 Acrylonitrile Butadiene Styrene: Automotive Plastic Additives, By Region, 2017 vs 2022 (Kilotons)
Figure 32 Interior Application to Be the Largest in Automotive Plastic Additives, By Automotive Application, 2017—2022 (USD Million)
Figure 33 Exterior Application, Automotive Plastic Additives, By Region, 2017—2022 (USD Million)
Figure 34 Interior Application, Automotive Plastic Additives, By Region, 2017—2022 (USD Million)
Figure 35 Under the Hood Application, Automotive Plastic Additives, By Region, 2017–2022 (USD Million)
Figure 36 Under the Hood Application, Automotive Plastic Additives, By Region, 2017–2022 (USD Million)
Figure 37 Automotive Plastic Additives, By Vehicle Type, 2017 vs 2022 (USD Million)
Figure 38 Passenger Car: Automotive Plastic Additives, By Region, 2017 vs 2022 (USD Million)
Figure 39 Light Commercial Vehicle: Automotive Plastic Additives, By Region, 2017 vs 2022 (USD Million)
Figure 40 Heavy Commercial Vehicle: Automotive Additives Market, By Region, 2017 vs 2022 (USD Million)
Figure 41 Electric Vehicle: Automotive Plastic Additives, By Region, 2017 vs 2022 (USD Million)
Figure 42 Electric Vehicle: Automotive Plastic Additives, By Vehicle, 2017 vs 2022 (USD Million)
Figure 43 Regional Snapshot–China is Estimated to Be the Fastest Growing Market, By Value, in the Automotive Plastic Additives at A CAGR of 8.11% During the Forecast Period
Figure 44 Asia-Pacific Automotive Plastic Additives Snapshot—China to Hold the Largest Market Share in 2017
Figure 45 Europe Automotive Plastic Additives Snapshot—Germany to Hold the Largest Market Share in 2017
Figure 46 North America Automotive Plastic Additives Snapshot—U.S. to Hold the Largest Market Share in 2017
Figure 47 Dive Chart
Figure 48 Global Monorail System Market Ranking: 2015
Figure 49 Exxon Mobil Corporation: Company Snapshot (2016)
Figure 50 BASF SE: Company Snapshot (2016)
Figure 51 The DOW Chemical: Company Snapshot (2016)
Figure 52 Sabic: Company Snapshot (2016)
Figure 53 Akzo Nobel NV: Company Snapshot (2016)
Figure 54 Evonik Industries: Company Snapshot (2016)
Figure 55 Covestro AG : Company Snapshot (2016)
Figure 56 Solvay SA: Company Snapshot (2016)
Figure 57 Lanxess AG: Company Snapshot (2016)
Figure 58 Clariant AG: Company Snapshot (2016)
Figure 59 Kaneka Corporation: Company Snapshot (2016)
Figure 60 Polyone Corporation: Company Snapshot (2016)


Growth opportunities and latent adjacency in Automotive Plastic Additives Market