
Automotive Camera Market Size, Share & Analysis

Automotive Camera Market by Technology (Digital, Infrared, Thermal), ICE and EV Application (ACC, BSD, AFL, IPA, DMS, NVS, & PA), Vehicle Type (PC, LCV, HCV), View (Front, Rear, Surround), EV Type, Level of Autonomy, and Region - Global Forecast to 2032


OVERVIEW
Source: Secondary Research, Interviews with Experts, MarketsandMarkets Analysis
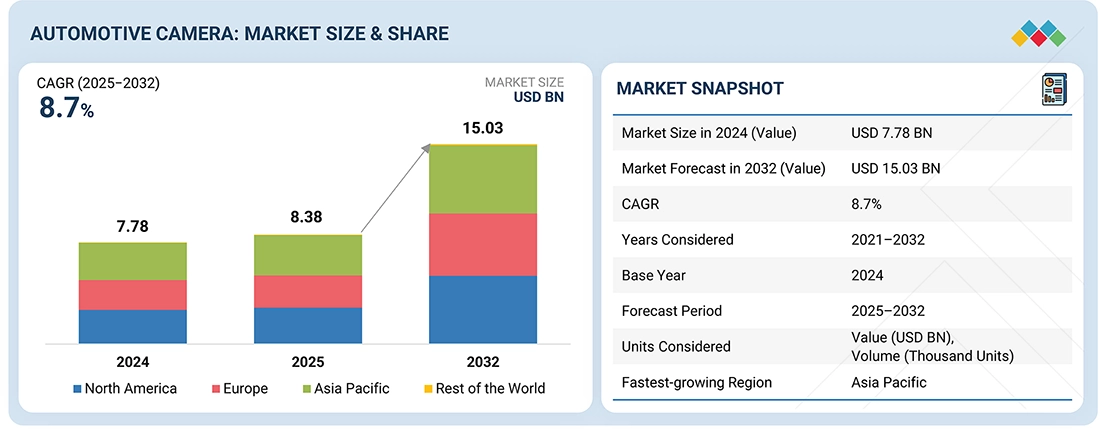
The global automotive camera market size is expected to grow from USD 8.38 billion in 2025 to USD 15.03 billion by 2032, at a CAGR of 8.7%. Rapid advances in autonomous driving technology are fueling significant growth in the global automotive camera market, creating a demand for advanced imaging solutions. As smart vehicles become more common, there is an increasing need for high-resolution cameras in driver assistance systems to improve safety and functionality. Additionally, greater focus on road safety standards is driving the adoption of automotive cameras, aimed at reducing accidents and enhancing the overall driving experience.
KEY TAKEAWAYS
-
By TechnologyBased on technology, the automotive camera market is segmented into digital, infrared, and thermal. Of the digital, infrared, and thermal cameras, digital cameras are expected to be the largest market during the forecast period, primarily because they are preferred in automotive ADAS. They enable essential features like 360-degree views, lane warnings, and driver monitoring at a lower cost, are easily integrated with ECUs, and scale well for mass-market models.
-
By ICE ApplicationDuring the forecast period, the blind spot detection segment is expected to be the largest due to the global emphasis on vehicle safety features. Cameras are essential for automotive safety, providing precise, real-time coverage of the vehicle's surroundings. This functional necessity, especially for commercial fleets and in urban areas, combined with regulatory requirements, makes blind spot detection the foundational application for all automotive camera systems.
-
By Vehicle TypeThe automotive camera market is categorized by vehicle type into passenger cars, light commercial vehicles, and heavy commercial vehicles. The passenger car segment is expected to be the largest market for automotive cameras during the forecast period. The increasing adoption of ADAS and safety features is a key reason for this expansion.
-
By View TypeThe study divides automotive cameras in three primary categories based on view type: front view, surround view, and rear view. The front view segment of the automotive camera market is expected to be the largest during the forecast period, driven by the rising demand for advanced safety features such as collision avoidance and driver monitoring systems.
-
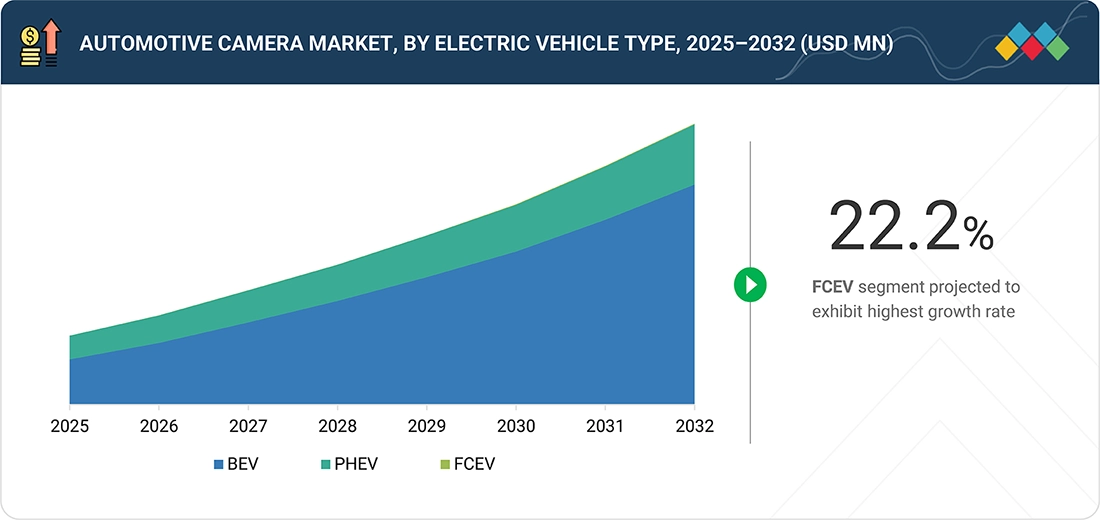
By EV TypeThe intelligent parking assist segment is projected to have highest CAGR during the forecast period. A key driver behind this surge is the increasing adoption of EVs with advanced features. The BEV segment is expected to be the largest during the forecast period owing to the largest share of ~65% in overall electric and hybrid powertrain vehicle sales. The primary growth factor is increasing adoption of ADAS applications which rely heavily on advanced camera systems.
-
By EV ApplicationThe intelligent parking assist segment is projected to showcase fastest growth rate during the forecast period as EVs utilize technical foundations like by-wire controls, advanced software, and electric actuators - unlike traditional ICE mechanical linkages - to enable precise, low-speed maneuvering. This foundation allows for smoother, more accurate parking automation, rapid over-the-air (OTA) updates, and seamless sensor fusion, positioning park assist as a key ADAS feature in electric platforms.
-
By Level of AutonomyThe automotive camera market is categorized into different autonomy levels: L0/L1, L2, and L3. The L2 segment of the automotive camera market is expected to witness the highest growth during the forecast period. The rising demand for enhanced safety features in vehicles which can effectively and efficiently provided by L2 segment. Consumers are increasingly prioritizing safety; automobile manufacturers are integrating driver assistance features into their offerings, which predominantly fall within the L2 autonomy levels.
-
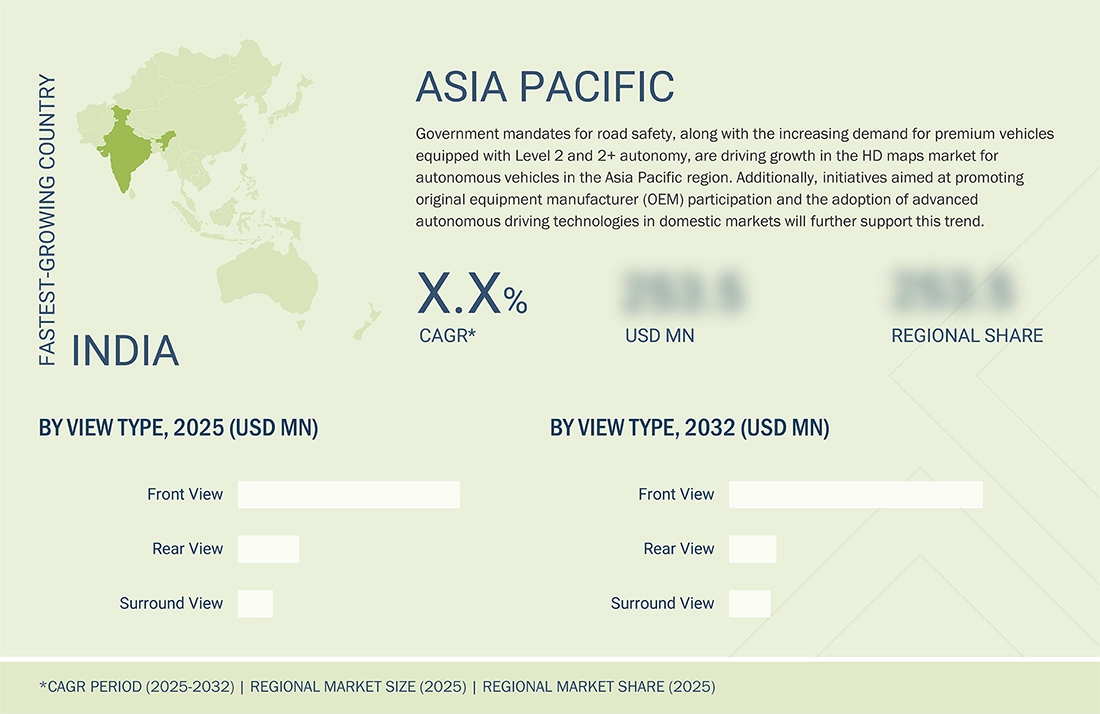
By RegionAsia Pacific is expected to become the largest market for automotive cameras, driven by the rising demand for passenger cars equipped with ADAS features like adaptive cruise control in countries such as China, South Korea, Japan, India and others. Additionally, regulations by authorities in countries like Japan on automatic headlight systems also support the market growth in Asia Pacific.
The automotive camera market is anticipated to grow significantly in the coming years due to the increasing automation and adoption of advanced driver assistance systems, which are driving the demand for high-performance cameras across various vehicle applications. Additionally, growing emphasis on vehicle safety and the development of smart transportation infrastructure worldwide fuel the need for advanced imaging and sensing solutions, further propelling the growth of the market during the forecast period.
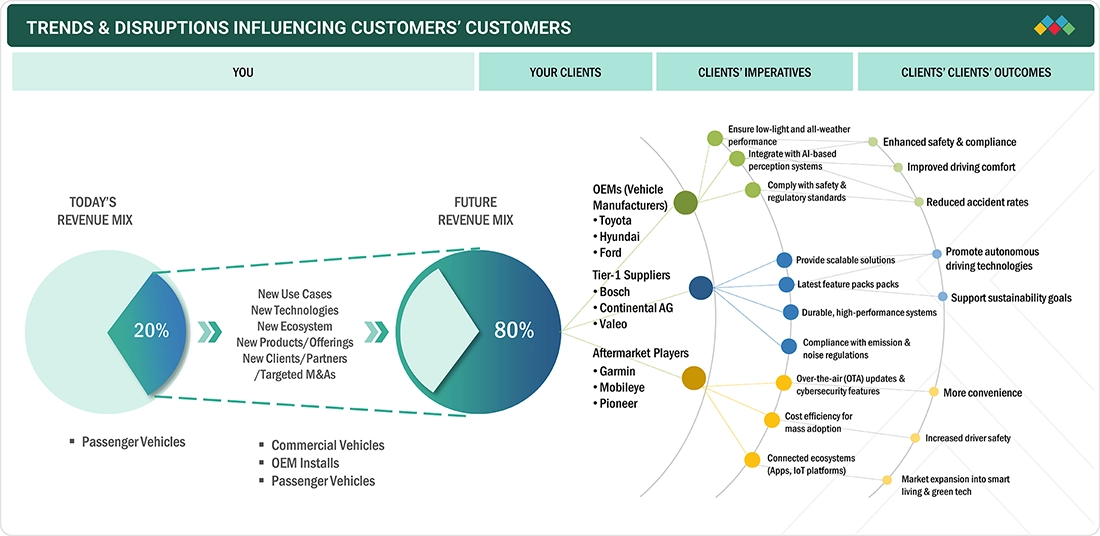
TRENDS & DISRUPTIONS IMPACTING CUSTOMERS' CUSTOMERS
Trends and disruptions in the automotive camera market show changing technology, including AI integration, high-resolution sensors, and thermal imaging for better safety and self-driving features. Revenue models are shifting toward integrated systems with real-time analytics, fueled by demands for features like surround-view monitoring and in-cabin sensing. The adoption of 3D cameras and radar hybrids is speeding up, improving detection accuracy, with companies like Tesla and LG leading in 2025. Government rules, such as requirements for rear-view cameras in regions like the US and India, are encouraging widespread deployment. As connected vehicles grow, camera technology is becoming mainstream, supporting V2X connectivity and personalized experiences.
Source: Secondary Research, Interviews with Experts, MarketsandMarkets Analysis
MARKET DYNAMICS
Level
-
Increasing consumer demand for ADAS in vehicles

-
Government initiatives for improved vehicle safety

Level
-
Impact of adverse weather conditions

-
Lack of infrastructure in emerging economies

Level
-
Growing push for autonomous vehicles

-
Surge in demand for premium vehicles

Level
-
Low adoption and high cost of advanced technologies

-
Integration with other vehicle sensors

Source: Secondary Research, Interviews with Experts, MarketsandMarkets Analysis
Driver: Increasing consumer demand for ADAS in vehicles
Automotive camera demand is increasing as consumers expect safety features like adaptive cruise control and lane assistance across all vehicle types, not just luxury models. These features, once considered premium, now appear in mid- and entry-level vehicles, especially in Asia-Pacific and North America, where regulations, urbanization, and safety awareness are high. Major growth factors include stricter safety regulations, advances in camera technology, and the growing use of AI for real-time hazard detection, making cameras essential components of ADAS systems.
Restraint: Lack of infrastructure in emerging economies
The lack of infrastructure for camera-based ADAS systems in emerging economies like India, Brazil, and Thailand is a major restraint for the automotive camera market. Poorly maintained roads, inconsistent road markings, and inadequate signage in countries such as India and Brazil hinder the proper functioning of ADAS, which heavily depends on camera technology. The limited availability of reliable internet and communication networks in many emerging markets also impedes real-time data processing and cloud connectivity, which are essential for advanced ADAS features. Additionally, high costs for upgrading infrastructure serve as a barrier, making it difficult for these countries to adopt advanced automotive technologies. These combined factors are restricting the growth and adoption of camera-based ADAS systems, thereby limiting the expansion of the market in emerging economies.
Opportunity: Growing push for autonomous vehicles
The shift toward autonomous vehicles presents a lucrative growth opportunity for the automotive camera market. These vehicles, which can drive themselves using sensors, GPS, and AI, are gaining popularity because they offer safer, more convenient, and more efficient transportation. As global interest in autonomous vehicles increases, automakers are investing more in advanced camera systems. L2 and L3 have become popular segments used to enable vehicle automation due to their cost efficiency and effectiveness. Meanwhile, China is also making progress with government-approved pilot programs in cities like Beijing and Shanghai to test highly autonomous (Level 4) vehicles.
Challenge: Low adoption and high cost of advanced technologies.
One of the main challenges in the automotive camera market is the slow adoption of advanced technologies like thermal and infrared imaging. These systems provide powerful capabilities, especially for night vision, but they come with higher development costs and must be integrated into vehicles alongside other components. Since thermal and infrared cameras need specialized research, development, and manufacturing, their costs are much higher than those of regular digital cameras. Additionally, there is a lack of expertise and infrastructure to support widespread use, making it more difficult for manufacturers to adopt, particularly in cost-sensitive markets such as India.
Automotive Camera Market: COMMERCIAL USE CASES ACROSS INDUSTRIES
| COMPANY | USE CASE DESCRIPTION | BENEFITS |
|---|---|---|
 |
Advanced driver-assistance camera modules enabling lane-keeping assist, traffic sign recognition, and automatic emergency braking | Safer driving, reduced accident rates, and compliance with global safety mandates |
 |
Surround-view and parking assist camera systems integrated with AI-based perception for passenger cars and commercial vehicles | Easier maneuvering, enhanced driver comfort, and premium vehicle positioning |
 |
Night vision and thermal imaging cameras for improved visibility in low-light and adverse weather conditions | Fewer nighttime collisions, improved pedestrian detection, and enhanced trust in ADAS features |
 |
Camera-based autonomous driving systems with object detection, crowd sensing, and real-time road condition monitoring | Scalability for autonomous fleets, improved situational awareness, and reduced insurance costs |
Logos and trademarks shown above are the property of their respective owners. Their use here is for informational and illustrative purposes only.
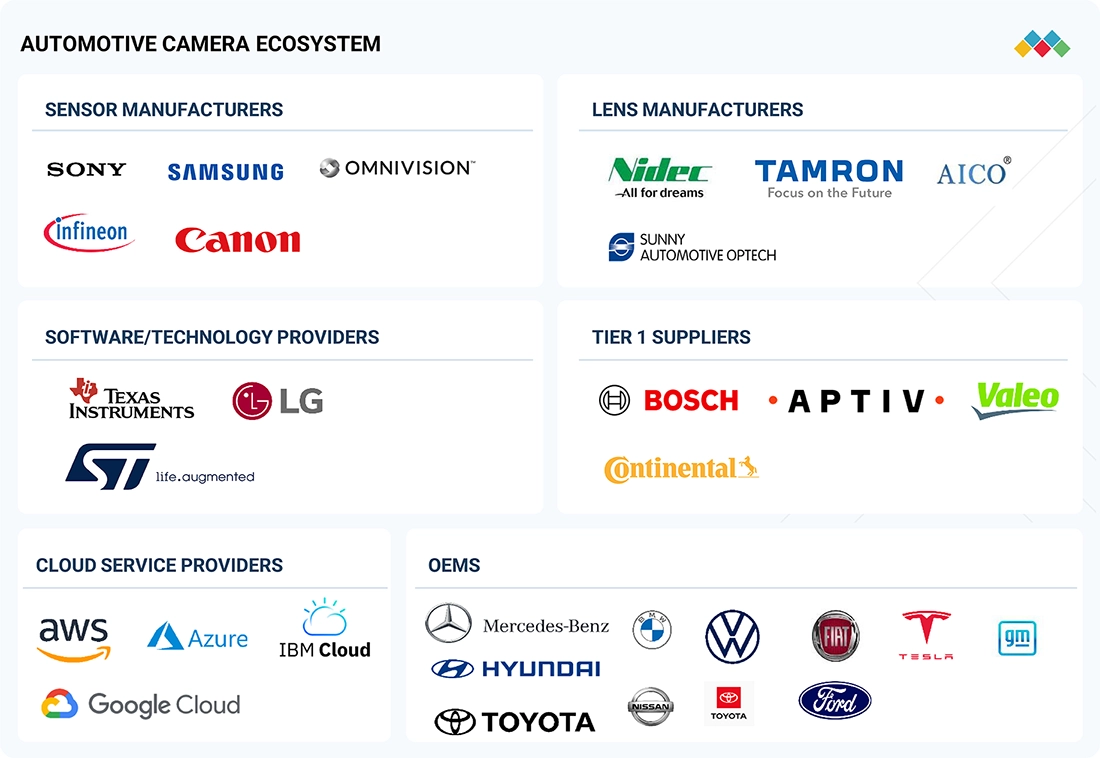
MARKET ECOSYSTEM
The automotive camera market is a network of interconnected companies collaborating to provide advanced camera technology for vehicles. Key players include sensor manufacturers like Sony Semiconductor Solutions Corporation (Japan), Samsung Electro-Mechanics (South Korea), and OmniVision (US), who produce image sensors; lens manufacturers such as Sunny Automotive Optech Co., Ltd. (China), NIDEC CORPORATION (Japan), and Ricoh (Japan), who supply high-quality lenses; and software and technology providers like LG Electronics (South Korea), STMicroelectronics (Switzerland), and Texas Instruments Incorporated (US), who develop software and technical solutions. Tier 1 suppliers like Robert Bosch GmbH (Germany), Valeo (France), Denso Corporation (Japan), and Ficosa International SA (Spain) assemble these components into complete camera systems, while cloud service providers such as Amazon Web Services, Inc. (US), Google Cloud (US), and Microsoft Azure (US) offer cloud storage and processing solutions. Leading automakers like BMW (Germany), Toyota (Japan), Mercedes-Benz AG (Germany), and Tesla (US) then integrate these camera systems into their vehicles for functions like parking assist and collision avoidance. This collaborative network ensures the delivery of advanced camera technology that enhances vehicle safety and functionality.
Logos and trademarks shown above are the property of their respective owners. Their use here is for informational and illustrative purposes only.
MARKET SEGMENTS
Source: Secondary Research, Interviews with Experts, MarketsandMarkets Analysis
By Technology
The digital segment is expected to be the largest in the automotive camera market during the forecast period, mainly because of the growing demand for driver assistance systems and vehicle safety features. Digital cameras are commonly used in applications such as dash cams, lane keep assist, and blind spot detection. The automotive digital camera market is expanding due to increased demand for ADAS features like lane assist and collision avoidance, fueled by stricter global safety regulations and consumer interest in vehicle safety. Strategic opportunities include integration with electric vehicles (EVs) and autonomous technology, enabling AI-enhanced imaging for real-time hazard detection and fleet management.
By ICE Application
During the forecast period, the blind spot detection segment is expected to be the largest due to the global focus on vehicle safety features. These systems, which alert drivers to vehicles in their blind spots, reduce accident risks driven by regulatory requirements and consumer demand for advanced safety technology. Leading automotive models like the Audi A3 and BMW X3 feature integrated rear-view cameras. The growth of blind spot detection systems is driven by increasing consumer demand for ADAS safety features, strict global regulations requiring collision avoidance technology, and improvements in radar and camera sensors for accurate hazard detection. Asia Pacific is the fastest-growing region, fueled by rapid urbanization, high vehicle production in China and India, and supportive government safety initiatives.
By Vehicle Type
The passenger car segment of the automotive camera market is expected to hold the largest market share during the forecast period. A major reason for this growth is the increasing adoption of ADAS and safety features. The new BMW 3 Series EV (2025) will include interior and surround-view cameras. These advancements demonstrate the rising demand for advanced camera systems in the Asia Pacific segment of passenger cars, reflecting a strong growth trend in the market.
By View Type
The front view segment of the automotive camera market is expected to be the largest during the forecast period. The growth of the front view segment is driven by increasing ADAS integration for features like adaptive cruise control and collision avoidance, supported by global safety regulations and advancements in autonomous vehicles. Asia Pacific leads this expansion, powered by high vehicle production in China and India, growing adoption of mid-range car ADAS, and supportive government safety policies.
By EV Type
The BEV segment is expected to be the largest during the forecast period, accounting for about 65% of overall electric and hybrid powertrain vehicle sales. The main growth driver is the increasing focus on advanced safety features and autonomous driving capabilities, which depend heavily on advanced camera systems. Growth is highest in the Asia Pacific region due to the rising adoption of EVs.
By EV Application
The intelligent parking assist segment is expected to have the highest CAGR during the forecast period. A key factor driving this growth is the increasing adoption of EVs with advanced features. This trend is most pronounced in the Asia Pacific region, driven by the rising demand for intelligent parking assist in EVs. As EVs become more common, the need for advanced safety features like IPA also increases during the forecast period.
By Level of Autonomy
The L2 segment of the automotive camera market is set to experience the highest growth during the forecast period. Increasing demand for enhanced safety features in vehicles is driving the market. Consumers are progressively prioritizing safety, and automobile manufacturers are integrating driver assistance features into their offerings, which mainly fall within the L2 autonomy levels. These systems rely heavily on automotive cameras for essential functions such as object detection and environmental perception. Therefore, the adoption of advanced driver assistance systems across the automotive sector is boosting the market for automotive cameras in the L2 segment. The highest adoption is expected in the Asia Pacific region due to the growing use of ADAS features.
By Region
During the forecast period, the Asia Pacific region is expected to lead the automotive camera market. China, being the largest vehicle manufacturer globally, makes the biggest contribution to the overall Asia Pacific market. Consumers in the region are showing increasing demand for advanced vehicle safety features, driving the adoption of automotive cameras. Major automotive camera providers like Continental AG (Germany), Robert Bosch GmbH (Germany), and Denso Corporation (Japan) are strategically expanding their presence in the Asia Pacific market to meet this growing demand. For example, in March 2024, Continental AG announced the opening of a new smart plant of Road-Broad Automotive Electronics (Qufu) Co., Ltd., in China, for producing devices such as collaborative robots, 3D printers, and AI cameras. Therefore, this expansion, along with increasing consumer awareness and regulatory support for vehicle safety, is likely to boost the growth of the market in the Asia Pacific during the forecast period.
REGION
During the forecast period, the Asia Pacific region is projected to dominate the automotive camera market.
During the forecast period, the Asia Pacific region is expected to lead the automotive camera market. China, the world’s largest vehicle manufacturer, makes the biggest contribution to the regional market. Consumers in the area are showing increasing demand for better vehicle safety features, which drives the adoption of automotive cameras. Automotive camera companies like Continental AG (Germany), Robert Bosch GmbH (Germany), and Denso Corporation (Japan) are strategically expanding their presence in Asia Pacific to meet this rising demand. For example, in March 2024, Continental AG announced the opening of a new intelligent plant for Road-Broad Automotive Electronics (Qufu) Co., Ltd., in China, to produce devices such as collaborative robots, 3D printers, and AI cameras. Therefore, this expansion, along with growing consumer awareness and regulatory support for vehicle safety, is expected to further boost the growth of the market in Asia Pacific during the forecast period.
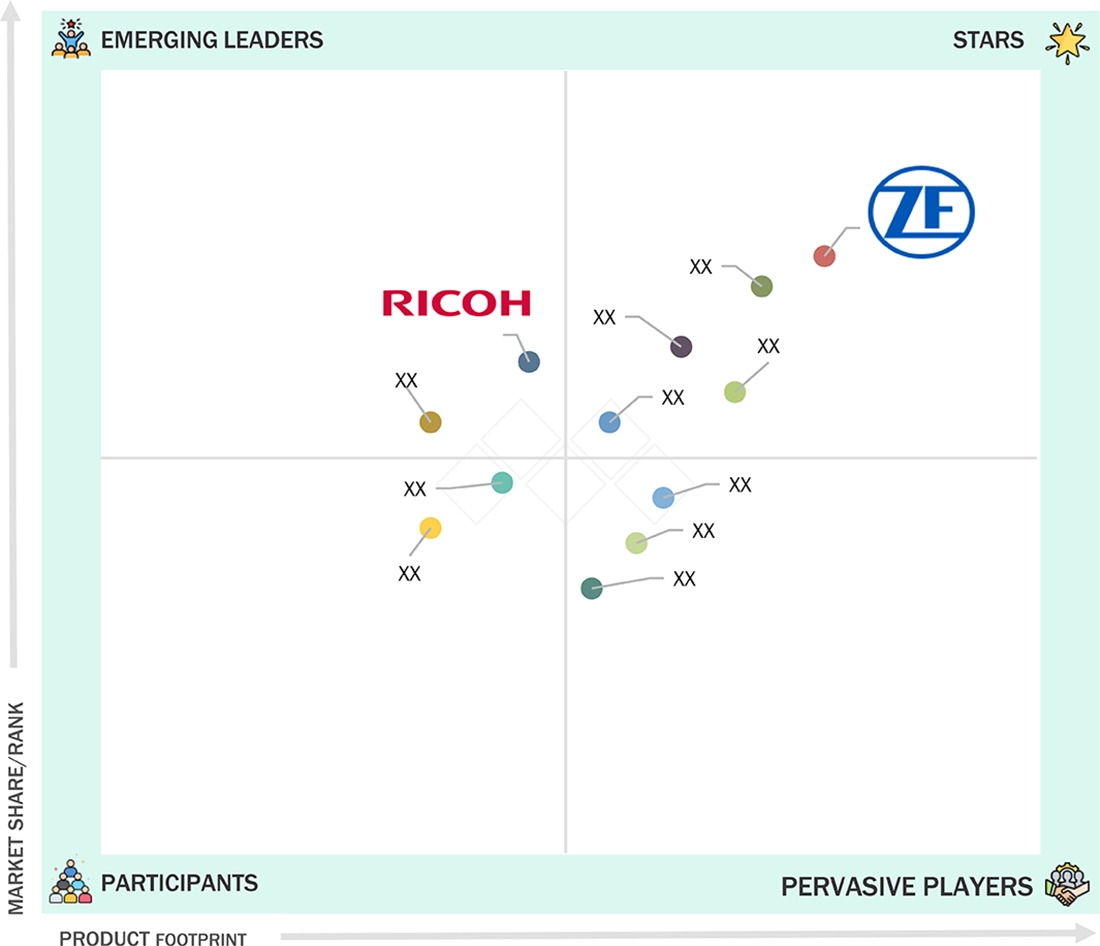
Automotive Camera Market: COMPANY EVALUATION MATRIX
The matrix shows ZF in the "Stars" quadrant because of its leading role in smart automotive camera systems, especially for advanced driver assistance and safety features, with widespread adoption across vehicle models and strong innovation in ADAS ecosystems. Ricoh is listed as an "Emerging Leader" for providing industrial smart cameras focused on precision inspection but has a more limited presence in mainstream automotive camera solutions and ecosystems. ZF maintains its position by combining large-scale camera deployment, software integration, and compliance with evolving regulations. For Ricoh to become a "Star," it needs to expand its camera products to cover a full range of automotive use cases, integrate with ADAS and vehicle software, and develop partnerships with major automakers.
Source: Secondary Research, Interviews with Experts, MarketsandMarkets Analysis
KEY MARKET PLAYERS
MARKET SCOPE
| REPORT METRIC | DETAILS |
|---|---|
| Market Size in 2024 (Value) | USD 7.78 Billion |
| Market Forecast in 2032 (Value) | USD 15.03 Billion |
| Growth Rate | CAGR of 8.7% from 2025-2032 |
| Years Considered | 2021-2032 |
| Base Year | 2024 |
| Forecast Period | 2025-2032 |
| Units Considered | Value (USD Million), Volume (Thousand Units) |
| Report Coverage | Revenue forecast, company ranking, competitive landscape, growth factors, and trends |
| Segments Covered |
|
| Regional Scope | Asia Pacific, Europe, North America, and Rest of the World |
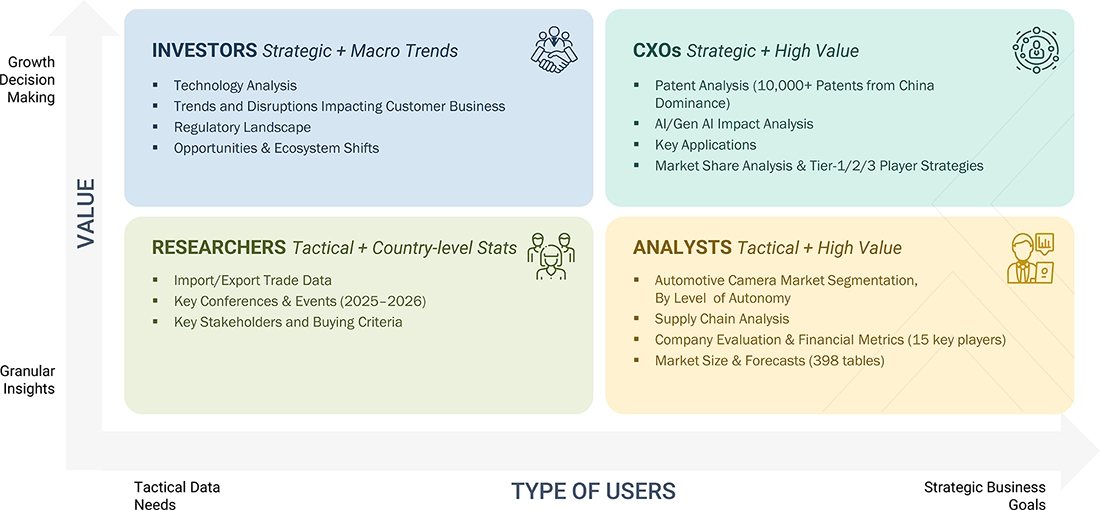
WHAT IS IN IT FOR YOU: Automotive Camera Market REPORT CONTENT GUIDE
DELIVERED CUSTOMIZATIONS
We have successfully delivered the following deep-dive customizations:
| CLIENT REQUEST | CUSTOMIZATION DELIVERED | VALUE ADDS |
|---|---|---|
| Global OEM (US) | Competitive intelligence on Bosch, Continental, ZF, and Magna in automotive cameras, including technology benchmarking and market positioning | Provided strategic insights for product development and competitive advantage in ADAS camera integration |
| Automotive Supplier (Europe) | Analysis of regulatory mandates for camera-based safety systems in EU, US, and Asia, with compliance timelines and impact assessment | Helped ensure regulatory compliance, reduced risks, and accelerated market entry for new camera modules |
| Tier 1 Integrator (Japan) | Technical deep-dive into multi-camera setups, sensor fusion with radar/LiDAR, and AI for real-time image processing | Optimized system design for better accuracy in object detection and enhanced vehicle safety features |
| EV Manufacturer (China) | Market demand forecasting for ADAS cameras in electric and autonomous vehicles, segmented by type and region | Supported targeted investments and sales strategies to capture growing demand in connected Evs |
| Fleet Management Company (Global) | Evaluation of camera software platforms for cloud connectivity, diagnostics, and integration with fleet monitoring systems | Enabled seamless integration of IoT features, improving fleet efficiency and real-time safety monitoring |
RECENT DEVELOPMENTS
- March 2024 : ZF Friedrichshafen AG (Germany) acquired a 6% stake in the South Korean software company StradVision, an artificial intelligence-based vision processing technology for autonomous vehicles and ADAS. The acquisition extends ZF’s autonomous driving perception and sensor fusion capabilities.
- January 2024 : Valeo (France) collaborated with Teledyne FLIR LLC (US), part of Teledyne Technologies Incorporated, to bring thermal imaging technology to the automotive industry to enhance the safety of road users.
- January 2024 : Continental AG (Germany) launched Face Authentication Display, a two-stage access control system based on biometric user recognition, which uses special camera systems mounted externally on the vehicle’s B-pillar and behind the driver display console. With biometric face authentication, the vehicle unlocks and starts upon detecting a registered user while enabling driver monitoring for enhanced safety.
- December 2023 : Valeo (France) launched the first remanufactured windshield-mounted video camera at Valeo’s Circular Electronics Lab.
- October 2023 : Denso Corporation (Japan) collaborated with Koito Manufacturing Co., Ltd. (Japan) to develop a system to improve the object recognition rate of vehicle image sensors at night.
- September 2023 : Robert Bosch GmbH (Germany) introduced standalone camera heads at the IAA Mobility 2023. These enable ADAS functionality from SAE levels 0 to 4 and come in 3- and 8-MP versions that can be scaled up to 12 MP. The standalone camera heads feature a telephoto camera, front and rear cameras, a wing-back camera, a front wing camera, and a new range camera.
Table of Contents
 Exclusive indicates content/data unique to MarketsandMarkets and not available with any competitors.
Methodology
The study involved four major activities to estimate the current size of the automotive camera market. Exhaustive secondary research collected information on the market, the peer market, and model mapping. The next step was to validate these findings & assumptions and size them with industry experts across value chains through primary research. The bottom-up and top-down approaches were employed to estimate the total market size. After that, market breakdown and data triangulation were used to determine the market size of segments and subsegments.
Secondary Research
In the secondary research process, various secondary sources were used to identify and collect information on the automotive camera market for this study. Secondary sources for this research study include corporate filings, such as annual reports, investor presentations, and financial statements; trade, business, and professional associations; whitepapers and automotive software-related journals; certified publications; articles by recognized authors; directories; and databases. Secondary research has been used to obtain key information about the industry’s supply chain, the overall pool of key players, market classification and segmentation according to industry trends to the bottom-most level, regional markets, and key developments from the market- and technology-oriented perspectives.
Primary Research
In the primary research process, various primary sources from both supply and demand sides were interviewed to obtain qualitative and quantitative information on the market. The primary sources from the supply side included various industry experts, such as Chief Experience Officers (CXOs), Vice Presidents (VPs), directors from the business development department, marketing experts, product development/innovation n teams, and related key executives from web content management product vendors, SIs, professional service providers, industry associations, and key opinion leaders.
Extensive primary research has been conducted after understanding the automotive camera market scenario through secondary research. Several primary interviews have been conducted with market experts from demand-side automotive camera providers and supply-side OEMs across four major regions: North America, Europe, Asia Pacific, and the Rest of the World. Approximately 30% and 70% of primary interviews have been conducted from the demand and supply sides, respectively. Primary data was collected through questionnaires, emails, and telephonic interviews. In the canvassing of primaries, various departments within organizations, such as sales, operations, and marketing, were covered to provide a holistic viewpoint in the report.
After interacting with industry experts, we also conducted brief sessions with highly experienced independent consultants to reinforce the findings from our primaries. This, along with the in-house subject matter expert opinions, led us to the findings described in the remainder of this report.

Note: Tiers of companies are based on the supply chain of the automotive camera market; companies’ revenues have not been considered.
To know about the assumptions considered for the study, download the pdf brochure
Market Size Estimation
Both top-down and bottom-up approaches were used to estimate and validate the total size of the automotive camera market. These methods were also used extensively to estimate the size of various subsegments in the market. The research methodology used to estimate the market size includes the following:
Bottom-Up Approach, By Application, By Vehicle Type
The bottom-up approach was used to estimate and validate the size of the automotive camera market. In this approach, the country-level production of each vehicle type (passenger cars, LCVs, and HCVs) was identified through country-level associations and OICA. The vehicle production forecast in each country was carried out based on multiple factors, such as country-wise macroeconomic indicators, emission regulations, automotive industry growth, GDP growth, and government initiatives.
Further, to determine the automotive camera market in terms of volume, country-level penetration of various ADAS applications by vehicle type is identified through model mapping for each country. The automotive camera installed per application by vehicle type was derived through secondary research and validated by industry experts. The country-level vehicle type production is then multiplied by the country-level ADAS application penetration of each vehicle type, and the number of cameras installed in each ADAS application gives the country-level automotive market by vehicle type and by application in terms of volume.
The average selling price of automotive cameras installed in each ADAS application for each vehicle type is derived through secondary sources and further validated by industry experts. The country-level automotive camera market volume, by application, was multiplied by the average selling price of automotive cameras, giving the market in terms of value (USD million) by vehicle type and by application.
Further, the summation of country-level markets provides the regional-level markets in terms of volume (thousand units) and value (USD million). A further summation of regional-level markets provided the global automotive camera market in terms of volume (thousand units) and value (USD million) by region and application. A similar approach was followed to derive the total number of automotive camera installations in electric vehicles by application and vehicle type.
Market Size Estimation Methodology-Bottom-up approach
In the bottom-up approach, the adoption rate of web content management products among different verticals in key countries with respect to their regions contributing the most to the market share was identified. For cross-validation, the adoption of WCM products among enterprises, along with different use cases with respect to their regions, was identified and extrapolated. Weightage was given to use cases identified in different regions for the market size calculation.
Based on the market numbers, the regional split was determined by primary and secondary sources. The procedure included the analysis of the WCM market’s regional penetration. Based on secondary research, the regional spending on Information and Communications Technology (ICT), socio-economic analysis of each country, strategic vendor analysis of major web content management providers, and organic and inorganic business development activities of regional and global players were estimated. With the data triangulation procedure and data validation through primaries, the exact values of the overall web content management market size and segments’ size were determined and confirmed using the study.
Automotive Camera Market : Bottom-Up Approach

Global Automotive Camera Market Size: Top-Down Approach, By Level of Autonomy, View Type, And Technology
The top-down approach was followed to determine the market size by view type, technology, and level of autonomy in terms of volume and value for the automotive camera market. The market volume and value by region (Asia Pacific, North America, Europe, RoW) were derived from the global market. For the view type, technology type, and level of autonomy, the different ADAS applications under different view types (front view, rear view, and surround view), different technologies (digital, infrared, and thermal), and levels of autonomy (L0/L1, L2, and L3) were considered. Through this, the market volume and value for automotive cameras, by view type, technology, and level of autonomy, were derived. The summation of all region-wise markets was carried out to obtain the total market by view type, technology, and level of autonomy in terms of volume (thousand units) and value (USD million).
Automotive Camera Market : Top-Down Approach

Data Triangulation
All percentage shares, splits, and breakdowns have been determined using secondary sources and verified by primary sources. All parameters that affect the markets covered in this research study were accounted for, viewed in extensive detail, and analyzed to obtain the final quantitative and qualitative data. This data was consolidated and enhanced with detailed inputs and analysis from MarketsandMarkets and presented in the report. The following figure is an illustrative representation of the overall market size estimation process employed for this study.
Market Definition
Automotive Camera: A camera is a device that records visual images in the form of photographs, films, or video signals. In the automotive sector, a camera is used as an advanced safety device to enhance the visibility of the surrounding environment of a driver and improve vehicle safety. An automotive camera records images through lenses and converts them into electrical signals. The growing demand for advanced driver assist systems (ADAS) in developed and emerging economies is attributed to the use of cameras in various applications such as parking assist, cross-traffic alert, and pedestrian detection systems.
Stakeholders
- ADAS Integrators
- Automotive Camera Component Manufacturers
- Automotive Camera Manufacturers
- Automotive Software and Platform Providers
- Autonomous Driving Platform Providers
- Government and Research Organizations
- National Highway Traffic Safety Administration (NHTSA)
- Raw Material Suppliers for Automotive Cameras
- Transport Authorities
- Vehicle Safety Regulatory Bodies
Report Objectives
- To segment and forecast the automotive camera market in terms of volume (thousand units) and value (USD million)
- To define, describe, and forecast the market based on technology, ICE application, vehicle type, view type, electric vehicle (EV) type, EV application, level of autonomy, and region
-
To analyze regional markets for growth trends, prospects, and their contribution to the overall market
- To segment and forecast the market by technology (digital, infrared, and thermal)
- To segment and forecast the market by ICE application (adaptive cruise control; adaptive cruise control + forward collision warning; adaptive cruise control + forward collision warning + traffic sign recognition; blind spot detection; blind spot detection + lane keep assist + lane departure warning; adaptive lighting system; intelligent parking assist; driver monitoring system; night vision system; parking assist)
- To segment and forecast the market by vehicle type (ICE) (passenger car, light commercial vehicle, heavy commercial vehicle)
- To segment and forecast the market by view type (front view, surround view, and rear view)
- To segment and forecast the market by EV type [battery electric vehicle (BEV), plug-in hybrid electric vehicle (PHEV), fuel cell electric vehicle (FCEV)]
- To segment and forecast the market by EV application (adaptive cruise control; adaptive cruise control + forward collision warning; adaptive cruise control + forward collision warning + traffic sign recognition; blind spot detection; blind spot detection + lane keep assist + lane departure warning; adaptive lighting systems; intelligent parking assist; driver monitoring systems; night vision systems; parking assist)
- To segment and forecast the market by level of autonomy (L0/ L1, L2, and L3)
- To forecast the market by region [North America, Europe, Asia Pacific, and the Rest of the World (RoW)]
- To analyze technological developments impacting the market
- To provide detailed information about the major factors influencing the market growth (drivers, challenges, restraints, and opportunities)
- To strategically analyze the market, considering individual growth trends, prospects, and contributions to the total market
-
To study the following concerning the market
- Impact of AI/Gen AI on the automotive camera market
- Trends/Disruptions impacting customer business
- Supply chain analysis
- Ecosystem analysis
- Technology analysis
- Trade analysis/HS code analysis
- Case study analysis
- Patent analysis
- Regulatory landscape
- Key stakeholders and buying criteria
- Key conferences and events
- Supplier analysis
- Investment and funding scenario
-
To estimate the following with respect to the automotive camera market:
-
Pricing analysis
- By vehicle type
- By region
- Market share analysis
-
Pricing analysis
- To strategically profile key players and comprehensively analyze their market shares and core competencies
- To track and analyze competitive developments, such as product launches, deals, and expansions, carried out by key industry participants
Available Customizations
With the given market data, MarketsandMarkets offers customizations in accordance with the company’s specific needs.
- GLOBAL AUTOMOTIVE CAMERA MARKET, BY APPLICATION AND VEHICLE TYPE (ICE)
Note: The market will be provided for ICE vehicle types – passenger cars, light commercial vehicles, and heavy commercial vehicles. No further bifurcation at the regional level will be provided.
- ELECTRIC & HYBRID VEHICLE CAMERA MARKET, BY APPLICATION AND ELECTRIC VEHICLE TYPE
Note: The market will be provided for electric & hybrid vehicle types – BEV, PHEV, and FCEV. No further bifurcation at the regional level will be provided.
Company Information
- Profiling of additional market players (Up to 5)
Key Questions Addressed by the Report
What is the current size of the global automotive camera market?
The automotive camera market is projected to grow from USD 8.40 billion in 2025 to USD 15.34 billion by 2035 at a CAGR of 9.0%.
Which camera technology is projected to experience the highest growth in the global automotive camera market during the forecast period?
Thermal camera technology is projected to grow the fastest in the global automotive camera market during the forecast period. Increasing adoption of night vision systems will drive the thermal camera technology.
How does the demand for automotive cameras vary by region?
Asia Pacific holds the largest market share during the forecast period, followed by North America. The higher demand for cameras in Asia Pacific is mainly due to the growing demand for driver assistance features by consumers in the region and rising vehicle production of passenger cars and heavy-duty vehicles in developing countries like India and China.
Which adjacent markets will be impacted due to the growth of the automotive camera market?
Growing demand for the automotive camera market will impact adjacent companies such as sensors, software, ECUs, lenses, cloud services, and wiring harnesses.
What are the trends in the global automotive camera market?
The new market trends, such as the growth of autonomous vehicles and advancements in thermal imaging, are impacting the growth of the automotive camera market.
Need a Tailored Report?
Customize this report to your needs
Get 10% FREE Customization
Customize This ReportPersonalize This Research
- Triangulate with your Own Data
- Get Data as per your Format and Definition
- Gain a Deeper Dive on a Specific Application, Geography, Customer or Competitor
- Any level of Personalization
Let Us Help You
- What are the Known and Unknown Adjacencies Impacting the Automotive Camera Market
- What will your New Revenue Sources be?
- Who will be your Top Customer; what will make them switch?
- Defend your Market Share or Win Competitors
- Get a Scorecard for Target Partners

Custom Market Research Services
We Will Customise The Research For You, In Case The Report Listed Above Does Not Meet With Your Requirements
Get 10% Free Customisation


Growth opportunities and latent adjacency in Automotive Camera Market