AI in Chemicals Market

Report Code TC 9012
Published in May, 2024, By MarketsandMarkets™
Download PDF

Choose License Type

Buy Report Now Inquire Before Buying

AI in Chemicals Market by Hardware (Accelerators, Processors, Memory, Network), Software (Dashboard & Analytics, Process Simulation, Laboratory Management, Chemical Property Prediction, Virtual Screening), Technology (ML, NLP) - Global Forecast to 2029

Overview

The global AI in Chemicals Market size reached US$ 0.7 Billion in 2024. Looking forward, expects the market to reach US$ 3.8 Billion by 2029, exhibiting a growth rate (CAGR) of 39.2% during 2024-2029. AI's influence in the chemical sector spans product development, demand forecasting, and quality testing, with notable applications such as predictive maintenance, process optimization, virtual screening, and molecular modeling. These innovations accelerate computational algorithms, unveiling insights crucial for material discovery and process refinement. By leveraging machine learning, the chemical industry experiences heightened efficiency and innovation, paving the way for transformative advancements in materials, formulations, and processes.

Attractive Opportunities in the AI in Chemicals Market

ASIA PACIFIC

Growing adoption of AI-driven innovations in chemicals to meet rising demand and regulatory requirements in Asia Pacific.

AI in chemicals market is trending toward integrated platforms that combine AI capabilities with domain-specific expertise for enhanced decision-making.

Acquisitions and mergers would offer lucrative opportunities to the market players in the next five years.

Growing demand for AI-enhanced process optimization and predictive maintenance drives the AI in chemicals market.

North America is expected to hold the largest market share during the forecast period. The region is a leader in technological advancements and is home to major AI in chemicals software, hardware, and services vendors.

Global AI in Chemicals Market Dynamics

DRIVER: Growing demand of AI for research & development

The growing emphasis on research and development within the chemical and materials sector is fueling the surge in demand for AI technologies. AI solutions are indispensable in accelerating and refining the R&D process, with ML tools swiftly identifying molecules, formulating precise chemical compositions, and predicting their efficacy. Through AI integration, companies can forecast environmental impacts, bolstering sustainability efforts by opting for greener alternatives. Automation of experiments not only enhances efficiency but also ensures accuracy, yielding substantial time and resource savings while enhancing safety protocols. Cloud-based platforms further amplify collaboration and automation, ushering in an era of heightened efficiency and adaptability. Studies indicate potential reductions in R&D costs ranging from 30% to 50%, a fivefold increase in experiment throughput, and up to a 30% reduction in the lab workforce through automation. These quantifiable benefits underscore the pivotal role of AI in shaping the future landscape of chemical and materials research, driving efficiency, sustainability, and innovation.

RESTRAINT: High cost associated with AI implementation in chemical industry

The high cost of implementing AI in the chemical sector acts as a significant restraint on its growth. Developing and deploying AI solutions in chemical processes requires substantial investment in technology, infrastructure, and expertise. Companies need to allocate funds for acquiring or developing AI algorithms, integrating them into existing systems, and providing training for personnel. Additionally, upgrading infrastructure to support AI implementation, such as sensors and data storage systems, incurs significant costs. Moreover, hiring skilled professionals with expertise in both AI and chemistry adds to the expenses. For smaller chemical companies with limited financial resources, the upfront costs of implementing AI may be prohibitive, leading to slower adoption rates. Even for larger companies, the substantial initial investment required for AI implementation necessitates careful consideration and strategic planning, potentially delaying widespread adoption across the chemical sector.


OPPORTUNITY: Growing demand for AI-based predictive maintenance

The escalating demand for predictive maintenance in the chemical sector offers a fertile ground for AI expansion. Chemical industries are increasing their spending on AI-based predictive maintenance by approximately 36% to reduce downtime and improve productivity. This trend indicates a growing recognition within the industry of the potential benefits of AI in enhancing operational optimization and gaining competitive advantages. This proactive maintenance strategy relies on AI and machine learning algorithms to analyze historical and real-time data from production equipment, enabling the prediction of potential issues before they escalate. By minimizing downtime, extending equipment lifespan, and reducing overall maintenance costs, AI-driven predictive maintenance promises substantial benefits for chemical manufacturers. With significant cost savings and operational improvements anticipated, integrating AI with advanced planning and scheduling tools can further enhance maintenance strategies, ensuring higher equipment reliability and operational efficiency.

CHALLENGE: Issues related to converting chemical data into machine-readable data

The conversion of information into machine-readable data poses a significant challenge for AI adoption in the chemical sector. The complexity and diversity of chemical data, spanning various formats like text, images, and diagrams, require extensive preprocessing and standardization efforts for machine interpretation. Ensuring the accuracy and reliability of this converted data is critical to prevent potentially hazardous outcomes or financial setbacks. Moreover, safeguarding proprietary information during the conversion process is essential to mitigate the risk of intellectual property theft or breaches. Furthermore, integrating data from disparate sources, including laboratory experiments and production records, adds complexity, demanding seamless interoperability for meaningful insights. Addressing these challenges is crucial for unlocking the transformative potential of AI in the chemical industry, and facilitating advancements in areas, such as process optimization, predictive maintenance, and innovative product development.

Global AI in Chemicals Market Ecosystem Analysis

The AI in chemicals market ecosystem comprises hardware providers supplying essential physical components, software providers offering tailored AI algorithms and platforms, service providers delivering consulting and implementation services, end users utilizing AI technologies for operational enhancement, and regulatory bodies setting guidelines and standards for ethical and safe AI adoption. This interconnected network supports innovation, efficiency, and compliance within the chemical industry's AI-driven landscape.


By End User, Basic Chemicals segment accounts for the largest market size during the forecast period.

The basic chemicals industry, which includes petrochemicals, lubricants, commodity chemicals, and inorganic chemicals and gases, is experiencing a significant shift towards unparalleled efficiency and innovation with the adoption of artificial intelligence. AI technologies, such as machine learning, predictive analytics, and autonomous systems, are fundamentally changing traditional manufacturing processes and operational strategies within these sectors' traditional manufacturing processes and operational strategies. For instance, predictive maintenance algorithms are being used in petrochemical refineries to preemptively identify equipment failures, minimize downtime, and optimizing optimize production output. In commodity chemical plants, intelligent process control systems are being empowered by AI algorithms to ensure precise monitoring and adjustment of variables, leading to enhanced product quality and resource utilization.

By Software Type, chemical modeling software is projected to grow at the highest CAGR during the forecast period.

Chemical modeling software is a cutting-edge advanced advancement in the chemicals market that offers sophisticated tools for molecular design, simulation, and analysis market that offers sophisticated molecular design, simulation, and analysis tools. These software solutions use AI technologies such as machine learning and deep learning to model complex chemical structures, predict molecular properties, and simulate chemical reactions with a high degree of accuracy. By leveraging extensive databases of chemical data and computational algorithms, chemical modeling software enables researchers and engineers to explore new materials, optimize formulations, and design molecules for specific applications, such as pharmaceuticals, polymers, catalysts, and specialty chemicals. Key features of these software solutions include structure-based design, property prediction, virtual screening, and molecular dynamics simulations. These features allow users to accelerate R&D cycles, reduce experimentation costs, and discover breakthrough innovations.

North America Region Holds the Largest Share of the AI in Chemicals Market

North America has been a leader in AI research and development for decades. The region's elite universities have played a crucial role in pioneering key technical advancements, such as neural networks and deep learning, which are foundational to AI's evolution. Home-grown tech giants, particularly in the US, dominate global AI investment and intellectual property development dominate global AI investment and intellectual property development, particularly in the US, driving innovation across sectors, including chemicals. The region maintains a dynamic regulatory landscape that addresses AI's ethical and operational aspects. Organizations operating in the AI in chemicals sector comply with regulations set by authorities, such as the Environmental Protection Agency (EPA), Occupational Safety and Health Administration (OSHA), and International Council of Chemical Associations (ICCA), ensuring responsible AI deployment and adherence to industry standards. North America has a thriving AI industry that is actively investing in research and development within the chemicals industry. Notable players such as IBM, Microsoft, NVIDIA, and C3 AI are driving AI innovation and developing solutions to improve efficiency, sustainability, and safety within chemical processes.


Recent Developments of AI in Chemicals Market industry

  • In March 2024, AWS and NVIDIA collaborated to enhance computer-aided drug discovery using new AI models. Their collaboration focuses on modeling the efficacy of new chemical molecules, predicting protein structures, and gaining insights into how drug molecules interact with biological targets, contributing significantly to advancements in pharmaceutical research and development. In January 2024, A robotic chemistry lab collaborated with Google AI to predict and synthesize novel inorganic materials, leveraging advanced algorithms and automation for accelerated material discovery and development. In November 2023, GE Vernova’s Gas Power business announced its collaboration with Duke Energy on the nation’s first 100% green hydrogen-fueled peaking power plant. GE Vernova will support the development of an end-to-end green hydrogen system at Duke Energy’s DeBary plant in Volusia County, Florida, near Orlando. In October 2023, NobleAI, known for Science-Based AI solutions in Chemical and Material Informatics, partnered with Azure Quantum Elements (AQE), a Microsoft cloud service merging High-Performance Computing (HPC), AI, and quantum computing. This collaboration integrated AQE's advanced molecular simulation, and HPC features with NobleAI's AI-driven solutions.
  • In May 2023, Google Cloud unveiled two new AI-powered life sciences solutions to speed up drug discovery and precision medicine for biotech companies, pharmaceutical firms, and public sector organizations. The Target and Lead Identification Suite aids researchers in identifying amino acid functions and predicting protein structures, while the Multiomics Suite accelerates genomic data discovery and interpretation, facilitating the design of precision treatments. In May 2023, The chemical industry is collaborating with Siemens on a pilot project to reduce carbon emissions in its supply chain. This partnership is part of the Together for Sustainability initiative, involving 47 chemical companies that opted for Siemens' "Sigreen" solution for digitally exchanging Product Carbon Footprint (PCF) data. In April 2023, Mitsui Chemicals and IBM Japan collaborated to enhance agility and accuracy in discovering new applications by merging Generative Pre-trained Transformer (GPT) with IBM Watson Discovery. They aim to drive sales and market share growth for Mitsui Chemicals products through advanced digital transformation (DX) in the business sector.

Key Market Players

KEY PLAYERS IN THE AI in Chemicals Market INCLUDE

  • IBM (US)
  • Schneider Electric (France)
  • Google (US)
  • Microsoft (US)
  • SAP (Germany)
  • AWS (US)
  • NVIDIA (US)
  • C3.ai (US)
  • GE Vernova (US)
  • Siemens (Germany)
  • Hexagon (Sweden)
  • Engie Impact (US)
  • TrendMiner (Belgium)
  • Xylem (US)
  • NobleAI (US)
  • Iktos (France)
  • Kebotix (US)
  • Uptime AI (US)
  • Canvass AI (Canada)
  • Nexocode (Poland)
  • SandboxAQ (US)
  • Deepmatter (England)
  • Zapata AI (US)
  • Citirne Informatics (US)
  • Chemical.AI (China)
  • Augury (Israel)
  • Intellegens (UK)
  • Ripik.AI (India)
  • Tractian (US)
  • Polymerize (Singapore)
  • ScienceDesk (Germany)
  • OptiSol Business Solutions (India)
  • NuWater (Africa)
  • VROC (Australia)

Want to explore hidden markets that can drive new revenue in AI in Chemicals Market?

Scope of the Report

Report Attribute Details
Market size available for years 2019–2029
Base year considered 2023
Forecast period 2024–2029
Forecast units USD Billion
Segments Covered Component (Hardware [Accelerators, Processors, Memory, Network], Software [Software By Type {Dashboard & Analytics Tools, Process Simulation Software, Chemical Modeling Software, Laboratory Management Software, Virtual Screening Tools, Chemical Property Prediction Tools}, Software By Technology {ML, Deep Learning, Generative AI, NLP, Computer Vision, Advanced Analytics}, Software By Deployment Mode {Cloud, On-Premises}], and Services [Professional Services {Consulting, Deployment & Integration Services, Support & Maintenance Services} and Managed Services]), Business Application (R&D, Production, Supply Chain Management, and Strategy Management), End User (Basic Chemicals, Advance Materials, Active Ingredients, Green & Bio-Chemicals, Paints & Coatings, Adhesives & Sealants, Water Treatment & Services, and Other End Users) and Region.
Geographies covered North America, Europe, Asia Pacific, Middle East & Africa, Latin America
Companies covered IBM (US), Microsoft (US), Schneider Electric (France), AWS (US), Google (US), SAP (Germany), NVIDIA (US), C3.ai (US), GE Vernova (US), Siemens (Germany), Hexagon (Sweden), Engie Impact (US), TrendMiner (Belgium), Xylem (US), NobleAI (US), Iktos (France), Kebotix (US), Uptime AI (US), Canvass AI (Canada), Nexocode (Poland), SandboxAQ (US), Deepmatter (England), Zapata AI (US), Citirne Informatics (US), Chemical.AI (China), Augury (Israel), Intellegens (UK), Ripik.AI (India), Tractian (US), Polymerize (Singapore), ScienceDesk (Germany), OptiSol Business Solutions (India), NuWater (Africa) and VROC (Australia).


Key Questions Addressed by the Report

What is AI in chemicals?
AI in chemicals refers to the application of artificial intelligence techniques, such as machine learning and predictive analytics, to optimize various aspects of the chemical industry. It includes enhancing R&D processes, optimizing production workflows, improving quality control, and enabling predictive maintenance, leading to greater efficiency, innovation, and competitiveness within the sector.
Which region is expected to hold the highest share in the AI in chemicals market?
North America holds the highest market share in AI applications within the chemicals sector driven by its advanced technological infrastructure, strong investment in research and development, and a robust ecosystem of AI talent and expertise. The region's focus on innovation and digital transformation, coupled with favorable regulatory frameworks, positions it as a leader in harnessing AI's potential to drive efficiencies, optimize processes, and spur innovation across the chemical industry value chain.
Which are key end users adopting AI in chemicals hardware, software and services?
AI in chemicals components is adopted by various end users, including Basic Chemicals, Advance Materials, Active Ingredients, Green & Biochemicals, Paints & Coatings, Adhesives & Sealants, Water Treatment & Services, and Other end users
Which are the key drivers supporting the market growth for AI in chemicals market?
The key drivers that propel the AI in chemicals market are the increasing use of AI in research and development (R&D) processes, and the growing demand for AI-powered optimizations in chemical processes, enhancing efficiency and outcomes.
Who are the key vendors in the market for AI in chemicals market?
The key vendors in the global AI in chemicals market include IBM (US), Microsoft (US), Schneider Electric (France), AWS (US), Google (US), SAP (Germany), NVIDIA (US), C3.ai (US), GE Vernova (US), Siemens (Germany), Hexagon (Sweden), Engie Impact (US), TrendMiner (Belgium), Xylem (US), NobleAI (US), Iktos (France), Kebotix (US), Uptime AI (US), Canvass AI (Canada), Nexocode (Poland), SandboxAQ (US), Deepmatter (England), Zapata AI (US), Citirne Informatics (US), Chemical.AI (China), Augury (Israel), Intellegens (UK), Ripik.AI (India), Tractian (US), Polymerize (Singapore), ScienceDesk (Germany), OptiSol Business Solutions (India), NuWater (Africa) and VROC (Australia). .


Personalize This Research

  • Triangulate with your Own Data
  • Get Data as per your Format and Definition
  • Gain a Deeper Dive on a Specific Application, Geography, Customer or Competitor
  • Any level of Personalization
Request A Free Customisation

Let Us Help You

  • What are the Known and Unknown Adjacencies Impacting the AI in Chemicals Market
  • What will your New Revenue Sources be?
  • Who will be your Top Customer; what will make them switch?
  • Defend your Market Share or Win Competitors
  • Get a Scorecard for Target Partners
Customized Workshop Request

Table of Contents

Exclusive indicates content/data unique to MarketsandMarkets and not available with any competitors.

TITLE
PAGE NO
INTRODUCTION
33
RESEARCH METHODOLOGY
38
EXECUTIVE SUMMARY
51
PREMIUM INSIGHTS
57
MARKET OVERVIEW AND INDUSTRY TRENDS
60
  • 5.1 INTRODUCTION
  • 5.2 MARKET DYNAMICS
    DRIVERS
    - Growing demand for AI for R&D purposes in chemicals and materials sectors
    - Rising demand for AI-enhanced chemical process optimization
    RESTRAINTS
    - High cost associated with AI implementation in chemical industry
    - Regulatory constraints posing obstacles to scalability of AI solutions in chemical sector
    OPPORTUNITIES
    - Growing demand for AI-based predictive maintenance
    - Growing integration of generative AI to unlock unprecedented opportunities
    CHALLENGES
    - Issues related to converting chemical data into machine-readable data
    - Lack of skilled workforce
  • 5.3 EVOLUTION OF AI IN CHEMICALS MARKET
  • 5.4 SUPPLY CHAIN ANALYSIS
  • 5.5 ECOSYSTEM ANALYSIS
    SOFTWARE PROVIDERS
    SERVICE PROVIDERS
    END USERS
    REGULATORY BODIES
  • 5.6 CASE STUDY ANALYSIS
    EVONIK COLLABORATED WITH IBM RESEARCH EUROPE AND MIT-IBM WATSON AI LAB TO LEVERAGE AI TO ACCELERATE DEVELOPMENT AND OPTIMIZATION OF MATERIALS
    INDORAMA VENTURES OPTIMIZED RISK MANAGEMENT WITH SAP’S INTELLIGENT ASSET MANAGEMENT AND ASLNT’S SOLUTIONS
    TERRAY THERAPEUTICS REVOLUTIONIZED DRUG DISCOVERY WITH AI-DRIVEN MOLECULAR DESIGN COATI BY LEVERAGING NVIDIA DGX CLOUD
    BASF OPTIMIZED CHEMICAL PLANT UPTIME WITH AI-DRIVEN REMOTE MONITORING SUBSTATION 6 BUILD WITH HELP OF SCHNEIDER ELECTRIC
    LARGE EUROPEAN SPECIALTY CHEMICALS MANUFACTURER IMPLEMENTED C3 AI PROCESS OPTIMIZATION APPLICATION TO IMPROVE MANUFACTURING YIELDS
  • 5.7 TECHNOLOGY ANALYSIS
    KEY TECHNOLOGIES
    - Conversational AI
    - LLMs
    - Context-aware computing
    - Cloud computing
    - Augmented analytics
    ADJACENT TECHNOLOGIES
    - Digital twins
    - IoT
    - RPA
    - Blockchain
    - Cybersecurity
  • 5.8 PRICING ANALYSIS
    INDICATIVE PRICING ANALYSIS OF AI IN CHEMICALS, BY COMPONENT
    AVERAGE SELLING PRICE TREND OF KEY PLAYERS: TOP THREE BUSINESS APPLICATIONS
  • 5.9 PATENT ANALYSIS
    METHODOLOGY
    PATENTS FILED, BY DOCUMENT TYPE
    INNOVATION AND PATENT APPLICATIONS
    - Top 10 applicants in AI in chemicals market
  • 5.10 TRADE ANALYSIS
    IMPORT SCENARIO OF AUTOMATIC DATA-PROCESSING MACHINES AND UNITS
    EXPORT SCENARIO OF AUTOMATIC DATA-PROCESSING MACHINES AND UNITS
  • 5.11 TARIFF AND REGULATORY LANDSCAPE
    TARIFF RELATED TO AI IN CHEMICALS
    REGULATORY BODIES, GOVERNMENT AGENCIES, AND OTHER ORGANIZATIONS
    - North America
    - Europe
    - Asia Pacific
    - Middle East & Africa
    - Latin America
  • 5.12 INVESTMENT AND FUNDING SCENARIO
  • 5.13 PORTER’S FIVE FORCES’ ANALYSIS
    THREAT OF NEW ENTRANTS
    THREAT OF SUBSTITUTES
    BARGAINING POWER OF SUPPLIERS
    BARGAINING POWER OF BUYERS
    INTENSITY OF COMPETITIVE RIVALRY
  • 5.14 TRENDS/DISRUPTIONS IMPACTING CUSTOMERS’ BUSINESSES
  • 5.15 KEY CONFERENCES & EVENTS IN 2024–2025
  • 5.16 KEY STAKEHOLDERS AND BUYING CRITERIA
    KEY STAKEHOLDERS IN BUYING PROCESS
    BUYING CRITERIA
  • 5.17 TECHNOLOGY ROADMAP
    SHORT-TERM ROADMAP (1-3 YEARS)
    LONG-TERM ROADMAP (3-10 YEARS)
AI IN CHEMICALS MARKET, BY COMPONENT
102
  • 6.1 INTRODUCTION
    COMPONENTS: AI IN CHEMICALS MARKET DRIVERS
  • 6.2 HARDWARE
    HARDWARE TO ENHANCE PRODUCTIVITY, PREDICTIVE MAINTENANCE, AND INNOVATION IN PRODUCT DEVELOPMENT
    ACCELERATORS
    PROCESSORS
    MEMORY
    NETWORK
  • 6.3 SOFTWARE
    SOFTWARE TO HELP IN REAL-TIME DATA VISUALIZATION, STRATEGIC DECISION-MAKING, AND OPTIMIZING CHEMICAL PROCESSES
    BY SOFTWARE TYPE
    - Dashboard & analytics tools
    - Process simulation software
    - Chemical modeling software
    - Laboratory management software
    - Virtual screening tools
    - Chemical property prediction tools
    BY TECHNOLOGY
    - ML
    - Deep learning
    - Generative AI
    - NLP
    - Computer vision
    - Advanced analytics
    BY DEPLOYMENT MODE
    - Cloud
    - On-premises
  • 6.4 SERVICES
    SERVICES TO ACCELERATE AI ADOPTION, DRIVE INNOVATION, AND MAXIMIZE BENEFITS OF AI TECHNOLOGIES IN CHEMICALS INDUSTRY
    PROFESSIONAL SERVICES
    - Consulting services
    - Deployment & integration services
    - Support & maintenance services
    MANAGED SERVICES
AI IN CHEMICALS MARKET, BY BUSINESS APPLICATION
137
  • 7.1 INTRODUCTION
    BUSINESS APPLICATIONS: AI IN CHEMICALS MARKET DRIVERS
  • 7.2 RESEARCH & DEVELOPMENT
    GROWING NEED FOR EFFICIENT AND SUSTAINABLE PROCESSES IN RESEARCH & DEVELOPMENT TO FUEL DEMAND FOR AI
    MATERIAL SCIENCE
    CHEMICAL SYNTHESIS
    NEW MATERIAL DISCOVERY
    TAILORING PROPERTIES
    CHEMICAL REGISTRATION & REGULATORY DATA ANALYSIS
  • 7.3 PRODUCTION
    NEED FOR EFFICIENCY, PROMOTION OF INNOVATION, AND STREAMLINING PRODUCTION PROCESSES TO FOSTER MARKET GROWTH
    QUALITY ASSURANCE
    PRODUCTION PLANNING
    PROCESS OPTIMIZATION & CONTROL
    PRODUCT PORTFOLIO OPTIMIZATION
    FEEDSTOCK OPTIMIZATION
    ASSET MANAGEMENT
    DEFECT DETECTION
    CHEMICAL FORMULATION
    OTHER PRODUCTION SUB-APPLICATIONS
  • 7.4 SUPPLY CHAIN MANAGEMENT
    RISING NEED FOR COMPANIES TO IMPROVE DECISION-MAKING TO PROPEL MARKET
    PRODUCT SOURCING
    INVENTORY OPTIMIZATION
    DEMAND FORECASTING
    ORDER MANAGEMENT
    MATERIAL SOURCING & PROCUREMENT
    SUPPLIER RELATIONSHIP MANAGEMENT
    OTHER SUPPLY CHAIN MANAGEMENT SUB-APPLICATIONS
  • 7.5 STRATEGY MANAGEMENT
    INTEGRATING AI TO REVOLUTIONIZE STRATEGY MANAGEMENT BY EMPOWERING INNOVATION AND COMPETITIVENESS
    MARKET FORECAST & ANALYTICS
    CUSTOMER INSIGHTS & FEEDBACK
    COMPETITIVE INTELLIGENCE
    SCENARIO PLANNING & SIMULATION
    CUSTOMER BEHAVIOR ANALYSIS
    PRICING OPTIMIZATION
AI IN CHEMICALS MARKET, BY END USER
154
  • 8.1 INTRODUCTION
    END USERS: AI IN CHEMICALS MARKET DRIVERS
  • 8.2 BASIC CHEMICALS
    AI TO IDENTIFY EQUIPMENT FAILURES, MINIMIZE DOWNTIME, AND OPTIMIZE PRODUCTION OUTPUT
    PETROCHEMICALS & LUBRICANTS
    COMMODITY CHEMICALS
    INORGANIC CHEMICALS & GASES
  • 8.3 ADVANCED MATERIALS
    AI TO REFINE RAW MATERIAL SELECTION, ENHANCE PRODUCT DESIGN AND DEVELOPMENT, AND OPTIMIZE INVENTORY AND SUPPLY CHAIN MANAGEMENT
    COMPOSITES
    NANOMATERIALS
    SPECIALTY POLYMERS
    OTHER ADVANCED MATERIALS
  • 8.4 ACTIVE INGREDIENTS
    AI TO DEVELOP, OPTIMIZE, AND ENHANCE EFFICACY AND SAFETY OF ACTIVE INGREDIENTS
    AGROCHEMICALS
    FLAVOR & FRAGRANCE CHEMICALS
    PERSONAL CARE & CLEANING PRODUCTS
    OTHER ACTIVE INGREDIENTS
  • 8.5 GREEN & BIOCHEMICALS
    NEED TO REDUCE GLOBAL WARMING AND CARBON EMISSIONS TO FUEL DEMAND FOR AI SOLUTIONS IN GREEN AND BIOCHEMICALS SECTOR
    BIOFUELS
    BIOPLASTICS
    BIO-BASED CHEMICALS
    OTHER GREEN & BIOCHEMICAL PRODUCTS
  • 8.6 PAINTS & COATINGS
    PAINTS & COATINGS SECTOR TO GAIN COMPETITIVE ADVANTAGES, STREAMLINE OPERATIONS, AND IMPROVE PRODUCT QUALITY WITH AI
  • 8.7 ADHESIVES & SEALANTS
    RISING ADOPTION OF AI TECHNOLOGY TO ENHANCE FORMULATION TO PRODUCTION PROCESSES TO DRIVE MARKET
  • 8.8 WATER TREATMENT & SERVICES
    RISING DEMAND TO OPTIMIZE PROCESSES RELATED TO WATER TREATMENT AND IMPROVE EFFICIENCY AND RESOURCE UTILIZATION TO BOOST MARKET GROWTH
  • 8.9 OTHER END USERS
AI IN CHEMICALS MARKET, BY REGION
173
  • 9.1 INTRODUCTION
  • 9.2 NORTH AMERICA
    NORTH AMERICA: AI IN CHEMICALS MARKET DRIVERS
    NORTH AMERICA: IMPACT OF RECESSION
    US
    - Dominance of chemical industry, presence of leading companies, and funding from government to drive market
    CANADA
    - Canada’s AI investments to fuel chemical industry with innovation and global competitiveness
  • 9.3 EUROPE
    EUROPE: AI IN CHEMICALS MARKET DRIVERS
    EUROPE: IMPACT OF RECESSION
    UK
    - Government investments in AI research and training and demand for advanced chemical products to spur market growth
    GERMANY
    - Robust AI research hubs and strong research-industry collaboration to propel chemical innovation
    FRANCE
    - Focus on infrastructure enhancement and collaborative frameworks, strong government support, and initiatives to foster market growth
    SPAIN
    - Stringent regulatory compliance and industry investment to boost demand for AI expansion
    ITALY
    - Diverse chemical industry and strong R&D culture to accelerate market growth
    REST OF EUROPE
  • 9.4 ASIA PACIFIC
    ASIA PACIFIC: AI IN CHEMICALS MARKET DRIVERS
    ASIA PACIFIC: IMPACT OF RECESSION
    CHINA
    - Strong government support, funding initiatives, and strategic plans prioritizing AI research, development, and innovation to drive market
    JAPAN
    - Strategic partnerships, regulatory advancements, and strong presence of global players to fuel market growth
    INDIA
    - Robust ecosystem, government initiatives regarding AI, and presence of major vendors to propel market
    SOUTH KOREA
    - Focus on maintaining international competitiveness, strategic industry collaborations, and supportive government policies to foster market growth
    REST OF ASIA PACIFIC
  • 9.5 MIDDLE EAST & AFRICA
    MIDDLE EAST & AFRICA: AI IN CHEMICALS MARKET DRIVERS
    MIDDLE EAST & AFRICA: IMPACT OF RECESSION
    UAE
    - Favorable government policies, strategic investments, and technological advancements to fuel market growth
    SAUDI ARABIA
    - Strategic focus on AI integration and government’s ambitious initiatives and partnerships in chemicals sector to spur market growth
    SOUTH AFRICA
    - Government’s commitment to fostering innovation and addressing socioeconomic challenges through AI-driven solutions to propel market
    REST OF MIDDLE EAST & AFRICA
  • 9.6 LATIN AMERICA
    LATIN AMERICA: AI IN CHEMICALS MARKET DRIVERS
    LATIN AMERICA: IMPACT OF RECESSION
    BRAZIL
    - Developments in AI-driven technologies, compliance with regulatory bodies, and collaborations to drive market
    MEXICO
    - Investment in AI chip manufacturing to fuel demand for AI in chemical industry innovation
    ARGENTINA
    - Thriving tech ecosystem, government support, and need to drive innovation and enhance competitiveness to boost market growth
    REST OF LATIN AMERICA
COMPETITIVE LANDSCAPE
239
  • 10.1 OVERVIEW
  • 10.2 KEY PLAYER STRATEGIES/RIGHT TO WIN
  • 10.3 REVENUE ANALYSIS
  • 10.4 MARKET SHARE ANALYSIS
    MARKET RANKING ANALYSIS
  • 10.5 BRAND/PRODUCT COMPARISON ANALYSIS
  • 10.6 COMPANY EVALUATION MATRIX: KEY PLAYERS, 2023
    STARS
    EMERGING LEADERS
    PERVASIVE PLAYERS
    PARTICIPANTS
    COMPANY FOOTPRINT: KEY PLAYERS, 2023
  • 10.7 COMPANY EVALUATION MATRIX: START-UPS/SMES, 2023
    PROGRESSIVE COMPANIES
    RESPONSIVE COMPANIES
    DYNAMIC COMPANIES
    STARTING BLOCKS
    COMPETITIVE BENCHMARKING: START-UPS/SMES, 2023
  • 10.8 COMPETITIVE SCENARIO AND TRENDS
    PRODUCT LAUNCHES
    DEALS
  • 10.9 COMPANY VALUATION AND FINANCIAL METRICS OF KEY VENDORS
COMPANY PROFILES
260
  • 11.1 INTRODUCTION
  • 11.2 KEY PLAYERS
    IBM
    - Business overview
    - Products/Solutions/Services offered
    - Recent developments
    - MnM view
    MICROSOFT
    - Business overview
    - Products/Solutions/Services offered
    - Recent developments
    - MnM view
    GOOGLE
    - Business overview
    - Products/Solutions/Services offered
    - Recent developments
    - MnM view
    NVIDIA
    - Business overview
    - Products/Solutions/Services offered
    - Recent developments
    - MnM view
    SCHNEIDER ELECTRIC
    - Business overview
    - Products/Solutions/Services offered
    - Recent developments
    - MnM view
    AWS
    - Business overview
    - Products/Solutions/Services offered
    - Recent developments
    SAP
    - Business overview
    - Products/Solutions/Services offered
    - Recent developments
    SIEMENS
    - Business overview
    - Products/Solutions/Services offered
    - Recent developments
    C3 AI
    - Business overview
    - Products/Solutions/Services offered
    - Recent developments
    GE VERNOVA
    - Business overview
    - Products/Solutions/Services offered
    - Recent developments
    HEXAGON AB
    - Business overview
    - Products/Solutions/Services offered
    - Recent developments
    ENGIE IMPACT
    - Business overview
    - Products/Solutions/Services offered
    - Recent developments
    TRENDMINER
    XYLEM
  • 11.3 START-UPS/SMES
    NOBLEAI
    IKTOS
    KEBOTIX
    UPTIME AI
    CANVASS AI
    NEXOCODE
    SANDBOXAQ
    DEEPMATTER
    ZAPATA AI
    CITRINE INFORMATICS
    CHEMICAL.AI
    AUGURY
    INTELLEGENS
    RIPIK.AI
    TRACTIAN
    POLYMERIZE
    SCIENCEDESK
    OPTISOL BUSINESS SOLUTIONS
    NUWATER
    VROC
ADJACENT AND RELATED MARKETS
334
  • 12.1 INTRODUCTION
  • 12.2 ARTIFICIAL INTELLIGENCE MARKET
    MARKET DEFINITION
    MARKET OVERVIEW
    ARTIFICIAL INTELLIGENCE MARKET, BY OFFERING
    ARTIFICIAL INTELLIGENCE MARKET, BY TECHNOLOGY
    ARTIFICIAL INTELLIGENCE MARKET, BY BUSINESS FUNCTION
    ARTIFICIAL INTELLIGENCE MARKET, BY VERTICAL
    ARTIFICIAL INTELLIGENCE MARKET, BY REGION
  • 12.3 GENERATIVE AI MARKET
    MARKET DEFINITION
    MARKET OVERVIEW
    GENERATIVE AI MARKET, BY OFFERING
    GENERATIVE AI MARKET, BY APPLICATION
    - Generative AI market, application by business function
    - Generative AI market, application by data modality
    GENERATIVE AI MARKET, BY VERTICAL
    GENERATIVE AI MARKET, BY REGION
APPENDIX
349
  • 13.1 DISCUSSION GUIDE
  • 13.2 KNOWLEDGESTORE: MARKETSANDMARKETS’ SUBSCRIPTION PORTAL
  • 13.3 CUSTOMIZATION OPTIONS
  • 13.4 RELATED REPORTS
  • 13.5 AUTHOR DETAILS
LIST OF TABLES
 
  • TABLE 1 USD EXCHANGE RATE, 2020–2023
  • TABLE 2 PRIMARY INTERVIEWS
  • TABLE 3 FACTOR ANALYSIS
  • TABLE 4 RECESSION IMPACT ON AI IN CHEMICALS MARKET
  • TABLE 5 GLOBAL AI IN CHEMICALS MARKET SIZE AND GROWTH RATE, 2019–2023 (USD MILLION, Y-O-Y)
  • TABLE 6 GLOBAL AI IN CHEMICALS MARKET SIZE AND GROWTH RATE, 2024–2029 (USD MILLION, Y-O-Y)
  • TABLE 7 ROLE OF KEY PLAYERS IN AI IN CHEMICALS MARKET
  • TABLE 8 INDICATIVE PRICING LEVELS OF AI IN CHEMICALS, BY COMPONENT
  • TABLE 9 AVERAGE SELLING PRICE TREND OF KEY PLAYERS: TOP THREE BUSINESS APPLICATIONS
  • TABLE 10 PATENTS FILED, 2014–2024
  • TABLE 11 TOP 20 PATENT OWNERS IN AI IN CHEMICALS MARKET, 2014–2024
  • TABLE 12 LIST OF FEW PATENTS IN AI IN CHEMICALS MARKET, 2023–2024
  • TABLE 13 TARIFF RELATED TO AI IN CHEMICALS
  • TABLE 14 NORTH AMERICA: LIST OF REGULATORY BODIES, GOVERNMENT AGENCIES, AND OTHER ORGANIZATIONS
  • TABLE 15 EUROPE: LIST OF REGULATORY BODIES, GOVERNMENT AGENCIES, AND OTHER ORGANIZATIONS
  • TABLE 16 ASIA PACIFIC: LIST OF REGULATORY BODIES, GOVERNMENT AGENCIES, AND OTHER ORGANIZATIONS
  • TABLE 17 MIDDLE EAST & AFRICA: LIST OF REGULATORY BODIES, GOVERNMENT AGENCIES, AND OTHER ORGANIZATIONS
  • TABLE 18 LATIN AMERICA: LIST OF REGULATORY BODIES, GOVERNMENT AGENCIES, AND OTHER ORGANIZATIONS
  • TABLE 19 PORTER’S FIVE FORCES’ IMPACT ON AI IN CHEMICALS MARKET
  • TABLE 20 AI IN CHEMICALS MARKET: DETAILED LIST OF CONFERENCES & EVENTS, 2024–2025
  • TABLE 21 INFLUENCE OF STAKEHOLDERS ON BUYING PROCESS FOR TOP THREE END USERS
  • TABLE 22 KEY BUYING CRITERIA FOR TOP THREE END USERS
  • TABLE 23 AI IN CHEMICALS MARKET, BY COMPONENT, 2019–2023 (USD MILLION)
  • TABLE 24 AI IN CHEMICALS MARKET, BY COMPONENT, 2024–2029 (USD MILLION)
  • TABLE 25 AI IN CHEMICALS MARKET, BY HARDWARE, 2019–2023 (USD MILLION)
  • TABLE 26 AI IN CHEMICALS MARKET, BY HARDWARE, 2024–2029 (USD MILLION)
  • TABLE 27 HARDWARE: AI IN CHEMICALS MARKET, BY REGION, 2019–2023 (USD MILLION)
  • TABLE 28 HARDWARE: AI IN CHEMICALS MARKET, BY REGION, 2024–2029 (USD MILLION)
  • TABLE 29 ACCELERATORS: AI IN CHEMICALS MARKET, BY REGION, 2019–2023 (USD MILLION)
  • TABLE 30 ACCELERATORS: AI IN CHEMICALS MARKET, BY REGION, 2024–2029 (USD MILLION)
  • TABLE 31 PROCESSORS: AI IN CHEMICALS MARKET, BY REGION, 2019–2023 (USD MILLION)
  • TABLE 32 PROCESSORS: AI IN CHEMICALS MARKET, BY REGION, 2024–2029 (USD MILLION)
  • TABLE 33 MEMORY: AI IN CHEMICALS MARKET, BY REGION, 2019–2023 (USD MILLION)
  • TABLE 34 MEMORY: AI IN CHEMICALS MARKET, BY REGION, 2024–2029 (USD MILLION)
  • TABLE 35 NETWORK: AI IN CHEMICALS MARKET, BY REGION, 2019–2023 (USD MILLION)
  • TABLE 36 NETWORK: AI IN CHEMICALS MARKET, BY REGION, 2024–2029 (USD MILLION)
  • TABLE 37 SOFTWARE: AI IN CHEMICALS MARKET, BY REGION, 2019–2023 (USD MILLION)
  • TABLE 38 SOFTWARE: AI IN CHEMICALS MARKET, BY REGION, 2024–2029 (USD MILLION)
  • TABLE 39 AI IN CHEMICALS MARKET, BY SOFTWARE TYPE, 2019–2023 (USD MILLION)
  • TABLE 40 AI IN CHEMICALS MARKET, BY SOFTWARE TYPE, 2024–2029 (USD MILLION)
  • TABLE 41 DASHBOARD & ANALYTICS TOOLS: AI IN CHEMICALS MARKET, BY REGION, 2019–2023 (USD MILLION)
  • TABLE 42 DASHBOARD & ANALYTICS TOOLS: AI IN CHEMICALS MARKET, BY REGION, 2024–2029 (USD MILLION)
  • TABLE 43 PROCESS SIMULATION SOFTWARE: AI IN CHEMICALS MARKET, BY REGION, 2019–2023 (USD MILLION)
  • TABLE 44 PROCESS SIMULATION SOFTWARE: AI IN CHEMICALS MARKET, BY REGION, 2024–2029 (USD MILLION)
  • TABLE 45 CHEMICAL MODELING SOFTWARE: AI IN CHEMICALS MARKET, BY REGION, 2019–2023 (USD MILLION)
  • TABLE 46 CHEMICAL MODELING SOFTWARE: AI IN CHEMICALS MARKET, BY REGION, 2024–2029 (USD MILLION)
  • TABLE 47 LABORATORY MANAGEMENT SOFTWARE: AI IN CHEMICALS MARKET, BY REGION, 2019–2023 (USD MILLION)
  • TABLE 48 LABORATORY MANAGEMENT SOFTWARE: AI IN CHEMICALS MARKET, BY REGION, 2024–2029 (USD MILLION)
  • TABLE 49 VIRTUAL SCREENING TOOLS: AI IN CHEMICALS MARKET, BY REGION, 2019–2023 (USD MILLION)
  • TABLE 50 VIRTUAL SCREENING TOOLS: AI IN CHEMICALS MARKET, BY REGION, 2024–2029 (USD MILLION)
  • TABLE 51 CHEMICAL PROPERTY PREDICTION TOOLS: AI IN CHEMICALS MARKET, BY REGION, 2019–2023 (USD MILLION)
  • TABLE 52 CHEMICAL PROPERTY PREDICTION TOOLS: AI IN CHEMICALS MARKET, BY REGION, 2024–2029 (USD MILLION)
  • TABLE 53 AI IN CHEMICALS SOFTWARE MARKET, BY TECHNOLOGY, 2019–2023 (USD MILLION)
  • TABLE 54 AI IN CHEMICALS SOFTWARE MARKET, BY TECHNOLOGY, 2024–2029 (USD MILLION)
  • TABLE 55 MACHINE LEARNING: AI IN CHEMICALS MARKET, BY REGION, 2019–2023 (USD MILLION)
  • TABLE 56 MACHINE LEARNING: AI IN CHEMICALS MARKET, BY REGION, 2024–2029 (USD MILLION)
  • TABLE 57 DEEP LEARNING: AI IN CHEMICALS MARKET, BY REGION, 2019–2023 (USD MILLION)
  • TABLE 58 DEEP LEARNING: AI IN CHEMICALS MARKET, BY REGION, 2024–2029 (USD MILLION)
  • TABLE 59 GENERATIVE AI: AI IN CHEMICALS MARKET, BY REGION, 2019–2023 (USD MILLION)
  • TABLE 60 GENERATIVE AI: AI IN CHEMICALS MARKET, BY REGION, 2024–2029 (USD MILLION)
  • TABLE 61 NATURAL LANGUAGE PROCESSING: AI IN CHEMICALS MARKET, BY REGION, 2019–2023 (USD MILLION)
  • TABLE 62 NATURAL LANGUAGE PROCESSING: AI IN CHEMICALS MARKET, BY REGION, 2024–2029 (USD MILLION)
  • TABLE 63 COMPUTER VISION: AI IN CHEMICALS MARKET, BY REGION, 2019–2023 (USD MILLION)
  • TABLE 64 COMPUTER VISION: AI IN CHEMICALS MARKET, BY REGION, 2024–2029 (USD MILLION)
  • TABLE 65 ADVANCED ANALYTICS: AI IN CHEMICALS MARKET, BY REGION, 2019–2023 (USD MILLION)
  • TABLE 66 ADVANCED ANALYTICS: AI IN CHEMICALS MARKET, BY REGION, 2024–2029 (USD MILLION)
  • TABLE 67 AI IN CHEMICALS SOFTWARE MARKET, BY DEPLOYMENT MODE, 2019–2023 (USD MILLION)
  • TABLE 68 AI IN CHEMICALS SOFTWARE MARKET, BY DEPLOYMENT MODE, 2024–2029 (USD MILLION)
  • TABLE 69 CLOUD: AI IN CHEMICALS MARKET, BY REGION, 2019–2023 (USD MILLION)
  • TABLE 70 CLOUD: AI IN CHEMICALS MARKET, BY REGION, 2024–2029 (USD MILLION)
  • TABLE 71 ON-PREMISES: AI IN CHEMICALS MARKET, BY REGION, 2019–2023 (USD MILLION)
  • TABLE 72 ON-PREMISES: AI IN CHEMICALS MARKET, BY REGION, 2024–2029 (USD MILLION)
  • TABLE 73 AI IN CHEMICALS MARKET, BY SERVICE, 2019–2023 (USD MILLION)
  • TABLE 74 AI IN CHEMICALS MARKET, BY SERVICE, 2024–2029 (USD MILLION)
  • TABLE 75 SERVICES: AI IN CHEMICALS MARKET, BY REGION, 2019–2023 (USD MILLION)
  • TABLE 76 SERVICES: AI IN CHEMICALS MARKET, BY REGION, 2024–2029 (USD MILLION)
  • TABLE 77 AI IN CHEMICALS MARKET, BY PROFESSIONAL SERVICE, 2019–2023 (USD MILLION)
  • TABLE 78 AI IN CHEMICALS MARKET, BY PROFESSIONAL SERVICE, 2024–2029 (USD MILLION)
  • TABLE 79 PROFESSIONAL SERVICES: AI IN CHEMICALS MARKET, BY REGION, 2019–2023 (USD MILLION)
  • TABLE 80 PROFESSIONAL SERVICES: AI IN CHEMICALS MARKET, BY REGION, 2024–2029 (USD MILLION)
  • TABLE 81 CONSULTING SERVICES: AI IN CHEMICALS MARKET, BY REGION, 2019–2023 (USD MILLION)
  • TABLE 82 CONSULTING SERVICES: AI IN CHEMICALS MARKET, BY REGION, 2024–2029 (USD MILLION)
  • TABLE 83 DEPLOYMENT & INTEGRATION SERVICES: AI IN CHEMICALS MARKET, BY REGION, 2019–2023 (USD MILLION)
  • TABLE 84 DEPLOYMENT & INTEGRATION SERVICES: AI IN CHEMICALS MARKET, BY REGION, 2024–2029 (USD MILLION)
  • TABLE 85 SUPPORT & MAINTENANCE SERVICES: AI IN CHEMICALS MARKET, BY REGION, 2019–2023 (USD MILLION)
  • TABLE 86 SUPPORT & MAINTENANCE SERVICES: AI IN CHEMICALS MARKET, BY REGION, 2024–2029 (USD MILLION)
  • TABLE 87 MANAGED SERVICES: AI IN CHEMICALS MARKET, BY REGION, 2019–2023 (USD MILLION)
  • TABLE 88 MANAGED SERVICES: AI IN CHEMICALS MARKET, BY REGION, 2024–2029 (USD MILLION)
  • TABLE 89 AI IN CHEMICALS MARKET, BY BUSINESS APPLICATION, 2019–2023 (USD MILLION)
  • TABLE 90 AI IN CHEMICALS MARKET, BY BUSINESS APPLICATION, 2024–2029 (USD MILLION)
  • TABLE 91 RESEARCH & DEVELOPMENT: AI IN CHEMICALS MARKET, BY REGION, 2019–2023 (USD MILLION)
  • TABLE 92 RESEARCH & DEVELOPMENT: AI IN CHEMICALS MARKET, BY REGION, 2024–2029 (USD MILLION)
  • TABLE 93 PRODUCTION: AI IN CHEMICALS MARKET, BY REGION, 2019–2023 (USD MILLION)
  • TABLE 94 PRODUCTION: AI IN CHEMICALS MARKET, BY REGION, 2024–2029 (USD MILLION)
  • TABLE 95 SUPPLY CHAIN MANAGEMENT: AI IN CHEMICALS MARKET, BY REGION, 2019–2023 (USD MILLION)
  • TABLE 96 SUPPLY CHAIN MANAGEMENT: AI IN CHEMICALS MARKET, BY REGION, 2024–2029 (USD MILLION)
  • TABLE 97 STRATEGY MANAGEMENT: AI IN CHEMICALS MARKET, BY REGION, 2019–2023 (USD MILLION)
  • TABLE 98 STRATEGY MANAGEMENT: AI IN CHEMICALS MARKET, BY REGION, 2024–2029 (USD MILLION)
  • TABLE 99 AI IN CHEMICALS MARKET, BY END USER, 2019–2023 (USD MILLION)
  • TABLE 100 AI IN CHEMICALS MARKET, BY END USER, 2024–2029 (USD MILLION)
  • TABLE 101 BASIC CHEMICALS: AI IN CHEMICALS MARKET, BY REGION, 2019–2023 (USD MILLION)
  • TABLE 102 BASIC CHEMICALS: AI IN CHEMICALS MARKET, BY REGION, 2024–2029 (USD MILLION)
  • TABLE 103 ADVANCED MATERIALS: AI IN CHEMICALS MARKET, BY REGION, 2019–2023 (USD MILLION)
  • TABLE 104 ADVANCED MATERIALS: AI IN CHEMICALS MARKET, BY REGION, 2024–2029 (USD MILLION)
  • TABLE 105 ACTIVE INGREDIENTS: AI IN CHEMICALS MARKET, BY REGION, 2019–2023 (USD MILLION)
  • TABLE 106 ACTIVE INGREDIENTS: AI IN CHEMICALS MARKET, BY REGION, 2024–2029 (USD MILLION)
  • TABLE 107 GREEN & BIOCHEMICALS: AI IN CHEMICALS MARKET, BY REGION, 2019–2023 (USD MILLION)
  • TABLE 108 GREEN & BIOCHEMICALS: AI IN CHEMICALS MARKET, BY REGION, 2024–2029 (USD MILLION)
  • TABLE 109 PAINTS & COATINGS: AI IN CHEMICALS MARKET, BY REGION, 2019–2023 (USD MILLION)
  • TABLE 110 PAINTS & COATINGS: AI IN CHEMICALS MARKET, BY REGION, 2024–2029 (USD MILLION)
  • TABLE 111 ADHESIVES & SEALANTS: AI IN CHEMICALS MARKET, BY REGION, 2019–2023 (USD MILLION)
  • TABLE 112 ADHESIVES & SEALANTS: AI IN CHEMICALS MARKET, BY REGION, 2024–2029 (USD MILLION)
  • TABLE 113 WATER TREATMENT & SERVICES: AI IN CHEMICALS MARKET, BY REGION, 2019–2023 (USD MILLION)
  • TABLE 114 WATER TREATMENT & SERVICES: AI IN CHEMICALS MARKET, BY REGION, 2024–2029 (USD MILLION)
  • TABLE 115 OTHER END USERS: AI IN CHEMICALS MARKET, BY REGION, 2019–2023 (USD MILLION)
  • TABLE 116 OTHER END USERS: AI IN CHEMICALS MARKET, BY REGION, 2024–2029 (USD MILLION)
  • TABLE 117 AI IN CHEMICALS MARKET, BY REGION, 2019–2023 (USD MILLION)
  • TABLE 118 AI IN CHEMICALS MARKET, BY REGION, 2024–2029 (USD MILLION)
  • TABLE 119 NORTH AMERICA: AI IN CHEMICALS MARKET, BY COUNTRY, 2019–2023 (USD MILLION)
  • TABLE 120 NORTH AMERICA: AI IN CHEMICALS MARKET, BY COUNTRY, 2024–2029 (USD MILLION)
  • TABLE 121 NORTH AMERICA: AI IN CHEMICALS MARKET, BY COMPONENT, 2019–2023 (USD MILLION)
  • TABLE 122 NORTH AMERICA: AI IN CHEMICALS MARKET, BY COMPONENT, 2024–2029 (USD MILLION)
  • TABLE 123 NORTH AMERICA: AI IN CHEMICALS MARKET, BY HARDWARE, 2019–2023 (USD MILLION)
  • TABLE 124 NORTH AMERICA: AI IN CHEMICALS MARKET, BY HARDWARE, 2024–2029 (USD MILLION)
  • TABLE 125 NORTH AMERICA: AI IN CHEMICALS MARKET, BY SOFTWARE TYPE, 2019–2023 (USD MILLION)
  • TABLE 126 NORTH AMERICA: AI IN CHEMICALS MARKET, BY SOFTWARE TYPE, 2024–2029 (USD MILLION)
  • TABLE 127 NORTH AMERICA: AI IN CHEMICALS SOFTWARE MARKET, BY TECHNOLOGY, 2019–2023 (USD MILLION)
  • TABLE 128 NORTH AMERICA: AI IN CHEMICALS SOFTWARE MARKET, BY TECHNOLOGY, 2024–2029 (USD MILLION)
  • TABLE 129 NORTH AMERICA: AI IN CHEMICALS SOFTWARE MARKET, BY DEPLOYMENT MODE, 2019–2023 (USD MILLION)
  • TABLE 130 NORTH AMERICA: AI IN CHEMICALS SOFTWARE MARKET, BY DEPLOYMENT MODE, 2024–2029 (USD MILLION)
  • TABLE 131 NORTH AMERICA: AI IN CHEMICALS MARKET, BY SERVICE, 2019–2023 (USD MILLION)
  • TABLE 132 NORTH AMERICA: AI IN CHEMICALS MARKET, BY SERVICE, 2024–2029 (USD MILLION)
  • TABLE 133 NORTH AMERICA: AI IN CHEMICALS MARKET, BY PROFESSIONAL SERVICE, 2019–2023 (USD MILLION)
  • TABLE 134 NORTH AMERICA: AI IN CHEMICALS MARKET, BY PROFESSIONAL SERVICE, 2024–2029 (USD MILLION)
  • TABLE 135 NORTH AMERICA: AI IN CHEMICALS MARKET, BY BUSINESS APPLICATION, 2019–2023 (USD MILLION)
  • TABLE 136 NORTH AMERICA: AI IN CHEMICALS MARKET, BY BUSINESS APPLICATION, 2024–2029 (USD MILLION)
  • TABLE 137 NORTH AMERICA: AI IN CHEMICALS MARKET, BY END USER, 2019–2023 (USD MILLION)
  • TABLE 138 NORTH AMERICA: AI IN CHEMICALS MARKET, BY END USER, 2024–2029 (USD MILLION)
  • TABLE 139 US: AI IN CHEMICALS MARKET, BY COMPONENT, 2019–2023 (USD MILLION)
  • TABLE 140 US: AI IN CHEMICALS MARKET, BY COMPONENT, 2024–2029 (USD MILLION)
  • TABLE 141 US: AI IN CHEMICALS MARKET, BY HARDWARE, 2019–2023 (USD MILLION)
  • TABLE 142 US: AI IN CHEMICALS MARKET, BY HARDWARE, 2024–2029 (USD MILLION)
  • TABLE 143 US: AI IN CHEMICALS MARKET, BY SOFTWARE TYPE, 2019–2023 (USD MILLION)
  • TABLE 144 US: AI IN CHEMICALS MARKET, BY SOFTWARE TYPE, 2024–2029 (USD MILLION)
  • TABLE 145 US: AI IN CHEMICALS SOFTWARE MARKET, BY TECHNOLOGY, 2019–2023 (USD MILLION)
  • TABLE 146 US: AI IN CHEMICALS SOFTWARE MARKET, BY TECHNOLOGY, 2024–2029 (USD MILLION)
  • TABLE 147 US: AI IN CHEMICALS SOFTWARE MARKET, BY DEPLOYMENT MODE, 2019–2023 (USD MILLION)
  • TABLE 148 US: AI IN CHEMICALS SOFTWARE MARKET, BY DEPLOYMENT MODE, 2024–2029 (USD MILLION)
  • TABLE 149 US: AI IN CHEMICALS MARKET, BY SERVICE, 2019–2023 (USD MILLION)
  • TABLE 150 US: AI IN CHEMICALS MARKET, BY SERVICE, 2024–2029 (USD MILLION)
  • TABLE 151 CANADA: AI IN CHEMICALS MARKET, BY COMPONENT, 2019–2023 (USD MILLION)
  • TABLE 152 CANADA: AI IN CHEMICALS MARKET, BY COMPONENT, 2024–2029 (USD MILLION)
  • TABLE 153 CANADA: AI IN CHEMICALS MARKET, BY HARDWARE, 2019–2023 (USD MILLION)
  • TABLE 154 CANADA: AI IN CHEMICALS MARKET, BY HARDWARE, 2024–2029 (USD MILLION)
  • TABLE 155 CANADA: AI IN CHEMICALS MARKET, BY SOFTWARE TYPE, 2019–2023 (USD MILLION)
  • TABLE 156 CANADA: AI IN CHEMICALS MARKET, BY SOFTWARE TYPE, 2024–2029 (USD MILLION)
  • TABLE 157 CANADA: AI IN CHEMICALS SOFTWARE MARKET, BY TECHNOLOGY, 2019–2023 (USD MILLION)
  • TABLE 158 CANADA: AI IN CHEMICALS SOFTWARE MARKET, BY TECHNOLOGY, 2024–2029 (USD MILLION)
  • TABLE 159 CANADA: AI IN CHEMICALS SOFTWARE MARKET, BY DEPLOYMENT MODE, 2019–2023 (USD MILLION)
  • TABLE 160 CANADA: AI IN CHEMICALS SOFTWARE MARKET, BY DEPLOYMENT MODE, 2024–2029 (USD MILLION)
  • TABLE 161 CANADA: AI IN CHEMICALS MARKET, BY SERVICE, 2019–2023 (USD MILLION)
  • TABLE 162 CANADA: AI IN CHEMICALS MARKET, BY SERVICE, 2024–2029 (USD MILLION)
  • TABLE 163 EUROPE: AI IN CHEMICALS MARKET, BY COUNTRY, 2019–2023 (USD MILLION)
  • TABLE 164 EUROPE: AI IN CHEMICALS MARKET, BY COUNTRY, 2024–2029 (USD MILLION)
  • TABLE 165 EUROPE: AI IN CHEMICALS MARKET, BY COMPONENT, 2019–2023 (USD MILLION)
  • TABLE 166 EUROPE: AI IN CHEMICALS MARKET, BY COMPONENT, 2024–2029 (USD MILLION)
  • TABLE 167 EUROPE: AI IN CHEMICALS MARKET, BY HARDWARE, 2019–2023 (USD MILLION)
  • TABLE 168 EUROPE: AI IN CHEMICALS MARKET, BY HARDWARE, 2024–2029 (USD MILLION)
  • TABLE 169 EUROPE: AI IN CHEMICALS MARKET, BY SOFTWARE TYPE, 2019–2023 (USD MILLION)
  • TABLE 170 EUROPE: AI IN CHEMICALS MARKET, BY SOFTWARE TYPE, 2024–2029 (USD MILLION)
  • TABLE 171 EUROPE: AI IN CHEMICALS SOFTWARE MARKET, BY TECHNOLOGY, 2019–2023 (USD MILLION)
  • TABLE 172 EUROPE: AI IN CHEMICALS SOFTWARE MARKET, BY TECHNOLOGY, 2024–2029 (USD MILLION)
  • TABLE 173 EUROPE: AI IN CHEMICALS SOFTWARE MARKET, BY DEPLOYMENT MODE, 2019–2023 (USD MILLION)
  • TABLE 174 EUROPE: AI IN CHEMICALS SOFTWARE MARKET, BY DEPLOYMENT MODE, 2024–2029 (USD MILLION)
  • TABLE 175 EUROPE: AI IN CHEMICALS MARKET, BY SERVICE, 2019–2023 (USD MILLION)
  • TABLE 176 EUROPE: AI IN CHEMICALS MARKET, BY SERVICE, 2024–2029 (USD MILLION)
  • TABLE 177 EUROPE: AI IN CHEMICALS MARKET, BY PROFESSIONAL SERVICE, 2019–2023 (USD MILLION)
  • TABLE 178 EUROPE: AI IN CHEMICALS MARKET, BY PROFESSIONAL SERVICE, 2024–2029 (USD MILLION)
  • TABLE 179 EUROPE: AI IN CHEMICALS MARKET, BY BUSINESS APPLICATION, 2019–2023 (USD MILLION)
  • TABLE 180 EUROPE: AI IN CHEMICALS MARKET, BY BUSINESS APPLICATION, 2024–2029 (USD MILLION)
  • TABLE 181 EUROPE: AI IN CHEMICALS MARKET, BY END USER, 2019–2023 (USD MILLION)
  • TABLE 182 EUROPE: AI IN CHEMICALS MARKET, BY END USER, 2024–2029 (USD MILLION)
  • TABLE 183 GERMANY: AI IN CHEMICALS MARKET, BY COMPONENT, 2019–2023 (USD MILLION)
  • TABLE 184 GERMANY: AI IN CHEMICALS MARKET, BY COMPONENT, 2024–2029 (USD MILLION)
  • TABLE 185 GERMANY: AI IN CHEMICALS MARKET, BY HARDWARE, 2019–2023 (USD MILLION)
  • TABLE 186 GERMANY: AI IN CHEMICALS MARKET, BY HARDWARE, 2024–2029 (USD MILLION)
  • TABLE 187 GERMANY: AI IN CHEMICALS MARKET, BY SOFTWARE TYPE, 2019–2023 (USD MILLION)
  • TABLE 188 GERMANY: AI IN CHEMICALS MARKET, BY SOFTWARE TYPE, 2024–2029 (USD MILLION)
  • TABLE 189 GERMANY: AI IN CHEMICALS SOFTWARE MARKET, BY TECHNOLOGY, 2019–2023 (USD MILLION)
  • TABLE 190 GERMANY: AI IN CHEMICALS SOFTWARE MARKET, BY TECHNOLOGY, 2024–2029 (USD MILLION)
  • TABLE 191 GERMANY: AI IN CHEMICALS SOFTWARE MARKET, BY DEPLOYMENT MODE, 2019–2023 (USD MILLION)
  • TABLE 192 GERMANY: AI IN CHEMICALS SOFTWARE MARKET, BY DEPLOYMENT MODE, 2024–2029 (USD MILLION)
  • TABLE 193 GERMANY: AI IN CHEMICALS MARKET, BY SERVICE, 2019–2023 (USD MILLION)
  • TABLE 194 GERMANY: AI IN CHEMICALS MARKET, BY SERVICE, 2024–2029 (USD MILLION)
  • TABLE 195 ASIA PACIFIC: AI IN CHEMICALS MARKET, BY COUNTRY, 2019–2023 (USD MILLION)
  • TABLE 196 ASIA PACIFIC: AI IN CHEMICALS MARKET, BY COUNTRY, 2024–2029 (USD MILLION)
  • TABLE 197 ASIA PACIFIC: AI IN CHEMICALS MARKET, BY COMPONENT, 2019–2023 (USD MILLION)
  • TABLE 198 ASIA PACIFIC: AI IN CHEMICALS MARKET, BY COMPONENT, 2024–2029 (USD MILLION)
  • TABLE 199 ASIA PACIFIC: AI IN CHEMICALS MARKET, BY HARDWARE, 2019–2023 (USD MILLION)
  • TABLE 200 ASIA PACIFIC: AI IN CHEMICALS MARKET, BY HARDWARE, 2024–2029 (USD MILLION)
  • TABLE 201 ASIA PACIFIC: AI IN CHEMICALS MARKET, BY SOFTWARE TYPE, 2019–2023 (USD MILLION)
  • TABLE 202 ASIA PACIFIC: AI IN CHEMICALS MARKET, BY SOFTWARE TYPE, 2024–2029 (USD MILLION)
  • TABLE 203 ASIA PACIFIC: AI IN CHEMICALS SOFTWARE MARKET, BY TECHNOLOGY, 2019–2023 (USD MILLION)
  • TABLE 204 ASIA PACIFIC: AI IN CHEMICALS SOFTWARE MARKET, BY TECHNOLOGY, 2024–2029 (USD MILLION)
  • TABLE 205 ASIA PACIFIC: AI IN CHEMICALS SOFTWARE MARKET, BY DEPLOYMENT MODE, 2019–2023 (USD MILLION)
  • TABLE 206 ASIA PACIFIC: AI IN CHEMICALS SOFTWARE MARKET, BY DEPLOYMENT MODE, 2024–2029 (USD MILLION)
  • TABLE 207 ASIA PACIFIC: AI IN CHEMICALS MARKET, BY SERVICE, 2019–2023 (USD MILLION)
  • TABLE 208 ASIA PACIFIC: AI IN CHEMICALS MARKET, BY SERVICE, 2024–2029 (USD MILLION)
  • TABLE 209 ASIA PACIFIC: AI IN CHEMICALS MARKET, BY PROFESSIONAL SERVICE, 2019–2023 (USD MILLION)
  • TABLE 210 ASIA PACIFIC: AI IN CHEMICALS MARKET, BY PROFESSIONAL SERVICE, 2024–2029 (USD MILLION)
  • TABLE 211 ASIA PACIFIC: AI IN CHEMICALS MARKET, BY BUSINESS APPLICATION, 2019–2023 (USD MILLION)
  • TABLE 212 ASIA PACIFIC: AI IN CHEMICALS MARKET, BY BUSINESS APPLICATION, 2024–2029 (USD MILLION)
  • TABLE 213 ASIA PACIFIC: AI IN CHEMICALS MARKET, BY END USER, 2019–2023 (USD MILLION)
  • TABLE 214 ASIA PACIFIC: AI IN CHEMICALS MARKET, BY END USER, 2024–2029 (USD MILLION)
  • TABLE 215 CHINA: AI IN CHEMICALS MARKET, BY COMPONENT, 2019–2023 (USD MILLION)
  • TABLE 216 CHINA: AI IN CHEMICALS MARKET, BY COMPONENT, 2024–2029 (USD MILLION)
  • TABLE 217 CHINA: AI IN CHEMICALS MARKET, BY HARDWARE, 2019–2023 (USD MILLION)
  • TABLE 218 CHINA: AI IN CHEMICALS MARKET, BY HARDWARE, 2024–2029 (USD MILLION)
  • TABLE 219 CHINA: AI IN CHEMICALS MARKET, BY SOFTWARE TYPE, 2019–2023 (USD MILLION)
  • TABLE 220 CHINA: AI IN CHEMICALS MARKET, BY SOFTWARE TYPE, 2024–2029 (USD MILLION)
  • TABLE 221 CHINA: AI IN CHEMICALS SOFTWARE MARKET, BY TECHNOLOGY, 2019–2023 (USD MILLION)
  • TABLE 222 CHINA: AI IN CHEMICALS SOFTWARE MARKET, BY TECHNOLOGY, 2024–2029 (USD MILLION)
  • TABLE 223 CHINA: AI IN CHEMICALS SOFTWARE MARKET, BY DEPLOYMENT MODE, 2019–2023 (USD MILLION)
  • TABLE 224 CHINA: AI IN CHEMICALS SOFTWARE MARKET, BY DEPLOYMENT MODE, 2024–2029 (USD MILLION)
  • TABLE 225 CHINA: AI IN CHEMICALS MARKET, BY SERVICE, 2019–2023 (USD MILLION)
  • TABLE 226 CHINA: AI IN CHEMICALS MARKET, BY SERVICE, 2024–2029 (USD MILLION)
  • TABLE 227 MIDDLE EAST & AFRICA: AI IN CHEMICALS MARKET, BY COUNTRY, 2019–2023 (USD MILLION)
  • TABLE 228 MIDDLE EAST & AFRICA: AI IN CHEMICALS MARKET, BY COUNTRY, 2024–2029 (USD MILLION)
  • TABLE 229 MIDDLE EAST & AFRICA: AI IN CHEMICALS MARKET, BY COMPONENT, 2019–2023 (USD MILLION)
  • TABLE 230 MIDDLE EAST & AFRICA: AI IN CHEMICALS MARKET, BY COMPONENT, 2024–2029 (USD MILLION)
  • TABLE 231 MIDDLE EAST & AFRICA: AI IN CHEMICALS MARKET, BY HARDWARE, 2019–2023 (USD MILLION)
  • TABLE 232 MIDDLE EAST & AFRICA: AI IN CHEMICALS MARKET, BY HARDWARE, 2024–2029 (USD MILLION)
  • TABLE 233 MIDDLE EAST & AFRICA: AI IN CHEMICALS MARKET, BY SOFTWARE TYPE, 2019–2023 (USD MILLION)
  • TABLE 234 MIDDLE EAST & AFRICA: AI IN CHEMICALS MARKET, BY SOFTWARE TYPE, 2024–2029 (USD MILLION)
  • TABLE 235 MIDDLE EAST & AFRICA: AI IN CHEMICALS SOFTWARE MARKET, BY TECHNOLOGY, 2019–2023 (USD MILLION)
  • TABLE 236 MIDDLE EAST & AFRICA: AI IN CHEMICALS SOFTWARE MARKET, BY TECHNOLOGY, 2024–2029 (USD MILLION)
  • TABLE 237 MIDDLE EAST & AFRICA: AI IN CHEMICALS SOFTWARE MARKET, BY DEPLOYMENT MODE, 2019–2023 (USD MILLION)
  • TABLE 238 MIDDLE EAST & AFRICA: AI IN CHEMICALS SOFTWARE MARKET, BY DEPLOYMENT MODE, 2024–2029 (USD MILLION)
  • TABLE 239 MIDDLE EAST & AFRICA: AI IN CHEMICALS MARKET, BY SERVICE, 2019–2023 (USD MILLION)
  • TABLE 240 MIDDLE EAST & AFRICA: AI IN CHEMICALS MARKET, BY SERVICE, 2024–2029 (USD MILLION)
  • TABLE 241 MIDDLE EAST & AFRICA: AI IN CHEMICALS MARKET, BY PROFESSIONAL SERVICE, 2019–2023 (USD MILLION)
  • TABLE 242 MIDDLE EAST & AFRICA: AI IN CHEMICALS MARKET, BY PROFESSIONAL SERVICE, 2024–2029 (USD MILLION)
  • TABLE 243 MIDDLE EAST & AFRICA: AI IN CHEMICALS MARKET, BY BUSINESS APPLICATION, 2019–2023 (USD MILLION)
  • TABLE 244 MIDDLE EAST & AFRICA: AI IN CHEMICALS MARKET, BY BUSINESS APPLICATION, 2024–2029 (USD MILLION)
  • TABLE 245 MIDDLE EAST & AFRICA: AI IN CHEMICALS MARKET, BY END USER, 2019–2023 (USD MILLION)
  • TABLE 246 MIDDLE EAST & AFRICA: AI IN CHEMICALS MARKET, BY END USER, 2024–2029 (USD MILLION)
  • TABLE 247 LATIN AMERICA: AI IN CHEMICALS MARKET, BY COUNTRY, 2019–2023 (USD MILLION)
  • TABLE 248 LATIN AMERICA: AI IN CHEMICALS MARKET, BY COUNTRY, 2024–2029 (USD MILLION)
  • TABLE 249 LATIN AMERICA: AI IN CHEMICALS MARKET, BY COMPONENT, 2019–2023 (USD MILLION)
  • TABLE 250 LATIN AMERICA: AI IN CHEMICALS MARKET, BY COMPONENT, 2024–2029 (USD MILLION)
  • TABLE 251 LATIN AMERICA: AI IN CHEMICALS MARKET, BY HARDWARE, 2019–2023 (USD MILLION)
  • TABLE 252 LATIN AMERICA: AI IN CHEMICALS MARKET, BY HARDWARE, 2024–2029 (USD MILLION)
  • TABLE 253 LATIN AMERICA: AI IN CHEMICALS MARKET, BY SOFTWARE TYPE, 2019–2023 (USD MILLION)
  • TABLE 254 LATIN AMERICA: AI IN CHEMICALS MARKET, BY SOFTWARE TYPE, 2024–2029 (USD MILLION)
  • TABLE 255 LATIN AMERICA: AI IN CHEMICALS SOFTWARE MARKET, BY TECHNOLOGY, 2019–2023 (USD MILLION)
  • TABLE 256 LATIN AMERICA: AI IN CHEMICALS SOFTWARE MARKET, BY TECHNOLOGY, 2024–2029 (USD MILLION)
  • TABLE 257 LATIN AMERICA: AI IN CHEMICALS SOFTWARE MARKET, BY DEPLOYMENT MODE, 2019–2023 (USD MILLION)
  • TABLE 258 LATIN AMERICA: AI IN CHEMICALS SOFTWARE MARKET, BY DEPLOYMENT MODE, 2024–2029 (USD MILLION)
  • TABLE 259 LATIN AMERICA: AI IN CHEMICALS MARKET, BY SERVICE, 2019–2023 (USD MILLION)
  • TABLE 260 LATIN AMERICA: AI IN CHEMICALS MARKET, BY SERVICE, 2024–2029 (USD MILLION)
  • TABLE 261 LATIN AMERICA: AI IN CHEMICALS MARKET, BY PROFESSIONAL SERVICE, 2019–2023 (USD MILLION)
  • TABLE 262 LATIN AMERICA: AI IN CHEMICALS MARKET, BY PROFESSIONAL SERVICE, 2024–2029 (USD MILLION)
  • TABLE 263 LATIN AMERICA: AI IN CHEMICALS MARKET, BY BUSINESS APPLICATION, 2019–2023 (USD MILLION)
  • TABLE 264 LATIN AMERICA: AI IN CHEMICALS MARKET, BY BUSINESS APPLICATION, 2024–2029 (USD MILLION)
  • TABLE 265 LATIN AMERICA: AI IN CHEMICALS MARKET, BY END USER, 2019–2023 (USD MILLION)
  • TABLE 266 LATIN AMERICA: AI IN CHEMICALS MARKET, BY END USER, 2024–2029 (USD MILLION)
  • TABLE 267 OVERVIEW OF STRATEGIES ADOPTED BY KEY AI IN CHEMICALS VENDORS
  • TABLE 268 AI IN CHEMICALS MARKET: DEGREE OF COMPETITION
  • TABLE 269 AI IN CHEMICALS MARKET: REGIONAL FOOTPRINT
  • TABLE 270 AI IN CHEMICALS MARKET: COMPONENT FOOTPRINT
  • TABLE 271 AI IN CHEMICALS MARKET: BUSINESS APPLICATION FOOTPRINT
  • TABLE 272 AI IN CHEMICALS MARKET: END USER FOOTPRINT
  • TABLE 273 AI IN CHEMICALS MARKET: DETAILED LIST OF KEY START-UPS/SMES
  • TABLE 274 AI IN CHEMICALS MARKET: COMPETITIVE BENCHMARKING OF KEY START-UPS/SMES
  • TABLE 275 AI IN CHEMICALS MARKET: PRODUCT LAUNCHES AND ENHANCEMENTS, JANUARY 2021–FEBRUARY 2024
  • TABLE 276 AI IN CHEMICALS MARKET: DEALS, JANUARY 2021–FEBRUARY 2024
  • TABLE 277 IBM: BUSINESS OVERVIEW
  • TABLE 278 IBM: PRODUCTS/SOLUTIONS/SERVICES OFFERED
  • TABLE 279 IBM: PRODUCT LAUNCHES AND ENHANCEMENTS
  • TABLE 280 IBM: DEALS
  • TABLE 281 MICROSOFT: BUSINESS OVERVIEW
  • TABLE 282 MICROSOFT: PRODUCTS/SOLUTIONS/SERVICES OFFERED
  • TABLE 283 MICROSOFT: PRODUCT LAUNCHES AND ENHANCEMENTS
  • TABLE 284 MICROSOFT: DEALS
  • TABLE 285 GOOGLE: BUSINESS OVERVIEW
  • TABLE 286 GOOGLE: PRODUCTS/SOLUTIONS/SERVICES OFFERED
  • TABLE 287 GOOGLE: PRODUCT LAUNCHES AND ENHANCEMENTS
  • TABLE 288 GOOGLE: DEALS
  • TABLE 289 NVIDIA: BUSINESS OVERVIEW
  • TABLE 290 NVIDIA: PRODUCTS/SOLUTIONS/SERVICES OFFERED
  • TABLE 291 NVIDIA: PRODUCT LAUNCHES AND ENHANCEMENTS
  • TABLE 292 NVIDIA: DEALS
  • TABLE 293 SCHNEIDER ELECTRIC: BUSINESS OVERVIEW
  • TABLE 294 SCHNEIDER ELECTRIC: PRODUCTS/SOLUTIONS/SERVICES OFFERED
  • TABLE 295 SCHNEIDER ELECTRIC: PRODUCT LAUNCHES AND ENHANCEMENTS
  • TABLE 296 SCHNEIDER ELECTRIC: DEALS
  • TABLE 297 SCHNEIDER ELECTRIC: OTHERS
  • TABLE 298 AWS: BUSINESS OVERVIEW
  • TABLE 299 AWS: PRODUCTS/SOLUTIONS/SERVICES OFFERED
  • TABLE 300 AWS: PRODUCT LAUNCHES AND ENHANCEMENTS
  • TABLE 301 AWS: DEALS
  • TABLE 302 SAP: BUSINESS OVERVIEW
  • TABLE 303 SAP: PRODUCTS/SOLUTIONS/SERVICES OFFERED
  • TABLE 304 SAP: DEALS
  • TABLE 305 SIEMENS: BUSINESS OVERVIEW
  • TABLE 306 SIEMENS: PRODUCTS/SOLUTIONS/SERVICES OFFERED
  • TABLE 307 SIEMENS: PRODUCT LAUNCHES AND ENHANCEMENTS
  • TABLE 308 SIEMENS: DEALS
  • TABLE 309 C3 AI: BUSINESS OVERVIEW
  • TABLE 310 C3 AI: PRODUCTS/SOLUTIONS/SERVICES OFFERED
  • TABLE 311 C3 AI: PRODUCT LAUNCHES AND ENHANCEMENTS
  • TABLE 312 C3 AI: DEALS
  • TABLE 313 GE VERNOVA: BUSINESS OVERVIEW
  • TABLE 314 GE VERNOVA: PRODUCTS/SOLUTIONS/SERVICES OFFERED
  • TABLE 315 GE VERNOVA: PRODUCT LAUNCHES AND ENHANCEMENTS
  • TABLE 316 GE VERNOVA: DEALS
  • TABLE 317 GE VERNOVA: EXPANSIONS
  • TABLE 318 HEXAGON AB: BUSINESS OVERVIEW
  • TABLE 319 HEXAGON AB: PRODUCTS/SOLUTIONS/SERVICES OFFERED
  • TABLE 320 HEXAGON AB: DEALS
  • TABLE 321 ENGIE IMPACT: BUSINESS OVERVIEW
  • TABLE 322 ENGIE IMPACT: PRODUCTS/SOLUTIONS/SERVICES OFFERED
  • TABLE 323 ENGIE IMPACT: PRODUCT LAUNCHES AND ENHANCEMENTS
  • TABLE 324 ENGIE IMPACT: DEALS
  • TABLE 325 ARTIFICIAL INTELLIGENCE MARKET SIZE AND GROWTH RATE, 2017–2022 (USD MILLION, Y-O-Y GROWTH)
  • TABLE 326 ARTIFICIAL INTELLIGENCE MARKET SIZE AND GROWTH RATE, 2023–2030 (USD MILLION, Y-O-Y GROWTH)
  • TABLE 327 ARTIFICIAL INTELLIGENCE MARKET, BY OFFERING, 2017–2022 (USD MILLION)
  • TABLE 328 ARTIFICIAL INTELLIGENCE MARKET, BY OFFERING, 2023–2030 (USD MILLION)
  • TABLE 329 ARTIFICIAL INTELLIGENCE MARKET, BY TECHNOLOGY, 2017–2022 (USD MILLION)
  • TABLE 330 ARTIFICIAL INTELLIGENCE MARKET, BY TECHNOLOGY, 2023–2030 (USD MILLION)
  • TABLE 331 ARTIFICIAL INTELLIGENCE MARKET, BY BUSINESS FUNCTION, 2017–2022 (USD MILLION)
  • TABLE 332 ARTIFICIAL INTELLIGENCE MARKET, BY BUSINESS FUNCTION, 2023–2030 (USD MILLION)
  • TABLE 333 ARTIFICIAL INTELLIGENCE MARKET, BY VERTICAL, 2017–2022 (USD MILLION)
  • TABLE 334 ARTIFICIAL INTELLIGENCE MARKET, BY VERTICAL, 2023–2030 (USD MILLION)
  • TABLE 335 ARTIFICIAL INTELLIGENCE MARKET, BY REGION, 2017–2022 (USD MILLION)
  • TABLE 336 ARTIFICIAL INTELLIGENCE MARKET, BY REGION, 2023–2030 (USD MILLION)
  • TABLE 337 GLOBAL GENERATIVE AI MARKET SIZE AND GROWTH RATE, 2019–2022 (USD MILLION, Y-O-Y )
  • TABLE 338 GLOBAL GENERATIVE AI MARKET SIZE AND GROWTH RATE, 2023–2030 (USD MILLION, Y-O-Y )
  • TABLE 339 GENERATIVE AI MARKET, BY OFFERING, 2019–2022 (USD MILLION)
  • TABLE 340 GENERATIVE AI MARKET, BY OFFERING, 2023–2030 (USD MILLION)
  • TABLE 341 APPLICATION BY BUSINESS FUNCTION: GENERATIVE AI MARKET, 2019–2022 (USD MILLION)
  • TABLE 342 APPLICATION BY BUSINESS FUNCTION: GENERATIVE AI MARKET, 2023–2030 (USD MILLION)
  • TABLE 343 APPLICATION BY DATA MODALITY: GENERATIVE AI MARKET, 2019–2022 (USD MILLION)
  • TABLE 344 APPLICATION BY DATA MODALITY: GENERATIVE AI MARKET, 2023–2030 (USD MILLION)
  • TABLE 345 GENERATIVE AI MARKET, BY VERTICAL, 2019–2022 (USD MILLION)
  • TABLE 346 GENERATIVE AI MARKET, BY VERTICAL, 2023–2030 (USD MILLION)
  • TABLE 347 GENERATIVE AI MARKET, BY REGION, 2019–2022 (USD MILLION)
  • TABLE 348 GENERATIVE AI MARKET, BY REGION, 2023–2030 (USD MILLION)
LIST OF FIGURES
 
  • FIGURE 1 AI IN CHEMICALS MARKET: RESEARCH DESIGN
  • FIGURE 2 AI IN CHEMICALS MARKET: DATA TRIANGULATION
  • FIGURE 3 AI IN CHEMICALS MARKET: TOP-DOWN AND BOTTOM-UP APPROACHES
  • FIGURE 4 APPROACH 1 (SUPPLY SIDE): REVENUE FROM VENDORS OF HARDWARE/SOFTWARE/SERVICES OF AI IN CHEMICALS MARKET
  • FIGURE 5 APPROACH 2 (BOTTOM-UP, SUPPLY SIDE): COLLECTIVE REVENUE FROM ALL HARDWARE/SOFTWARE/SERVICES OF AI IN CHEMICALS
  • FIGURE 6 APPROACH 3 (BOTTOM-UP, SUPPLY SIDE): MARKET ESTIMATION FROM ALL HARDWARE/SOFTWARE/SERVICES AND CORRESPONDING SOURCES
  • FIGURE 7 APPROACH 4 (BOTTOM-UP, DEMAND-SIDE): SHARE OF AI IN CHEMICALS THROUGH OVERALL AI IN CHEMICALS SPENDING
  • FIGURE 8 SOFTWARE SEGMENT TO ACCOUNT FOR LARGEST MARKET IN 2024
  • FIGURE 9 ACCELERATORS SEGMENT TO ACCOUNT FOR LARGEST MARKET IN 2024
  • FIGURE 10 DASHBOARD & ANALYTICS TOOLS SEGMENT TO ACCOUNT FOR LARGEST MARKET IN 2024
  • FIGURE 11 MACHINE LEARNING SEGMENT TO ACCOUNT FOR LARGEST MARKET IN 2024
  • FIGURE 12 CLOUD SEGMENT TO ACCOUNT FOR LARGER MARKET SHARE IN 2024
  • FIGURE 13 PROFESSIONAL SERVICES SEGMENT TO ACCOUNT FOR LARGER MARKET IN 2024
  • FIGURE 14 CONSULTING SERVICES SEGMENT TO ACCOUNT FOR LARGEST MARKET IN 2024
  • FIGURE 15 PRODUCTION SEGMENT TO ACCOUNT FOR LARGEST MARKET IN 2024
  • FIGURE 16 ACTIVE INGREDIENTS SEGMENT TO GROW AT HIGHEST CAGR DURING FORECAST PERIOD
  • FIGURE 17 ASIA PACIFIC TO GROW AT HIGHEST CAGR DURING FORECAST PERIOD
  • FIGURE 18 RISING DEMAND FOR AI-ENHANCED PROCESS OPTIMIZATION TO BOOST MARKET GROWTH
  • FIGURE 19 AI IN CHEMICALS MARKET TO WITNESS MINOR DECLINE IN Y-O-Y GROWTH IN 2024
  • FIGURE 20 SERVICES SEGMENT TO GROW AT HIGHEST CAGR DURING FORECAST PERIOD
  • FIGURE 21 SOFTWARE AND BASIC CHEMICALS SEGMENTS TO ACCOUNT FOR SIGNIFICANT SHARES IN AI IN CHEMICALS MARKET IN 2024
  • FIGURE 22 NORTH AMERICA TO ACCOUNT FOR LARGEST MARKET SHARE IN 2024
  • FIGURE 23 DRIVERS, RESTRAINTS, OPPORTUNITIES, AND CHALLENGES: AI IN CHEMICALS MARKETS
  • FIGURE 24 IMPLEMENTATION OF ARTIFICIAL INTELLIGENCE IN CHEMICAL SECTOR
  • FIGURE 25 EVOLUTION OF AI IN CHEMICALS MARKET
  • FIGURE 26 AI IN CHEMICALS MARKET: SUPPLY CHAIN ANALYSIS
  • FIGURE 27 KEY PLAYERS IN AI IN CHEMICALS MARKET ECOSYSTEM
  • FIGURE 28 AVERAGE SELLING PRICE TREND OF KEY PLAYER: TOP THREE BUSINESS APPLICATIONS
  • FIGURE 29 NUMBER OF PATENTS GRANTED IN LAST 10 YEARS, 2014–2024
  • FIGURE 30 TOP 10 APPLICANTS IN AI IN CHEMICALS MARKET, 2014–2024
  • FIGURE 31 REGIONAL ANALYSIS OF PATENTS GRANTED FOR AI IN CHEMICALS MARKET, 2014–2024
  • FIGURE 32 AUTOMATIC DATA-PROCESSING MACHINES AND UNITS IMPORT DATA, BY KEY COUNTRY, 2016–2023 (USD MILLION)
  • FIGURE 33 AUTOMATIC DATA-PROCESSING MACHINES AND UNITS EXPORT DATA, BY KEY COUNTRY, 2016–2023 (USD MILLION)
  • FIGURE 34 AI IN CHEMICALS MARKET: INVESTMENT LANDSCAPE, 2019–2024
  • FIGURE 35 PORTER’S FIVE FORCES’ ANALYSIS: AI IN CHEMICALS MARKET
  • FIGURE 36 TRENDS/DISRUPTIONS IMPACTING CUSTOMERS’ BUSINESSES
  • FIGURE 37 INFLUENCE OF STAKEHOLDERS ON BUYING PROCESS FOR TOP THREE END USERS
  • FIGURE 38 KEY BUYING CRITERIA FOR TOP THREE END USERS
  • FIGURE 39 SERVICES SEGMENT TO GROW AT HIGHEST CAGR DURING FORECAST PERIOD
  • FIGURE 40 CHEMICAL MODELING SOFTWARE SEGMENT TO GROW AT HIGHEST CAGR DURING FORECAST PERIOD
  • FIGURE 41 GENERATIVE AI TECHNOLOGY SEGMENT TO GROW AT HIGHEST CAGR DURING FORECAST PERIOD
  • FIGURE 42 CLOUD SEGMENT TO GROW AT HIGHER CAGR DURING FORECAST PERIOD
  • FIGURE 43 MANAGED SERVICES SEGMENT TO GROW AT HIGHER CAGR DURING FORECAST PERIOD
  • FIGURE 44 SUPPORT & MAINTENANCE SERVICES SEGMENT TO GROW AT HIGHEST CAGR DURING FORECAST PERIOD
  • FIGURE 45 RESEARCH & DEVELOPMENT SEGMENT TO GROW AT HIGHEST CAGR DURING FORECAST PERIOD
  • FIGURE 46 ACTIVE INGREDIENTS SEGMENT TO GROW AT LARGEST MARKET DURING FORECAST PERIOD
  • FIGURE 47 INDIA TO WITNESS HIGHEST CAGR DURING FORECAST PERIOD
  • FIGURE 48 ASIA PACIFIC TO GROW AT HIGHEST CAGR DURING FORECAST PERIOD
  • FIGURE 49 NORTH AMERICA: MARKET SNAPSHOT
  • FIGURE 50 ASIA PACIFIC: MARKET SNAPSHOT
  • FIGURE 51 TOP 5 PLAYERS DOMINATING MARKET FOR LAST 5 YEARS
  • FIGURE 52 MARKET SHARE ANALYSIS OF KEY PLAYERS, 2023
  • FIGURE 53 BRAND/PRODUCT COMPARISON ANALYSIS
  • FIGURE 54 AI IN CHEMICALS MARKET: COMPANY EVALUATION MATRIX (KEY PLAYERS), 2023
  • FIGURE 55 AI IN CHEMICALS MARKET: OVERALL COMPANY FOOTPRINT
  • FIGURE 56 AI IN CHEMICALS MARKET: COMPANY EVALUATION MATRIX (START-UPS/SMES), 2023
  • FIGURE 57 COMPANY VALUATION AND FINANCIAL METRICS OF KEY VENDORS
  • FIGURE 58 YEAR-TO-DATE (YTD) PRICE TOTAL RETURN AND 5-YEAR STOCK BETA OF KEY VENDORS
  • FIGURE 59 IBM: COMPANY SNAPSHOT
  • FIGURE 60 MICROSOFT: COMPANY SNAPSHOT
  • FIGURE 61 GOOGLE: COMPANY SNAPSHOT
  • FIGURE 62 NVIDIA: COMPANY SNAPSHOT
  • FIGURE 63 SCHNEIDER ELECTRIC: COMPANY SNAPSHOT
  • FIGURE 64 AWS: COMPANY SNAPSHOT
  • FIGURE 65 SAP: COMPANY SNAPSHOT
  • FIGURE 66 SIEMENS: COMPANY SNAPSHOT
  • FIGURE 67 C3 AI: COMPANY SNAPSHOT
  • FIGURE 68 GE VERNOVA: COMPANY SNAPSHOT
  • FIGURE 69 HEXAGON AB: COMPANY SNAPSHOT

The research study for the AI in chemicals market involved extensive secondary sources, directories, International Journal of Innovation and Technology Management and paid databases. Primary sources were mainly industry experts from the core and related industries, preferred AI in chemicals market providers, third-party service providers, consulting service providers, end users, and other commercial enterprises. In-depth interviews were conducted with various primary respondents, including key industry participants and subject matter experts, to obtain and verify critical qualitative and quantitative information, and assess the market’s prospects.

Secondary Research

The market size of companies offering AI in chemicals hardware, software and services was arrived at hardware, software, and services was determined based on secondary data available through paid and unpaid sources. It was also arrived at by analyzing the product portfolios of major companies and rating the companies based on their performance and quality.

In the secondary research process, various sources were referred to, for identifying and collecting identify and collect information for this study. Secondary sources included annual reports, press releases, and investor presentations of companies; white papers, journals, and certified publications; and articles from recognized authors, directories, and databases. The data was also collected from other secondary sources, such as journals, government websites, blogs, and vendors' websites. Additionally, AI in chemicals spending of spending in various countries was extracted from the respective sources. Secondary research was mainly used to obtain key information related to the industry’s value chain and supply chain to identify key players based on hardware, software, services, market classification, and segmentation according to offerings of major players, industry trends related to components, business applications, end users, and regions, and key developments from both market- and technology-oriented perspectives.

Primary Research

In the primary research process, various primary sources from both the supply and demand sides were interviewed to obtain qualitative and quantitative information on the market. The primary sources from the supply side included various industry experts, including Chief Experience Officers (CXOs); Vice Presidents (VPs); directors from business development, marketing, and AI in chemicals expertise; related key executives from AI in chemicals solution vendors, System Integrators (SIs), professional service providers, and industry associations; and key opinion leaders.

Primary interviews were conducted to gather insights, such as market statistics, revenue data collected from hardware, software, and services, market breakups, market size estimations, market forecasts, and data triangulation. Primary research also helped in understandingunderstand various trends related to technologies, applications, deployments, and regions. Stakeholders from the demand side, such as Chief Information Officers (CIOs), Chief Technology Officers (CTOs), Chief Strategy Officers (CSOs), and end users using AI in chemicals hardware, software, and services, were interviewed to understand the buyer’s perspective on suppliers, products, service providers, and their current usage of AI in chemicals hardware, software, and services and services, which would impact the overall AI in chemicals market.

The following is the breakup of primary profiles:
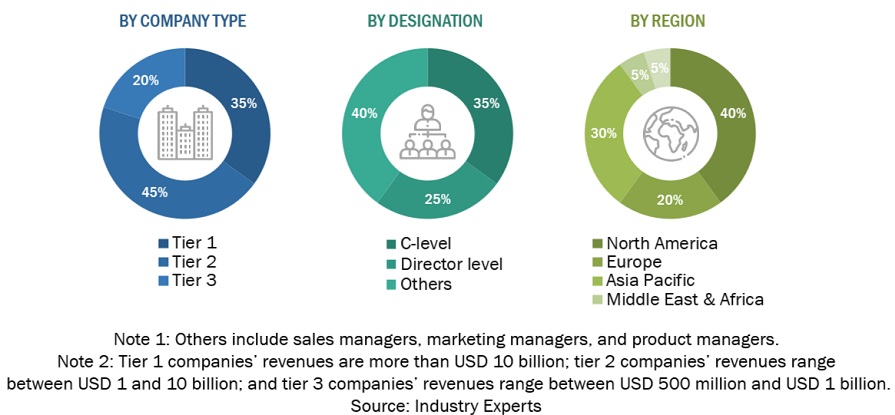
AI in Chemicals Market  Market Size, and Share

To know about the assumptions considered for the study, download the pdf brochure

Market Size Estimation

Multiple approaches were adopted for estimating and forecasting the AI in chemicals market. The first approach involves estimating the market size by summation of companies’ revenue generated through the sale of hardware, software and services.

Market Size Estimation Methodology-Top-down approach

In the top-down approach, an exhaustive list of all the vendors offering hardware, software and services in the AI in chemicals market was prepared. The revenue contribution of the market vendors was estimated through annual reports, press releases, funding, investor presentations, paid databases, and primary interviews. Each vendor’s offerings were evaluated based on the breadth of hardware, solutions, solution by component, business application, end user and regions. The aggregate of all the companies’ revenue was extrapolated to reach the overall market size. Each subsegment was studied and analyzed for its global market size and regional penetration. The markets were triangulated through both primary and secondary research. The primary procedure included extensive interviews for key insights from industry leaders, such as CIOs, CEOs, VPs, directors, and marketing executives. The market numbers were further triangulated with the existing MarketsandMarkets repository for validation.

Market Size Estimation Methodology-Bottom-up approach

In the bottom-up approach, the adoption rate of AI in chemicals hardware, software and services among different end users in key countries with respect to their regions contributing the most to the market share was identified. For cross-validation, the adoption of AI in chemicals hardware, software and services among industries, along with different use cases with respect to their regions, was identified and extrapolated. Weightage was given to use cases identified in different regions for the market size calculation.

Based on the market numbers, the regional split was determined by primary and secondary sources. The procedure included the analysis of the AI in chemicals market’s regional penetration. Based on secondary research, the regional spending on Information and Communications Technology (ICT), socio-economic analysis of each country, strategic vendor analysis of major AI in chemicals hardware, software and services providers, and organic and inorganic business development activities of regional and global players were estimated. With the data triangulation procedure and data validation through primaries, the exact values of the overall AI in chemicals hardware, software and services market size and segments’ size were determined and confirmed using the study.

Top-down and Bottom-up approaches
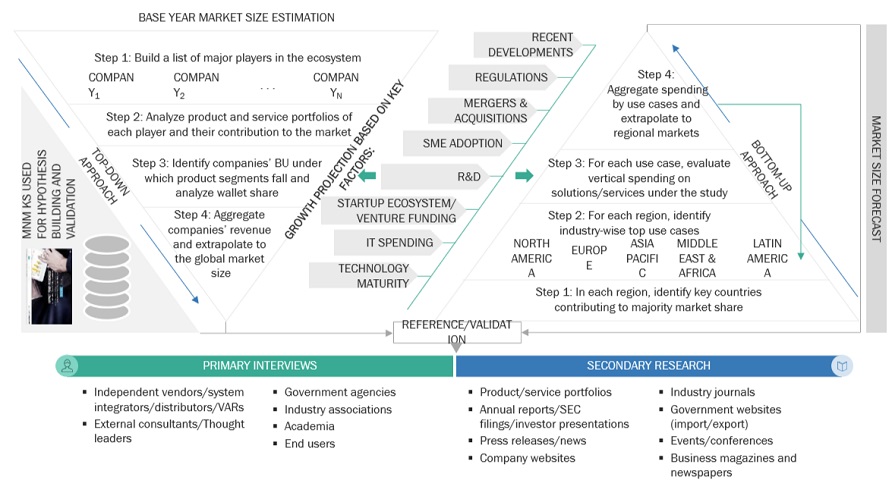
AI in Chemicals Market  Market Top Down and Bottom Up Approach

To know about the assumptions considered for the study, Request for Free Sample Report

Data Triangulation

After arriving at the overall market size using the market size estimation processes as explained above, the market was split into several segments and subsegments. To complete the overall market engineering process and arrive at the exact statistics of each market segment and subsegment, data triangulation and market breakup procedures were employed, wherever applicable. The overall market size was then used in the top-down procedure to estimate the size of other individual markets via percentage splits of the market segmentation.

Market Definition

According to Nexocode, Artificial Intelligence (AI) is a powerful tool that can help chemical companies work smarter and faster. The technology enables more productive processes by automating tasks, providing insights into how chemicals react, or improving manufacturing environments.

AI in chemicals refers to the application of AI technologies and techniques within the chemical industry to enhance processes, improve decision-making, and drive innovation. It uses advanced algorithms, machine learning models, and data analytics to optimize various aspects of chemical production, research and development, supply chain management, and environmental sustainability. AI in chemicals enables companies to streamline operations, develop new materials and products more efficiently, and respond effectively to market dynamics, ultimately leading to improved productivity, cost savings, and competitive advantage.

Stakeholders

  • AI in Chemicals Sofware Providers
  • AI Technology Providers
  • Professional and Managed Service Providers
  • Industry Associations
  • Research Institutions
  • System Integrators
  • Technology Consultants
  • Independent Software Vendors (ISVs)
  • Consulting Firms
  • Value-Added Resellers (VARs)
  • Government Agencies

Report Objectives

  • To define, describe, and predict the AI in chemicals market by component (hardware, software, and services), business application, and end users.
  • To provide detailed information related to major factors (drivers, restraints, opportunities, and industry-specific challenges) influencing the market growth
  • To forecast the market size of segments with respect to five main regions: North America, Europe, Asia Pacific, Middle East & Africa, and Latin America
  • To strategically analyze micromarkets with respect to individual growth trends, prospects, and contributions to the overall AI in chemicals market
  • To analyze opportunities in the market and provide details of the competitive landscape for stakeholders and market leaders
  • To analyze competitive developments, such as partnerships, mergers and acquisitions, and product developments, in the AI in chemicals market
  • To analyze the impact of the recession across all the regions in the AI in chemicals market

Available Customizations

With the given market data, MarketsandMarkets offers customizations as per the company’s specific needs. The following customization options are available for the report:

Product Analysis

  • The product matrix provides a detailed comparison of the product portfolio of each company.

Geographic Analysis as per Feasibility

  • Further breakup of the North American AI in chemicals Market
  • Further breakup of the European Market
  • Further breakup of the Asia Pacific Market
  • Further breakup of the Middle East & Africa Market
  • Further breakup of the Latin American AI in chemicals Market

Company Information

  • Detailed analysis and profiling of additional market players (up to five)

Previous Versions of this Report

"Our USP is "providing game-changing business opportunities reports with free customization" - so please feel free to provide us with your specific areas of interest / business challenges in much greater detail !!"

We appreciate your interest in this report. Once you fill out the form, you'll be immediately directed to an exclusive solution tailored to your needs. This high-value offering can help boost your revenue by 30% - a must-see opportunity for anyone looking to maximize growth.


By clicking the "Submit" button, you are agreeing to the Terms of Use and Privacy Policy.

Custom Market Research Services

We Will Customise The Research For You, In Case The Report Listed Above Does Not Meet With Your Requirements

Get 10% Free Customisation

Growth opportunities and latent adjacency in AI in Chemicals Market

DMCA.com Protection Status