Aquafeed Market

Aquafeed Market Size, Share, and Growth Trends Report by Ingredient (Soybean, Corn, Fishmeal, Fish Oil, Additives), Species (Fish, Crustaceans, Mollusks), Function (Nutrition, Growth Promoters, Immunity, Texture & Palatability), Lifecycle, Form and Region - Global Industry Forecast to 2029

Report Code: AGI 2681 Aug, 2024, by marketsandmarkets.com

Aquafeed Market Overview (2024-2029)

The global aquafeed market is projected to reach USD 84.2 billion by 2029 from USD 59.0 billion by 2024, at a CAGR of 7.4% during the forecast period in terms of value, highlighting the growing aquafeed market size. Demand for seafood and innovation in aquaculture technologies are driving the growth of the aquafeed market. According to FAO, global aquaculture production in 2022 reached a record level of 130.9 million tonnes, which represents 51% of global fish production. This surge in aquaculture has resulted in demand for high-quality aquafeed to ensure optimum growth and health in farmed species of aquatic origin.

According to NMFS, US aquaculture production reached more than 660 million pounds of seafood in 2022 alone; this level of production was backed by the aquafeed market. According to the USDA, there has been a steady increase in aquafeed production, driven by rising domestic aquaculture practices and specialized feed formulations, highlighting the market value.

Sustainability concerns are becoming alarming regulators, and most governments have initiated the promotion of the use of alternative ingredients in aquafeed in an attempt to reduce their dependence on fishmeal and fish oil. The European Union, through the Common Fisheries Policy, has adopted strict requirements for sustainable aquaculture practices, as well as the use and sourcing of fishmeal and fish oil in the production of aquafeed ingredients. This includes sourcing raw materials for the manufacture of aquafeed ingredients to meet the increasing market demand.

Aquafeed Market Overview

To know about the assumptions considered for the study, Request for Free Sample Report

Aquafeed Market Opportunities

To know about the assumptions considered for the study, download the pdf brochure

Aquafeed Market Dynamics

Drivers: Rise in Seafood Trade Propelling Demand

According to the Food and Agriculture Organization, global fish production reached 179 million tonnes in 2022, out of which 89% was for human consumption. An increase in the consumption of fish has raised the demand for quality feed. This trend is benefiting the specialized aquafeed market by improving fish yields and quality, which is vital for market analysis. As more fish are farmed and consumed, the demand for effective and nutritious feed rises, helping ensure better fish production outcomes. Another important indicator is the increased share of farmed fish in global fish production, from 25.7% in the year 2000 to more than 46% in 2022, boosting the growth of the industry and the important place that aquafeed occupies in it. The trend is being supported by governments as well; for instance, China, the producer of the world's largest aquaculture products, has policies that would encourage aquafeed innovation and sustainability. Increased seafood trade not only drives the demand for aquafeed but also fuels feed formulation innovation toward compliance with tight export standards and consumer preferences, which are key market drivers. The aquafeed market is expected to grow alongside the seafood market, focusing on the specific nutrient needs of different fish species, as highlighted in the aquafeed market report. This will help offer high-quality and sustainable seafood products to the global market.

Restraints: Lack of Awareness About Modern Feeding Methods in Developing Countries

In many parts of the world, traditional practice still characterizes aquaculture, resulting in suboptimal growth and feed efficiency. According to FAO, about 60% of small-scale aquaculture operations in Africa and parts of South Asia remain dependent on outdated, low-nutrient feeds that lower productivity and profitability. This lack of knowledge and space for the adoption of technology substantially constrains the potential for improvement of fish yield and quality—two critical elements of market growth. Moreover, access to resources, such as high-quality feed ingredients and training programs, is low in these countries, exacerbating the situation, which cannot fully exploit the benefits accruable from contemporary aquaculture practices.

Most governments in developing nations lack the proper infrastructure or the finances to adopt extensive education techniques and large-scale adoption of advanced aquafeed methods, thus impeding further market development. This trend makes the growth of the global aquafeed market quite uneven, with slower progress in regions where modern feeding practices have not been widely adopted, impacting the market players involved. This constraint can only be overcome through direct efforts by governments and international organizations to raise awareness, offer training, and increase access to modern technologies for aquaculture.

Opportunities: Development of Innovative Products as Source of Protein

Innovative aquafeed products offer a great opportunity for market growth, particularly as a source of protein. With an increase in demand for sustainable aquaculture, the need for alternative protein sources to replace traditional fishmeal is also increasing, influencing the overall aquafeed market size. According to the FAO, global fishmeal production is already reaching its maximum capacity with the constrained wild fish stocks; hence, new protein-rich feed ingredients have been studied and are being developed. The FAO has projected that insect proteins, algae, and plant-based alternatives will constitute about 30% of the ingredients in aquafeeds by 2030. This is expected to significantly reduce the reliance of aquafeeds on fishmeal and fish oil, reflecting current market trends. Modern alternatives provide the necessary nutrients and support the trend of meeting consumer demands concerning sustainably sourced seafood. Governments are encouraging development through research grants and policy initiatives to promote sustainable aquaculture practices, which are essential for key market players. For example, under the Horizon 2020 program, the European Union has funded projects on the use of insect protein for aquafeed. With the development of these innovative products, improved feed efficiency, reduced costs, and a huge contribution to the significant growth of the aquafeed market can be observed.

Challenges: Growth in Environmental and Human Health Concerns

Intensification of aquaculture has increased the analysis of the potential environmental impact of feed raw materials and health risks from farmed fish. Water pollution, habitat loss, and excessive use of antibiotics in feed will become the key issues affecting regulatory frameworks worldwide. For example, the European Union has applied stiffer controls over feed additives and the use of antibiotics in aquaculture to protect the environment and public health. Additionally, consumers are now pressurizing feed manufacturers to be eco-friendly and health-conscious, reflecting the changing dynamics in the fish feed sector. This requires huge investments in research and development to formulate feeds that are environmentally friendly and, at the same time, of nutritive quality and bio-safe for the aquaculture species, aligning with current market trends in the aquafeed market size. The issue is how to reconcile these problems with the continued production of cost-effective, efficient feeds since tighter legislation and evolving consumer attitudes are likely to raise some operating costs and add to the restraints on market growth. If not mitigated, this challenge could be the single most critical issue facing the long-term sustainability of the aquafeed industry.

Market Ecosystem

Top Aquafeed Companies

Dry Form Accounted for Higher Market Share Among Form Segments in 2023.

In the aquafeed market, the dry form includes pellets, crumbles, and powders. Dry feeds are mainly predominant due to the facility and convenience they provide over the other forms. Dry aquafeeds are easier to store, handle, and move compared to wet and liquid feeds that need more delicate management to avoid spoilage or contamination. This particularly fits large-scale aquaculture operations where logistic efficiency is very important.

Dry feeds in pellet form are favored by many aqua culturists as they offer a stable and precisely formulated nutritional profile. These feeds are designed to meet the specific dietary needs of various aquatic species, ensuring they receive balanced nutrition for optimal growth. Companies like ADM (US) and Cargill Incorporated (US) produce pelletized feeds for species such as salmon and shrimp, carefully blending proteins, fats, vitamins, and minerals in exact proportions, contributing to the overall aquafeed market's growth.

Grower Feed in Lifecycle Segment to be Dominant Market During Forecast Period.

Grower aquafeed meets the demand of aquatic species, switching to a more developed growth stage, normally containing 30–40% protein, which supports the continuity of development but synchronizes growth at reduced rates. It is cost-effective as it provides a balanced nutritional formulation tailored for optimal fish growth, contributing to the overall fish feed quality. Its pelletized form improves feed efficiency, reducing waste and enhancing nutrient absorption. This results in better growth and lower feed costs, making it economical for large-scale aquaculture operations. Grower feed, mostly in pelletized form, improves feed utilization and reduces waste due to the advanced feeding skills of the fish. Better feed conversion and lower waste combine with increased efficiency to help trigger growth in the fish feed sector, which is a vital part of the aquafeed market. Technological advancements have led to grower feeds being refined with additives such as probiotics and prebiotics, enhancing performance and ensuring animal health. This has further cemented the importance of this stage in the aquafeed market growth. The dominance of grower feeds in the aquafeed lifecycle stage stems from their increasing ability to meet the nutritional requirements of fish, thus contributing to the sustainability and efficiency of the aquaculture industry.

Asia Pacific: Fastest-Growing Region for Aquafeed.

According to the FAO, in 2022, Asia produced 119.7 million tons of aquaculture, representing 91.4% of the global production. China led with 40%, followed by Indonesia with 10% and India with 7%, showcasing their respective shares in the global aquafeed market size. This significant output underscores Asia's dominance in global aquaculture. This intensive production is directly related to the high demand for seafood, which has resulted from a large, growing population and rising per-capita incomes. According to the National Bureau of Statistics of China in 2023, the country is the largest producer and consumer of seafood globally; it consumes approximately 63.4 million metric tons annually. Producers are compelled to expand and enhance their offerings to meet the nutritional needs of aquaculture farms. Government policies in the region further back this growth. The 14th Five-Year Plan of China focuses on both sustainable aquaculture and technological innovation, thereby improving production efficiency and influencing the aquafeed market size. Similarly, the Indian National Fisheries Policy is targeted at expansion in aquaculture and infrastructure investments, thus stimulating growth in the market.

Asia Pacific Aquafeed Market Trends

Top Aquafeed Companies

The key players in this market include ADM (US), Cargill, Incorporated (US), dsm-firmenich (Switzerland), Nutreco (Netherlands), Alltech (US), Ridley Corporation Limited (Australia), Purina Animal Nutrition LLC (US), Adisseo (France), Aller Aqua Group (Denmark), Avanti feeds Limited (India), The Waterbase Limited (India), JAPFA LTD (Singapore), Charoen Pokphand Foods PCL (Thailand), BioMar Group (Denmark), and Norel Animal Nutrition (Spain).

Want to explore hidden markets that can drive new revenue in Aquafeed Market?

Scope of the Report

Report Metric

Details

Market size estimation

2024–2029 is projected to be a period of significant growth in the global aquafeed market.

Base year considered for the aquafeed market analysis is crucial for understanding historical market size and trends.

2023

Forecast period considered

2024–2029

Units considered

Value (USD Million)

Segments Covered

By Ingredient, Species, Function, Lifecycle, Form and Region

Regions covered

North America, Europe, South America, Asia Pacific, and RoW

Companies studied in the market report include leading firms in the aquafeed sector.

  • ADM (US)
  • Cargill, Incorporated (US)
  • dsm-firmenich (Switzerland)
  • Nutreco (Netherlands)
  • Alltech (US)
  • Ridley Corporation Limited (Australia)
  • Purina Animal Nutrition LLC (US)
  • Adisseo (France)
  • Aller Aqua Group (Denmark)
  • Avanti feeds Limited (India)
  • The Waterbase Limited (India)
  • JAPFA LTD (Singapore)
  • Charoen Pokphand Foods PCL (Thailand)
  • BioMar Group (Denmark)
  • Norel Animal Nutrition (Spain)

Aquafeed Market Segmentation

This research report categorizes the Aquafeed market based on ingredient, form, lifecycle, species, and region.

By Ingredients
  • Soybean
  • Fish Meal
  • Corn
  • Fish Oil
  • Additives
    • Amino Acids
    • Vitamins & Minerals
    • Prebiotics & Probiotics
    • Enzymes
    • Antibiotics
    • Antioxidants
    • Other Additives
  • Other Ingredients
By Form
  • Dry
  • Wet
  • Moist
By Lifecycle
  • Grower Feed
  • Finisher Feed
  • Starter Feed
  • Brooder Feed
  • Solid
By Species
  • Fish
  • Crustaceans
  • Mollusks
  • Other Species
By Function (Qualitative)
  • Nutritional Support
  • Growth Promoters
  • Immunity Support
  • Texture & Palatability
  • Other Functionalities
By Region
  • North America
  • Europe
  • Asia Pacific
  • South America
  • Rest of the World (RoW)

Target Audience

  • Aquafeed Manufacturers
  • Food & Beverage Producers
  • Food Processing Manufacturers
  • Government Agencies (related to food safety and regulations such as FDA, EFSA, and FSSAI)

Aquafeed Market Recent Developments

  • In June 2024, Nutreco launched its innovative "Garden of the Future," marking a significant advancement in phytotechnology and positioning itself as a key market player in the aquafeed industry. This groundbreaking initiative focuses on developing cutting-edge phytotechnology solutions designed to enhance the performance, health, and welfare of aquatic species, as well as farm and companion animals. The "Garden of the Future" represents a forward-thinking approach, leveraging advanced plant-based technologies to improve animal nutrition and overall well-being.
  • In January 2024, the joint venture between ADM and Vitafort opened a new state-of-the-art feed mill in Hungary that is poised to achieve full production capacity, enhancing the aquafeed market outlook. This reflects ADM's steadfast commitment to ushering in a new era of modernization in the region's production infrastructure, addressing the growth rate of the aquafeed market.
  • In July 2023, Charoen Pokphand Foods PCL partnered with the Thai Sustainable Fisheries Roundtable (TSFR) to promote the conservation and protection of the ecosystem and resources in the Gulf of Thailand through the Fishery Action Plan (FAP), a crucial component of the Fishery Improvement Project (FIP). This determination is strengthening the company's commitment to a responsible aquafeed raw material supply chain, which is key to sustaining market player credibility.

Frequently Asked Questions (FAQ):

To speak to our analyst for a discussion on the above findings, click Speak to Analyst

Exclusive indicates content/data unique to MarketsandMarkets and not available with any competitors.

INTRODUCTION
30
RESEARCH METHODOLOGY
36
EXECUTIVE SUMMARY
47
PREMIUM INSIGHTS
53
MARKET OVERVIEW
58
  • 5.1 INTRODUCTION
  • 5.2 MACROECONOMIC OUTLOOK
    GROWING POPULATION AND URBANIZATION
    GLOBAL AQUACULTURE GROWTH AND FEED EFFICIENCY
  • 5.3 DISRUPTIONS IN AQUAFEED MARKET
  • 5.4 MARKET DYNAMICS
    DRIVERS
    - Growth in aquaculture industry
    - Rise in seafood trade to propel demand
    - Increase in consumption of fish
    RESTRAINTS
    - Stringent safety regulations
    - High cost of feed ingredients
    OPPORTUNITIES
    - Growth in support from governments
    - Development of innovative products as source of protein
    CHALLENGES
    - Lack of awareness about modern feeding methods in developing countries
    - Growth in environmental and human health concerns
    - Disease outbreaks and disease prevention measures
  • 5.5 IMPACT OF GEN AI ON ANIMAL NUTRITION
    INTRODUCTION
    USE OF GEN AI IN ANIMAL NUTRITION
    CASE STUDY ANALYSIS
    - Startup integrates advanced computer vision and machine learning technologies to revolutionize fish farming
    - Powered portable feeder
    IMPACT OF GEN AI ON AQUAFEED MARKET
    ADJACENT ECOSYSTEM WORKING ON GEN AI
INDUSTRY TRENDS
72
  • 6.1 INTRODUCTION
  • 6.2 SUPPLY CHAIN ANALYSIS
  • 6.3 VALUE CHAIN ANALYSIS
    RESEARCH AND DEVELOPMENT
    RAW MATERIAL SOURCING
    MANUFACTURING/PRODUCTION
    QUALITY CONTROL & SAFETY
    DISTRIBUTION
    MARKETING AND SALES
    END USER
  • 6.4 TRADE ANALYSIS
    EXPORT SCENARIO OF ANIMAL FEEDING RELATED TO AQUAFEED
    IMPORT SCENARIO OF ANIMAL FEEDING RELATED TO AQUAFEED
  • 6.5 TECHNOLOGY ANALYSIS
    KEY TECHNOLOGIES
    - Precision nutrition
    - Nutrient encapsulation
    COMPLEMENTARY TECHNOLOGIES
    - Water quality monitoring systems
    - Digital aquaculture platforms
    ADJACENT TECHNOLOGY
    - Bioreactor technology
  • 6.6 PRICING ANALYSIS
    AVERAGE SELLING PRICE TREND OF AQUAFEED AMONG KEY PLAYERS, BY AQUAFEED PRODUCTS
    AVERAGE SELLING PRICE TREND, BY INGREDIENT
    AVERAGE SELLING PRICE TREND, BY REGION
  • 6.7 ECOSYSTEM/MARKET MAP
    SUPPLY SIDE
    DEMAND SIDE
  • 6.8 TRENDS/DISRUPTIONS IMPACTING CUSTOMER BUSINESS
  • 6.9 PATENT ANALYSIS
    LIST OF MAJOR PATENTS
  • 6.10 KEY CONFERENCES AND EVENTS, 2024–2025
  • 6.11 TARIFF & REGULATORY LANDSCAPE
    TARIFF RELATED TO AQUAFEED
    REGULATORY BODIES, GOVERNMENT AGENCIES, AND OTHER ORGANIZATIONS
  • 6.12 REGULATORY FRAMEWORK
    INTRODUCTION
    NORTH AMERICA
    - US
    - Canada
    - Mexico
    EUROPE
    ASIA PACIFIC
    - China
    JAPAN
    - India
    - Australia
    SOUTH AMERICA
    - Brazil
  • 6.13 PORTER’S FIVE FORCES ANALYSIS
    INTENSITY OF COMPETITIVE RIVALRY
    BARGAINING POWER OF SUPPLIERS
    BARGAINING POWER OF BUYERS
    THREAT OF SUBSTITUTES
    THREAT OF NEW ENTRANTS
  • 6.14 KEY STAKEHOLDERS AND BUYING CRITERIA
    KEY STAKEHOLDERS IN BUYING PROCESS
    BUYING CRITERIA
  • 6.15 CASE STUDY ANALYSIS
    AVANTI FEEDS LIMITED: REVOLUTIONIZING AQUAFEED INDUSTRY IN INDIA
    PICHIA GUILLIERMONDII IN AQUAFEED BY ADM
  • 6.16 INVESTMENT AND FUNDING SCENARIO
AQUAFEED MARKET, BY INGREDIENT
114
  • 7.1 INTRODUCTION
  • 7.2 SOYBEAN
    APPLICATION OF SOYBEAN FOR ANIMAL FEED TO BOOST MARKET
    SOYBEAN MEAL
    SOY OIL
    SOY LECITHIN
  • 7.3 FISH MEAL
    FISH MEAL TO IMPROVE FEED EFFICIENCY OF FISHES AND PRAWNS AND DRIVE GROWTH
  • 7.4 CORN
    USE OF CORN OIL AS LOW-COST ALTERNATIVE IN AQUACULTURE TO DRIVE GROWTH
    CORN GLUTEN MEAL
    CORN GLUTEN FEED
    CORN OIL
  • 7.5 FISH OIL
    NUTRIENT INFUSED OMEGA-3 FATTY ACIDS TO PROVIDE NUTRIENTS FOR SALMONIDS AND MARINE AND PROPEL GROWTH
  • 7.6 ADDITIVES
    GROWING DEMAND FOR HIGH-PROTEIN DIETS TO DRIVE MARKET
    AMINO ACIDS
    VITAMINS & MINERALS
    PREBIOTICS & PROBIOTICS
    ENZYMES
    ANTIBIOTICS
    ANTIOXIDANTS
    OTHER ADDITIVES
  • 7.7 OTHER INGREDIENTS
AQUAFEED MARKET, BY SPECIES
139
  • 8.1 INTRODUCTION
  • 8.2 FISH
    FISH AS ANIMAL PROTEIN TO DRIVE DEMAND FOR AQUAFEED INGREDIENTS AMONG ALL SPECIES
    TILAPIA
    SALMON
    CARP
    TROUT
    OTHER FISH SPECIES
  • 8.3 CRUSTACEANS
    GROWTH IN SHRIMP PRODUCTION TO BOOST AQUAFEED CONSUMPTION AMONG CRUSTACEANS
    SHRIMPS
    CRABS
    KRILLS
    OTHER CRUSTACEANS
  • 8.4 MOLLUSKS
    OYSTERS AND MUSSELS TO PROPEL GROWTH
    OYSTERS
    MUSSELS
    OTHER MOLLUSKS
  • 8.5 OTHER SPECIES
AQUAFEED MARKET, BY LIFECYCLE
155
  • 9.1 INTRODUCTION
  • 9.2 GROWER FEED
    NUTRIENT BALANCE OF PROTEINS, CARBS, AND FATS FOR FINGERLINGS
    157
  • 9.1 FINISHER FEED
    ENHANCED PROTEIN INTAKE OF AQUATIC SPECIES TO DRIVE DEMAND
  • 9.2 STARTER FEED
    IMPROVED DIGESTION AND NUTRITIONAL INTAKE OF SMALL AQUATIC ANIMALS TO DRIVE DEMAND
  • 9.3 BROODER FEED
    BOTH NATURAL AND ARTIFICIAL FEEDS TO ENSURE BETTER REPRODUCTION IN BROODERS
    AQUAFEED MARKET, BY FORM
AQUAFEED MARKET, BY FORM
162
  • 10.1 INTRODUCTION
  • 10.2 DRY FORM
    FREE-FLOWING STRUCTURE AND CONSISTENCY TO DRIVE GROWTH
  • 10.3 WET FORM
    INCREASED NUTRIENT UPTAKE, FEED CONVERSION EFFICIENCY, AND IMPROVED GROWTH PERFORMANCE TO DRIVE MARKET
  • 10.4 MOIST FORM
    NUTRIENT-DENSE AND EASY-TO-CONSUME MOIST FORM TO DRIVE MARKET IN JUVENILE FISH REARING
AQUAFEED MARKET, BY FUNCTION
168
  • 11.1 INTRODUCTION
  • 11.2 NUTRITIONAL SUPPORT
  • 11.3 GROWTH PROMOTORS
  • 11.4 IMMUNITY SUPPORT
  • 11.5 TEXTURE & PALATABILITY
  • 11.6 OTHER FUNCTIONALITIES
AQUAFEED MARKET, BY REGION
171
  • 12.1 INTRODUCTION
  • 12.2 NORTH AMERICA
    US
    - Increasing aquaculture production and consumption to drive growth
    CANADA
    - Rise in exports to promote aquafeed market
    MEXICO
    - Government initiatives to promote consumption of seafood and drive growth
  • 12.3 EUROPE
    NORWAY
    - Research and development activities related to aquafeed to drive growth
    GREECE
    - Increase in seafood production to boost growth
    UK
    - Rise in seafood consumption coupled with aquaculture trading to propel growth
    RUSSIA
    - Government initiatives to propel market
    SPAIN
    - Seafood trading with other countries along with vast mollusk population to drive demand
    REST OF EUROPE
  • 12.4 ASIA PACIFIC
    CHINA
    - Growth in aquaculture industry to drive market
    VIETNAM
    - Increased production and trading of shrimps and other seafood products to boost market
    THAILAND
    - Rise in demand for exotic seafood products to drive market
    INDONESIA
    - Maintenance of well-being of aquatic animals to drive demand for aquafeed
    INDIA
    - Shift toward intensive aquafarming to propel market growth
    REST OF ASIA PACIFIC
  • 12.5 SOUTH AMERICA
    CHILE
    - Suitable climatic conditions in large fish farms to drive growth
    BRAZIL
    - Favorable government opportunities formulated to drive growth
    REST OF SOUTH AMERICA
  • 12.6 REST OF THE WORLD (ROW)
    AFRICA
    - Limited infrastructure and inadequate market access hindering aquaculture growth
    MIDDLE EAST
    - Rise in demand for value-added processed seafood products to drive growth
COMPETITIVE LANDSCAPE
247
  • 13.1 OVERVIEW
  • 13.2 KEY PLAYER STRATEGIES/RIGHT TO WIN
  • 13.3 REVENUE ANALYSIS, 2021–2023
  • 13.4 MARKET SHARE ANALYSIS, 2023
  • 13.5 COMPANY VALUATION AND FINANCIAL METRICS
    COMPANY VALUATION
    EV/EBITDA
  • 13.6 BRAND/PRODUCT COMPARISON ANALYSIS
    OCIALIS
    EWOS
    ROVIMAX
    GEMMA
    ACTIGEN
  • 13.7 COMPANY EVALUATION MATRIX: KEY PLAYERS, 2023
    STARS
    EMERGING LEADERS
    PERVASIVE PLAYERS
    PARTICIPANTS
    COMPANY FOOTPRINT: KEY PLAYERS, 2023
    - Company footprint
    - Ingredient footprint
    - Form footprint
    - Species footprint
    - Region footprint
  • 13.8 COMPANY EVALUATION MATRIX: STARTUPS/SMES, 2023
    PROGRESSIVE COMPANIES
    RESPONSIVE COMPANIES
    DYNAMIC COMPANIES
    STARTING BLOCKS
    COMPETITIVE BENCHMARKING
    - Detailed list of key startups/SMEs
    - Competitive benchmarking of key startups/SMEs
  • 13.9 COMPETITIVE SCENARIO AND TRENDS
    PRODUCT LAUNCHES
    DEALS
    EXPANSIONS
    OTHER DEVELOPMENTS
COMPANY PROFILES
272
  • 14.1 KEY PLAYERS
    ADM
    - Business overview
    - Products/Solutions/Services offered
    - Recent developments
    - MnM view
    CARGILL, INCORPORATED
    - Business overview
    - Products/Solutions/Services offered
    - Recent developments
    - MnM view
    DSM-FIRMENICH
    - Business overview
    - Products/Solutions/Services offered
    - Recent developments
    - MnM view
    NUTRECO
    - Business overview
    - Products/Solutions/Services offered
    - Recent developments
    - MnM view
    ALLTECH
    - Business overview
    - Products/Solutions/Services offered
    - Recent developments
    - MnM view
    RIDLEY CORPORATION LIMITED
    - Business overview
    - Products/Solutions/Services offered
    - Recent developments
    - MnM view
    PURINA ANIMAL NUTRITION LLC
    - Business overview
    - Products/Solutions/Services offered
    - Recent developments
    - MnM view
    ADISSEO
    - Business overview
    - Products/Solutions/Services offered
    - Recent developments
    - MnM view
    ALLER AQUA GROUP
    - Business overview
    - Products/Solutions/Services offered
    - Recent developments
    - MnM view
    AVANTI FEEDS LIMITED
    - Business overview
    - Products/Solutions/Services offered
    - Recent developments
    - MnM view
    THE WATERBASE LIMITED
    - Business overview
    - Products/Solutions/Services offered
    - Recent developments
    - MnM view
    JAPFA LTD
    - Business overview
    - Products/Solutions/Services offered
    - Recent developments
    - MnM view
    CHAROEN POKPHAND FOODS PCL
    - Business overview
    - Products/Solutions/Services offered
    - Recent developments
    - MnM view
    BIOMAR GROUP
    - Business overview
    - Products/Solutions/Services offered
    - Recent developments
    - MnM view
    NOREL ANIMAL NUTRITION
    - Business overview
    - Products/Solutions/Services offered
    - Recent developments
    - MnM view
    DE HEUS ANIMAL NUTRITION
    - Business overview
    - Products/Solutions/Services offered
    - Recent developments
    - MnM view
    NOVUS INTERNATIONAL, INC.
    - Business overview
    - Products/Solutions/Services offered
    - Recent developments
    - MnM view
    BIOSTADT
    - Business overview
    - Products/Solutions/Services offered
    - Recent developments
    - MnM view
    MARUBENI NISSHIN FEED CO., LTD
    - Business overview
    - Products/Solutions/Services offered
    - Recent developments
    - MnM view
    KENT NUTRITION GROUP
    - Business overview
    - Products/Solutions/Services offered
    - Recent developments
    - MnM view
  • 14.2 OTHER PLAYERS
    MARVESA
    BENEO
    GROWEL
    SONAC
    LIFE CIRCLE NUTRITION
ADJACENT & RELATED MARKET
337
  • 15.1 INTRODUCTION
  • 15.2 STUDY LIMITATIONS
  • 15.3 COMPOUND FEED MARKET
    MARKET DEFINITION
    MARKET OVERVIEW
  • 15.4 FEED ADDITIVES MARKET
    MARKET DEFINITION
    MARKET OVERVIEW
APPENDIX
340
  • 16.1 DISCUSSION GUIDE
  • 16.2 KNOWLEDGESTORE: MARKETSANDMARKETS’ SUBSCRIPTION PORTAL
  • 16.3 CUSTOMIZATION OPTIONS
  • 16.4 RELATED REPORTS
  • 16.5 AUTHOR DETAILS
LIST OF TABLES
 
  • TABLE 1 USD EXCHANGE RATES, 2020–2023
  • TABLE 2 AQUAFEED MARKET SHARE SNAPSHOT, 2024 VS. 2029 (USD BILLION)
  • TABLE 3 GLOBAL: WORLD AQUACULTURE PRODUCTION, 1990–2022 (MILLION TONNES)
  • TABLE 4 TOP 10 EXPORTERS OF HS CODE 230990, 2019–2023 (USD THOUSAND)
  • TABLE 5 TOP 10 EXPORTERS OF HS CODE 230990, 2019–2023 (TONS)
  • TABLE 6 TOP 10 IMPORTERS OF HS CODE 230990, 2019–2023 (USD THOUSAND)
  • TABLE 7 TOP 10 IMPORTERS OF HS CODE 230990, 2019–2023 (TONS)
  • TABLE 8 AVERAGE SELLING PRICE TREND OF AQUAFEED AMONG KEY PLAYERS, BY AQUAFEED PRODUCT, 2023 (USD/TON)
  • TABLE 9 AVERAGE SELLING PRICE, BY INGREDIENT, 2020–2023 (USD/TON)
  • TABLE 10 AVERAGE SELLING PRICE, BY REGION, 2020–2023 (USD/TON)
  • TABLE 11 AQUAFEED MARKET: ECOSYSTEM
  • TABLE 12 LIST OF MAJOR PATENTS PERTAINING TO AQUAFEED MARKET, 2021–2024
  • TABLE 13 AQUAFEED MARKET: KEY DETAILED LIST OF CONFERENCES AND EVENTS, 2024–2025
  • TABLE 14 TARIFF FOR HS CODE: 230990
  • TABLE 15 NORTH AMERICA: LIST OF REGULATORY BODIES, GOVERNMENT AGENCIES, AND OTHER ORGANIZATIONS
  • TABLE 16 EUROPE: LIST OF REGULATORY BODIES, GOVERNMENT AGENCIES, AND OTHER ORGANIZATIONS
  • TABLE 17 ASIA PACIFIC: LIST OF REGULATORY BODIES, GOVERNMENT AGENCIES, AND OTHER ORGANIZATIONS
  • TABLE 18 SOUTH AMERICA: LIST OF REGULATORY BODIES, GOVERNMENT AGENCIES, AND OTHER ORGANIZATIONS
  • TABLE 19 IMPACT OF PORTER’S FIVE FORCES ON AQUAFEED MARKET
  • TABLE 20 INFLUENCE OF STAKEHOLDERS ON BUYING PROCESS FOR SPECIES OF AQUAFEED
  • TABLE 21 KEY BUYING CRITERIA FOR TOP THREE TYPES OF AQUAFEED
  • TABLE 22 AQUAFEED MARKET, BY INGREDIENT, 2020–2023 (USD MILLION)
  • TABLE 23 AQUAFEED MARKET, BY INGREDIENT, 2024–2029 (USD MILLION)
  • TABLE 24 AQUAFEED MARKET, BY INGREDIENT, 2020–2023 (KT)
  • TABLE 25 AQUAFEED MARKET, BY INGREDIENT, 2024–2029 (KT)
  • TABLE 26 SOYBEAN: AQUAFEED MARKET, BY REGION, 2020–2023 (USD MILLION)
  • TABLE 27 SOYBEAN: AQUAFEED MARKET, BY REGION, 2024–2029 (USD MILLION)
  • TABLE 28 SOYBEAN: AQUAFEED MARKET, BY REGION, 2020–2023 (KT)
  • TABLE 29 SOYBEAN: AQUAFEED MARKET, BY REGION, 2024–2029 (KT)
  • TABLE 30 FISH MEAL: AQUAFEED MARKET, BY REGION, 2020–2023 (USD MILLION)
  • TABLE 31 FISH MEAL: AQUAFEED MARKET, BY REGION, 2024–2029 (USD MILLION)
  • TABLE 32 FISH MEAL: AQUAFEED MARKET, BY REGION, 2020–2023 (KT)
  • TABLE 33 FISH MEAL: AQUAFEED MARKET, BY REGION, 2024–2029 (KT)
  • TABLE 34 CORN: AQUAFEED MARKET, BY REGION, 2020–2023 (USD MILLION)
  • TABLE 35 CORN: AQUAFEED MARKET, BY REGION, 2024–2029 (USD MILLION)
  • TABLE 36 CORN: AQUAFEED MARKET, BY REGION, 2020–2023 (KT)
  • TABLE 37 CORN: AQUAFEED MARKET, BY REGION, 2024–2029 (KT)
  • TABLE 38 FISH OIL: AQUAFEED MARKET, BY REGION, 2020–2023 (USD MILLION)
  • TABLE 39 FISH OIL: AQUAFEED MARKET, BY REGION, 2024–2029 (USD MILLION)
  • TABLE 40 FISH OIL: AQUAFEED MARKET, BY REGION, 2020–2023 (KT)
  • TABLE 41 FISH OIL: AQUAFEED MARKET, BY REGION, 2024–2029 (KT)
  • TABLE 42 ADDITIVES: AQUAFEED MARKET, BY REGION, 2020–2023 (USD MILLION)
  • TABLE 43 ADDITIVES: AQUAFEED MARKET, BY REGION, 2024–2029 (USD MILLION)
  • TABLE 44 ADDITIVES: AQUAFEED MARKET, BY REGION, 2020–2023 (KT)
  • TABLE 45 ADDITIVES: AQUAFEED MARKET, BY REGION, 2024–2029 (KT)
  • TABLE 46 ADDITIVES: AQUAFEED MARKET, BY SUB-TYPE, 2020–2023 (USD MILLION)
  • TABLE 47 ADDITIVES: AQUAFEED MARKET, BY SUB-TYPE, 2024–2029 (USD MILLION)
  • TABLE 48 AMINO ACIDS: AQUAFEED MARKET, BY REGION, 2020–2023 (USD MILLION)
  • TABLE 49 AMINO ACIDS: AQUAFEED MARKET, BY REGION, 2024–2029 (USD MILLION)
  • TABLE 50 VITAMINS & MINERALS: AQUAFEED MARKET, BY REGION, 2020–2023 (USD MILLION)
  • TABLE 51 VITAMINS & MINERALS: AQUAFEED MARKET, BY REGION, 2024–2029 (USD MILLION)
  • TABLE 52 PREBIOTICS & PROBIOTICS: AQUAFEED MARKET, BY REGION, 2020–2023 (USD MILLION)
  • TABLE 53 PREBIOTICS & PROBIOTICS: AQUAFEED MARKET, BY REGION, 2024–2029 (USD MILLION)
  • TABLE 54 ENZYMES: AQUAFEED MARKET, BY REGION, 2020–2023 (USD MILLION)
  • TABLE 55 ENZYMES: AQUAFEED MARKET, BY REGION, 2024–2029 (USD MILLION)
  • TABLE 56 ANTIBIOTICS: AQUAFEED MARKET, BY REGION, 2020–2023 (USD MILLION)
  • TABLE 57 ANTIBIOTICS: AQUAFEED MARKET, BY REGION, 2024–2029 (USD MILLION)
  • TABLE 58 ANTIOXIDANTS: AQUAFEED MARKET, BY REGION, 2020–2023 (USD MILLION)
  • TABLE 59 ANTIOXIDANTS: AQUAFEED MARKET, BY REGION, 2024–2029 (USD MILLION)
  • TABLE 60 OTHER ADDITIVES: AQUAFEED MARKET, BY REGION, 2020–2023 (USD MILLION)
  • TABLE 61 OTHER ADDITIVES: AQUAFEED MARKET, BY REGION, 2024–2029 (USD MILLION)
  • TABLE 62 OTHER INGREDIENTS: AQUAFEED MARKET, BY REGION, 2020–2023 (USD MILLION)
  • TABLE 63 OTHER INGREDIENTS: AQUAFEED MARKET, BY REGION, 2024–2029 (USD MILLION)
  • TABLE 64 OTHER INGREDIENTS: AQUAFEED MARKET, BY REGION, 2020–2023 (KT)
  • TABLE 65 OTHER INGREDIENTS: AQUAFEED MARKET, BY REGION, 2024–2029 (KT)
  • TABLE 66 AQUAFEED MARKET, BY SPECIES, 2020–2023 (USD MILLION)
  • TABLE 67 AQUAFEED MARKET, BY SPECIES, 2024–2029 (USD MILLION)
  • TABLE 68 AQUAFEED MARKET, BY SPECIES, 2020–2023 (KT)
  • TABLE 69 AQUAFEED MARKET, BY SPECIES, 2024–2029 (KT)
  • TABLE 70 FISH: AQUAFEED MARKET, BY REGION, 2020–2023 (USD MILLION)
  • TABLE 71 FISH: AQUAFEED MARKET, BY REGION, 2024–2029 (USD MILLION)
  • TABLE 72 FISH: AQUAFEED MARKET, BY REGION, 2020–2023 (KT)
  • TABLE 73 FISH: AQUAFEED MARKET, BY REGION, 2024–2029 (KT)
  • TABLE 74 FISH: AQUAFEED MARKET, BY SUB-TYPE, 2020–2023 (USD MILLION)
  • TABLE 75 FISH: AQUAFEED MARKET, SUB-TYPE, 2024–2029 (USD MILLION)
  • TABLE 76 CRUSTACEANS: AQUAFEED MARKET, BY REGION, 2020–2023 (USD MILLION)
  • TABLE 77 CRUSTACEANS: AQUAFEED MARKET, BY REGION, 2024–2029 (USD MILLION)
  • TABLE 78 CRUSTACEANS: AQUAFEED MARKET, BY REGION, 2020–2023 (KT)
  • TABLE 79 CRUSTACEANS: AQUAFEED MARKET, BY REGION, 2024–2029 (KT)
  • TABLE 80 CRUSTACEANS: AQUAFEED MARKET, BY SUB-TYPE, 2020–2023 (USD MILLION)
  • TABLE 81 CRUSTACEANS: AQUAFEED MARKET, BY SUB-TYPE, 2024–2029 (USD MILLION)
  • TABLE 82 MOLLUSKS: AQUAFEED MARKET, BY REGION, 2020–2023 (USD MILLION)
  • TABLE 83 MOLLUSKS: AQUAFEED MARKET, BY REGION, 2024–2029 (USD MILLION)
  • TABLE 84 MOLLUSKS: AQUAFEED MARKET, BY REGION, 2020–2023 (KT)
  • TABLE 85 MOLLUSKS: AQUAFEED MARKET, BY REGION, 2024–2029 (KT)
  • TABLE 86 MOLLUSKS: AQUAFEED MARKET, BY SUB-TYPE, 2020–2023 (USD MILLION)
  • TABLE 87 MOLLUSKS: AQUAFEED MARKET, BY SUB-TYPE, 2024–2029 (USD MILLION)
  • TABLE 88 OTHER SPECIES: AQUAFEED MARKET, BY REGION, 2020–2023 (USD MILLION)
  • TABLE 89 OTHER SPECIES: AQUAFEED MARKET, BY REGION, 2024–2029 (USD MILLION)
  • TABLE 90 OTHER SPECIES: AQUAFEED MARKET, BY REGION, 2020–2023 (KT)
  • TABLE 91 OTHER SPECIES: AQUAFEED MARKET, BY REGION, 2024–2029 (KT)
  • TABLE 92 AQUAFEED MARKET, BY LIFECYCLE, 2020–2023 (USD MILLION)
  • TABLE 93 AQUAFEED MARKET, BY LIFECYCLE, 2024–2029 (USD MILLION)
  • TABLE 94 GROWER FEED: AQUAFEED MARKET, BY REGION, 2020–2023 (USD MILLION)
  • TABLE 95 GROWER FEED: AQUAFEED MARKET, BY REGION, 2024–2029 (USD MILLION)
  • TABLE 96 FINISHER FEED: AQUAFEED MARKET, BY REGION, 2020–2023 (USD MILLION)
  • TABLE 97 FINISHER FEED: AQUAFEED MARKET, BY REGION, 2024–2029 (USD MILLION)
  • TABLE 98 STARTER FEED: AQUAFEED MARKET, BY REGION, 2020–2023 (USD MILLION)
  • TABLE 99 STARTER FEED: AQUAFEED MARKET, BY REGION, 2024–2029 (USD MILLION)
  • TABLE 100 BROODER FEED: AQUAFEED MARKET, BY REGION, 2020–2023 (USD MILLION)
  • TABLE 101 BROODER FEED: AQUAFEED MARKET, BY REGION, 2024–2029 (USD MILLION)
  • TABLE 102 AQUAFEED MARKET, BY FORM, 2020–2023 (USD MILLION)
  • TABLE 103 AQUAFEED MARKET, BY FORM, 2024–2029 (USD MILLION)
  • TABLE 104 DRY FORM: AQUAFEED MARKET, BY REGION, 2020–2023 (USD MILLION)
  • TABLE 105 DRY FORM: AQUAFEED MARKET, BY REGION, 2024–2029 (USD MILLION)
  • TABLE 106 WET FORM: AQUAFEED MARKET, BY REGION, 2020–2023 (USD MILLION)
  • TABLE 107 WET FORM: AQUAFEED MARKET, BY REGION, 2024–2029 (USD MILLION)
  • TABLE 108 MOIST FORM: AQUAFEED MARKET, BY REGION, 2020–2023 (USD MILLION)
  • TABLE 109 MOIST FORM: AQUAFEED MARKET, BY REGION, 2024–2029 (USD MILLION)
  • TABLE 110 AQUAFEED MARKET, BY REGION, 2020–2023 (USD MILLION)
  • TABLE 111 AQUAFEED MARKET, BY REGION, 2024–2029 (USD MILLION)
  • TABLE 112 AQUAFEED MARKET, BY REGION, 2020–2023 (KT)
  • TABLE 113 AQUAFEED MARKET, BY REGION, 2024–2029 (KT)
  • TABLE 114 NORTH AMERICA: AQUAFEED MARKET, BY COUNTRY, 2020–2023 (USD MILLION)
  • TABLE 115 NORTH AMERICA: AQUAFEED MARKET, BY COUNTRY, 2024–2029 (USD MILLION)
  • TABLE 116 NORTH AMERICA: AQUAFEED MARKET, BY COUNTRY, 2020–2023 (KT)
  • TABLE 117 NORTH AMERICA: AQUAFEED MARKET, BY COUNTRY, 2024–2029 (KT)
  • TABLE 118 NORTH AMERICA: AQUAFEED MARKET, BY INGREDIENT, 2020–2023 (USD MILLION)
  • TABLE 119 NORTH AMERICA: AQUAFEED MARKET, BY INGREDIENT, 2024–2029 (USD MILLION)
  • TABLE 120 NORTH AMERICA: AQUAFEED MARKET, BY INGREDIENT, 2020–2023 (KT)
  • TABLE 121 NORTH AMERICA: AQUAFEED MARKET, BY INGREDIENT, 2024–2029 (KT)
  • TABLE 122 NORTH AMERICA: AQUAFEED MARKET, BY ADDITIVE, 2020–2023 (USD MILLION)
  • TABLE 123 NORTH AMERICA: AQUAFEED MARKET, BY ADDITIVE, 2024–2029 (USD MILLION)
  • TABLE 124 NORTH AMERICA: AQUAFEED MARKET, BY SPECIES, 2020–2023 (USD MILLION)
  • TABLE 125 NORTH AMERICA: AQUAFEED MARKET, BY SPECIES, 2024–2029 (USD MILLION)
  • TABLE 126 NORTH AMERICA: AQUAFEED MARKET, BY SPECIES, 2020–2023 (KT)
  • TABLE 127 NORTH AMERICA: AQUAFEED MARKET, BY SPECIES, 2024–2029 (KT)
  • TABLE 128 NORTH AMERICA: AQUAFEED MARKET, BY FORM, 2020–2023 (USD MILLION)
  • TABLE 129 NORTH AMERICA: AQUAFEED MARKET, BY FORM, 2024–2029 (USD MILLION)
  • TABLE 130 NORTH AMERICA: AQUAFEED MARKET, BY LIFECYCLE, 2020–2023 (USD MILLION)
  • TABLE 131 NORTH AMERICA: AQUAFEED MARKET, BY LIFECYCLE, 2024–2029 (USD MILLION)
  • TABLE 132 US: AQUAFEED MARKET, BY INGREDIENT, 2020–2023 (USD MILLION)
  • TABLE 133 US: AQUAFEED MARKET, BY INGREDIENT, 2024–2029 (USD MILLION)
  • TABLE 134 US: AQUAFEED MARKET, BY INGREDIENT, 2020–2023 (KT)
  • TABLE 135 US: AQUAFEED MARKET, BY INGREDIENT, 2024–2029 (KT)
  • TABLE 136 CANADA: AQUAFEED MARKET, BY INGREDIENT, 2020–2023 (USD MILLION)
  • TABLE 137 CANADA: AQUAFEED MARKET, BY INGREDIENT, 2024–2029 (USD MILLION)
  • TABLE 138 CANADA: AQUAFEED MARKET, BY INGREDIENT, 2020–2023 (KT)
  • TABLE 139 CANADA: AQUAFEED MARKET, BY INGREDIENT, 2024–2029 (KT)
  • TABLE 140 MEXICO: AQUAFEED MARKET, BY INGREDIENT, 2020–2023 (USD MILLION)
  • TABLE 141 MEXICO: AQUAFEED MARKET, BY INGREDIENT, 2024–2029 (USD MILLION)
  • TABLE 142 MEXICO: AQUAFEED MARKET, BY INGREDIENT, 2020–2023 (KT)
  • TABLE 143 MEXICO: AQUAFEED MARKET, BY INGREDIENT, 2024–2029 (KT)
  • TABLE 144 EUROPE: AQUAFEED MARKET, BY COUNTRY, 2020–2023 (USD MILLION)
  • TABLE 145 EUROPE: AQUAFEED MARKET, BY COUNTRY, 2024–2029 (USD MILLION)
  • TABLE 146 EUROPE: AQUAFEED MARKET, BY COUNTRY, 2020–2023 (KT)
  • TABLE 147 EUROPE: AQUAFEED MARKET, BY COUNTRY, 2024–2029 (KT)
  • TABLE 148 EUROPE: AQUAFEED MARKET, BY INGREDIENT, 2020–2023 (USD MILLION)
  • TABLE 149 EUROPE: AQUAFEED MARKET, BY INGREDIENT, 2024–2029 (USD MILLION)
  • TABLE 150 EUROPE: AQUAFEED MARKET, BY INGREDIENT, 2020–2023 (KT)
  • TABLE 151 EUROPE: AQUAFEED MARKET, BY INGREDIENT, 2024–2029 (KT)
  • TABLE 152 EUROPE: AQUAFEED MARKET, BY ADDITIVE, 2020–2023 (USD MILLION)
  • TABLE 153 EUROPE: AQUAFEED MARKET, BY ADDITIVE, 2024–2029 (USD MILLION)
  • TABLE 154 EUROPE: AQUAFEED MARKET, BY SPECIES, 2020–2023 (USD MILLION)
  • TABLE 155 EUROPE: AQUAFEED MARKET, BY SPECIES, 2024–2029 (USD MILLION)
  • TABLE 156 EUROPE: AQUAFEED MARKET, BY SPECIES, 2020–2023 (KT)
  • TABLE 157 EUROPE: AQUAFEED MARKET, BY SPECIES, 2024–2029 (KT)
  • TABLE 158 EUROPE: AQUAFEED MARKET, BY FORM, 2020–2023 (USD MILLION)
  • TABLE 159 EUROPE: AQUAFEED MARKET, BY FORM, 2024–2029 (USD MILLION)
  • TABLE 160 EUROPE: AQUAFEED MARKET, BY LIFECYCLE, 2020–2023 (USD MILLION)
  • TABLE 161 EUROPE: AQUAFEED MARKET, BY LIFECYCLE, 2024–2029 (USD MILLION)
  • TABLE 162 NORWAY: AQUAFEED MARKET, BY INGREDIENT, 2020–2023 (USD MILLION)
  • TABLE 163 NORWAY: AQUAFEED MARKET, BY INGREDIENT, 2024–2029 (USD MILLION)
  • TABLE 164 NORWAY: AQUAFEED MARKET, BY INGREDIENT, 2020–2023 (KT)
  • TABLE 165 NORWAY: AQUAFEED MARKET, BY INGREDIENT, 2024–2029 (KT)
  • TABLE 166 GREECE: AQUAFEED MARKET, BY INGREDIENT, 2020–2023 (USD MILLION)
  • TABLE 167 GREECE: AQUAFEED MARKET, BY INGREDIENT, 2024–2029 (USD MILLION)
  • TABLE 168 GREECE: AQUAFEED MARKET, BY INGREDIENT, 2020–2023 (KT)
  • TABLE 169 GREECE: AQUAFEED MARKET, BY INGREDIENT, 2024–2029 (KT)
  • TABLE 170 UK: AQUAFEED MARKET, BY INGREDIENT, 2020–2023 (USD MILLION)
  • TABLE 171 UK: AQUAFEED MARKET, BY INGREDIENT, 2024–2029 (USD MILLION)
  • TABLE 172 UK: AQUAFEED MARKET, BY INGREDIENT, 2020–2023 (KT)
  • TABLE 173 UK: AQUAFEED MARKET, BY INGREDIENT, 2024–2029 (KT)
  • TABLE 174 RUSSIA: AQUAFEED MARKET, BY INGREDIENT, 2020–2023 (USD MILLION)
  • TABLE 175 RUSSIA: AQUAFEED MARKET, BY INGREDIENT, 2024–2029 (USD MILLION)
  • TABLE 176 RUSSIA: AQUAFEED MARKET, BY INGREDIENT, 2020–2023 (KT)
  • TABLE 177 RUSSIA: AQUAFEED MARKET, BY INGREDIENT, 2024–2029 (KT)
  • TABLE 178 SPAIN: AQUAFEED MARKET, BY INGREDIENT, 2020–2023 (USD MILLION)
  • TABLE 179 SPAIN: AQUAFEED MARKET, BY INGREDIENT, 2024–2029 (USD MILLION)
  • TABLE 180 SPAIN: AQUAFEED MARKET, BY INGREDIENT, 2020–2023 (KT)
  • TABLE 181 SPAIN: AQUAFEED MARKET, BY INGREDIENT, 2024–2029 (KT)
  • TABLE 182 REST OF EUROPE: AQUAFEED MARKET, BY INGREDIENT, 2020–2023 (USD MILLION)
  • TABLE 183 REST OF EUROPE: AQUAFEED MARKET, BY INGREDIENT, 2024–2029 (USD MILLION)
  • TABLE 184 REST OF EUROPE: AQUAFEED MARKET, BY INGREDIENT, 2020–2023 (KT)
  • TABLE 185 REST OF EUROPE: AQUAFEED MARKET, BY INGREDIENT, 2024–2029 (KT)
  • TABLE 186 ASIA PACIFIC: AQUAFEED MARKET, BY COUNTRY, 2020–2023 (USD MILLION)
  • TABLE 187 ASIA PACIFIC: AQUAFEED MARKET, BY COUNTRY, 2024–2029 (USD MILLION)
  • TABLE 188 ASIA PACIFIC: AQUAFEED MARKET, BY COUNTRY, 2020–2023 (KT)
  • TABLE 189 ASIA PACIFIC: AQUAFEED MARKET, BY COUNTRY, 2024–2029 (KT)
  • TABLE 190 ASIA PACIFIC: AQUAFEED MARKET, BY INGREDIENT, 2020–2023 (USD MILLION)
  • TABLE 191 ASIA PACIFIC: AQUAFEED MARKET, BY INGREDIENT, 2024–2029 (USD MILLION)
  • TABLE 192 ASIA PACIFIC: AQUAFEED MARKET, BY INGREDIENT, 2020–2023 (KT)
  • TABLE 193 ASIA PACIFIC: AQUAFEED MARKET, BY INGREDIENT, 2024–2029 (KT)
  • TABLE 194 ASIA PACIFIC: AQUAFEED MARKET, BY ADDITIVE, 2020–2023 (USD MILLION)
  • TABLE 195 ASIA PACIFIC: AQUAFEED MARKET, BY ADDITIVE, 2024–2029 (USD MILLION)
  • TABLE 196 ASIA PACIFIC: AQUAFEED MARKET, BY SPECIES, 2020–2023 (USD MILLION)
  • TABLE 197 ASIA PACIFIC: AQUAFEED MARKET, BY SPECIES, 2024–2029 (USD MILLION)
  • TABLE 198 ASIA PACIFIC: AQUAFEED MARKET, BY SPECIES, 2020–2023 (KT)
  • TABLE 199 ASIA PACIFIC: AQUAFEED MARKET, BY SPECIES, 2024–2029 (KT)
  • TABLE 200 ASIA PACIFIC: AQUAFEED MARKET, BY FORM, 2020–2023 (USD MILLION)
  • TABLE 201 ASIA PACIFIC: AQUAFEED MARKET, BY FORM, 2024–2029 (USD MILLION)
  • TABLE 202 ASIA PACIFIC: AQUAFEED MARKET, BY LIFECYCLE, 2020–2023 (USD MILLION)
  • TABLE 203 ASIA PACIFIC: AQUAFEED MARKET, BY LIFECYCLE, 2024–2029 (USD MILLION)
  • TABLE 204 CHINA: AQUAFEED MARKET, BY INGREDIENT, 2020–2023 (USD MILLION)
  • TABLE 205 CHINA: AQUAFEED MARKET, BY INGREDIENT, 2024–2029 (USD MILLION)
  • TABLE 206 CHINA: AQUAFEED MARKET, BY INGREDIENT, 2020–2023 (KT)
  • TABLE 207 CHINA: AQUAFEED MARKET, BY INGREDIENT, 2024–2029 (KT)
  • TABLE 208 VIETNAM: AQUAFEED MARKET, BY INGREDIENT, 2020–2023 (USD MILLION)
  • TABLE 209 VIETNAM: AQUAFEED MARKET, BY INGREDIENT, 2024–2029 (USD MILLION)
  • TABLE 210 VIETNAM: AQUAFEED MARKET, BY INGREDIENT, 2020–2023 (KT)
  • TABLE 211 VIETNAM: AQUAFEED MARKET, BY INGREDIENT, 2024–2029 (KT)
  • TABLE 212 THAILAND: AQUAFEED MARKET, BY INGREDIENT, 2020–2023 (USD MILLION)
  • TABLE 213 THAILAND: AQUAFEED MARKET, BY INGREDIENT, 2024–2029 (USD MILLION)
  • TABLE 214 THAILAND: AQUAFEED MARKET, BY INGREDIENT, 2020–2023 (KT)
  • TABLE 215 THAILAND: AQUAFEED MARKET, BY INGREDIENT, 2024–2029 (KT)
  • TABLE 216 INDONESIA: AQUAFEED MARKET, BY INGREDIENT, 2020–2023 (USD MILLION)
  • TABLE 217 INDONESIA: AQUAFEED MARKET, BY INGREDIENT, 2024–2029 (USD MILLION)
  • TABLE 218 INDONESIA: AQUAFEED MARKET, BY INGREDIENT, 2020–2023 (KT)
  • TABLE 219 INDONESIA: AQUAFEED MARKET, BY INGREDIENT, 2024–2029 (KT)
  • TABLE 220 INDIA: AQUAFEED MARKET, BY INGREDIENT, 2020–2023 (USD MILLION)
  • TABLE 221 INDIA: AQUAFEED MARKET, BY INGREDIENT, 2024–2029 (USD MILLION)
  • TABLE 222 INDIA: AQUAFEED MARKET, BY INGREDIENT, 2020–2023 (KT)
  • TABLE 223 INDIA: AQUAFEED MARKET, BY INGREDIENT, 2024–2029 (KT)
  • TABLE 224 REST OF ASIA PACIFIC: AQUAFEED MARKET, BY INGREDIENT, 2020–2023 (USD MILLION)
  • TABLE 225 REST OF ASIA PACIFIC: AQUAFEED MARKET, BY INGREDIENT, 2024–2029 (USD MILLION)
  • TABLE 226 REST OF ASIA PACIFIC: AQUAFEED MARKET, BY INGREDIENT, 2020–2023 (KT)
  • TABLE 227 REST OF ASIA PACIFIC: AQUAFEED MARKET, BY INGREDIENT, 2024–2029 (KT)
  • TABLE 228 SOUTH AMERICA: AQUAFEED MARKET, BY COUNTRY, 2020–2023 (USD MILLION)
  • TABLE 229 SOUTH AMERICA: AQUAFEED MARKET, BY COUNTRY, 2024–2029 (USD MILLION)
  • TABLE 230 SOUTH AMERICA: AQUAFEED MARKET, BY COUNTRY, 2020–2023 (KT)
  • TABLE 231 SOUTH AMERICA: AQUAFEED MARKET, BY COUNTRY, 2024–2029 (KT)
  • TABLE 232 SOUTH AMERICA: AQUAFEED MARKET, BY INGREDIENT, 2020–2023 (USD MILLION)
  • TABLE 233 SOUTH AMERICA: AQUAFEED MARKET, BY INGREDIENT, 2024–2029 (USD MILLION)
  • TABLE 234 SOUTH AMERICA: AQUAFEED MARKET, BY INGREDIENT, 2020–2023 (KT)
  • TABLE 235 SOUTH AMERICA: AQUAFEED MARKET, BY INGREDIENT, 2024–2029 (KT)
  • TABLE 236 SOUTH AMERICA: AQUAFEED MARKET, BY ADDITIVE, 2020–2023 (USD MILLION)
  • TABLE 237 SOUTH AMERICA: AQUAFEED MARKET, BY ADDITIVE, 2024–2029 (USD MILLION)
  • TABLE 238 SOUTH AMERICA: AQUAFEED MARKET, BY SPECIES, 2020–2023 (USD MILLION)
  • TABLE 239 SOUTH AMERICA: AQUAFEED MARKET, BY SPECIES, 2024–2029 (USD MILLION)
  • TABLE 240 SOUTH AMERICA: AQUAFEED MARKET, BY SPECIES, 2020–2023 (KT)
  • TABLE 241 SOUTH AMERICA: AQUAFEED MARKET, BY SPECIES, 2024–2029 (KT)
  • TABLE 242 SOUTH AMERICA: AQUAFEED MARKET, BY FORM, 2020–2023 (USD MILLION)
  • TABLE 243 SOUTH AMERICA: AQUAFEED MARKET, BY FORM, 2024–2029 (USD MILLION)
  • TABLE 244 SOUTH AMERICA: AQUAFEED MARKET, BY LIFECYCLE, 2020–2023 (USD MILLION)
  • TABLE 245 SOUTH AMERICA: AQUAFEED MARKET, BY LIFECYCLE, 2024–2029 (USD MILLION)
  • TABLE 246 CHILE: AQUAFEED MARKET, BY INGREDIENT, 2020–2023 (USD MILLION)
  • TABLE 247 CHILE: AQUAFEED MARKET, BY INGREDIENT, 2024–2029 (USD MILLION)
  • TABLE 248 CHILE: AQUAFEED MARKET, BY INGREDIENT, 2020–2023 (KT)
  • TABLE 249 CHILE: AQUAFEED MARKET, BY INGREDIENT, 2024–2029 (KT)
  • TABLE 250 BRAZIL: AQUAFEED MARKET, BY INGREDIENT, 2020–2023 (USD MILLION)
  • TABLE 251 BRAZIL: AQUAFEED MARKET, BY INGREDIENT, 2024–2029 (USD MILLION)
  • TABLE 252 BRAZIL: AQUAFEED MARKET, BY INGREDIENT, 2020–2023 (KT)
  • TABLE 253 BRAZIL: AQUAFEED MARKET, BY INGREDIENT, 2024–2029 (KT)
  • TABLE 254 REST OF SOUTH AMERICA: AQUAFEED MARKET, BY INGREDIENT, 2020–2023 (USD MILLION)
  • TABLE 255 REST OF SOUTH AMERICA: AQUAFEED MARKET, BY INGREDIENT, 2024–2029 (USD MILLION)
  • TABLE 256 REST OF SOUTH AMERICA: AQUAFEED MARKET, BY INGREDIENT, 2020–2023 (KT)
  • TABLE 257 REST OF SOUTH AMERICA: AQUAFEED MARKET, BY INGREDIENT, 2024–2029 (KT)
  • TABLE 258 REST OF THE WORLD: AQUAFEED MARKET, BY REGION, 2020–2023 (USD MILLION)
  • TABLE 259 REST OF THE WORLD: AQUAFEED MARKET, BY REGION, 2024–2029 (USD MILLION)
  • TABLE 260 REST OF THE WORLD: AQUAFEED MARKET, BY REGION, 2020–2023 (KT)
  • TABLE 261 REST OF THE WORLD: AQUAFEED MARKET, BY REGION, 2024–2029 (KT)
  • TABLE 262 REST OF THE WORLD: AQUAFEED MARKET, BY INGREDIENT, 2020–2023 (USD MILLION)
  • TABLE 263 REST OF THE WORLD: AQUAFEED MARKET, BY INGREDIENT, 2024–2029 (USD MILLION)
  • TABLE 264 REST OF THE WORLD: AQUAFEED MARKET, BY INGREDIENT, 2020–2023 (KT)
  • TABLE 265 REST OF THE WORLD: AQUAFEED MARKET, BY INGREDIENT, 2024–2029 (KT)
  • TABLE 266 REST OF THE WORLD: AQUAFEED MARKET, BY ADDITIVE, 2020–2023 (USD MILLION)
  • TABLE 267 REST OF THE WORLD: AQUAFEED MARKET, BY ADDITIVE, 2024–2029 (USD MILLION)
  • TABLE 268 REST OF THE WORLD: AQUAFEED MARKET, BY SPECIES, 2020–2023 (USD MILLION)
  • TABLE 269 REST OF THE WORLD: AQUAFEED MARKET, BY SPECIES, 2024–2029 (USD MILLION)
  • TABLE 270 REST OF THE WORLD: AQUAFEED MARKET, BY SPECIES, 2020–2023 (KT)
  • TABLE 271 REST OF THE WORLD: AQUAFEED MARKET, BY SPECIES, 2024–2029 (KT)
  • TABLE 272 REST OF THE WORLD: AQUAFEED MARKET, BY FORM, 2020–2023 (USD MILLION)
  • TABLE 273 REST OF THE WORLD: AQUAFEED MARKET, BY FORM, 2024–2029 (USD MILLION)
  • TABLE 274 REST OF THE WORLD: AQUAFEED MARKET, BY LIFECYCLE, 2020–2023 (USD MILLION)
  • TABLE 275 REST OF THE WORLD: AQUAFEED MARKET, BY LIFECYCLE, 2024–2029 (USD MILLION)
  • TABLE 276 AFRICA: AQUAFEED MARKET, BY INGREDIENT, 2020–2023 (USD MILLION)
  • TABLE 277 AFRICA: AQUAFEED MARKET, BY INGREDIENT, 2024–2029 (USD MILLION)
  • TABLE 278 AFRICA: AQUAFEED MARKET, BY INGREDIENT, 2020–2023 (KT)
  • TABLE 279 AFRICA: AQUAFEED MARKET, BY INGREDIENT, 2024–2029 (KT)
  • TABLE 280 MIDDLE EAST: AQUAFEED MARKET, BY INGREDIENT, 2020–2023 (USD MILLION)
  • TABLE 281 MIDDLE EAST: AQUAFEED MARKET, BY INGREDIENT, 2024–2029 (USD MILLION)
  • TABLE 282 MIDDLE EAST: AQUAFEED MARKET, BY INGREDIENT, 2020–2023 (KT)
  • TABLE 283 MIDDLE EAST: AQUAFEED MARKET, BY INGREDIENT, 2024–2029 (KT)
  • TABLE 284 OVERVIEW OF STRATEGIES ADOPTED BY KEY AQUAFEED VENDORS
  • TABLE 285 AQUAFEED MARKET: DEGREE OF COMPETITION
  • TABLE 286 AQUAFEED MARKET: INGREDIENT FOOTPRINT
  • TABLE 287 AQUAFEED MARKET: FORM FOOTPRINT
  • TABLE 288 AQUAFEED MARKET: SPECIES FOOTPRINT
  • TABLE 289 AQUAFEED MARKET: REGION FOOTPRINT
  • TABLE 290 AQUAFEED MARKET: DETAILED LIST OF KEY STARTUPS/SMES, 2023
  • TABLE 291 AQUAFEED MARKET: COMPETITIVE BENCHMARKING OF KEY STARTUPS/SMES
  • TABLE 292 AQUAFEED MARKET: PRODUCT LAUNCHES, DECEMBER 2021–JUNE 2024
  • TABLE 293 AQUAFEED MARKET: DEALS, JANUARY 2020–AUGUST 2024
  • TABLE 294 AQUAFEED MARKET: EXPANSIONS, JULY 2020–JULY 2024
  • TABLE 295 AQUAFEED MARKET: OTHER DEVELOPMENTS, FEBRUARY 2023–JUNE 2024
  • TABLE 296 ADM: COMPANY OVERVIEW
  • TABLE 297 ADM: PRODUCTS/SOLUTIONS/SERVICES OFFERED
  • TABLE 298 ADM: DEALS
  • TABLE 299 ADM: EXPANSIONS
  • TABLE 300 CARGILL, INCORPORATED: COMPANY OVERVIEW
  • TABLE 301 CARGILL, INCORPORATED: PRODUCTS/SOLUTIONS/SERVICES OFFERED
  • TABLE 302 CARGILL, INCORPORATED: DEALS
  • TABLE 303 CARGILL, INCORPORATED: EXPANSIONS
  • TABLE 304 DSM-FIRMENICH: COMPANY OVERVIEW
  • TABLE 305 DSM-FIRMENICH: PRODUCTS/SOLUTIONS/SERVICES OFFERED
  • TABLE 306 DSM-FIRMENICH: DEALS
  • TABLE 307 NUTRECO: COMPANY OVERVIEW
  • TABLE 308 NUTRECO: PRODUCTS/SOLUTIONS/SERVICES OFFERED
  • TABLE 309 NUTRECO: DEALS
  • TABLE 310 NUTRECO: EXPANSIONS
  • TABLE 311 NUTRECO: OTHER DEVELOPMENTS
  • TABLE 312 ALLTECH: COMPANY OVERVIEW
  • TABLE 313 ALLTECH: PRODUCTS/SOLUTIONS/SERVICES OFFERED
  • TABLE 314 ALLTECH: DEALS
  • TABLE 315 RIDLEY CORPORATION LIMITED: COMPANY OVERVIEW
  • TABLE 316 RIDLEY CORPORATION LIMITED: PRODUCTS/SOLUTIONS/SERVICES OFFERED
  • TABLE 317 RIDLEY CORPORATION LIMITED: DEALS
  • TABLE 318 PURINA ANIMAL NUTRITION LLC: COMPANY OVERVIEW
  • TABLE 319 PURINA ANIMAL NUTRITION LLC: PRODUCTS/SOLUTIONS/SERVICES OFFERED
  • TABLE 320 ADISSEO: COMPANY OVERVIEW
  • TABLE 321 ADISSEO: PRODUCTS/SOLUTIONS/SERVICES OFFERED
  • TABLE 322 ADISSEO: DEALS
  • TABLE 323 ADISSEO: OTHER DEALS/DEVELOPMENTS
  • TABLE 324 ALLER AQUA GROUP: COMPANY OVERVIEW
  • TABLE 325 ALLER AQUA GROUP: PRODUCTS/SOLUTIONS/SERVICES OFFERED
  • TABLE 326 ALLER AQUA GROUP: PRODUCT LAUNCHES
  • TABLE 327 ALLER AQUA GROUP: DEALS
  • TABLE 328 AVANTI FEEDS LIMITED: COMPANY OVERVIEW
  • TABLE 329 AVANTI FEEDS LIMITED: PRODUCTS/SOLUTIONS/SERVICES OFFERED
  • TABLE 330 AVANTI FEEDS LIMITED: EXPANSIONS
  • TABLE 331 THE WATERBASE LIMITED: COMPANY OVERVIEW
  • TABLE 332 THE WATERBASE LIMITED: PRODUCTS/SOLUTIONS/SERVICES OFFERED
  • TABLE 333 JAPFA LTD: COMPANY OVERVIEW
  • TABLE 334 JAPFA LTD: PRODUCTS/SOLUTIONS/SERVICES OFFERED
  • TABLE 335 CHAROEN POKPHAND FOODS PCL: COMPANY OVERVIEW
  • TABLE 336 CHAROEN POKPHAND FOODS PCL: PRODUCTS/SOLUTIONS/SERVICES OFFERED
  • TABLE 337 CHAROEN POKPHAND FOODS PCL: PRODUCT LAUNCHES
  • TABLE 338 CHAROEN POKPHAND FOODS PCL: DEALS
  • TABLE 339 CHAROEN POKPHAND FOODS PCL: EXPANSIONS
  • TABLE 340 BIOMAR GROUP: COMPANY OVERVIEW
  • TABLE 341 BIOMAR GROUP: PRODUCTS/SOLUTIONS/SERVICES OFFERED
  • TABLE 342 BIOMAR GROUP: PRODUCT LAUNCHES
  • TABLE 343 BIOMAR GROUP: DEALS
  • TABLE 344 BIOMAR GROUP: EXPANSIONS
  • TABLE 345 NOREL ANIMAL NUTRITION: COMPANY OVERVIEW
  • TABLE 346 NOREL ANIMAL NUTRITION: PRODUCTS/SOLUTIONS/SERVICES OFFERED
  • TABLE 347 DE HEUS ANIMAL NUTRITION: COMPANY OVERVIEW
  • TABLE 348 DE HEUS ANIMAL NUTRITION: PRODUCTS/SOLUTIONS/SERVICES OFFERED
  • TABLE 349 DE HEUS ANIMAL NUTRITION: DEALS
  • TABLE 350 DE HEUS ANIMAL NUTRITION: EXPANSIONS
  • TABLE 351 NOVUS INTERNATIONAL, INC.: COMPANY OVERVIEW
  • TABLE 352 NOVUS INTERNATIONAL, INC.: PRODUCTS/SOLUTIONS/SERVICES OFFERED
  • TABLE 353 BIOSTADT: COMPANY OVERVIEW
  • TABLE 354 BIOSTADT: PRODUCTS/SOLUTIONS/SERVICES OFFERED
  • TABLE 355 MARUBENI NISSHIN FEED CO., LTD: COMPANY OVERVIEW
  • TABLE 356 MARUBENI NISSHIN FEED CO., LTD: PRODUCTS/SOLUTIONS/SERVICES OFFERED
  • TABLE 357 KENT NUTRITION GROUP: COMPANY OVERVIEW
  • TABLE 358 KENT NUTRITION GROUP: PRODUCTS/SOLUTIONS/SERVICES OFFERED
  • TABLE 359 MARVESA: COMPANY OVERVIEW
  • TABLE 360 BENEO: COMPANY OVERVIEW
  • TABLE 361 GROWEL: COMPANY OVERVIEW
  • TABLE 362 SONAC: COMPANY OVERVIEW
  • TABLE 363 LIFE CIRCLE NUTRITION: COMPANY OVERVIEW
  • TABLE 364 ADJACENT MARKETS TO AQUAFEED MARKET
  • TABLE 365 COMPOUND FEED MARKET, BY SOURCE, 2018–2022 (USD BILLION)
  • TABLE 366 COMPOUND FEED MARKET, BY SOURCE, 2023–2028 (USD BILLION)
  • TABLE 367 FEED ADDITIVES MARKET, BY FORM, 2018–2022 (USD BILLION)
  • TABLE 368 FEED ADDITIVES MARKET, BY FORM, 2023–2028 (USD BILLION)
LIST OF FIGURES
 
  • FIGURE 1 AQUAFEED MARKET: RESEARCH DESIGN
  • FIGURE 2 BREAKDOWN OF PRIMARY INTERVIEWS: BY COMPANY TYPE, DESIGNATION, AND REGION
  • FIGURE 3 MARKET SIZE ESTIMATION METHODOLOGY: TOP-DOWN APPROACH
  • FIGURE 4 AQUAFEED MARKET SIZE CALCULATION: SUPPLY SIDE
  • FIGURE 5 MARKET SIZE ESTIMATION METHODOLOGY: BOTTOM-UP APPROACH
  • FIGURE 6 DATA TRIANGULATION
  • FIGURE 7 FISH MEAL SEGMENT TO HOLD LARGEST MARKET SIZE IN 2024
  • FIGURE 8 DRY FORM TO ACCOUNT FOR MAJOR MARKET SIZE IN 2024
  • FIGURE 9 GROWER SEGMENT TO LEAD MARKET IN 2024
  • FIGURE 10 FISH SEGMENT TO HOLD LARGER MARKET SIZE IN 2024
  • FIGURE 11 AQUAFEED MARKET SHARE AND GROWTH RATE, BY REGION, 2024 (VALUE)
  • FIGURE 12 INCREASING TRADE OF SEAFOOD TO PROPEL MARKET GROWTH
  • FIGURE 13 VIETNAM ACCOUNTED FOR LARGEST MARKET SHARE DURING FORECAST PERIOD
  • FIGURE 14 CHINA AND DRY FORM SEGMENT TO ACCOUNT FOR SIGNIFICANT SHARES IN 2024
  • FIGURE 15 FISH MEAL SEGMENT TO LEAD MARKET DURING FORECAST PERIOD
  • FIGURE 16 DRY SEGMENT TO DOMINATE MARKET DURING FORECAST PERIOD
  • FIGURE 17 GROWER SEGMENT TO DOMINATE MARKET DURING FORECAST PERIOD
  • FIGURE 18 FISH SEGMENT TO DOMINATE MARKET DURING FORECAST PERIOD
  • FIGURE 19 GLOBAL POPULATION GROWTH, 1950–2050 (BILLION)
  • FIGURE 20 GDP GROWTH, 2016–2023 (TRILLION)
  • FIGURE 21 AQUACULTURE PRODUCTION OF AQUATIC ANIMALS, BY REGION, 2022 VS. 2032
  • FIGURE 22 AQUAFEED MARKET: DRIVERS, RESTRAINTS, OPPORTUNITIES, AND CHALLENGES
  • FIGURE 23 ADOPTION OF GEN AI IN ANIMAL NUTRITION
  • FIGURE 24 AQUAFEED MARKET: SUPPLY CHAIN ANALYSIS
  • FIGURE 25 VALUE CHAIN ANALYSIS: AQUAFEED MARKET
  • FIGURE 26 EXPORT VALUE OF ANIMAL FEEDING RELATED TO AQUAFEED FOR KEY COUNTRIES, 2019–2023 (USD THOUSAND)
  • FIGURE 27 IMPORT VALUE OF ANIMAL FEEDING RELATED TO AQUAFEED FOR KEY COUNTRIES, 2019–2023 (USD THOUSAND)
  • FIGURE 28 AVERAGE SELLING PRICE TREND OF AQUAFEED AMONG KEY PLAYERS, BY AQUAFEED PRODUCT, 2023 (USD/TON)
  • FIGURE 29 AVERAGE SELLING PRICE TREND, BY INGREDIENT, 2020–2023 (USD/TON)
  • FIGURE 30 AVERAGE SELLING PRICE TREND, BY REGION, 2020–2023 (USD/TON)
  • FIGURE 31 KEY PLAYERS IN AQUAFEED ECOSYSTEM
  • FIGURE 32 TRENDS/DISRUPTIONS IMPACTING CUSTOMER BUSINESS
  • FIGURE 33 NUMBER OF PATENTS GRANTED FOR AQUAFEED MARKET, 2013–2023
  • FIGURE 34 REGIONAL ANALYSIS OF PATENTS GRANTED FOR AQUAFEED MARKET, 2013–2023
  • FIGURE 35 PORTER’S FIVE FORCES ANALYSIS: AQUAFEED MARKET
  • FIGURE 36 INFLUENCE OF STAKEHOLDERS ON BUYING PROCESS
  • FIGURE 37 KEY BUYING CRITERIA FOR SPECIES
  • FIGURE 38 INVESTMENT AND FUNDING SCENARIO, 2020–2024 (USD MILLION)
  • FIGURE 39 AQUAFEED MARKET SIZE, BY INGREDIENT, 2024 VS. 2029 (USD MILLION)
  • FIGURE 40 AQUAFEED MARKET SIZE, BY SPECIES, 2024 VS. 2029 (USD MILLION)
  • FIGURE 41 AQUAFEED MARKET SIZE, BY LIFECYCLE, 2024 VS. 2029 (USD MILLION)
  • FIGURE 42 AQUAFEED MARKET SIZE, BY FORM, 2024 VS. 2029 (USD MILLION)
  • FIGURE 43 VIETNAM TO BE FASTEST-GROWING MARKET DURING FORECAST PERIOD
  • FIGURE 44 ASIA PACIFIC: AQUAFEED MARKET SNAPSHOT, 2024
  • FIGURE 45 SOUTH AMERICA: AQUAFEED MARKET SNAPSHOT, 2024
  • FIGURE 46 REVENUE ANALYSIS FOR KEY COMPANIES IN LAST THREE YEARS, 2021–2023 (USD BILLION)
  • FIGURE 47 SHARE OF LEADING COMPANIES IN AQUAFEED MARKET, 2023
  • FIGURE 48 COMPANY VALUATION OF KEY AQUAFEED VENDORS
  • FIGURE 49 EV/EBITDA OF KEY COMPANIES
  • FIGURE 50 BRAND/PRODUCT COMPARISON ANALYSIS, BY PRODUCT BRAND
  • FIGURE 51 AQUAFEED MARKET: COMPANY EVALUATION MATRIX (KEY PLAYERS), 2023
  • FIGURE 52 AQUAFEED MARKET: COMPANY FOOTPRINT
  • FIGURE 53 AQUAFEED MARKET: COMPANY EVALUATION MATRIX (STARTUPS/SMES), 2023
  • FIGURE 54 ADM: COMPANY SNAPSHOT
  • FIGURE 55 CARGILL, INCORPORATED: COMPANY SNAPSHOT
  • FIGURE 56 DSM-FIRMENICH: COMPANY SNAPSHOT
  • FIGURE 57 RIDLEY CORPORATION LIMITED: COMPANY SNAPSHOT
  • FIGURE 58 ADISSEO: COMPANY SNAPSHOT
  • FIGURE 59 AVANTI FEEDS LIMITED: COMPANY SNAPSHOT
  • FIGURE 60 THE WATERBASE LIMITED: COMPANY SNAPSHOT
  • FIGURE 61 JAPFA LTD: COMPANY SNAPSHOT
  • FIGURE 62 CHAROEN POKPHAND FOODS PCL: COMPANY SNAPSHOT

The study involved major segments in estimating the current size of the aquafeed market. Exhaustive secondary research was done to collect information on the market, peer, and parent markets. The next step was to validate these findings, assumptions, and sizing with industry experts across the value chain through primary research. Both top-down and bottom-up approaches were employed to estimate the complete market size. After that, market breakdown and data triangulation were used to estimate the market size of segments and subsegments.

Secondary Research

This research study involved the extensive use of secondary sources—directories and databases such as Bloomberg Businessweek and Factiva—to identify and collect information useful for a technical, market-oriented, and commercial study of the Aquafeed market.

In the secondary research process, various sources such as annual reports, press releases & investor presentations of companies, white papers, food journals, certified publications, articles from recognized authors, directories, and databases were referred to identify and collect information.

Secondary research was mainly used to obtain key information about the industry’s supply chain, the total pool of key players, and market classification and segmentation as per the industry trends to the bottom-most level, regional markets, and key developments from both market- and technology-oriented perspectives.

Primary Research

Extensive primary research was conducted after obtaining information regarding the aquafeed market scenario through secondary research. Several primary interviews were conducted with market experts from both the demand and supply sides across major countries of North America, Europe, Asia Pacific, South America, and the Rest of the World. Primary data was collected through questionnaires, emails, and telephonic interviews. The primary sources from the supply side included various industry experts, such as Chief X Officers (CXOs), Vice Presidents (VPs), Directors from business development, marketing, research, and development teams, and related key executives from distributors and key opinion leaders. Primary interviews were conducted to gather insights such as market statistics, data on revenue collected from the products, market breakdowns, market size estimations, market forecasting, and data triangulation. Primary research also helped in understanding the various trends related to aquafeed ingredients, form, lifecycle, species, function, and region. Stakeholders from the demand side, such as aquaculture farmers/producers and fish hatcheries who use aquafeed, were interviewed to understand the buyer’s perspective on the suppliers, products, and their current usage of aquafeed and the outlook of their business, which will affect the overall market.

Breakdown of Primary Participants
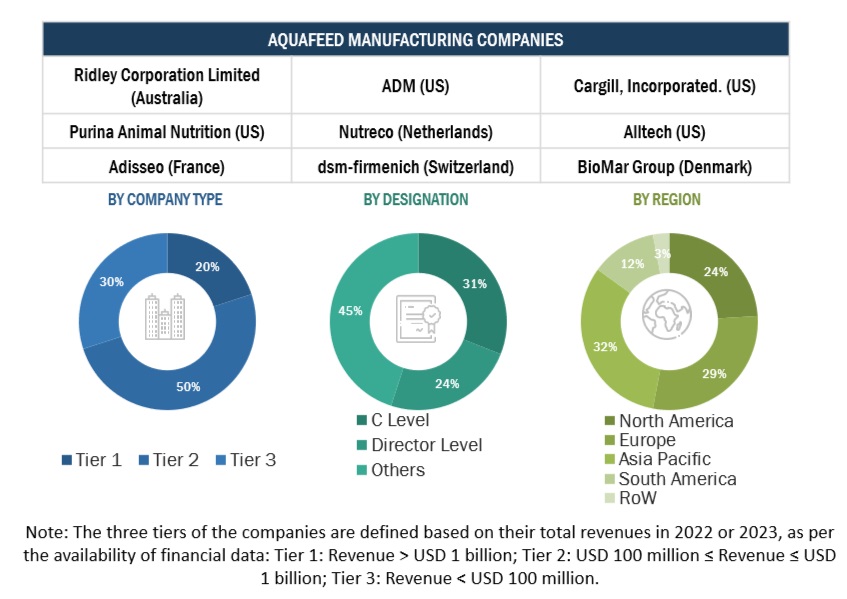
Aquafeed Market Size, Share

To know about the assumptions considered for the study, download the pdf brochure

COMPANY NAME

designation

ADM (US)

Regional Sales Manager

Cargill, Incorporated (US)

Marketing Manager

Ridley Corporation Limited (Australia)

General Manager

Nutreco (Netherlands)

Sales Manager

Alltech (US)

Sales Manager

Purina Animal Nutrition LLC (US)

Sales Executive

Aquafeed Market Size Estimation

Both the top-down and bottom-up approaches were used to estimate and validate the global aquafeed market size. These approaches were also used to estimate the size of various dependent submarkets. The research methodology used to estimate the market size includes the following:

  • The key players in the industry and markets were identified through extensive secondary research.
  • All shares, splits, and breakdowns were determined using secondary sources and verified through primary sources.
  • All possible parameters that affect the markets covered in this research study were accounted for, viewed in extensive detail, verified through primary research, and analyzed to obtain the final quantitative and qualitative data.
  • The research included the study of reports, reviews, and newsletters of top market players, along with extensive interviews for opinions from leaders, such as CEOs, directors, and marketing executives.

Global Aquafeed Market: Bottom-Up Approach.
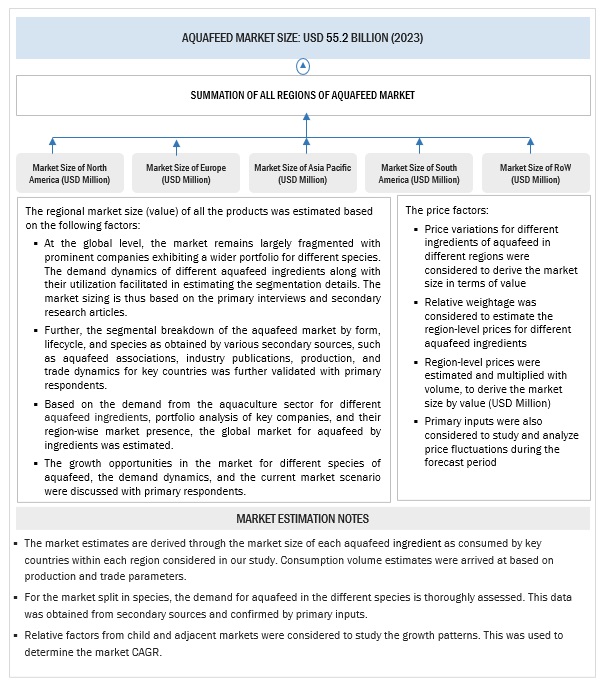
Aquafeeds Market Bottom Up Approach

To know about the assumptions considered for the study, Request for Free Sample Report

Global Aquafeed Market: Top-Down Approach.
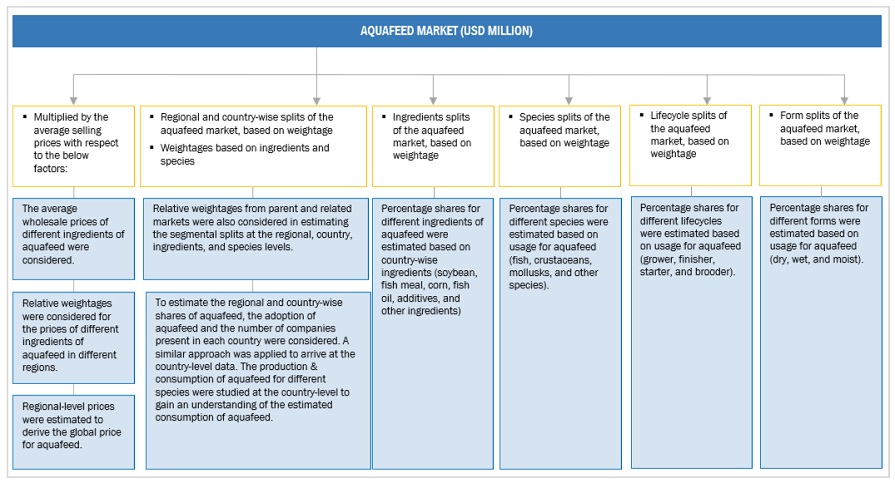
Global Aquafeeds Market Top Down Approach

Data Triangulation

After arriving at the overall market size from the estimation process explained above, the total market was split into several segments and subsegments. To estimate the overall Aquafeed market and arrive at the exact statistics for all segments and subsegments, data triangulation and market breakdown procedures were employed, wherever applicable. The data was triangulated by studying various factors and trends from the demand and supply sides, providing valuable insights for market analysis. Along with this, the market size was validated using both the top-down and bottom-up approaches.

Market Definition

Aquafeed comprises one or more artificial and/or natural feedstuffs in the form of pellets or extruded bits for aquatic animals—fish, crustaceans, and mollusks—contributing to the global aquafeed market share. The report focuses only on commercial aquafeed; farm-made aquafeed has been excluded from the study scope.

According to NOAA Fisheries, any food provided to aquatic farm animals is referred to as an aquafeed. To grow, fish (both farmed and wild) need a well-balanced mixture of vital nutrients such vitamins, fatty acids, and amino acids. Utilizing feed components that promote the aquaculture industry's sustainable growth and protect the special blend of nutrients required to maintain healthy fish and healthy people is a crucial aspect of sustainable aquaculture.

Key Stakeholders

  • Supply-side: Aquafeed manufacturers, suppliers, distributors, importers, and exporters
  • Feed additive manufacturers and traders
  • Demand-side: Fish farmers, farmer organizations, and seafood processors
  • Regulatory side: Concerned government authorities, commercial research & development (R&D) institutions, and other regulatory bodies.
  • Associations and industry bodies such as:
  • Food and Agriculture Organization (FAO)
  • International Feed Industry Federation (IFIF)
  • International Fishmeal and Fish Oil Organization (IFFO)
  • United States Department of Agriculture (USDA)

Report Objectives

  • To define, segment, and forecast the global aquafeed market based on ingredients, form, lifecycle, species, and region from 2020 to 2023, this aquafeed market analysis will also include a forecast period from 2024 to 2029
  • To provide detailed information about the key factors, including drivers, restraints, opportunities, and challenges influencing the growth of the market segments in the aquafeed market.
  • To identify attractive opportunities in the market by determining the largest and fastest-growing segments across regions
  • To analyze the demand-side factors based on the following:
    • Impact of macro and microeconomic factors on the market
    • Shifts in demand patterns across different subsegments and regions
    • Strategically profile the key players and comprehensively analyze their core competencies
    • Competitive developments, such as partnerships, mergers & acquisitions, new product developments, and expansions & investments in the aquafeed market

Available Customizations:

With the given market data, MarketsandMarkets offers customizations according to company-specific scientific needs.

The following customization options are available for the report:

PRODUCT ANALYSIS

  • Product Matrix, which gives a detailed comparison of the product portfolio of each company.

GEOGRAPHIC ANALYSIS

With the given market data, MarketsandMarkets offers customizations according to company-specific scientific needs.

  • Further breakdown of the Rest of the European Aquafeed market into key countries
  • Further breakdown of the Rest of Asia Pacific Aquafeed market into key countries
  • Further breakdown of the South American Aquafeed market into key countries

COMPANY INFORMATION

  • Detailed analyses and profiling of additional market players (up to five)
Custom Market Research Services

We will customize the research for you, in case the report listed above does not meet with your exact requirements. Our custom research will comprehensively cover the business information you require to help you arrive at strategic and profitable business decisions.

Request Customization
Report Code
AGI 2681
Published ON
Aug, 2024
Choose License Type
BUY NOW
  • SHARE
X
Request Customization
Speak to Analyst
Speak to Analyst
OR FACE-TO-FACE MEETING
PERSONALIZE THIS RESEARCH
  • Triangulate with your Own Data
  • Get Data as per your Format and Definition
  • Gain a Deeper Dive on a Specific Application, Geography, Customer or Competitor
  • Any level of Personalization
REQUEST A FREE CUSTOMIZATION
LET US HELP YOU!
  • What are the Known and Unknown Adjacencies Impacting the Aquafeed Market
  • What will your New Revenue Sources be?
  • Who will be your Top Customer; what will make them switch?
  • Defend your Market Share or Win Competitors
  • Get a Scorecard for Target Partners
CUSTOMIZED WORKSHOP REQUEST
knowledgestore logo

Want to explore hidden markets that can drive new revenue in Aquafeed Market?

Find Hidden Markets
  • Call Us
  • +1-888-600-6441 (Corporate office hours)
  • +1-888-600-6441 (US/Can toll free)
  • +44-800-368-9399 (UK office hours)
CONNECT WITH US
ABOUT TRUST ONLINE
©2024 MarketsandMarkets Research Private Ltd. All rights reserved
DMCA.com Protection Status
Website Feedback