Anti-Migrating Agent Market

Anti-Migrating Agent Market by Type (Non-ionic, Anionic, Cationic, Amphoteric), Grades (Technical, Food, Pharmaceutical), Application, Chemistry (Organic, Inorganic), End-Use Industry (Textile, Plastics, Paper), and Region - Global Forecast to 2029

Report Code: CH 9063 Jul, 2024, by marketsandmarkets.com

Anti-migrating Market

The global anti-migrating agent market is valued at USD 159 million in 2024 and is projected to reach USD 224 million by 2029, growing at 7.0% cagr from 2024 to 2029. The rapid growth of the digital printing industry coupled with increasing demand for high-quality textile products drove the market growth during the forecast period. Furthermore, the growing adoption of these agents in the coatings industry, where they help in improving the durability and appearance of coated surfaces, opens additional avenues for growth.

Opportunities in the Anti-Migrating Agent Market

Anti-Migrating Agent Market

To know about the assumptions considered for the study, Request for Free Sample Report

Anti-Migrating Agent Market

Recession impact

During a recession, the anti-migrating agent market is susceptible to several challenges. Cost-saving measures have become paramount for businesses striving to navigate financial challenges during a recession. This heightened focus on reducing expenses may lead to the substitution of premium anti-migrating agent with lower-cost alternatives or the postponement of purchases altogether. Therefore, anti-migrating agent manufacturers face declining sales volumes and revenue streams, impacting their profitability and long-term sustainability.

Anti-migrating agent Market Dynamics

Driver:Growing demand for high-quality textiles in the anti-migrating agent market to drive the market growth

The surge in consumer demand for top-tier textiles, propelled by escalating disposable incomes and dynamic shifts in fashion preferences, is a pivotal force fueling the anti-migrating agent market. In this burgeoning landscape, discerning consumers prioritize fabrics and apparel renowned for their exceptional colorfastness and longevity. Consequently, textile manufacturers are increasingly turning to anti-migrating agent to safeguard these coveted qualities.

Restraint: High production cost might hamper the anti-migrating agent market growth

The cost of anti-migrating agent can be compounded by other factors such as raw material prices, manufacturing overheads, and transportation costs. SMEs may also face challenges in negotiating favorable pricing with suppliers, especially if they lack the purchasing power of larger competitors. As a result, SMEs may be forced to compromise on the quality or quantity of anti-migrating agent used in their products, potentially compromising the overall performance and marketability of their offerings. Addressing cost concerns requires careful financial planning, strategic sourcing, and possibly exploring alternative formulations or suppliers to ensure cost-effective solutions without compromising on quality.

Opportunity: Technological advancements in the anti-migrating agent market to drive the market growth

Innovations in chemical formulations and manufacturing processes are propelling the market forward. Advanced anti-migrating agent offer enhanced performance, such as better thermal stability, improved efficiency, and environmental friendliness. Companies are investing in research and development to create products that meet stringent regulatory standards and address the specific needs of various applications. For example, the development of bio-based anti-migrating agent is gaining traction as industries seek sustainable and eco-friendly solutions. These advancements are not only expanding the product portfolio but also opening new avenues for market growth.

Challenges: Regulatory compliance is a paramount challenge for manufacturers of anti-migrating agent

Regulatory compliance is a paramount challenge for manufacturers of anti-migrating agent, given the evolving landscape of environmental and safety regulations. These regulations, often stringent and subject to frequent updates, demand continuous adaptation and investment from manufacturers to ensure adherence. Compliance encompasses various aspects, including the chemical composition of agent, their impact on human health and the environment, and the safety measures implemented throughout the manufacturing process

Anti-Migrating Agent Market: Ecosystem

Anti-Migrating Agent Market Ecosystem

The anionic type is estimated to account for the highest market share, in terms of value, in the anti-migrating agent market during the forecast period.

The anionic type is estimated to account for the highest market share, in terms of value in the anti-migrating agent due to due to their effectiveness in preventing dye migration during intermediate drying. Anionic agent are particularly effective in treating natural fibers like cotton and wool, which are prevalent in the textile industry. These agent form stable complexes with anionic dyes, thereby preventing the dyes from migrating when exposed to water or solvents. This characteristic makes them indispensable in the production of high-quality garments and fabrics that require vibrant and long-lasting colors.

Dying application is anticipated to account for the highest market share, in terms of value in the anti-migrating agent market during the forecast period .

Dying application is anticipated to account for the highest market share in the anti-migrating market due to the increasing demand from garment industry. In textile dyeing, anti-migrating agent are used to stabilize dyes and prevent them from bleeding or transferring to other parts of the fabric or to different garments during washing. This is particularly important for maintaining the vibrant colors and patterns that are highly sought after in fashion and apparel. Additionally, these agent help improve the overall efficiency of the dyeing process, reducing waste and enhancing the uniformity of color distribution across the fabric.

Organic chemistry is anticipated to account for the highest market share, in terms of value in the anti-migrating agent market.

Organic chemistry is estimated to be the largest chemistry in the anti-migrating market, owing to the high preference in textile and dyeing applications due to their compatibility with organic dyes and natural fibers. These agent often consist of organic molecules that can interact effectively with dye molecules, forming stable complexes that prevent dye migration. The primary advantage of organic anti-migrating agent is their ability to provide excellent color fastness and maintain the vibrancy of fabrics.

The synthetic segment the has highest market share by source, in terms of value, in the anti-migrating market.

The synthetic segment is estimated to be the largest source type in the anti-migrating market, owing to their reliability and uniformity. Manufacturers can produce large quantities of these agent with consistent quality, ensuring predictable performance in textile dyeing, printing, and coating applications. However, the synthetic nature of these agent can pose environmental challenges, as they may not be biodegradable and can contribute to pollution if not managed properly.

Based on grade, technical grade is anticipated to account for the highest market share, in terms of value in the anti-migrating agent market.

The pharma grade is anticipated to account for the highest market share in the anti-migrating market, owing to their balance of performance, cost-effectiveness, and versatility. The technical grade is designed to offer a high level of efficacy, making it suitable for large-scale industrial applications, particularly in the textile, plastics, and paper industries. One of the key reasons for the widespread use of technical grade anti-migrating agent is their cost-effectiveness. They are manufactured to deliver high performance at a reasonable cost, making them an attractive option for manufacturers looking to maintain quality while managing production expenses.

Based on end-use industry, textile end-use industry is anticipated to account for the highest market share, in terms of value in the anti-migrating agent market.

The textile industry is anticipated to account for the highest market share in the anti-migrating market, driven by rising consumer demand for diverse and high-quality apparel, and industrial textiles. Anti-migrating agent are crucial in textile manufacturing, particularly in the dyeing and finishing stages. These agent ensure that dyes remain stable and do not bleed or migrate during subsequent washing and usage, which is vital for maintaining the color integrity and durability of fabrics. The frequent shifts in fashion trends and the rapid production cycles of fast fashion further emphasize the need for reliable dye stabilization to meet quality standards and consumer expectations.

Asia Pacific is anticipated to account for the highest market share, in terms of value, during the forecast period in the anti-migrating market.

The Asia Pacific region is the largest market for anti-migrating agent, primarily due to the significant concentration of textile manufacturing activities in countries like China, India, Bangladesh, and Vietnam. China holds a dominant position due to its expansive textile industry, which is a critical component of the country's economy. Moreover, the growing domestic market in China, driven by increasing disposable income and changing fashion trends, also boosts the demand for high-quality textiles. This internal demand further stimulates the need for effective dye stabilization technologies. Additionally, China's commitment to sustainability and environmental protection has led to the adoption of eco-friendly anti-migrating agent, aligning with global trends towards sustainable textile production.

Anti-Migrating Agent Market by Region

To know about the assumptions considered for the study, download the pdf brochure

Source: Secondary Research, Primary Interviews, and MarketsandMarkets Analysis

Anti-migrating agent Market Players

Some of the top players in the anti-migrating agent market are  SNF (Germany), Rudolf GmbH (Indonesia), Zschimmer & Schwarz Holding GmbH & Co KG (Germany), Sarex Chemicals (India), Archroma (Switzerland). These players have established a strong foothold in the market by adopting strategies, such expansions, joint ventures, and mergers & acquisitions.

Anti-migrating agent Market report Scope

Report Metric

Details

Years considered for the study

2021–2029

Base year considered

 2023

Forecast period

2024–2029

Units considered

Volume (Tons) and Value (USD Million)

Segments

Type, Chemistry, Source, Grade, Application, End-Use Industry, And Region

Regions

North America, Asia Pacific, Europe, Middle East & Africa, and South America

Companies

SNF (Germany), Rudolf GmbH (Indonesia), Zschimmer & Schwarz Holding GmbH & Co KG (Germany), Sarex Chemicals (India), Archroma (Switzerland)
25 major players covered.

The study categorizes the anti-migrating agent market based on type, application and end-use industry, And Region.

By Type:
  • Non-Ionic
  • Anionic
  • Cationic
  • Amphoteric
By Grade:
  • Technical Grade
  • Food Grade
  • Pharmaceutical Grade
  • Others
By Chemistry:
  • Organic
    • Acrylic Acid
    • Butyl Acrylate
    • Polyacrylamide
    • Dibutyl Phthalate
    • Ethanol
    • Sodium Peroxydisulfate
    • Others
  • Inorganic
    • Metal Oxides And Hydroxides
    • Silica And Silicates
    • Others
By Source:
  • Natural
  • Synthetic
By Application:
  • Dyeing
  • Disperse/Reactive Dyeing
  • Vat Dyeing
  • Others
  • Textile Printing
  • Digital Printing
  • Coatings
  • Others
By End-use industry
  • Textile
  • Plastics Industry
  • Paper Industry
  • Others
By Region:
  • North America
  • Asia Pacific
  • Europe
  • Middle East & Africa
  • South America

Recent Developments

  • In 2022, Archroma partnered with Panatronix, an Italian leader in ultrasonic cleaning for the textile denim industry, to introduce an eco-advanced alternative to the denim fabric washing process.

Frequently Asked Questions (FAQ):

To speak to our analyst for a discussion on the above findings, click Speak to Analyst

TABLE OF CONTENTS
 
1 INTRODUCTION 
    1.1 OBJECTIVES OF THE STUDY 
    1.2 MARKET DEFINITION 
    1.3 MARKET SCOPE 
           1.3.1 MARKETS COVERED
           1.3.2 YEARS CONSIDERED FOR THE STUDY
    1.4 CURRENCY 
    1.5 LIMITATION 
    1.6 STAKEHOLDERS 
 
2 RESEARCH METHODOLOGY 
    2.1 RESEARCH DATA 
           2.1.1 SECONDARY DATA
                    2.1.1.1 Key data from secondary sources
           2.1.2 PRIMARY DATA
                    2.1.2.1 Key data from primary sources
                    2.1.2.2 Breakdown of primary interviews
    2.2 MARKET SIZE ESTIMATION 
           2.2.1 BOTTOM-UP APPROACH
           2.2.2 TOP-DOWN APPROACH
    2.3 DATA TRIANGULATION 
    2.4 RESEARCH ASSUMPTIONS 
    2.5 LIMITATIONS 
 
3 EXECUTIVE SUMMARY 
 
4 PREMIUM INSIGHTS 
 
5 MARKET OVERVIEW 
    5.1 INTRODUCTION 
    5.2 MARKET DYNAMICS 
           5.2.1 DRIVERS
           5.2.2 RESTRAINTS
           5.2.3 OPPORTUNITIES
           5.2.4 CHALLENGES
 
6 INDUSTRY TRENDS 
    6.1 INTRODUCTION 
    6.2 VALUE CHAIN ANALYSIS 
           6.2.1 RAW MATERIAL SUPPLIERS
           6.2.2 MANUFACTURERS
           6.2.3 DISTRIBUTORS
           6.2.4 END-USERS
    6.3 PORTER’S FIVE FORCES ANALYSIS 
           6.3.1 BARGAINING POWER OF SUPPLIERS
           6.3.2 THREAT OF NEW ENTRANTS
           6.3.3 THREAT OF SUBSTITUTES
           6.3.4 BARGAINING POWER OF BUYERS
           6.3.5 INTENSITY OF COMPETITIVE RIVALRY
    6.4 PATENT ANALYSIS  
    6.5 TRENDS/DISRUPTION IMPACTING CUTOMER'S BUSINESS 
    6.6 MACROECONOMIC INDICATORS 
    6.7 AVERAGE SELLING PRICE TRENDS 
           6.7.1 AVERAGE SELLING PRICE TRENDS, BY REGION
           6.7.2 AVERAGE SELLING PRICE TRENDS, BY END-USE INDUSTRY
           6.7.3 AVERAGE SELLING PRICE TRENDS, BY KEY PLAYERS
    6.8 REGULATORY LANDSCAPE 
           6.8.1 LIST OF REGULATORY BODIES, GOVERNMENT ORGANIZATIONS, AND OTHER ASSOCIATIONS
    6.9 KEY CONFERENCES & EVENTS IN 2024-25 
    6.10 CASE STUDIES 
 
7 ANTI MIGRATING AGENTS MARKET, BY TYPE*  
    7.1 INTRODUCTION 
    7.2 NON-IONIC 
    7.3 ANIONIC 
    7.4 CATIONIC 
    7.5 AMPHOTERIC 
 
*Market size will be provided in value (USD Million) and volume (Kiloton) at global and regional levels
 
8 ANTI MIGRATING AGENTS MARKET, BY APPLICATIONS*, **  
    8.1 INTRODUCTION 
    8.2 DYEING  
           8.2.1 DISPERSE/REACTIVE DYEING
           8.2.2 VAT DYEING
           8.2.3 OTHERS
    8.3 TEXTILE PRINTING 
    8.4 DIGITAL PRINTING 
    8.5 COATINGS 
    8.6 OTHERS 
 
*Market size will be provided in value (USD Million) and volume (Kiloton) at global and regional levels
**Details on companies providing key products (brands) for each of the applications and chemistries will be provided in the report
 
9 ANTI MIGRATING AGENTS MARKET, BY GRADE*  
    9.1 INTRODUCTION 
    9.2 TECHNICAL GRADE  
    9.3 FOOD GRADE 
    9.4 PHARMACEUTICAL GRADE 
    9.5 OTHERS 
 
* Market size will be provided in value (USD Million) and volume (Kiloton) at global and regional levels
 
10 ANTI MIGRATING AGENTS MARKET, BY CHEMISTRY* 
     10.1 ORGANIC 
             10.1.1 ACRYLIC ACID
             10.1.2 BUTYL ACRYLATE
             10.1.3 POLYACRYLAMIDE
             10.1.4 DIBUTYL PHTHALATE
             10.1.5 ETHANOL
             10.1.6 SODIUM PEROXYDISULFATE
             10.1.7 OTHERS
     10.2 INORGANIC 
             10.2.1 METAL OXIDES AND HYDROXIDES
             10.2.2 SILICA AND SILICATES
             10.2.3 OTHERS
 
*Market size will be provided in value (USD Million) and volume (Kiloton) at global level
 
11 ANTI MIGRATING AGENTS MARKET, BY SOURCE* 
     11.1 INTRODUCTION 
     11.2 NATURAL  
     11.3 SYNTHETIC 
 
*Market size will be provided in value (USD Million) and volume (Kiloton) at global level
 
12 ANTI MIGRATING AGENTS MARKET, BY END-USE INDUSTRY* 
     12.1 INTRODUCTION 
     12.2 TEXTILE 
     12.3 PLASTICS INDUSTRY 
     12.4 PAPER INDUSTRY 
     12.5 OTHERS 
 
*Market size will be provided in value (USD Million) and volume (Kiloton) at regional and country levels
 
13 ANTI MIGRATING AGENTS MARKET, BY REGION 
     13.1 INTRODUCTION 
     13.2 NORTH AMERICA 
             13.2.1 US
             13.2.2 CANADA
             13.2.3 MEXICO
     13.3 EUROPE 
             13.3.1 GERMANY
             13.3.2 UK
             13.3.3 FRANCE
             13.3.4 ITALY
             13.3.5 SPAIN
             13.3.6 REST OF EUROPE
     13.4 APAC 
             13.4.1 CHINA
             13.4.2 JAPAN
             13.4.3 INDIA
             13.4.4 S. KOREA
             13.4.5 REST OF APAC
     13.5 THE MIDDLE EAST & AFRICA 
             13.5.1 SAUDI ARABIA
             13.5.2 SOUTH AFRICA
             13.5.3 REST OF MEA
     13.6 SOUTH AMERICA 
             13.6.1 BRAZIL
             13.6.2 ARGENTINA
             13.6.3 REST OF SOUTH AMERICA
 
14 COMPETITIVE LANDSCAPE 
     14.1 OVERVIEW 
             14.1.1 KEY PLAYER STRATEGIES/ RIGHT TO WIN
             14.1.2 OVERVIEW OF STRATEGIES DEPLOYED
     14.2 MARKET EVALUATION FRAMEWORK 
     14.3 TOP 5 PLAYERS MARKET SHARE ANALYSIS 
     14.4 COMPANY EVALUATION MATRIX (TIER 1) 
     14.5 START-UPS AND SMALL AND MEDIUM-SIZED ENTERPRISES (SMES) EVALUATION MATRIX  
     14.6 COMPETITIVE SCENARIO  
             14.6.1 EXPANSIONS & INVESTMENTS
             14.6.2 AGREEMENTS, COLLABORATIONS, AND JOINT VENTURES
             14.6.3 NEW PRODUCT LAUNCHES
             14.6.4 MERGERS & ACQUISITIONS
 
15 COMPANY PROFILE * 
     15.1 SNF HOLDING COMPANY 
             15.1.1 BUSINESS OVERVIEW
             15.1.2 PRODUCTS OFFERED
             15.1.3 RECENT DEVELOPMENTS
             15.1.4 WINNING IMPERATIVES
             15.1.5 CURRENT FOCUS AND STRATEGIES
             15.1.6 THREAT FROM COMPETITION
     15.2 SAREX CHEMICALS 
     15.3 ASSOCIATED CHEMICAL 
     15.4 RUDOLF GMBH 
     15.5 WEIFANG RUIGUANG CHEMICAL CO., LTD. 
     15.6 ARCHROMA  
     15.7 STERLING ORGANICS & CHEMICALS 
     15.8 FINEOTEX CHEMICAL LIMITED 
     15.9 SUMAN CHEMICAL INDUSTRIES 
 
*Note: This is a tentative list of companies, and it may change during study. Financial will be only provided for listed companies. 
The top 10 companies will be profiled and a list of 15 players will be provided additionally.  
 
16 APPENDIX 
     16.1 INSIGHTS FROM INDUSTRY EXPERTS 
     16.2 DISCUSSION GUIDE 
     16.3 AVAILABLE CUSTOMIZATIONS 
     16.4 CONNECTED MARKET 
     16.5 RELATED REPORTS 
 
 
LIST OF TABLES (68 TABLES)
 
TABLE 1 ANNUAL PERCENT CHANGE OF REAL GDP GROWTH RATES FROM 2023 TO 2028
TABLE 2 TRENDS AND FORECAST OF GDP PER CAPITA, BY COUNTRY, 2023–2028 (USD)
TABLE 3 AUTOMOTIVE PRODUCTION, MILLION UNIT (2018–2022)
TABLE 4 OVERALL AC DEMAND IN NORTH AMERICA, 2015–2023 (THOUSAND UNITS)
TABLE 5 OVERALL AC DEMAND IN EUROPE, 2015–2023 (THOUSAND UNITS)
TABLE 6 OVERALL AC DEMAND IN APAC, 2015–2023 (THOUSAND UNITS)
TABLE 7 ANTI-MIGRATING AGENT SIZE, BY TYPE, 2023–2028 (USD MILLION)
TABLE 8 ANTI-MIGRATING AGENT SIZE, BY APPLICATION, 2023–2028 (USD MILLION)
TABLE 9 ANTI-MIGRATING AGENT SIZE, BY REGION, 2023–2028 (USD MILLION)
TABLE 10 NORTH AMERICA: ANTI-MIGRATING AGENT SIZE, BY COUNTRY, 2023–2028 (USD MILLION)
TABLE 11 NORTH AMERICA: ANTI-MIGRATING AGENT SIZE, BY TYPE, 2023–2028 (USD MILLION)
TABLE 12 NORTH AMERICA: ANTI-MIGRATING AGENT SIZE, BY APPLICATION, 2023–2028 (USD MILLION)
TABLE 13 US: ANTI-MIGRATING AGENT SIZE, BY TYPE, 2023–2028 (USD MILLION)
TABLE 14 US: ANTI-MIGRATING AGENT SIZE, BY APPLICATION, 2023–2028 (USD MILLION)
TABLE 15 CANADA: ANTI-MIGRATING AGENT SIZE, BY TYPE, 2023–2028 (USD MILLION)
TABLE 16 CANADA: ANTI-MIGRATING AGENT SIZE, BY APPLICATION, 2023–2028 (USD MILLION)
TABLE 17 MEXICO: ANTI-MIGRATING AGENT SIZE, BY TYPE, 2023–2028 (USD MILLION)
TABLE 18 MEXICO: ANTI-MIGRATING AGENT SIZE, BY APPLICATION, 2023–2028 (USD MILLION)
TABLE 19 APAC: ANTI-MIGRATING AGENT SIZE, BY COUNTRY, 2023–2028 (USD MILLION)
TABLE 20 APAC: ANTI-MIGRATING AGENT SIZE, BY TYPE, 2023–2028 (USD MILLION)
TABLE 21 APAC: ANTI-MIGRATING AGENT SIZE, BY APPLICATION, 2023–2028 (USD MILLION)
TABLE 22 CHINA: ANTI-MIGRATING AGENT SIZE, BY TYPE, 2023–2028 (USD MILLION)
TABLE 23 CHINA: ANTI-MIGRATING AGENT SIZE, BY APPLICATION, 2023–2028 (USD MILLION)
TABLE 24 INDIA: ANTI-MIGRATING AGENT SIZE, BY TYPE, 2023–2028 (USD MILLION)
TABLE 25 INDIA: ANTI-MIGRATING AGENT SIZE, BY APPLICATION, 2023–2028 (USD MILLION)
TABLE 26 JAPAN: ANTI-MIGRATING AGENT SIZE, BY TYPE, 2023–2028 (USD MILLION)
TABLE 27 JAPAN: ANTI-MIGRATING AGENT SIZE, BY APPLICATION, 2023–2028 (USD MILLION)
TABLE 28 SOUTH KOREA: ANTI-MIGRATING AGENT SIZE, BY TYPE, 2023–2028 (USD MILLION)
TABLE 29 SOUTH KOREA: ANTI-MIGRATING AGENT SIZE, BY APPLICATION, 2023–2028 (USD MILLION)
TABLE 30 INDONESIA: ANTI-MIGRATING AGENT SIZE, BY TYPE, 2023–2028 (USD MILLION)
TABLE 31 INDONESIA: ANTI-MIGRATING AGENT SIZE, BY APPLICATION, 2023–2028 (USD MILLION)
TABLE 32 REST OF APAC: ANTI-MIGRATING AGENT SIZE, BY TYPE, 2023–2028 (USD MILLION)
TABLE 33 REST OF APAC: ANTI-MIGRATING AGENT SIZE, BY APPLICATION, 2023–2028 (USD MILLION)
TABLE 34 EUROPE: ANTI-MIGRATING AGENT SIZE, BY COUNTRY, 2023–2028 (USD MILLION)
TABLE 35 EUROPE: ANTI-MIGRATING AGENT SIZE, BY TYPE, 2023–2028 (USD MILLION)
TABLE 36 EUROPE: ANTI-MIGRATING AGENT SIZE, BY APPLICATION, 2023–2028 (USD MILLION)
TABLE 37 GERMANY: ANTI-MIGRATING AGENT SIZE, BY TYPE, 2023–2028 (USD MILLION)
TABLE 38 GERMANY: ANTI-MIGRATING AGENT SIZE, BY APPLICATION, 2023–2028 (USD MILLION)
TABLE 39 SPAIN: ANTI-MIGRATING AGENT SIZE, BY TYPE, 2023–2028 (USD MILLION)
TABLE 40 SPAIN: ANTI-MIGRATING AGENT SIZE, BY APPLICATION, 2023–2028 (USD MILLION)
TABLE 41 FRANCE: ANTI-MIGRATING AGENT SIZE, BY TYPE, 2023–2028 (USD MILLION)
TABLE 42 FRANCE: ANTI-MIGRATING AGENT SIZE, BY APPLICATION, 2023–2028 (USD MILLION)
TABLE 43 RUSSIA: ANTI-MIGRATING AGENT SIZE, BY TYPE, 2023–2028 (USD MILLION)
TABLE 44 RUSSIA: ANTI-MIGRATING AGENT SIZE, BY APPLICATION, 2023–2028 (USD MILLION)
TABLE 45 UK: ANTI-MIGRATING AGENT SIZE, BY TYPE, 2023–2028 (USD MILLION)
TABLE 46 UK: ANTI-MIGRATING AGENT SIZE, BY APPLICATION, 2023–2028 (USD MILLION)
TABLE 47 ITALY: ANTI-MIGRATING AGENT SIZE, BY TYPE, 2023–2028 (USD MILLION)
TABLE 48 ITALY: ANTI-MIGRATING AGENT SIZE, BY APPLICATION, 2023–2028 (USD MILLION)
TABLE 49 REST OF EUROPE: ANTI-MIGRATING AGENT SIZE, BY TYPE, 2023–2028 (USD MILLION)
TABLE 50 REST OF EUROPE: ANTI-MIGRATING AGENT SIZE, BY APPLICATION, 2023–2028 (USD MILLION)
TABLE 51 MIDDLE EAST & AFRICA: ANTI-MIGRATING AGENT SIZE, BY COUNTRY, 2023–2028 (USD MILLION)
TABLE 52 MIDDLE EAST & AFRICA: ANTI-MIGRATING AGENT SIZE, BY TYPE, 2023–2028 (USD MILLION)
TABLE 53 MIDDLE EAST & AFRICA: ANTI-MIGRATING AGENT SIZE, BY APPLICATION,  2023–2028 (USD MILLION)
TABLE 54 SAUDI ARABIA: ANTI-MIGRATING AGENT SIZE, BY TYPE, 2023–2028 (USD MILLION)
TABLE 55 SAUDI ARABIA: ANTI-MIGRATING AGENT SIZE, BY APPLICATION, 2023–2028 (USD MILLION)
TABLE 56 REST OF THE MIDDLE EAST & AFRICA: ANTI-MIGRATING AGENT SIZE, BY TYPE,  2023–2028 (USD MILLION)
TABLE 57 REST OF THE MIDDLE EAST & AFRICA: ANTI-MIGRATING AGENT SIZE, BY APPLICATION,  2023–2028 (USD MILLION)
TABLE 58 SOUTH AMERICA: ANTI-MIGRATING AGENT SIZE, BY COUNTRY, 2023–2028 (USD MILLION)
TABLE 59 SOUTH AMERICA: ANTI-MIGRATING AGENT SIZE, BY TYPE, 2023–2028 (USD MILLION)
TABLE 60 SOUTH AMERICA: ANTI-MIGRATING AGENT SIZE, BY APPLICATION, 2023–2028 (USD MILLION)
TABLE 61 BRAZIL: ANTI-MIGRATING AGENT SIZE, BY TYPE, 2023–2028 (USD MILLION)
TABLE 62 BRAZIL: ANTI-MIGRATING AGENT SIZE, BY APPLICATION, 2023–2028 (USD MILLION)
TABLE 63 REST OF SOUTH AMERICA: ANTI-MIGRATING AGENT SIZE, BY TYPE, 2023–2028 (USD MILLION)
TABLE 64 REST OF SOUTH AMERICA: ANTI-MIGRATING AGENT SIZE, BY APPLICATION, 2023–2028 (USD MILLION)
TABLE 65 EXPANSION, 2019–2023
TABLE 66 JOINT VENTURE, 2019–2023
TABLE 67 ACQUISITION, 2019–2023
TABLE 68 NEW PRODUCT LAUNCH, 2019–2023
 
 
LIST OF FIGURES (16 FIGURES)
 
FIGURE 1 ANTI-MIGRATING AGENT: RESEARCH DESIGN
FIGURE 2 ANTI-MIGRATING AGENT: BOTTOM-UP APPROACH
FIGURE 3 ANTI-MIGRATING AGENT: TOP-DOWN APPROACH
FIGURE 4 ANTI-MIGRATING AGENT: DATA TRIANGULATION
FIGURE 5 APAC TO BE THE FASTEST-GROWING ANTI-MIGRATING AGENT
FIGURE 6 GROWTH IN DEMAND FOR AC SYSTEMS TO DRIVE THE ANTI-MIGRATING AGENT
FIGURE 7 INDIA TO REGISTER THE HIGHEST CAGR IN THE ANTI-MIGRATING AGENT
FIGURE 8 DRIVERS, RESTRAINTS, OPPORTUNITIES, AND CHALLENGES IN THE ANTI-MIGRATING AGENT
FIGURE 9 PORTER’S FIVE FORCES ANALYSIS: ANTI-MIGRATING AGENT
FIGURE 10 APAC TO REGISTER THE HIGHEST CAGR IN THE ANTI-MIGRATING AGENT BETWEEN 2023 AND 2028
FIGURE 11 US IS THE KEY MARKET FOR MCHE IN NORTH AMERICA
FIGURE 12 CHINA DOMINATED THE ANTI-MIGRATING AGENT IN APAC, 2018
FIGURE 13 GERMANY DOMINATES THE ANTI-MIGRATING AGENT IN EUROPE, 2018
FIGURE 14 COMPANIES ADOPTED EXPANSION AS THE KEY GROWTH STRATEGY BETWEEN 2019 AND 2023
FIGURE 15 ANTI-MIGRATING AGENT: COMPETITIVE LEADERSHIP MAPPING, 2023
FIGURE 16 MARKET RANKING OF KEY PLAYERS IN 2022

The study involved four major activities in estimating the current market size for anti-migrating agents. Exhaustive secondary research was done to collect information on the market, peer market, and parent market. The next step was to validate these findings, assumptions, and sizing with industry experts across the value chain through primary research.  Both top-down and bottom-up approaches were employed to estimate the complete market size. After that, the market breakdown and data triangulation methodologies were used to estimate the market size of segments and sub-segments.

Secondary Research

In the secondary research process, various sources have been referred to for identifying and collecting information for this study. The secondary sources include annual reports, press releases, and investor presentations of companies; white papers, journals, and certified publications; and articles from recognized authors, directories, and databases. Secondary data has been collected and analyzed to arrive at the overall market size, which is further validated by primary research. Secondary research has been used to obtain key information about the value chain of the industry, monetary chain of the market, the total pool of key players, market classification and segmentation according to industry trends to the bottom-most level, and regional markets. It was also used to obtain information about the key developments from a market-oriented perspective.

Primary Research

The anti-migrating agent market involves a variety of stakeholders across the value chain, including raw material suppliers, manufacturers, and end-users. For this study, both the supply and demand sides of the market were interviewed to gather qualitative and quantitative information. Key opinion leaders from various end-use sectors were interviewed from the demand side, while manufacturers and associations were interviewed from the supply side.

Primary interviews helped to gather insights on market statistics, revenue data, market breakdowns, market size estimations, market forecasting, and data triangulation. Primary research also helped to identify trends related to type, chemistry, source, grade, application, end-use industries, and region. C-level executives from the demand side, such as CIOs, CTOs, and CSOs, were interviewed to understand their perspective on suppliers, products, and component providers, which will affect the overall market.

Breakdown of primary interviews

Anti-Migrating Agent Market Size, and Share

Note: Tier 1, Tier 2, and Tier 3 companies are classified based on their market revenue in 2023 available in the public domain, product portfolios, and geographical presence.
Other designations include sales representatives, production heads, and technicians.

To know about the assumptions considered for the study, download the pdf brochure

Company Name

Designation

Sarex Chemicals

Sales Manager

Rudolf Group

Sales Manager

LN Chemicals

Technical Sales Manager

Taiwan Dyestuff & Pigments Corp.

Marketing Manager

Spectra Specialities

R&D Manager

Market Size Estimation

The top-down approach was used to estimate and validate the size of various submarkets for anti-migrating agent for each region. The research methodology used to estimate the market size included the following steps:The key players in the industry have been identified through extensive secondary research.

The supply chain of the industry has been determined through primary and secondary research.

The global market was then segmented into five major regions and validated by industry experts.

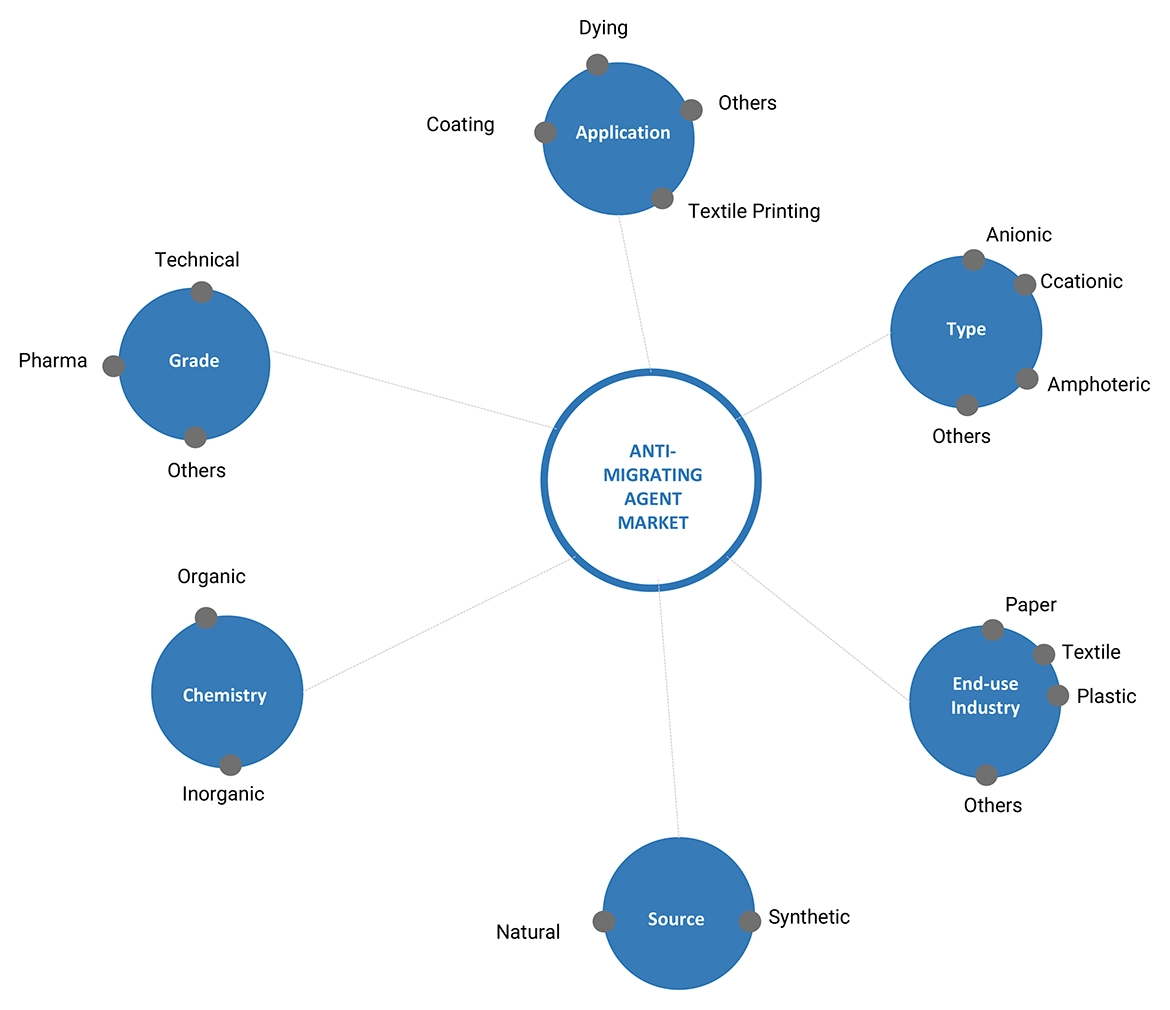
All percentage shares, splits, and breakdowns based on type, chemistry, source, grade, application, end-use industry, and country were determined using secondary sources and verified through primary sources.

All possible parameters that affect the markets covered in this research study were accounted for, viewed in extensive detail, verified through primary research, and analyzed to get the final quantitative and qualitative data. This data was consolidated and added with detailed input and analysis and presented in this report.

Anti-Migrating Agent Market: Bottum-Up Approach

Anti-Migrating Agent Market Size, and Share

To know about the assumptions considered for the study, Request for Free Sample Report

Anti-Migrating Agent Market: Top-Down Approach

Anti-Migrating Agent Market Size, and Share

Source: Secondary Research, Interviews with Experts, and MarketsandMarkets Analysis

Data Triangulation

After arriving at the overall market size—using the market size estimation process explained above—the market was split into several segments and sub-segments. To complete the overall market engineering process and arrive at the exact statistics of each market segment and sub-segment, the data triangulation, and market breakdown procedures were employed, wherever applicable. The data was triangulated by studying various factors and trends from both the demand and supply of anti-migrating agent and their applications.

Market Definition

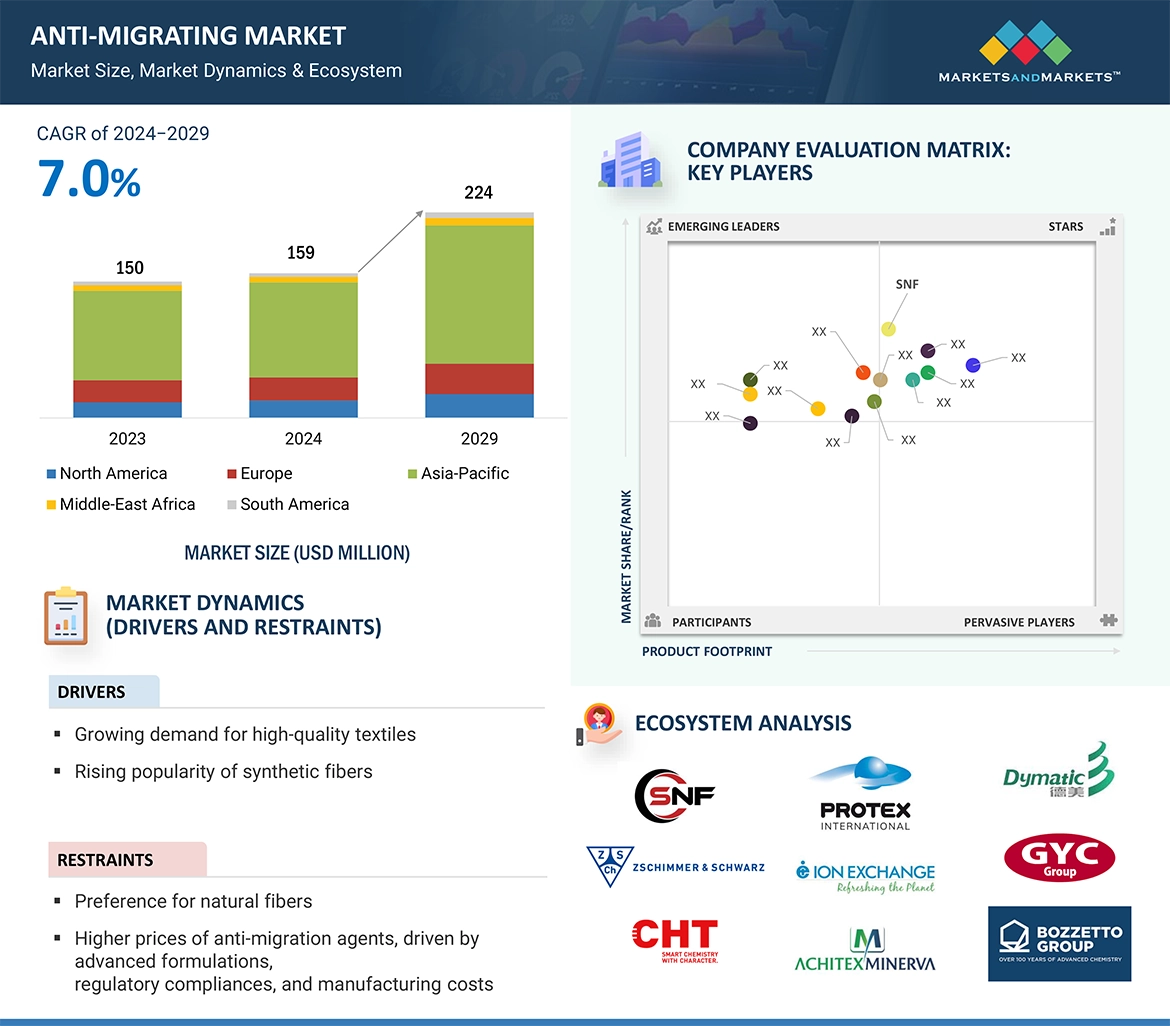
Anti-migrating agents are specialized chemical compounds designed to prevent the unwanted movement or migration of substances within materials. They are primarily used in various industrial processes to maintain the stability and integrity of products by inhibiting the migration of dyes, pigments, additives, or other components from one area to another.

Key Stakeholders

  • Manufacturers of anti-migrating agent products
  • Raw Material Suppliers
  • Manufacturers In End-use Industries
  • Traders, Distributors, and Suppliers
  • Regional Manufacturers’ Associations
  • Government and regional Agencies and Research Organizations

Objectives of the Study:

  • To analyze and forecast the size of the anti-migrating agent market in terms of value and volume.
  • To provide detailed information about the key factors (drivers, restraints, opportunities, and challenges) influencing the market
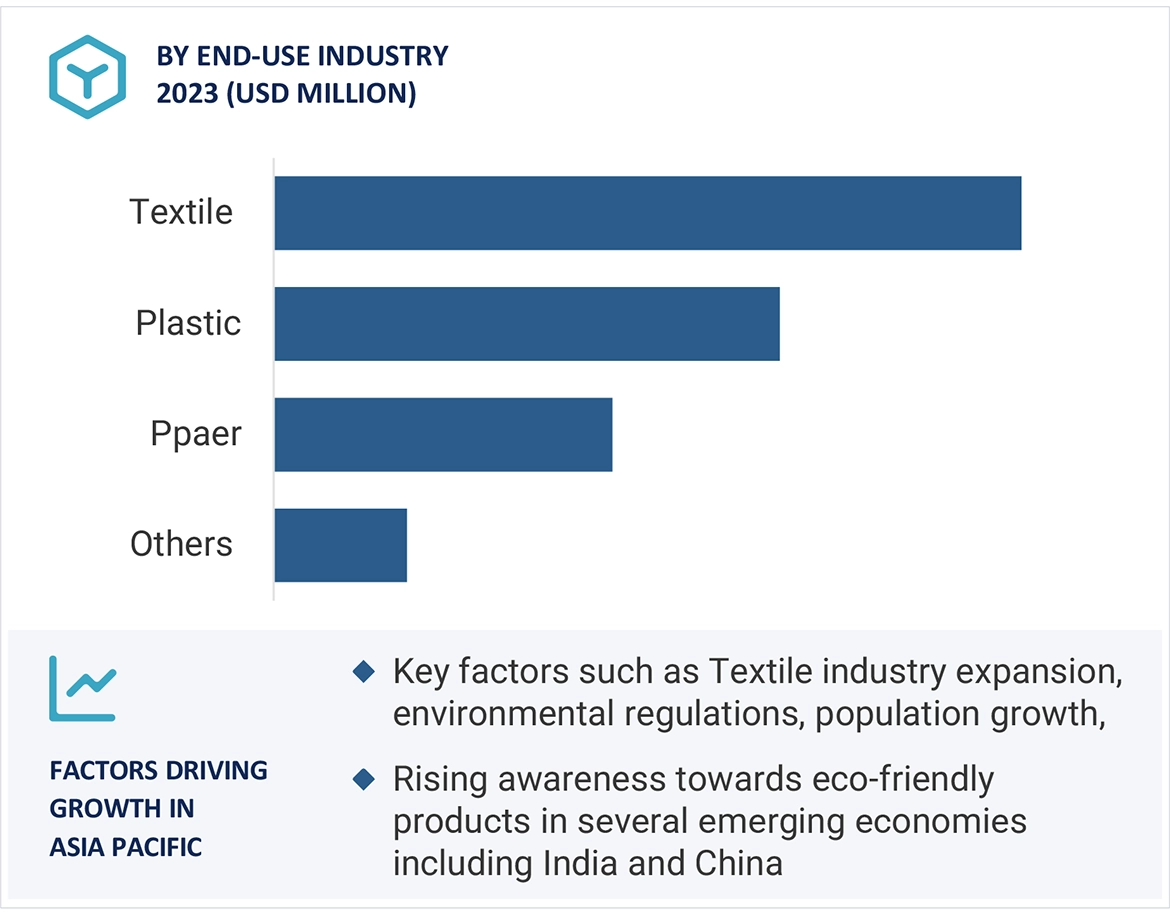
  • To analyze and forecast the market by type, chemistry, source, grade, application, end-use industry, and region.
  • To forecast the size of the market with respect to five regions: Asia Pacific, Europe, North America, South America, and the Middle East & Africa, along with their key countries
  • To strategically analyze micromarkets1 with respect to individual trends, growth prospects, and their contribution to the overall market
  • To analyze opportunities in the market for stakeholders and provide a competitive landscape for the market leaders.
  • To analyze competitive developments in the market, such as investment & expansion, joint venture, partnership, and merger & acquisition
  • To strategically profile key players and comprehensively analyze their market shares and core competencies2.

Notes: Micromarkets1 are the sub-segments of the anti-migrating agent market included in the report.

Core competencies2 of companies are determined in terms of their key developments, SWOT analysis, and key strategies adopted by them to sustain in the market.

Available Customizations:

MarketsandMarkets offers the following customizations for this market report.

  • Additional country-level analysis of the anti-migrating agent market
  • Profiling of additional market players (up to 3)
Custom Market Research Services

We will customize the research for you, in case the report listed above does not meet with your exact requirements. Our custom research will comprehensively cover the business information you require to help you arrive at strategic and profitable business decisions.

Request Customization
Report Code
CH 9063
Published ON
Jul, 2024
Choose License Type
BUY NOW
  • SHARE
X
Request Customization
Speak to Analyst
Speak to Analyst
OR FACE-TO-FACE MEETING
PERSONALIZE THIS RESEARCH
  • Triangulate with your Own Data
  • Get Data as per your Format and Definition
  • Gain a Deeper Dive on a Specific Application, Geography, Customer or Competitor
  • Any level of Personalization
REQUEST A FREE CUSTOMIZATION
LET US HELP YOU!
  • What are the Known and Unknown Adjacencies Impacting the Anti-Migrating Agent Market
  • What will your New Revenue Sources be?
  • Who will be your Top Customer; what will make them switch?
  • Defend your Market Share or Win Competitors
  • Get a Scorecard for Target Partners
CUSTOMIZED WORKSHOP REQUEST
  • Call Us
  • +1-888-600-6441 (Corporate office hours)
  • +1-888-600-6441 (US/Can toll free)
  • +44-800-368-9399 (UK office hours)
CONNECT WITH US
ABOUT TRUST ONLINE
©2024 MarketsandMarkets Research Private Ltd. All rights reserved
DMCA.com Protection Status Website Feedback