Ammonia Market

Report Code CH 9195
Published in Oct, 2024, By MarketsandMarkets™
Download PDF

Choose License Type

Buy Report Now Inquire Before Buying

Ammonia Market by Type (Anhydrous, Aqueous), Sales Channel (Direct and Indirect), End-use Industry (Agriculture, Textile, Refrigeration, Mining, and Pharmaceutical), and Region - Global Forecast to 2029

Overview

The ammonia market size is projected to grow from USD 79.47 billion in 2024 and is projected to reach USD 91.95 billion by 2029, at a CAGR of 3.0%. According to the International Energy Agency (IEA), ammonia production will rise by almost 40% by 2050, fuelled by economic and population growth, potentially resulting in increased emissions. Certain governments have introduced carbon pricing and ammonia producers have established emission reduction goals, global emissions from ammonia production are expected to increase by 3% by 2030 before slowly decreasing. Industrial growth is increasing the demand for ammonia in industries such as chemicals, textiles, mining, refrigeration, and others. The agricultural sector is the main consumer of ammonia, in regions such as Asia Pacific and North America, as in these regions wide farming methods serve rising population demands.

Attractive Opportunities in the Ammonia Market

Asia Pacific

The ammonia market in Asia Pacific is expected to grow due to increasing demand across various end-use sectors, increased agricultural demands, and the region's focus on sustainability and energy efficiency initiatives.

The global ammonia market will grow due to rising agricultural and textile demand

Growing emphasis on low-carbon solutions are expected to offer lucrative opportunities for market players during the next five years.

The ammonia in Asia Pacific is expected to be worth USD 39.52 billion by 2029.

Fluctuations in pricing is a major factor restraining the growth of the ammonia market

Global Ammonia Market Dynamics

Driver: Rising agricultural demand for ammonia

Ammonia is widely in agriculture because it promotes the production of crops and as a result food security. There is a high demand for products such as fertilizers because the world’s population is constantly growing. Analysis of the global consumption of ammonia in fertilizers for the year 2019 to 2022 was taken from the International Fertilizer Association, the data as presented in the figure below show fluctuating consumption of ammonia in fertilizers. Still, it remained consistently elevated, emphasizing its importance for modern agriculture. By 2050 globally the population is expected to exceed 9 billion. To meet the growing demand there is a requirement of 60-70% increase in food production. The major agricultural countries such as China, India, the US, and Brazil rely on ammonia to produce nitrogen fertilizers. As the agricultural demand is rising, this will drive the ammonia market.

Restraints: Fluctuations in pricing

The main raw materials used to manufacture ammonia are natural gas and coal and these have volatility in price due to geopolitics, speculation as well as shifts in energy policies. Variations can be noted in the price of natural gas resulting from variations in demand period or interruption of supply, technological progress in extraction, and exploration. The raw material being used in the production of ammonia is also volatile, changes in the price of raw material cause direct changes in the ammonia prices listed in the market.


Opportunity: Growing emphasis on low-carbon solutions

Increasing environmental concerns with climate change have made the global call for lower carbon solutions. Ammonia is used in fertilizer manufacturing and is now considered part of the emerging clean-energy sector. It has led to a push for the production of green ammonia. The use of such methods also solves environmental issues and corresponds to global goals of sustainable development, which in turn makes low-carbon ammonia more attractive not only for producers but also for consumers. Some of the major players in the industry today are investing in this shift.

For instance,

  • Yara intends to build two giant green ammonia projects at the US Gulf Coast with production ranging from 1.2-1.4 million metric tonnes per year.
  • SABIC Agri-Nutrients has also introduced low-carbon ammonia to the fertilizer market in India, exporting the first 5,000-ton order to its client, Indian Farmers Fertilizer Cooperative Limited (IFFCO).

These initiatives bring into focus what the industry and market players are striving to achieve as far as sustainability is concerned

Challenges: Alternative technologies

This is a significant threat for the ammonia market as new developments in other technologies that can replace ammonia in various applications. In agribusiness, there is a trend towards organic fertilizers and biostimulants that give the same benefits to crops without the need for synthetic ammonia-based fertilizers. These natural substitutes are becoming popular with farmers who want to embrace environmentally friendly farming. However, it is with these solutions and products in the market, probably at competitive prices, they may reduce the need for conventional ammonia fertilizers.

Global Ammonia Market Ecosystem Analysis

The ecosystem of ammonia involves raw material suppliers, ammonia manufacturers, distributors, and end-users. Raw materials include natural gas, air for nitrogen, and water for hydrogen. Ammonia manufacturers process raw materials into ammonia through the Haber-Bosch process After production, ammonia is marketed through a channel of distributors who then supply it to the various consumers in several industries such as agriculture, textile, refrigeration, mining, and other industries. This ecosystem signifies the importance of every single stakeholder within the system since they collectively meet the growing demand for ammonia across the globe, while at the same time addressing emerging sustainability standards.


Anhydrous type of ammonia is the fastest-growing type segment in the ammonia market.

The anhydrous type of ammonia is the fastest-growing segment in the ammonia market, by type. The reason for the rapid growth is due to ease of availability and application. Anhydrous ammonia is widely used in the agriculture industry, and it has been instrumental in providing nearly 50% of the food that people eat. While it is a hazardous inorganic chemical and toxic gas commonly used with chlorine for secondary disinfection, it plays a critical role in the manufacture of fertilizers. Anhydrous ammonia is used as a raw material in the production of other chemicals including nitric acid, refrigerants, household chemicals, plastics, papers, pharmaceuticals, and explosives. There is an increase in the consumption of anhydrous ammonia due to increasing global food scarcity since farmers require efficient ways of tackling rising food production demands

Direct sales is the fastest-growing segment in the ammonia market, by sales channel.

The direct sales channel has been growing in the ammonia market due to the large clients in the market such as agricultural producers, manufacturers, and energy producers who require large quantities of ammonia for nitrogen-based fertilizers, industrial chemicals, and new energy applications. It enables ammonia producers to reach long-term agreements with customers, thus guaranteeing revenue steadiness and supply chain reliability. Due to the very large volumes of ammonia that are used in such sectors, direct sales are also the most effective in catering for them. Direct sales present several advantages to ammonia producers. The benefit they get is they make more profits than in traditional models because they cut out the middleman, they get to directly engage with the customers providing adequate solutions to their problems and offer more personalized goods and services that fit a particular client’s requirement.

Agriculture is the largest segment by end-use industry in the ammonia market.

The end-use industry of agriculture continues to dominate the ammonia market due to its ability to provide the nitrogen compound in fertilizer. About half of the output of foods worldwide is produced by mineral fertilizers, establishing the importance of ammonia to support further yields in the agricultural industry. This will increase in the future as the world's human population increases as well as changes in diet systems. Ammonia is essential since it extracts nitrogen from the air and transforms it into the form of the nutrient crops need most. Ammonia is an essential building block in the production of fertilizers, and it contributes to food security in society. Ammonia production statistics show that about 80% of the product is used by the fertilizer industry. Fertilizers play a major role in increasing nutrient uptake by plants, growth promotion, quality improvement of crops, and even in conservation and build-up of soil fertility.

Asia Pacific is estimated to be the largest market in the ammonia market.

Asia Pacific dominated the ammonia market in 2023, followed by Europe. The demand for ammonia in the Asia Pacific region is driven by growing agricultural needs along with the focus of Asia Pacific on sustainability and energy-efficient materials. The analysis done by OECD-FAO Agricultural Outlook 2021-2030 has seen Asia Pacific's potential to produce 53% of total agricultural and fish products in the world by 2030. Ammonia will play a critical role in satisfying the increasing demand for fertilizers for enhancing crop and livestock production in the Asia Pacific region. As a component of nitrogen-based fertilizers such as urea, and ammonium nitrate, ammonia has a critical role in enhancing soil fertility and crop yields, which will be instrumental in meeting the expected 22 % crop production increase over the next ten years. The expected increase in crop production including rice, wheat, and maize will heavily contribute to the increase in ammonia used in the production of fertilizers. These fertilizers are important in enhancing agricultural yield to meet the growing population and increase consumer eating habits. Ammonia-based fertilizers remain prominent in supporting the agricultural industry of countries such as India, China, and several southeastern Asian countries. The largest consumer of ammonia in the region will be India which would need to increase production or imports of ammonia within the country to meet the needs of crop production to support key food staples in grains and vegetables. The ammonia market is also benefitting from Asia Pacific’s transition towards a cleaner and more sustainable energy system.

HIGHEST CAGR MARKET IN 2023
MIDDLE EAST & AFRICA FASTEST GROWING MARKET IN THE REGION

Recent Developments of Ammonia Market

  • In August 2024, OCI Global entered into a binding equity purchase agreement to sell 100% of its equity interests in the 1.1 million metric tons Clean Ammonia project, currently under construction in Beaumont, Texas to Woodside Energy Group Ltd. The transaction follows a competitive process, with the agreed purchase price set at USD 2.35 billion on a cash-free, debt-free basis.
  • In July 2024, CF Industries Holdings, Inc. announced plans to advance a carbon capture and sequestration (CCS) project at its Yazoo City, Mississippi, facility, aimed at reducing carbon dioxide (CO2) emissions by up to 500,000 metric tons per year. The company entered into a definitive commercial agreement with ExxonMobil for the transport and permanent geological storage of the captured CO2, with sequestration expected to begin in 2028. As part of the project, CF Industries will invest approximately USD 100 million to construct a CO2 dehydration and compression unit at the Yazoo City Complex. This unit will capture and store up to 500,000 metric tons of CO2, a byproduct of ammonia production.
  • In July 2024, CF Industries Holdings, Inc. and POET LLC, the world’s largest biofuel producer and a leader in sustainable bioproducts, announced a collaboration to test the use of low-carbon ammonia fertilizer to lower the carbon intensity of corn production and ethanol.
  • In May 2024, Yara Clean Ammonia and Greenko ZeroC, the green ammonia production division of India’s AM Green, signed a term sheet for the supply of renewable ammonia from Phase 1 of AM Green’s production facility in Kakinada, India.

Key Market Players

Want to explore hidden markets that can drive new revenue in Ammonia Market?

Scope of the Report

Report Metric Details
Market size available for years 2022-2029
Base Year Considered 2024
Forecast period 2023-2029
Forecast units Value (USD Million) and Volume (Kiloton)
Segments covered Type, Sales Channel, Application, and Region
Geographies covered North America, Asia Pacific, Europe, Middle East & Africa, and South America


Key Questions Addressed by the Report

What primary factor is propelling the growth of the ammonia market?
The key factor driving the growth of the ammonia market is the rising agricultural demand for ammonia
How is the ammonia market segmented in terms of end-use industry?
The ammonia market based on the end-use industry is segmented into agriculture, textile, mining, refrigeration, pharmaceutical, and end-use industries.
What are the major challenges in the ammonia market?
Alternative technologies are the major challenge in the ammonia market.
What are the major opportunities in the ammonia market?
Growing emphasis on low-carbon solutions is a key opportunity area in the ammonia market.
Which region has the most significant demand?
The Asia Pacific (APAC) region stands out as having the highest demand for ammonia.
Who are the major manufacturers of ammonia?
Major players in the ammonia market are CF Industries Holdings, Inc. (US), Yara International ASA (Norway), OCI Global (Netherlands), BASF SE (Germany), and Nutrien (Canada).


Personalize This Research

  • Triangulate with your Own Data
  • Get Data as per your Format and Definition
  • Gain a Deeper Dive on a Specific Application, Geography, Customer or Competitor
  • Any level of Personalization
Request A Free Customisation

Let Us Help You

  • What are the Known and Unknown Adjacencies Impacting the Ammonia Market
  • What will your New Revenue Sources be?
  • Who will be your Top Customer; what will make them switch?
  • Defend your Market Share or Win Competitors
  • Get a Scorecard for Target Partners
Customized Workshop Request

Table Of Contents

Exclusive indicates content/data unique to MarketsandMarkets and not available with any competitors.

TITLE
PAGE NO
INTRODUCTION
21
RESEARCH METHODOLOGY
26
EXECUTIVE SUMMARY
36
PREMIUM INSIGHTS
40
MARKET OVERVIEW
43
  • 5.1 INTRODUCTION
  • 5.2 MARKET DYNAMICS
    DRIVERS
    - Rising agricultural demand for ammonia
    - Rising demand for grain and oilseed crops and increasing population
    - Growing demand for refrigeration
    RESTRAINTS
    - Fluctuations in pricing
    - High production costs
    OPPORTUNITIES
    - Growing emphasis on low carbon solutions
    - Increasing demand from emerging markets
    CHALLENGES
    - Alternative technologies
    - Regulatory compliance
INDUSTRY TRENDS
51
  • 6.1 TRENDS AND DISRUPTIONS IMPACTING CUSTOMER BUSINESS
  • 6.2 PRICING ANALYSIS
    AVERAGE SELLING PRICE OF KEY PLAYERS, BY TYPE
    AVERAGE SELLING PRICE TREND OF AMMONIA, BY REGION, 2022–2029
  • 6.3 PORTER’S FIVE FORCES ANALYSIS
    THREAT OF NEW ENTRANTS
    THREAT OF SUBSTITUTES
    BARGAINING POWER OF SUPPLIERS
    BARGAINING POWER OF BUYERS
    INTENSITY OF COMPETITIVE RIVALRY
  • 6.4 KEY STAKEHOLDERS & BUYING CRITERIA
    KEY STAKEHOLDERS IN BUYING PROCESS
    BUYING CRITERIA
  • 6.5 VALUE CHAIN ANALYSIS
  • 6.6 ECOSYSTEM ANALYSIS
  • 6.7 TRADE ANALYSIS
    EXPORT SCENARIO (HS CODE 2814)
    IMPORT SCENARIO (HS CODE 2814)
  • 6.8 TECHNOLOGY ANALYSIS
    KEY TECHNOLOGIES
    - Haber-Bosch Process
    - Electrochemical Nitrogen Reduction
    COMPLEMENTARY TECHNOLOGIES
    - Renewable Energy Integration
    - Advanced Heat Recovery Systems
  • 6.9 IMPACT OF GEN AI ON AMMONIA MARKET
    INTEGRATING AI IN AMMONIA SECTOR
    BEST PRACTICES TO LEVERAGE AI FOR AMMONIA MARKET
    USE CASES OF AI IN AMMONIA MARKET
  • 6.10 REGULATORY LANDSCAPE
    REGULATORY BODIES, GOVERNMENT AGENCIES, AND OTHER ORGANIZATIONS
  • 6.11 CASE STUDY ANALYSIS
    GREEN AMMONIA IMPACT ASSESSMENT CASE STUDY
    AMMONIA WASTEWATER TREATMENT
  • 6.12 PATENT ANALYSIS
    METHODOLOGY
    PATENT ANALYSIS
  • 6.13 KEY CONFERENCES & EVENTS, 2024–2025
  • 6.14 MACROECONOMIC ANALYSIS
    INTRODUCTION
    GDP
  • 6.15 INVESTMENT & FUNDING SCENARIO
AMMONIA MARKET, BY TYPE
74
  • 7.1 INTRODUCTION
  • 7.2 ANHYDROUS
    GROWING SIGNIFICANCE IN FERTILIZER PRODUCTION
  • 7.3 AQUEOUS
    RISING DEMAND FOR EFFICIENT WATER TREATMENT SOLUTIONS
AMMONIA MARKET, BY SALES CHANNEL
77
  • 8.1 INTRODUCTION
  • 8.2 DIRECT
    STRONG DEMAND FROM LARGE-SCALE BUYERS
  • 8.3 INDIRECT
    GROWTH OF E-COMMERCE SECTOR
AMMONIA MARKET, BY END-USE INDUSTRY
80
  • 9.1 INTRODUCTION
  • 9.2 AGRICULTURE
    CRUCIAL FOR SUSTAINING AGRICULTURAL PRODUCTIVITY
  • 9.3 TEXTILE
    GROWING DEMAND FOR HIGH-QUALITY TEXTILES
  • 9.4 REFRIGERATION
    RAPID EXPANSION OF COLD CHAIN LOGISTICS SECTOR
  • 9.5 MINING
    GROWING USE AS LEACHING AGENT IN EXTRACTING AND PROCESSING METALS
  • 9.6 PHARMACEUTICAL
    RISING AGING POPULATION AND CHRONIC DISEASES
  • 9.7 OTHER END-USE INDUSTRIES
AMMONIA MARKET, BY REGION
86
  • 10.1 INTRODUCTION
  • 10.2 ASIA PACIFIC
    CHINA
    - High use of ammonia for clean energy transition
    INDIA
    - Expansion of food processing industry
    JAPAN
    - Ambitious carbon neutrality strategy for 2050
    INDONESIA
    - Growing agricultural sector
    RESF OF ASIA PACIFIC
  • 10.3 EUROPE
    GERMANY
    - Increasing imports of green ammonia and agricultural demand
    FRANCE
    - Strong export performance to expand market
    UK
    - Green initiatives driving demand for ammonia
    SPAIN
    - Plans to generate substantial quantities of green ammonia by 2030
    ITALY
    - Strong economy and agricultural leadership
    RUSSIA
    - Growing domestic demand and export opportunities
    REST OF EUROPE
  • 10.4 NORTH AMERICA
    US
    - Rising population and global textile demand
    CANADA
    - Leveraging clean energy and incentives to drive market
    MEXICO
    - Strategic role in global trade and investment in ammonia industry
  • 10.5 MIDDLE EAST & AFRICA
    GCC COUNTRIES
    - SAUDI ARABIA
    - UAE
    - Rest of GCC Countries
    IRAN
    - Increasing agricultural productivity
    REST OF MIDDLE EAST & AFRICA
  • 10.6 SOUTH AMERICA
    BRAZIL
    - Initiatives like Project Iracema to produce renewable ammonia
    ARGENTINA
    - Establishment of regulatory framework to drive market
    REST OF SOUTH AMERICA
COMPETITIVE LANDSCAPE
143
  • 11.1 OVERVIEW
  • 11.2 KEY PLAYER STRATEGIES/RIGHT TO WIN
  • 11.3 MARKET SHARE ANALYSIS
  • 11.4 REVENUE ANALYSIS
  • 11.5 COMPANY VALUATION & FINANCIAL METRICS
  • 11.6 COMPANY VALUATION
  • 11.7 FINANCIAL MATRIX
  • 11.8 BRAND/PRODUCT COMPARISON
  • 11.9 COMPANY EVALUATION MATRIX: KEY PLAYERS, 2023
    STARS
    EMERGING LEADERS
    PERVASIVE PLAYERS
    PARTICIPANTS
    COMPANY FOOTPRINT: KEY PLAYERS, 2023
    - Company footprint
    - Type footprint
    - Sales channel footprint
    - End-use industry footprint
    - Region footprint
  • 11.10 COMPANY EVALUATION MATRIX: STARTUPS/SMES, 2023
    PROGRESSIVE COMPANIES
    RESPONSIVE COMPANIES
    DYNAMIC COMPANIES
    STARTING BLOCKS
    COMPETITIVE BENCHMARKING
    - Detailed list of key startups/SMEs
    - Competitive benchmarking of key startups/SMEs
  • 11.11 COMPETITIVE SCENARIO
    PRODUCT LAUNCHES
    DEALS
    EXPANSIONS
    OTHER DEVELOPMENTS
COMPANY PROFILES
170
  • 12.1 KEY PLAYERS
    CF INDUSTRIES HOLDINGS, INC.
    - Business overview
    - Products/Solutions/Services offered
    - Recent developments
    - MnM view
    YARA INTERNATIONAL ASA
    - Business overview
    - Products/Solutions/Services offered
    - Recent developments
    - MnM view
    SAUDI BASIC INDUSTRIES CORPORATION
    - Business overview
    - Products/Solutions/Services offered
    - Recent developments
    - MnM view
    OCI GLOBAL
    - Business overview
    - Products/Solutions/Services offered
    - Recent developments
    - MnM view
    BASF SE
    - Business overview
    - Products/Solutions/Services offered
    - Recent developments
    - MnM view
    NUTRIEN
    - Business overview
    - Products/Solutions/Services offered
    - Recent developments
    - MnM view
    QATAR FERTILISER COMPANY
    - Business overview
    - Products/Solutions/Services offered
    - Recent developments
    - MnM view
    KOCH FERTILIZER, LLC
    - Business overview
    - Products/Solutions/Services offered
    - Recent developments
    - MnM view
    EUROCHEM GROUP
    - Business overview
    - Products/Solutions/Services offered
    - Recent developments
    - MnM view
    CSBP LIMITED
    - Business overview
    - Products/Solutions/Services offered
    - MnM view
  • 12.2 OTHER PLAYERS
    GROUP DF
    GUJARAT STATE FERTILIZERS & CHEMICALS LIMITED
    JSC TOGLIATTIAZOT
    PT PUPUK SRIWIDJAJA PALEMBANG
    GULF COAST AMMONIA LLC
    DEEPAK FERTILISERS AND PETROCHEMICALS CORPORATION LIMITED
    JAYSONS CHEMICAL INDUSTRIES
    MYSORE AMMONIA PVT. LTD.
    STEELMAN GASES PVT. LTD.
    SUMITOMO CHEMICAL CO., LTD.
    SURAT AMMONIA AND CHEMICAL COMPANY
    J.R. SIMPLOT COMPANY
    ANMOL CHEMICALS PRIVATE LIMITED
    UBE CORPORATION
    GRUPA AZOTY S.A.
ADJACENT & RELATED MARKET
218
  • 13.1 INTRODUCTION
  • 13.2 LIMITATIONS
    REFRIGERANTS MARKET
    - Market definition
    - Refrigerants market, by type
    - Refrigerants market, by application
    - Refrigerants market, by region
APPENDIX
225
  • 14.1 DISCUSSION GUIDE
  • 14.2 KNOWLEDGESTORE: MARKETSANDMARKETS’ SUBSCRIPTION PORTAL
  • 14.3 CUSTOMIZATION OPTIONS
  • 14.4 RELATED REPORTS
  • 14.5 AUTHOR DETAILS
LIST OF TABLES
 
  • TABLE 1 GLOBAL MARKET SIZE OF GROCERY RETAIL – TOP 10 COUNTRIES
  • TABLE 2 INDICATIVE PRICING TREND OF TYPE, BY KEY PLAYER, 2023 (USD/KILOGRAM)
  • TABLE 3 AVERAGE SELLING PRICE TREND, BY REGION, 2023–2029 (USD/KILOGRAM)
  • TABLE 4 AMMONIA MARKET: PORTER’S FIVE FORCES ANALYSIS
  • TABLE 5 INFLUENCE OF STAKEHOLDERS ON BUYING PROCESS FOR TOP TWO VERTICALS
  • TABLE 6 KEY BUYING CRITERIA FOR TOP TWO END-USE INDUSTRIES
  • TABLE 7 AMMONIA MARKET: ROLE IN ECOSYSTEM
  • TABLE 8 NORTH AMERICA: REGULATORY BODIES, GOVERNMENT AGENCIES, AND OTHER ORGANIZATIONS
  • TABLE 9 EUROPE: REGULATORY BODIES, GOVERNMENT AGENCIES, AND OTHER ORGANIZATIONS
  • TABLE 10 ASIA PACIFIC: REGULATORY BODIES, GOVERNMENT AGENCIES, AND OTHER ORGANIZATIONS
  • TABLE 11 MIDDLE EAST & AFRICA: REGULATORY BODIES, GOVERNMENT AGENCIES, AND OTHER ORGANIZATIONS
  • TABLE 12 GREEN AMMONIA IMPACT ASSESSMENT CASE STUDY
  • TABLE 13 AMMONIA WASTEWATER TREATMENT
  • TABLE 14 LIST OF PATENTS FOR AMMONIA
  • TABLE 15 DETAILED LIST OF CONFERENCES & EVENTS, 2024–2025
  • TABLE 16 GLOBAL GDP GROWTH PROJECTION, 2021–2028 (USD TRILLION)
  • TABLE 17 AMMONIA MARKET, BY TYPE, 2022–2029 (USD MILLION)
  • TABLE 18 AMMONIA MARKET, BY TYPE, 2022–2029 (KILOTON)
  • TABLE 19 AMMONIA MARKET, BY SALES CHANNEL, 2022–2029 (USD MILLION)
  • TABLE 20 AMMONIA MARKET, BY SALES CHANNEL, 2022–2029 (KILOTON)
  • TABLE 21 AMMONIA MARKET, BY END-USE INDUSTRY, 2022–2029 (USD MILLION)
  • TABLE 22 AMMONIA MARKET, BY END-USE INDUSTRY, 2022–2029 (KILOTON)
  • TABLE 23 AMMONIA MARKET, BY REGION, 2022–2029 (USD MILLION)
  • TABLE 24 AMMONIA MARKET, BY REGION, 2022–2029 (KILOTON)
  • TABLE 25 ASIA PACIFIC: AMMONIA MARKET, BY COUNTRY, 2022–2029 (USD MILLION)
  • TABLE 26 ASIA PACIFIC: AMMONIA MARKET, BY COUNTRY, 2022–2029 (KILOTON)
  • TABLE 27 ASIA PACIFIC: AMMONIA MARKET, BY TYPE, 2022–2029 (USD MILLION)
  • TABLE 28 ASIA PACIFIC: AMMONIA MARKET, BY TYPE, 2022–2029 (KILOTON)
  • TABLE 29 ASIA PACIFIC: AMMONIA MARKET, BY END-USE INDUSTRY, 2022–2029 (USD MILLION)
  • TABLE 30 ASIA PACIFIC: AMMONIA MARKET, BY END-USE INDUSTRY, 2022–2029 (KILOTON)
  • TABLE 31 CHINA: AMMONIA MARKET, BY TYPE, 2022–2029 (USD MILLION)
  • TABLE 32 CHINA: AMMONIA MARKET, BY TYPE, 2022–2029 (KILOTON)
  • TABLE 33 CHINA: AMMONIA MARKET, BY END-USE INDUSTRY, 2022–2029 (USD MILLION)
  • TABLE 34 CHINA: AMMONIA MARKET, BY END-USE INDUSTRY, 2022–2029 (KILOTON)
  • TABLE 35 INDIA: AMMONIA MARKET, BY TYPE, 2022–2029 (USD MILLION)
  • TABLE 36 INDIA: AMMONIA MARKET, BY TYPE, 2022–2029 (KILOTON)
  • TABLE 37 INDIA: AMMONIA MARKET, BY END-USE INDUSTRY, 2022–2029 (USD MILLION)
  • TABLE 38 INDIA: AMMONIA MARKET, BY END-USE INDUSTRY, 2022–2029 (KILOTON)
  • TABLE 39 JAPAN: AMMONIA MARKET, BY TYPE, 2022–2029 (USD MILLION)
  • TABLE 40 JAPAN: AMMONIA MARKET, BY TYPE, 2022–2029 (KILOTON)
  • TABLE 41 JAPAN: AMMONIA MARKET, BY END-USE INDUSTRY, 2022–2029 (USD MILLION)
  • TABLE 42 JAPAN: AMMONIA MARKET, BY END-USE INDUSTRY, 2022–2029 (KILOTON)
  • TABLE 43 INDONESIA: AMMONIA MARKET, BY TYPE, 2022–2029 (USD MILLION)
  • TABLE 44 INDONESIA: AMMONIA MARKET, BY TYPE, 2022–2029 (KILOTON)
  • TABLE 45 INDONESIA: AMMONIA MARKET, BY END-USE INDUSTRY, 2022–2029 (USD MILLION)
  • TABLE 46 INDONESIA: AMMONIA MARKET, BY END-USE INDUSTRY, 2022–2029 (KILOTON)
  • TABLE 47 REST OF ASIA PACIFIC: AMMONIA MARKET, BY TYPE, 2022–2029 (USD MILLION)
  • TABLE 48 REST OF ASIA PACIFIC: AMMONIA MARKET, BY TYPE, 2022–2029 (KILOTON)
  • TABLE 49 REST OF ASIA PACIFIC: AMMONIA MARKET, BY END-USE INDUSTRY, 2022–2029 (USD MILLION)
  • TABLE 50 REST OF ASIA PACIFIC: AMMONIA MARKET, BY END-USE INDUSTRY, 2022–2029 (KILOTON)
  • TABLE 51 EUROPE: AMMONIA MARKET, BY COUNTRY, 2022–2029 (USD MILLION)
  • TABLE 52 EUROPE: AMMONIA MARKET, BY COUNTRY, 2022–2029 (KILOTON)
  • TABLE 53 EUROPE: AMMONIA MARKET, BY TYPE, 2022–2029 (USD MILLION)
  • TABLE 54 EUROPE: AMMONIA MARKET, BY TYPE, 2022–2029 (KILOTON)
  • TABLE 55 EUROPE: AMMONIA MARKET, BY END-USE INDUSTRY, 2022–2029 (USD MILLION)
  • TABLE 56 EUROPE: AMMONIA MARKET, BY END-USE INDUSTRY, 2022–2029 (KILOTON)
  • TABLE 57 GERMANY: AMMONIA MARKET, BY TYPE, 2022–2029 (USD MILLION)
  • TABLE 58 GERMANY: AMMONIA MARKET, BY TYPE, 2022–2029 (KILOTON)
  • TABLE 59 GERMANY: AMMONIA MARKET, BY END-USE INDUSTRY, 2022–2029 (USD MILLION)
  • TABLE 60 GERMANY: AMMONIA MARKET, BY END-USE INDUSTRY, 2022–2029 (KILOTON)
  • TABLE 61 FRANCE: AMMONIA MARKET, BY TYPE, 2022–2029 (USD MILLION)
  • TABLE 62 FRANCE: AMMONIA MARKET, BY TYPE, 2022–2029 (KILOTON)
  • TABLE 63 FRANCE: AMMONIA MARKET, BY END-USE INDUSTRY, 2022–2029 (USD MILLION)
  • TABLE 64 FRANCE: AMMONIA MARKET, BY END-USE INDUSTRY, 2022–2029 (KILOTON)
  • TABLE 65 UK: AMMONIA MARKET, BY TYPE, 2022–2029 (USD MILLION)
  • TABLE 66 UK: AMMONIA MARKET, BY TYPE, 2022–2029 (KILOTON)
  • TABLE 67 UK: AMMONIA MARKET, BY END-USE INDUSTRY, 2022–2029 (USD MILLION)
  • TABLE 68 UK: AMMONIA MARKET, BY END-USE INDUSTRY, 2022–2029 (KILOTON)
  • TABLE 69 SPAIN: AMMONIA MARKET, BY TYPE, 2022–2029 (USD MILLION)
  • TABLE 70 SPAIN: AMMONIA MARKET, BY TYPE, 2022–2029 (KILOTON)
  • TABLE 71 SPAIN: AMMONIA MARKET, BY END-USE INDUSTRY, 2022–2029 (USD MILLION)
  • TABLE 72 SPAIN: AMMONIA MARKET, BY END-USE INDUSTRY, 2022–2029 (KILOTON)
  • TABLE 73 ITALY: AMMONIA MARKET, BY TYPE, 2022–2029 (USD MILLION)
  • TABLE 74 ITALY: AMMONIA MARKET, BY TYPE, 2022–2029 (KILOTON)
  • TABLE 75 ITALY: AMMONIA MARKET, BY END-USE INDUSTRY, 2022–2029 (USD MILLION)
  • TABLE 76 ITALY: AMMONIA MARKET, BY END-USE INDUSTRY, 2022–2029 (KILOTON)
  • TABLE 77 RUSSIA: AMMONIA MARKET, BY TYPE, 2022–2029 (USD MILLION)
  • TABLE 78 RUSSIA: AMMONIA MARKET, BY TYPE, 2022–2029 (KILOTON)
  • TABLE 79 RUSSIA: AMMONIA MARKET, BY END-USE INDUSTRY, 2022–2029 (USD MILLION)
  • TABLE 80 RUSSIA: AMMONIA MARKET, BY END-USE INDUSTRY, 2022–2029 (KILOTON)
  • TABLE 81 REST OF EUROPE: AMMONIA MARKET, BY TYPE, 2022–2029 (USD MILLION)
  • TABLE 82 REST OF EUROPE: AMMONIA MARKET, BY TYPE, 2022–2029 (KILOTON)
  • TABLE 83 REST OF EUROPE: AMMONIA MARKET, BY END-USE INDUSTRY, 2022–2029 (USD MILLION)
  • TABLE 84 REST OF EUROPE: AMMONIA MARKET, BY END-USE INDUSTRY, 2022–2029 (KILOTON)
  • TABLE 85 NORTH AMERICA: AMMONIA MARKET, BY COUNTRY, 2022–2029 (USD MILLION)
  • TABLE 86 NORTH AMERICA: AMMONIA MARKET, BY COUNTRY, 2022–2029 (KILOTON)
  • TABLE 87 NORTH AMERICA: AMMONIA MARKET, BY TYPE, 2022–2029 (USD MILLION)
  • TABLE 88 NORTH AMERICA: AMMONIA MARKET, BY TYPE, 2022–2029 (KILOTON)
  • TABLE 89 NORTH AMERICA: AMMONIA MARKET, BY END-USE INDUSTRY, 2022–2029 (USD MILLION)
  • TABLE 90 NORTH AMERICA: AMMONIA MARKET, BY END-USE INDUSTRY, 2022–2029 (KILOTON)
  • TABLE 91 US: AMMONIA MARKET, BY TYPE, 2022–2029 (USD MILLION)
  • TABLE 92 US: AMMONIA MARKET, BY TYPE, 2022–2029 (KILOTON)
  • TABLE 93 US: AMMONIA MARKET, BY END-USE INDUSTRY, 2022–2029 (USD MILLION)
  • TABLE 94 US: AMMONIA MARKET, BY END-USE INDUSTRY, 2022–2029 (KILOTON)
  • TABLE 95 CANADA: AMMONIA MARKET, BY TYPE, 2022–2029 (USD MILLION)
  • TABLE 96 CANADA: AMMONIA MARKET, BY TYPE, 2022–2029 (KILOTON)
  • TABLE 97 CANADA: AMMONIA MARKET, BY END-USE INDUSTRY, 2022–2029 (USD MILLION)
  • TABLE 98 CANADA: AMMONIA MARKET, BY END-USE INDUSTRY, 2022–2029 (KILOTON)
  • TABLE 99 MEXICO: AMMONIA MARKET, BY TYPE, 2022–2029 (USD MILLION)
  • TABLE 100 MEXICO: AMMONIA MARKET, BY TYPE, 2022–2029 (KILOTON)
  • TABLE 101 MEXICO: AMMONIA MARKET, BY END-USE INDUSTRY, 2022–2029 (USD MILLION)
  • TABLE 102 MEXICO: AMMONIA MARKET, BY END-USE INDUSTRY, 2022–2029 (KILOTON)
  • TABLE 103 MIDDLE EAST & AFRICA: AMMONIA MARKET, BY COUNTRY, 2022–2029 (USD MILLION)
  • TABLE 104 MIDDLE EAST & AFRICA: AMMONIA MARKET, BY COUNTRY, 2022–2029 (KILOTON)
  • TABLE 105 MIDDLE EAST & AFRICA: AMMONIA MARKET, BY TYPE, 2022–2029 (USD MILLION)
  • TABLE 106 MIDDLE EAST & AFRICA: AMMONIA MARKET, BY TYPE, 2022–2029 (KILOTON)
  • TABLE 107 MIDDLE EAST & AFRICA: AMMONIA MARKET, BY END-USE INDUSTRY, 2022–2029 (USD MILLION)
  • TABLE 108 MIDDLE EAST & AFRICA: AMMONIA MARKET, BY END-USE INDUSTRY, 2022–2029 (KILOTON)
  • TABLE 109 GCC COUNTRIES: AMMONIA MARKET, BY TYPE, 2022–2029 (USD MILLION)
  • TABLE 110 GCC COUNTRIES: AMMONIA MARKET, BY TYPE, 2022–2029 (KILOTON)
  • TABLE 111 GCC COUNTRIES: AMMONIA MARKET, BY END-USE INDUSTRY, 2022–2029 (USD MILLION)
  • TABLE 112 GCC COUNTRIES: AMMONIA MARKET, BY END-USE INDUSTRY, 2022–2029 (KILOTON)
  • TABLE 113 SAUDI ARABIA: AMMONIA MARKET, BY TYPE, 2022–2029 (USD MILLION)
  • TABLE 114 SAUDI ARABIA: AMMONIA MARKET, BY TYPE, 2022–2029 (KILOTON)
  • TABLE 115 SAUDI ARABIA: AMMONIA MARKET, BY END-USE INDUSTRY, 2022–2029 (USD MILLION)
  • TABLE 116 SAUDI ARABIA: AMMONIA MARKET, BY END-USE INDUSTRY, 2022–2029 (KILOTON)
  • TABLE 117 UAE: AMMONIA MARKET, BY TYPE, 2022–2029 (USD MILLION)
  • TABLE 118 UAE: AMMONIA MARKET, BY TYPE, 2022–2029 (KILOTON)
  • TABLE 119 UAE: AMMONIA MARKET, BY END-USE INDUSTRY, 2022–2029 (USD MILLION)
  • TABLE 120 UAE: AMMONIA MARKET, BY END-USE INDUSTRY, 2022–2029 (KILOTON)
  • TABLE 121 REST OF GCC COUNTRIES: AMMONIA MARKET, BY TYPE, 2022–2029 (USD MILLION)
  • TABLE 122 REST OF GCC COUNTRIES: AMMONIA MARKET, BY TYPE, 2022–2029 (KILOTON)
  • TABLE 123 REST OF GCC COUNTRIES: AMMONIA MARKET, BY END-USE INDUSTRY, 2022–2029 (USD MILLION)
  • TABLE 124 REST OF GCC COUNTRIES: AMMONIA MARKET, BY END-USE INDUSTRY, 2022–2029 (KILOTON)
  • TABLE 125 IRAN: AMMONIA MARKET, BY TYPE, 2022–2029 (USD MILLION)
  • TABLE 126 IRAN: AMMONIA MARKET, BY TYPE, 2022–2029 (KILOTON)
  • TABLE 127 IRAN: AMMONIA MARKET, BY END-USE INDUSTRY, 2022–2029 (USD MILLION)
  • TABLE 128 IRAN: AMMONIA MARKET, BY END-USE INDUSTRY, 2022–2029 (KILOTON)
  • TABLE 129 REST OF MIDDLE EAST & AFRICA: AMMONIA MARKET, BY TYPE, 2022–2029 (USD MILLION)
  • TABLE 130 REST OF MIDDLE EAST & AFRICA: AMMONIA MARKET, BY TYPE, 2022–2029 (KILOTON)
  • TABLE 131 REST OF MIDDLE EAST & AFRICA: AMMONIA MARKET, BY END-USE INDUSTRY, 2022–2029 (USD MILLION)
  • TABLE 132 REST OF MIDDLE EAST & AFRICA: AMMONIA MARKET, BY END-USE INDUSTRY, 2022–2029 (KILOTON)
  • TABLE 133 SOUTH AMERICA: AMMONIA MARKET, BY COUNTRY, 2022–2029 (USD MILLION)
  • TABLE 134 SOUTH AMERICA: AMMONIA MARKET, BY COUNTRY, 2022–2029 (KILOTON)
  • TABLE 135 SOUTH AMERICA: AMMONIA MARKET, BY TYPE, 2022–2029 (USD MILLION)
  • TABLE 136 SOUTH AMERICA: AMMONIA MARKET, BY TYPE, 2022–2029 (KILOTON)
  • TABLE 137 SOUTH AMERICA: AMMONIA MARKET, BY END-USE INDUSTRY, 2022–2029 (USD MILLION)
  • TABLE 138 SOUTH AMERICA: AMMONIA MARKET, BY END-USE INDUSTRY, 2022–2029 (KILOTON)
  • TABLE 139 BRAZIL: AMMONIA MARKET, BY TYPE, 2022–2029 (USD MILLION)
  • TABLE 140 BRAZIL: AMMONIA MARKET, BY TYPE, 2022–2029 (KILOTON)
  • TABLE 141 BRAZIL: AMMONIA MARKET, BY END-USE INDUSTRY, 2022–2029 (USD MILLION)
  • TABLE 142 BRAZIL: AMMONIA MARKET, BY END-USE INDUSTRY, 2022–2029 (KILOTON)
  • TABLE 143 ARGENTINA: AMMONIA MARKET, BY TYPE, 2022–2029 (USD MILLION)
  • TABLE 144 ARGENTINA: AMMONIA MARKET, BY TYPE, 2022–2029 (KILOTON)
  • TABLE 145 ARGENTINA: AMMONIA MARKET, BY END-USE INDUSTRY, 2022–2029 (USD MILLION)
  • TABLE 146 ARGENTINA: AMMONIA MARKET, BY END-USE INDUSTRY, 2022–2029 (KILOTON)
  • TABLE 147 REST OF SOUTH AMERICA: AMMONIA MARKET, BY TYPE, 2022–2029 (USD MILLION)
  • TABLE 148 REST OF SOUTH AMERICA: AMMONIA MARKET, BY TYPE, 2022–2029 (KILOTON)
  • TABLE 149 REST OF SOUTH AMERICA: AMMONIA MARKET, BY END-USE INDUSTRY, 2022–2029 (USD MILLION)
  • TABLE 150 REST OF SOUTH AMERICA: AMMONIA MARKET, BY END-USE INDUSTRY, 2022–2029 (KILOTON)
  • TABLE 151 OVERVIEW OF STRATEGIES ADOPTED BY KEY PLAYERS IN AMMONIA MARKET, JANUARY 2019–AUGUST 2024
  • TABLE 152 AMMONIA MARKET: DEGREE OF COMPETITION
  • TABLE 153 AMMONIA MARKET: TYPE FOOTPRINT, 2023
  • TABLE 154 AMMONIA MARKET: SALES CHANNEL FOOTPRINT, 2023
  • TABLE 155 AMMONIA MARKET: END-USE INDUSTRY FOOTPRINT
  • TABLE 156 AMMONIA MARKET: REGION FOOTPRINT, 2023
  • TABLE 157 AMMONIA MARKET: LIST OF KEY STARTUPS/SMES
  • TABLE 158 AMMONIA MARKET: COMPETITIVE BENCHMARKING OF KEY STARTUPS/SMES
  • TABLE 159 AMMONIA MARKET: PRODUCT LAUNCHES, JANUARY 2019–AUGUST 2024
  • TABLE 160 AMMONIA MARKET: DEALS, JANUARY 2019–AUGUST 2024
  • TABLE 161 AMMONIA MARKET: EXPANSIONS, JANUARY 2019–AUGUST 2024
  • TABLE 162 AMMONIA MARKET: OTHER DEVELOPMENTS, JANUARY 2019–AUGUST 2024
  • TABLE 163 CF INDUSTRIES HOLDINGS, INC.: COMPANY OVERVIEW
  • TABLE 164 CF INDUSTRIES HOLDINGS, INC.: PRODUCTS/SOLUTIONS/SERVICES OFFERED
  • TABLE 165 CF INDUSTRIES HOLDINGS, INC.: DEALS, JANUARY 2019–AUGUST 2024
  • TABLE 166 CF INDUSTRIES HOLDINGS, INC.: OTHER DEVELOPMENTS, JANUARY 2019–AUGUST 2024
  • TABLE 167 YARA INTERNATIONAL ASA: COMPANY OVERVIEW
  • TABLE 168 YARA INTERNATIONAL ASA: PRODUCTS/SOLUTIONS/SERVICES OFFERED
  • TABLE 169 YARA INTERNATIONAL ASA: DEALS, JANUARY 2019–AUGUST 2024
  • TABLE 170 YARA INTERNATIONAL ASA: EXPANSIONS, JANUARY 2019–AUGUST 2024
  • TABLE 171 SAUDI BASIC INDUSTRIES CORPORATION: COMPANY OVERVIEW
  • TABLE 172 SAUDI BASIC INDUSTRIES CORPORATION: PRODUCTS/SOLUTIONS/ SERVICES OFFERED
  • TABLE 173 SAUDI BASIC INDUSTRIES CORPORATION: DEALS, JANUARY 2019–AUGUST 2024
  • TABLE 174 OCI GLOBAL: COMPANY OVERVIEW
  • TABLE 175 OCI GLOBAL: PRODUCTS/SOLUTIONS/SERVICES OFFERED
  • TABLE 176 OCI GLOBAL: DEALS, JANUARY 2019–AUGUST 2024
  • TABLE 177 OCI GLOBAL: EXPANSIONS, JANUARY 2019–AUGUST 2024
  • TABLE 178 BASF SE: COMPANY OVERVIEW
  • TABLE 179 BASF SE: PRODUCTS/SOLUTIONS/SERVICES OFFERED
  • TABLE 180 BASF SE: PRODUCT LAUNCHES, JANUARY 2019–AUGUST 2024
  • TABLE 181 BASF SE: DEALS, JANUARY 2019–AUGUST 2024
  • TABLE 182 BASF SE: OTHER DEVELOPMENTS, JANUARY 2019–AUGUST 2024
  • TABLE 183 NUTRIEN: COMPANY OVERVIEW
  • TABLE 184 NUTRIEN: PRODUCTS/SOLUTIONS/SERVICES OFFERED
  • TABLE 185 NUTRIEN: DEALS, JANUARY 2019–AUGUST 2024
  • TABLE 186 NUTRIEN: EXPANSIONS, JANUARY 2019–AUGUST 2024
  • TABLE 187 QATAR FERTILISER COMPANY: COMPANY OVERVIEW
  • TABLE 188 QATAR FERTILISER COMPANY: PRODUCTS/SOLUTIONS/SERVICES OFFERED
  • TABLE 189 QATAR FERTILISER COMPANY: DEALS, JANUARY 2019–AUGUST 2024
  • TABLE 190 KOCH FERTILIZER, LLC: COMPANY OVERVIEW
  • TABLE 191 KOCH FERTILIZER, LLC: PRODUCTS/SOLUTIONS/SERVICES OFFERED
  • TABLE 192 KOCH FERTILIZER, LLC: EXPANSIONS, JANUARY 2019–AUGUST 2024
  • TABLE 193 EUROCHEM GROUP: COMPANY OVERVIEW
  • TABLE 194 EUROCHEM GROUP: PRODUCTS/SOLUTIONS/SERVICES OFFERED
  • TABLE 195 EUROCHEM GROUP: DEALS, JANUARY 2019–AUGUST 2024
  • TABLE 196 EUROCHEM GROUP: EXPANSIONS, JANUARY 2019–AUGUST 2024
  • TABLE 197 CSBP LIMITED: COMPANY OVERVIEW
  • TABLE 198 CSBP LIMITED: PRODUCTS/SOLUTIONS/SERVICES OFFERED
  • TABLE 199 GROUP DF: COMPANY OVERVIEW
  • TABLE 200 GUJARAT STATE FERTILIZERS & CHEMICALS LIMITED: COMPANY OVERVIEW
  • TABLE 201 JSC TOGLIATTIAZOT: COMPANY OVERVIEW
  • TABLE 202 PT PUPUK SRIWIDJAJA PALEMBANG: COMPANY OVERVIEW
  • TABLE 203 GULF COAST AMMONIA LLC: COMPANY OVERVIEW
  • TABLE 204 DEEPAK FERTILISERS AND PETROCHEMICALS CORPORATION LIMITED: COMPANY OVERVIEW
  • TABLE 205 JAYSONS CHEMICAL INDUSTRIES: COMPANY OVERVIEW
  • TABLE 206 MYSORE AMMONIA PVT. LTD.: COMPANY OVERVIEW
  • TABLE 207 STEELMAN GASES PVT. LTD.: COMPANY OVERVIEW
  • TABLE 208 SUMITOMO CHEMICAL CO., LTD.: COMPANY OVERVIEW
  • TABLE 209 SURAT AMMONIA AND CHEMICAL COMPANY: COMPANY OVERVIEW
  • TABLE 210 J.R. SIMPLOT COMPANY: COMPANY OVERVIEW
  • TABLE 211 ANMOL CHEMICALS PRIVATE LIMITED: COMPANY OVERVIEW
  • TABLE 212 UBE CORPORATION: COMPANY OVERVIEW
  • TABLE 213 GRUPA AZOTY S.A.: COMPANY OVERVIEW
  • TABLE 214 REFRIGERANTS MARKET, BY TYPE, 2016–2021 (KILOTON)
  • TABLE 215 REFRIGERANTS MARKET, BY TYPE, 2022–2028 (KILOTON)
  • TABLE 216 REFRIGERANTS MARKET, BY TYPE, 2016–2021 (USD MILLION)
  • TABLE 217 REFRIGERANTS MARKET, BY TYPE, 2022–2028 (USD MILLION)
  • TABLE 218 REFRIGERANTS MARKET, BY APPLICATION, 2016–2021 (KILOTON)
  • TABLE 219 REFRIGERANTS MARKET, BY APPLICATION, 2022–2028 (KILOTON)
  • TABLE 220 REFRIGERANTS MARKET, BY APPLICATION, 2016–2021 (USD MILLION)
  • TABLE 221 REFRIGERANTS MARKET, BY APPLICATION, 2022–2028 (USD MILLION)
  • TABLE 222 REFRIGERANTS MARKET, BY REGION, 2016–2021 (KILOTON)
  • TABLE 223 REFRIGERANTS MARKET, BY REGION, 2022–2028 (KILOTON)
  • TABLE 224 REFRIGERANTS MARKET, BY REGION, 2016–2021 (USD MILLION)
  • TABLE 225 REFRIGERANTS MARKET, BY REGION, 2022–2028 (USD MILLION)
LIST OF FIGURES
 
  • FIGURE 1 AMMONIA MARKET: RESEARCH DESIGN
  • FIGURE 2 MARKET SIZE ESTIMATION: TOP-DOWN APPROACH
  • FIGURE 3 MARKET SIZE ESTIMATION: BOTTOM-UP APPROACH
  • FIGURE 4 AMMONIA MARKET: APPROACH 1
  • FIGURE 5 AMMONIA MARKET: APPROACH 2
  • FIGURE 6 AMMONIA MARKET: DATA TRIANGULATION
  • FIGURE 7 ANHYDROUS TO BE LARGER SEGMENT OF AMMONIA MARKET
  • FIGURE 8 DIRECT SALES TO BE LARGER SALES CHANNEL
  • FIGURE 9 AGRICULTURE TO REMAIN LARGEST END-USE INDUSTRY
  • FIGURE 10 ASIA PACIFIC WAS LARGEST AMMONIA MARKET IN 2023
  • FIGURE 11 ASIA PACIFIC TO BE FASTEST-GROWING REGION IN AMMONIA MARKET DURING FORECAST PERIOD
  • FIGURE 12 ANHYDROUS TO LEAD AMMONIA MARKET DURING FORECAST PERIOD
  • FIGURE 13 DIRECT TO LEAD AMMONIA MARKET DURING FORECAST PERIOD
  • FIGURE 14 AGRICULTURE TO BE LARGEST END-USE INDUSTRY SEGMENT OF AMMONIA MARKET DURING FORECAST PERIOD
  • FIGURE 15 CHINA ACCOUNTED FOR LARGEST MARKET SHARE IN ASIA PACIFIC
  • FIGURE 16 INDIA TO REGISTER HIGHEST GROWTH DURING FORECAST PERIOD
  • FIGURE 17 DRIVERS, RESTRAINTS, OPPORTUNITIES, AND CHALLENGES IN AMMONIA MARKET
  • FIGURE 18 GLOBAL FERTILIZER CONSUMPTION FOR NITROGEN (N), PHOSPHATE (P2O5), AND POTASH (K2O), 2019– 2022 (‘000 TONS NUTRIENTS)
  • FIGURE 19 GLOBAL FERTILIZER CONSUMPTION FOR AMMONIA, 2019–2022 (‘000 METRIC TONS OF NUTRIENTS)
  • FIGURE 20 GLOBAL POPULATION GROWTH (BILLION)
  • FIGURE 21 GLOBAL GRAIN AND OILSEED DEMAND (BILLION TONS)
  • FIGURE 22 US MONTHLY DRY NATURAL GAS PRODUCTION AND MONTHLY AVERAGE CITYGATE PRICE, 2019–2022
  • FIGURE 23 TRENDS AND DISRUPTIONS IMPACTING CUSTOMER BUSINESS
  • FIGURE 24 AVERAGE SELLING PRICE TREND OF KEY PLAYERS, BY TYPE, 2023 (USD/KILOGRAM)
  • FIGURE 25 AVERAGE SELLING PRICE TREND OF AMMONIA, BY REGION, 2022–2029 (USD/KILOGRAM)
  • FIGURE 26 AMMONIA MARKET: PORTER’S FIVE FORCES ANALYSIS
  • FIGURE 27 INFLUENCE OF STAKEHOLDERS ON BUYING PROCESS FOR TOP TWO END-USE INDUSTRIES
  • FIGURE 28 KEY BUYING CRITERIA FOR TOP TWO VERTICALS
  • FIGURE 29 AMMONIA MARKET: VALUE CHAIN ANALYSIS
  • FIGURE 30 AMMONIA MARKET: KEY PLAYERS IN ECOSYSTEM
  • FIGURE 31 EXPORT OF AMMONIA, BY KEY COUNTRY, 2019–2023 (USD MILLION)
  • FIGURE 32 IMPORT OF AMMONIA, BY KEY COUNTRY, 2019–2023 (USD MILLION)
  • FIGURE 33 LIST OF SIGNIFICANT PATENTS FOR AMMONIA MARKET, 2013–2023
  • FIGURE 34 INVESTOR DEALS & FUNDING IN AMMONIA
  • FIGURE 35 ANHYDROUS SEGMENT TO LEAD AMMONIA MARKET DURING FORECAST PERIOD
  • FIGURE 36 DIRECT SEGMENT TO LEAD AMMONIA MARKET DURING FORECAST PERIOD
  • FIGURE 37 AGRICULTURE SEGMENT TO LEAD AMMONIA MARKET DURING FORECAST PERIOD
  • FIGURE 38 GEOGRAPHICAL SNAPSHOT: AMMONIA MARKET GROWTH RATE, BY COUNTRY, 2024–2029
  • FIGURE 39 ASIA PACIFIC: AMMONIA MARKET SNAPSHOT
  • FIGURE 40 EUROPE: AMMONIA MARKET SNAPSHOT
  • FIGURE 41 AMMONIA MARKET SHARE ANALYSIS, 2023
  • FIGURE 42 AMMONIA MARKET: REVENUE ANALYSIS OF KEY PLAYERS, 2019–2023 (USD MILLION)
  • FIGURE 43 COMPANY VALUATION, 2024 (USD BILLION)
  • FIGURE 44 FINANCIAL MATRIX: EV/EBITDA RATIO, 2024
  • FIGURE 45 AMMONIA MARKET: BRAND/PRODUCT COMPARISON
  • FIGURE 46 AMMONIA MARKET: COMPANY EVALUATION MATRIX (KEY PLAYERS), 2023
  • FIGURE 47 AMMONIA MARKET: OVERALL COMPANY FOOTPRINT, 2023
  • FIGURE 48 AMMONIA MARKET: COMPANY EVALUATION MATRIX (STARTUPS/SMES), 2023
  • FIGURE 49 CF INDUSTRIES HOLDINGS, INC.: COMPANY SNAPSHOT
  • FIGURE 50 YARA INTERNATIONAL ASA: COMPANY SNAPSHOT
  • FIGURE 51 SAUDI BASIC INDUSTRIES CORPORATION: COMPANY SNAPSHOT
  • FIGURE 52 OCI GLOBAL: COMPANY SNAPSHOT
  • FIGURE 53 BASF SE: COMPANY SNAPSHOT
  • FIGURE 54 NUTRIEN: COMPANY SNAPSHOT

The study involved four major activities for estimating the current size of the global ammonia market. Exhaustive secondary research was carried out to collect information on the market, the peer product market, and the parent product group market. The next step was to validate these findings, assumptions, and sizes with the industry experts across the value chain of ammonia through primary research. Both the top-down and bottom-up approaches were employed to estimate the overall size of the ammonia market. After that, market breakdown and data triangulation procedures were used to determine the size of different segments and sub-segments of the market.

Secondary Research

The market for the companies offering ammonia is arrived at by secondary data available through paid and unpaid sources, analyzing the product portfolios of the major companies in the ecosystem, and rating the companies by their performance and quality. Various secondary sources such as Business Standard, Bloomberg, World Bank, and Factiva were referred to, to identify and collect information for this study on the ammonia market. The secondary sources include annual reports, press releases, investor presentations of companies, white papers, journals, certified publications, and articles from recognized authors, directories, and databases. In the secondary research process, various secondary sources were referred to for identifying and collecting information related to the study. Secondary sources included annual reports, press releases, and investor presentations of ammonia vendors, forums, certified publications, and whitepapers. The secondary research was used to obtain critical information on the industry’s value chain, the total pool of key players, market classification, and segmentation from the market and technology-oriented perspectives.

Primary Research

In the primary research process, various primary sources from both the supply and demand sides were interviewed to obtain qualitative and quantitative information for this report. The primary sources from the supply side included industry experts, such as Chief Executive Officers (CEOs), Vice Presidents (VPs), marketing directors, technology and innovation directors, and related key executives from various key companies and organizations operating in the ammonia market. After the complete market engineering (calculations for market statistics, market breakdown, market size estimations, market forecasting, and data triangulation), extensive primary research was conducted to gather information and verify and validate the critical numbers arrived at. Primary research was also conducted to identify the segmentation types, industry trends, competitive landscape of ammonia offered by various market players, and key market dynamics, such as drivers, restraints, opportunities, challenges, industry trends, and key player strategies. In the complete market engineering process, the top-down and bottom-up approaches were extensively used, along with several data triangulation methods, to perform the market estimation and market forecasting for the overall market segments and subsegments listed in this report. Extensive qualitative and quantitative analysis was performed on the complete market engineering process to list the key information/insights throughout the report.

Following is the breakdown of primary respondents—

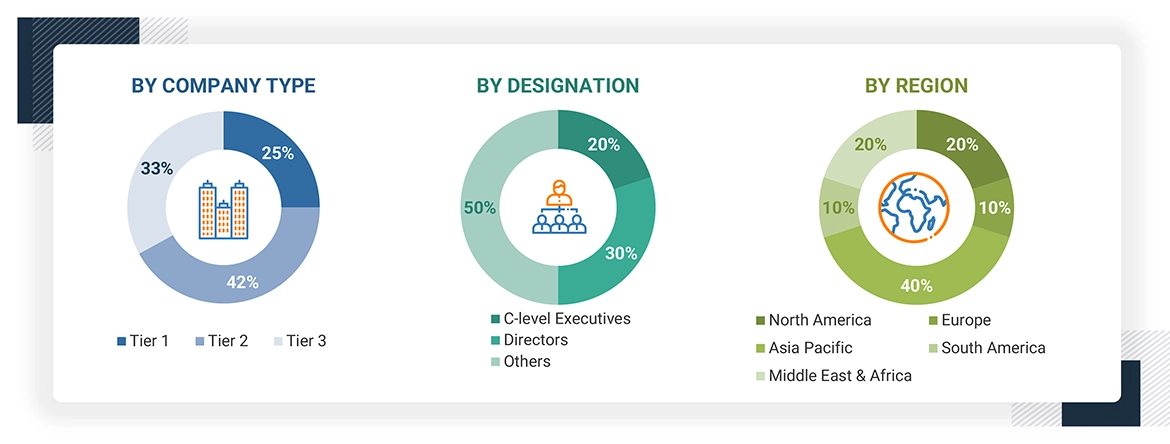
Notes: Others include sales, marketing, and product managers.

Tier 1: >USD 1 Billion; Tier 2: USD 500 million–1 Billion; and Tier 3: < USD 500 million.

To know about the assumptions considered for the study, download the pdf brochure

Market Size Estimation

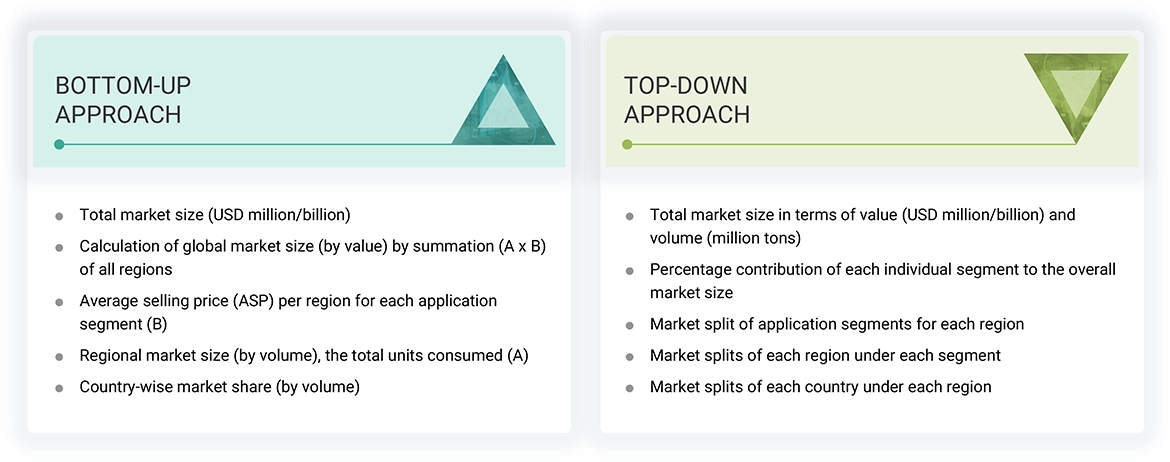
Both the top-down and bottom-up approaches were used to estimate and validate the global size of the ammonia market. These approaches were also used extensively to estimate the size of various dependent segments of the market. The research methodology used to estimate the market size included the following:

Data Triangulation

After arriving at the overall market size using the market size estimation processes explained above, the market was split into several segments and subsegments. The data triangulation and market breakup procedures were employed, wherever applicable, to complete the overall market engineering process and arrive at the exact statistics of each market segment and subsegment. The data was triangulated by studying various factors and trends from both the demand and supply sides.

Market Definition

Ammonia is a gas composed of nitrogen and hydrogen. It is a colorless and toxic gas with a distinctive, unpleasant odor. Naturally, ammonia is produced by bacteria and the decomposition of plants and animals, and it can be found in water, soil, and air. In the laboratory, ammonia can be liquefied and is used in a range of products, including medicines, fertilizers, and household cleaning agents. Ammonia is a crucial precursor in the synthesis of various chemicals, such as urea and nitric acid, which are vital for numerous industrial applications. Its broad utility and effectiveness make it an essential chemical across many industries. Ammonia is utilized as a refrigerant gas, in water purification, fertilizers, medicines, household, industrial, and the production of plastics, explosives, fabrics, pesticides, dyes, and other chemicals.
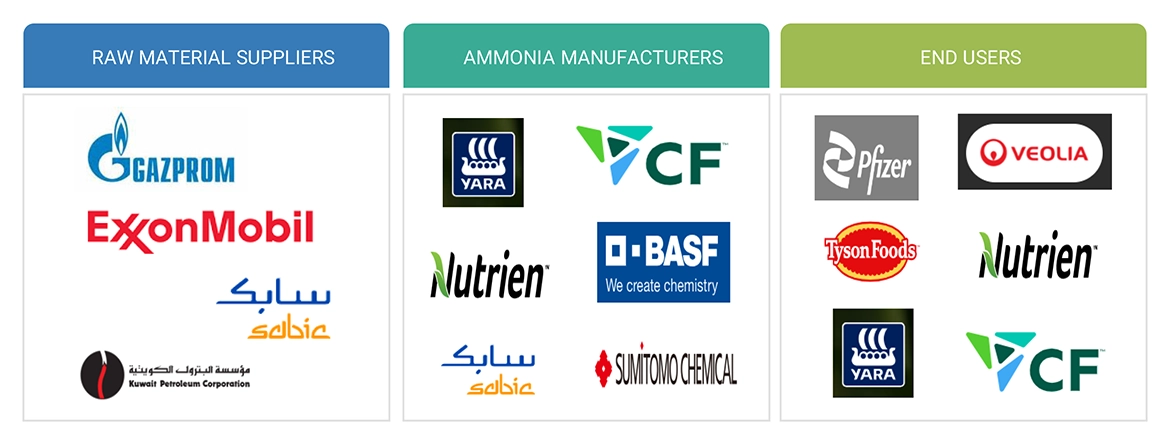
Stakeholders

  • Ammonia Manufacturers
  • Ammonia Suppliers
  • Chemical Manufacturers
  • Logistics and Distribution Companies
  • Research & Development Entities
  • Industry Associations and Regulatory Bodies
  • End Users

Report Objectives

  • To estimate and forecast the ammonia  market, in terms of value and volume
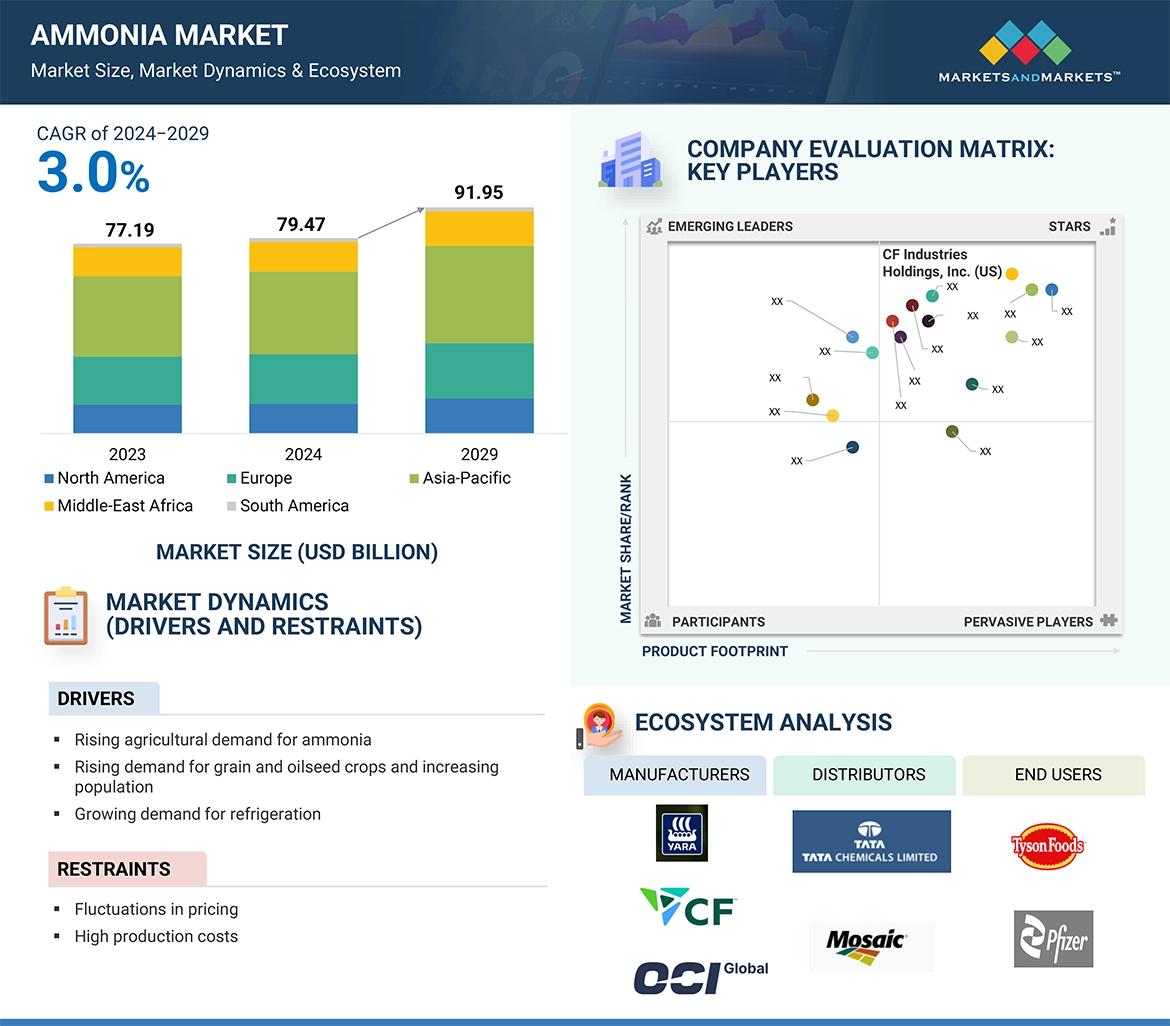
  • To provide detailed information about the major factors (drivers, restraints, opportunities, and challenges) influencing the market growth
  • To define, describe, and forecast the market size, based on types, sales channel, end-use industry, and region
  • To forecast the market size along with segments and submarkets, in key regions: North America, Europe, Asia Pacific (APAC), Middle East & Africa (MEA), and South America along with their key countries
  • To strategically analyze micro markets, for individual growth trends, prospects, and their contribution to the total market
  • To analyze growth opportunities in the market for stakeholders and provide details on the competitive landscape for market leaders
  • To strategically profile key players and comprehensively analyze their market shares and core competencies
  • To analyze competitive developments, such as acquisition, agreements, expansions and partnerships in the ammonia  market

Previous Versions of this Report

Custom Market Research Services

We Will Customise The Research For You, In Case The Report Listed Above Does Not Meet With Your Requirements

Get 10% Free Customisation

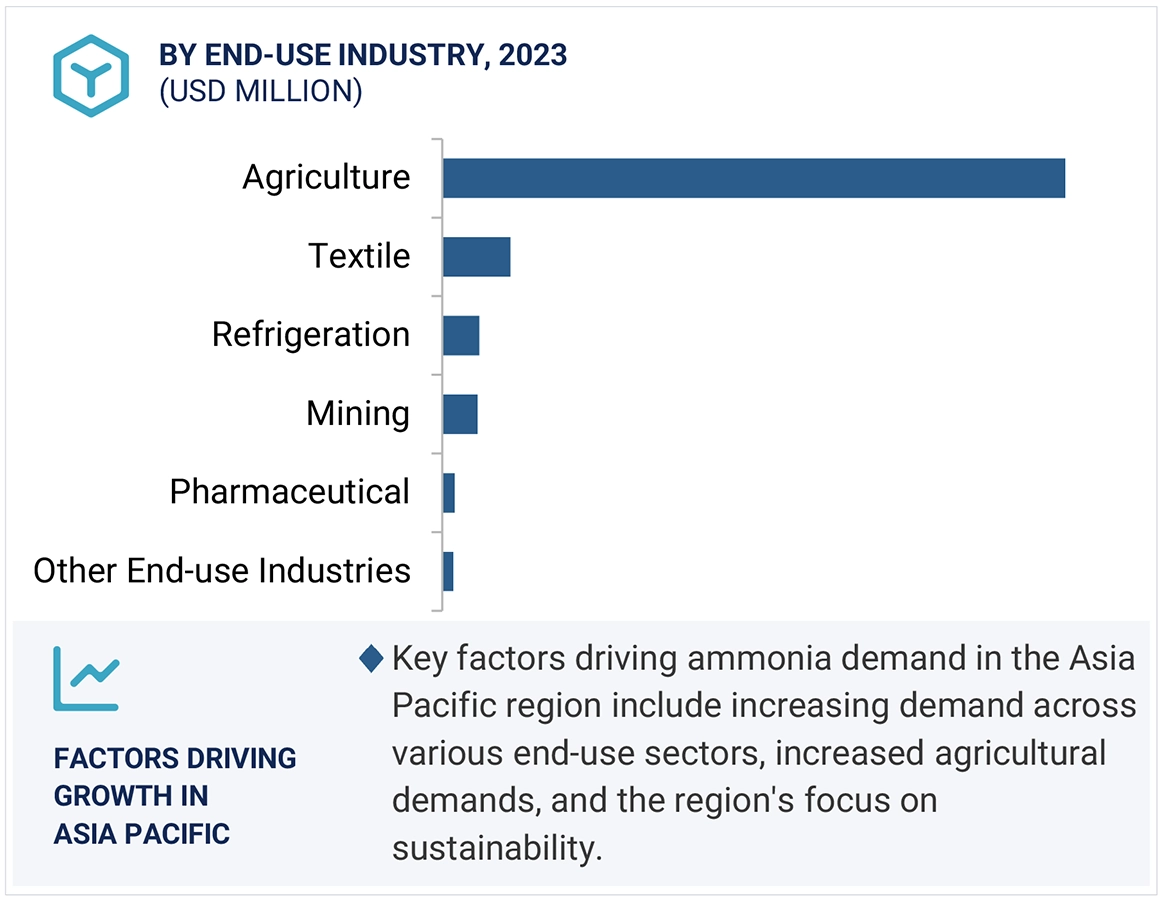
Growth opportunities and latent adjacency in Ammonia Market

DMCA.com Protection Status