Air Suspension Market

Air Suspension Market by Component (Air Spring, Compressor, ECU, Tank, Solenoid Valve, Height & Pressure Sensor), Technology (Electric, Non-Electric), Cab Suspension, Vehicle Type (Rigid, Semi-trailers), Aftermarket & Region - Global Forecast to 2030

Report Code: AT 4470 Aug, 2024, by marketsandmarkets.com

[281 Pages Report] The air suspension market is expected to reach USD 13.9 billion by 2030, up from USD 10.0 billion in 2024, with a CAGR of 5.6%. The market is primarily driven by consumer preference for vehicle comfort and safety and the widespread adoption of air suspension systems in heavy commercial vehicles (HCVs). Heavy trucks are commonly equipped with air suspension systems due to their capacity to carry heavy and variable loads, which can significantly affect their stability and handling. These systems automatically adjust the vehicle height and stiffness based on the load, ensuring optimal performance and safety. Additionally, air suspension systems require ample space, making trucks well-suited for installation. This will, in turn, raise the demand for heavy commercial vehicles, including trucks and buses, in the coming years.

Air Suspension Market

To know about the assumptions considered for the study, Request for Free Sample Report

Air Suspension Market Opportunities

To know about the assumptions considered for the study, download the pdf brochure

Market Dynamics

Driver: Surge in heavy commercial vehicle sales

In recent years, the global demand for commercial vehicles has increased significantly. OICA reported that commercial vehicle sales increased from 23.0 million units in 2021 to 26.4 million units in 2023. This growth can be attributed to increasing infrastructure spending, rising import-export trade, urbanization, growing e-commerce activities, the construction industry for residential and industrial applications, smart-city projects, and last-mile delivery services. With improving economic and technological advancements and regulatory changes, the global demand for heavy-duty vehicles will continue growing.

In North America and Europe, most heavy trucks, multi-axle buses, and semi-trailer trucks have air suspension as a standard fitment. These models include Volvo FH, Volvo 9700, Mercedes-Benz Citaro, Scania Touring HD, MAN Lion’s Coach Mercedes Actros, Freightliner Cascadia, Scania R-series, Iveco Trakker, Eurocargo, Kenworth C500, T440, T470, T800 and W900. Meanwhile, the global demand for premium vehicles has also grown with a shift in consumer demand for comfort and safety. The developed nations of Europe and North America, along with Asia Pacific countries such as China, Japan, and South Korea, are key markets for these vehicles. Therefore, the global rise in commercial vehicle sales, along with upcoming regulations on cabin comfort for heavy trucks and semi-trailers, would encourage OEMs to offer air suspension systems in heavy trucks.

Restraint: High development and adoption costs

Technological innovations have significantly propelled the market for air suspension systems. However, these modern electronically controlled air-suspended systems are more complex. Design, prototyping, and production require significant investment, resulting in higher costs and longer development times. The integration of additional sensors, solenoid valves, and electronic control units into existing vehicle models necessitates significant design modifications, further raising the cost of air suspension systems. In developed regions such as Europe and North America, there is an increasing demand for premium segment vehicles, which prompts the adoption of advanced technologies. However, in price-sensitive markets such as Asia Pacific and the Rest of the World, economy-segment cars are commonly preferred. Therefore, due to the high cost of air suspension systems, OEMs are hesitant to integrate these systems into mid-segment vehicles, especially in developing countries. This may restrain the growth of the air suspension market.

Opportunity: Trend of lightweight air suspension systems

The trend of lightweight vehicles has helped OEMs decrease CO2 emissions and increase fuel efficiency. Light-duty vehicles’ suspension systems and chassis constitute 22–27% of the vehicle weight, including the suspension, steering, brake, tires, and wheels. Conventional suspension systems are heavy, increasing vehicle weight and fuel consumption. Suspension makers are continually searching for the optimum blend of material content in a chassis and components, lowering the weight without compromising the performance. For instance, Kenworth Truck Company (US) succeeded in decreasing the suspension system weight by 400 pounds with the help of an air-ride suspension system. Similarly, SAF Holland SE (Germany) presented a lightweight CBX23 AeroBeam fixed frame air suspension, which gives a balance between power and weight for improved performance in heavy trucks. The textile-reinforced rubber air springs reduce the weight of the suspension systems. Such initiatives would prompt other players to develop lightweight air suspension systems and related components to tap new business opportunities in the coming years.

Challenge: Significant presence of local suppliers

Prominent air suspension manufacturers such as Continental AG (Germany), ZF Friedrichshafen AG (Germany),  ThyssenKrupp AG (Germany), Hendrickson USA, L.L.C. (US), and Firestone Industrial Products LLC (US) offer a wide range of air suspensions and related components in the OEM market. These manufacturers also offer after-sale services for vehicles. Customers mostly prefer to install air suspension systems in their vehicles through aftermarket. Local players such as Air Lift Company (US), Arnott, RideTech (US), and Gibraltar Air Springs (India) also offer air suspension components in the aftermarket for passenger cars and commercial vehicles. These companies primarily focus on the customized automotive air suspension market, which can impede the growth of more extensive, established companies. The need for replacement and retrofit solutions is anticipated to expand with the growing popularity of air suspension systems. This intense competition may further hinder the expansion of well-established players in the air suspension market.

Air Suspension Market Ecosystem

Air suspension manufacturers have the latest technologies, diversified portfolios, and strong global distribution networks. These manufacturers include ZF Friedrichshafen AG (Germany), Cummins-Meritor Inc. (US), SAF Holland SE (Germany), ThyssenKrupp AG (Germany), and Continental AG (Germany). The ecosystem analysis highlights various players in the air suspension ecosystem, primarily representing component providers, manufacturers, and automotive OEMs.

Top Companies in Air Suspension Market

Electrotonically controlled air suspension systems to be fastest-growing segment by technology

The electronically controlled segment is expected to exhibit the fastest growth, driven by technological innovations. Many electric and hybrid vehicles are positioned in the premium class segment, mainly equipped with advanced suspension systems to meet consumer demand for performance and luxury. Asia Pacific secures the largest share of electronically controlled air suspension systems, followed by Europe, due to higher technological adoption and wider acceptance. Several passenger car models in Europe, including the Audi e-Tron, Audi e-Tron GT, Mercedes EQE, Mercedes EQS, Porsche Taycan, Jaguar I-pace, SYD Tang EV, Rivian RIS, and Rivian RIT, are equipped with these systems. Similarly, heavy-duty trucks with electronically controlled air suspension improve stability by automatically responding to load and road conditions changes. Maximizing the vehicle’s height for improved aerodynamics increases fuel efficiency, minimizes wear on the vehicle, and enhances safety and handling. The rapid adoption of these systems in heavy-duty vehicles will further impact the growth of electronically controlled air suspension systems in the coming years.

Trucks to be largest segment by vehicle type

The trucks segment is expected to secure a leading position in the air suspension market due to the need for improved ride quality in specialized applications such as refrigerated trucks and the delivery of sensitive commodities. Asia Pacific is witnessing substantial economic growth in this segment, especially in China and India, due to rising demand for trucks and other commercial vehicles. Domestic manufacturers have begun using air suspension systems in their models, subject to stringent environmental laws and high consumer demand for ride comfort. This, in turn, propels the air springs market for trucks in the region.

Asia Pacific to surpass other regions

Asia Pacific is a prominent market in the global automotive industry, accounting for over 40% of the world’s truck and bus production. This output is further complemented by the OEMs’ increasing tendency to incorporate air suspension systems into high-end trucks and buses to meet the rising demand in this segment. The region has also seen a surge in the sales of luxury passenger cars and premium SUVs, attributed to the growing purchasing power of consumers. This shift in consumer preference toward more luxurious vehicles necessitates a smoother ride, prompting OEMs to more frequently adopt air suspension systems in the luxury and SUV segments.

Key countries such as China, India, Japan, and South Korea dominate the region’s car ownership landscape, significantly influencing the market dynamics. China, with its vast population, has a high demand for passenger cars, keeping it at the forefront of the market. Meanwhile, India is experiencing rapid growth in the air suspension control system market, propelled by the increasing demand for passenger cars and a preference for personal mobility. The substantial public transport network in India, especially in its larger cities, is driving the need for a more comfortable ride experience, further boosting the air suspension market’s growth.

To capitalize on this growing market, global suppliers are keen to strengthen their presence in the Asia Pacific region. For example, Wabco (US) signed a long-term agreement with Hyundai Motor Company (South Korea). Under this agreement, Wabco will supply a wide range of its advanced technologies, including electronically controlled air suspension systems and air processing units, to Hyundai’s new medium-duty trucks. Such initiatives from regional OEMs are poised to create lucrative business opportunities for air suspension manufacturers, particularly in the trucks segment.

Asia pacific: air suspension market snapshot

Air Suspension Market Size, and Share

Key Players

Prominent players in the air suspension market are ZF Friedrichshafen AG (Germany), ThyssenKrupp AG (Germany), Continental AG (Germany), Cummins-Meritor Inc. (US), and SAF Holland (Germany). These players have adopted various strategies, such as product launches/developments, partnerships, agreements, and expansions, to strengthen their position in the market.

Want to explore hidden markets that can drive new revenue in Air Suspension Market?

Scope of the Report

Along with the given market data, MarketsandMarkets offers customizations in accordance with the company’s specific needs.

The study segments the Air Suspension system market:

Report Metric

Detail

Market size available for years

2019–2030

Base year considered

2023

Forecast period

2024–2030

Forecast units

Volume (Units) and Value (USD Million)

Segments Covered

OE Market By Component, By Technology,  By Vehicle Type, Cabin Air Suspension Market By Vehicle Type, Aftermarket By Component, Electric & Hybrid Vehicle Air Suspension Market By Vehicle Type, Electric & Hybrid Vehicle Air Suspension Market By Technology, and By Region

Geographies covered

Asia Pacific, North America, Europe, and Rest of the World

Companies covered

ZF Friedrichshafen AG (Germany), Continental AG (Germany), ThyssenKrupp AG (Germany), Cummins-Meritor Inc. (US), Mando Corporation (South Korea), SAF—Holland SE (Germany), Hendrickson USA, L.L.C. (US), Firestone Industrial Products Company, LLC (US) Vibracoustic SE (Germany), BWI Group (China), Arnott INC. (US), Airlift Company (US), Infinity Engineered Products (US), Dunlop (UK), VB Air Suspension (Netherlands), Link (US), Universal Air Suspension (US), Liftmatic Air Springs (US), Stemco (US), Shanghai Komman (China), Parker Hannifin Corporation (US), Jamna Auto Industries Ltd. (India), Accuair Suspension (US)

OE Market, by Component
  • Air springs
  • Shock Absorbers
  • Air Compressors
  • Electronic Control Units
  • Air Reservoirs
  • Height Sensors
  • Solenoid Valves
  • Pressure Sensors
OE Market, by Technology
  • Electronically-controlled
  • Non-Electronically controlled
OE Market, By Vehicle Type
  • Passenger Cars
  • LCVs
  • Buses
  • Trucks
Cabin Air Suspension Market,  by vehicle type
  • Sem-Trailers
  • Rigid Truck
  • Aftermarket, By Component
  • Air Bellows
  • Shock Absorbers  bushes
Electric & Hybrid HDVs Air Suspension Market, By Vehicle Type
  • LDVs
  • Buses
  • Trucks
Electric & Hybrid HDVs Air Suspension Market, by Technology
  • Electronically-controlled
  • Non-Electronically controlled
By Region
  • Asia Pacific
  • North America
  • Europe
  • Rest of the World [RoW]

Recent Developments

  • In March 2024, Hendrickson USA, L.L.C. introduced ROADMAAX Z, its lightest rear air suspension with a 46,000-lb. capacity. This system offers excellent performance on- and off-highway, as well as quality ride and cargo protection, and is approved for use with lift axles and for up to 25% of off-highway operations. ROADMAAX Z features patented Zero Maintenance Damping (ZMD) technology, ensuring a consistent ride throughout the air spring’s lifespan, thus setting a new standard for heavy-duty drive axle air suspension systems.
  • In July 2023, Hendrickson USA, L.L.C. launched its air and mechanical suspensions and axles for trailer applications in India. The products include the Hendrickson Severe Duty Suspension (HSDS) premium suspension, which is available in capacities ranging from 12T to 14T for the Indian market. The HSDS system incorporates a tire inflation and deflation system (Tiremaax Pro) and patented Tri-functional bushings.
  • In November 2022, ZF Aftermarket, a division of ZF Friedrichshafen AG, unveiled its new line of air springs of superior Sachs quality. As vehicle air suspension systems become more advanced and complex, repair work on air suspensions presents a fresh challenge for automotive workshops. ZF’s product experts have now made air spring replacement hassle-free for workshops with this new range. Alongside model-specific service information, special training courses on air suspension will also be available.
  • In June 2022, Cummins-Meritor, Inc. introduced the ProTec Independent Front Suspension (IFS) for motorcoach applications. The new IFS MIS-20E is the first suspension specifically designed to meet the demands of large load carrying and ride quality in motor coaches. This solution is the first fully integrated suspension and steering system offered by the firm as a drop-in replacement for bus and coach makers.
  • In March 2021, ThyssenKrupp AG launched a new production line for dampers at the company’s automotive facility in Changzhou. The new plant now manufactures electronically adjustable damping systems. These semi-active dampers use sensors to detect vibrations during travel, analyzing driving conditions and the vehicle’s status.

Frequently Asked Questions (FAQ):

To speak to our analyst for a discussion on the above findings, click Speak to Analyst

Exclusive indicates content/data unique to MarketsandMarkets and not available with any competitors.

INTRODUCTION
26
RESEARCH METHODOLOGY
32
EXECUTIVE SUMMARY
44
PREMIUM INSIGHTS
48
MARKET OVERVIEW
53
  • 5.1 INTRODUCTION
  • 5.2 MARKET DYNAMICS
    DRIVERS
    - Increasing commercial vehicle sales
    - Rising consumer demand for premium passenger cars
    RESTRAINTS
    - High development cost of air suspension for mid-segment cars
    OPPORTUNITIES
    - Emerging trend of lightweight air suspension systems
    - Aftermarket demand for air suspensions and related components
    - Expansion of electric and hybrid vehicles
    CHALLENGES
    - Significant presence of local suppliers
  • 5.3 TRENDS AND DISRUPTIONS IMPACTING CONSUMERS’ BUSINESSES
  • 5.4 ECOSYSTEM ANALYSIS
    AIR SUSPENSION SYSTEM MANUFACTURERS
    AIR SUSPENSION COMPONENT SUPPLIERS
    OEMS
  • 5.5 TECHNOLOGY ANALYSIS
    KEY TECHNOLOGY
    - Electronically controlled air suspension system
    - Electronic shock absorber control system
    COMPLEMENTARY TECHNOLOGY
    - Electronic suspension system
    ADJACENT TECHNOLOGY
    - By-wire system
  • 5.6 SUPPLY CHAIN ANALYSIS
  • 5.7 PRICING ANALYSIS
    AVERAGE SELLING PRICE, BY VEHICLE TYPE
    AVERAGE SELLING PRICE, BY TECHNOLOGY
    AVERAGE SELLING PRICE, BY REGION
  • 5.8 INVESTMENT AND FUNDING SCENARIO
  • 5.9 KEY STAKEHOLDERS AND BUYING CRITERIA
    KEY STAKEHOLDERS IN BUYING PROCESS
    BUYING CRITERIA
  • 5.10 PATENT ANALYSIS
  • 5.11 CASE STUDY ANALYSIS
    HENDRICKSON’S CREO CAD SUSPENSION
    VOLVO’S MODIFIED AXLE TRUCK CONFIGURATION
    CONTINENTAL’S HITEMP AIR SPRING
  • 5.12 TRADE ANALYSIS
    IMPORT DATA OF (HARMONIZED SYSTEM CODE: 870880) AIR SUSPENSION SYSTEMS AND PARTS
    EXPORT DATA OF (HARMONIZED SYSTEM CODE: 870880) AIR SUSPENSION SYSTEMS AND PARTS
  • 5.13 REGULATORY LANDSCAPE
    REGULATORY BODIES, GOVERNMENT AGENCIES, AND OTHER ORGANIZATIONS
    GLOBAL SAFETY REGULATIONS
  • 5.14 KEY CONFERENCES AND EVENTS, 2024–2025
  • 5.15 SUPPLIER ANALYSIS
AIR SUSPENSION MARKET, BY VEHICLE TYPE
99
  • 6.1 INTRODUCTION
  • 6.2 PASSENGER CARS
    INCREASING PRODUCTION IN EMERGING ECONOMIES TO DRIVE MARKET
  • 6.3 LIGHT COMMERCIAL VEHICLES
    PREDOMINANCE IN NORTH AMERICA TO DRIVE MARKET
  • 6.4 TRUCKS
    INNOVATIONS IN AIR SUSPENSION TECHNOLOGY TO DRIVE MARKET
  • 6.5 BUSES
    FOCUS ON PASSENGER COMFORT AND SAFETY TO DRIVE MARKET
  • 6.6 INDUSTRY INSIGHTS
AIR SUSPENSION MARKET, BY TECHNOLOGY
109
  • 7.1 INTRODUCTION
  • 7.2 ELECTRONICALLY CONTROLLED
    BENEFITS OVER TRADITIONAL AIR SUSPENSION SYSTEMS TO DRIVE MARKET
  • 7.3 NON-ELECTRONICALLY CONTROLLED
    LOW COST AND MAINTENANCE REQUIREMENTS TO DRIVE MARKET
  • 7.4 INDUSTRY INSIGHTS
AIR SUSPENSION OE MARKET, BY COMPONENT
116
  • 8.1 INTRODUCTION
  • 8.2 AIR SPRINGS
    EXTENSIVE USE IN PREMIUM VEHICLES TO DRIVE MARKET
  • 8.3 SHOCK ABSORBERS
    SHIFT TOWARD ELECTRONICALLY ADJUSTABLE SHOCK ABSORBERS TO DRIVE MARKET
  • 8.4 AIR COMPRESSORS
    NEED FOR OPTIMAL AIR PRESSURE IN AIR SPRINGS TO DRIVE MARKET
  • 8.5 ELECTRONIC CONTROL UNITS
    RISING PENETRATION OF ELECTRONICALLY CONTROLLED AIR SUSPENSION SYSTEMS TO DRIVE MARKET
  • 8.6 AIR RESERVOIRS
    INCREASING DEMAND FOR IMPROVED AIR SUSPENSION PERFORMANCE TO DRIVE MARKET
  • 8.7 HEIGHT SENSORS
    NEED FOR PRECISE CONTROL OVER VEHICLE DYNAMICS TO DRIVE MARKET
  • 8.8 SOLENOID VALVES
    RISE OF ELECTRONICALLY CONTROLLED AIR SUSPENSION TECHNOLOGY TO DRIVE MARKET
  • 8.9 PRESSURE SENSORS
    GROWING PASSENGER DEMAND FOR CUSTOMIZABLE RIDE SETTINGS TO DRIVE MARKET
  • 8.10 INDUSTRY INSIGHTS
AIR SUSPENSION AFTERMARKET, BY COMPONENT
133
  • 9.1 INTRODUCTION
  • 9.2 AIR BELLOWS
    NEED FOR FREQUENT REPLACEMENTS IN HEAVY-DUTY TRUCKS TO DRIVE MARKET
  • 9.3 SHOCK ABSORBER BUSHES
    STRINGENT SAFETY AND PERFORMANCE REGULATIONS TO DRIVE MARKET
  • 9.4 INDUSTRY INSIGHTS
CABIN AIR SUSPENSION MARKET, BY VEHICLE TYPE
139
  • 10.1 INTRODUCTION
  • 10.2 RIGID TRUCKS
    SHIFT IN CONSUMER PREFERENCE TOWARD CABIN COMFORT TO DRIVE MARKET
  • 10.3 SEMI-TRAILERS
    REGULATIONS FOR IMPROVED CABIN AIR QUALITY TO DRIVE MARKET
  • 10.4 INDUSTRY INSIGHTS
ELECTRIC & HYBRID VEHICLE AIR SUSPENSION MARKET, BY TECHNOLOGY
146
  • 11.1 INTRODUCTION
  • 11.2 ELECTRONICALLY CONTROLLED
    WIDE ACCEPTANCE OF ADVANCED TECHNOLOGIES TO DRIVE MARKET
  • 11.3 NON-ELECTRONICALLY CONTROLLED
    HIGH DEMAND FROM PRICE-SENSITIVE MARKETS IN ASIA PACIFIC TO DRIVE MARKET
  • 11.4 INDUSTRY INSIGHTS
ELECTRIC & HYBRID VEHICLE AIR SUSPENSION MARKET, BY VEHICLE TYPE
152
  • 12.1 INTRODUCTION
  • 12.2 LIGHT-DUTY VEHICLES
    ADVANCEMENTS IN AIR SUSPENSION TO ENHANCE RIDE QUALITY TO DRIVE MARKET
  • 12.3 TRUCKS
    RISING DEMAND FOR IMPROVED CONTROL AND MANEUVERABILITY TO DRIVE MARKET
  • 12.4 BUSES
    PASSENGERS’ FOCUS ON RIDING COMFORT TO DRIVE MARKET
  • 12.5 INDUSTRY INSIGHTS
AIR SUSPENSION MARKET, BY REGION
160
  • 13.1 INTRODUCTION
  • 13.2 ASIA PACIFIC
    CHINA
    - Rapid adoption of air suspension in premium passenger cars to drive market
    INDIA
    - High demand for air suspension from heavy commercial vehicle industry to drive market
    JAPAN
    - Regulatory mandates for vehicle and passenger safety to drive market
    SOUTH KOREA
    - Focus on enhancing vehicle performance and passenger comfort to drive market
    REST OF ASIA PACIFIC
  • 13.3 EUROPE
    GERMANY
    - Growing popularity of air suspension systems to drive market
    FRANCE
    - Surge in demand for commercial vehicles to drive market
    SPAIN
    - Rising passenger vehicle sales to drive market
    ITALY
    - Booming automotive industry to drive market
    UK
    - Expanding automobile production to drive market
    RUSSIA
    - Increasing investments in infrastructure projects to drive market
    REST OF EUROPE
  • 13.4 NORTH AMERICA
    US
    - Emphasis on high-performance vehicle development to drive market
    CANADA
    - Improved awareness of safety features and government regulations to drive market
    MEXICO
    - Significant presence of global automakers to drive market
  • 13.5 REST OF THE WORLD
    BRAZIL
    - Rising domestic vehicle production and sales to drive market
    SOUTH AFRICA
    - Extensive use of trucks for transportation and logistics to drive market
    OTHERS
  • 13.6 INDUSTRY INSIGHTS
COMPETITIVE LANDSCAPE
200
  • 14.1 INTRODUCTION
  • 14.2 KEY PLAYER STRATEGIES/RIGHT TO WIN, 2020–2024
  • 14.3 MARKET SHARE ANALYSIS, 2023
  • 14.4 REVENUE ANALYSIS OF TOP FIVE PLAYERS, 2019–2023
  • 14.5 AIR SUSPENSION COMPONENT SUPPLIERS, 2023
  • 14.6 COMPANY EVALUATION MATRIX: KEY PLAYERS, 2023
    STARS
    EMERGING LEADERS
    PERVASIVE PLAYERS
    PARTICIPANTS
    COMPANY FOOTPRINT
  • 14.7 COMPANY EVALUATION MATRIX: START-UPS/SMES, 2023
    PROGRESSIVE COMPANIES
    RESPONSIVE COMPANIES
    STARTING BLOCKS
    DYNAMIC COMPANIES
    COMPETITIVE BENCHMARKING
  • 14.8 COMPANY VALUATION AND FINANCIAL METRICS
    COMPANY VALUATION
    FINANCIAL METRICS
  • 14.9 PRODUCT/BRAND COMPARISON
  • 14.10 COMPETITIVE SCENARIO AND TRENDS
    PRODUCT LAUNCHES/DEVELOPMENTS
    DEALS
    EXPANSIONS
    OTHERS
COMPANY PROFILES
224
  • 15.1 KEY PLAYERS
    ZF FRIEDRICHSHAFEN AG
    - Business overview
    - Products/Solutions/Services offered
    - Recent developments
    - MnM view
    CONTINENTAL AG
    - Business overview
    - Products/Solutions/Services offered
    - Recent developments
    - MnM view
    THYSSENKRUPP AG
    - Business overview
    - Products/Solutions/Services offered
    - Recent developments
    - MnM view
    HL MANDO CORP.
    - Business overview
    - Products/Solutions/Services offered
    - MnM view
    MERITOR, INC.
    - Business overview
    - Products/Solutions/Services offered
    - Recent developments
    - MnM view
    SAF-HOLLAND SE
    - Business overview
    - Products/Solutions/Services offered
    - Recent developments
    - MnM view
    HENDRICKSON USA, L.L.C.
    - Business overview
    - Products/Solutions/Services offered
    - Recent developments
    FIRESTONE INDUSTRIAL PRODUCTS COMPANY, LLC
    - Business overview
    - Products/Solutions/Services offered
    VIBRACOUSTIC SE
    - Business overview
    - Products/Solutions/Services offered
    - Recent developments
    BWI GROUP
    - Business overview
    - Products/Solutions/Services offered
    - Recent developments
  • 15.2 OTHER PLAYERS
    ARNOTT LLC
    THYSSENKRUPP BILSTEIN
    AIR LIFT COMPANY
    INFINITY ENGINEERED PRODUCTS
    DUNLOP
    VB-AIRSUSPENSION
    LINK MANUFACTURING, LTD.
    UNIVERSAL AIR INC.
    LIFTMATIC
    STEMCOPRODUCTS INC.
    SHANGHAI KOMMAN VEHICLE PARTS SYSTEM CO., LTD.
    JAMNA AUTO INDUSTRIES LIMITED
    ACCUAIR SUSPENSION
    AEROSUS
    AIRTECH SYSTEMS
RECOMMENDATIONS BY MARKETSANDMARKETS
271
  • 16.1 ASIA PACIFIC TO LEAD AIR SUSPENSION MARKET
  • 16.2 ELECTRONICALLY CONTROLLED AIR SUSPENSION TO BE KEY FOCUS AREA
  • 16.3 CONCLUSION
APPENDIX
273
  • 17.1 INSIGHTS FROM INDUSTRY EXPERTS
  • 17.2 DISCUSSION GUIDE
  • 17.3 KNOWLEDGESTORE: MARKETSANDMARKETS’ SUBSCRIPTION PORTAL
  • 17.4 CUSTOMIZATION OPTIONS
  • 17.5 RELATED REPORTS
  • 17.6 AUTHOR DETAILS
LIST OF TABLES
 
  • TABLE 1 INCLUSIONS AND EXCLUSIONS
  • TABLE 2 CURRENCY EXCHANGE RATES
  • TABLE 3 PRODUCTION VOLUME OF PASSENGER CAR MODELS WITH AIR SUSPENSION, 2023 (UNITS)
  • TABLE 4 AVERAGE COST OF SUSPENSION TECHNOLOGIES
  • TABLE 5 WEIGHT REDUCTION TARGETS FOR ICE LIGHT-DUTY VEHICLES IN US
  • TABLE 6 LIST OF KEY AFTERMARKET PLAYERS
  • TABLE 7 ROLE OF COMPANIES IN ECOSYSTEM
  • TABLE 8 AVERAGE SELLING PRICE OF AIR SUSPENSION, BY VEHICLE TYPE, 2021–2023 (USD)
  • TABLE 9 AVERAGE SELLING PRICE OF AIR SUSPENSION, BY TECHNOLOGY, 2021–2023 (USD)
  • TABLE 10 AVERAGE SELLING PRICE OF AIR SUSPENSION FOR HEAVY-DUTY VEHICLES, BY REGION, 2021–2023 (USD)
  • TABLE 11 LIST OF FUNDINGS, 2023−2024
  • TABLE 12 INFLUENCE OF STAKEHOLDERS ON BUYING PROCESS OF AIR SUSPENSION
  • TABLE 13 KEY BUYING CRITERIA FOR AIR SUSPENSION, BY TECHNOLOGY
  • TABLE 14 PATENT ANALYSIS
  • TABLE 15 US: IMPORT DATA, BY COUNTRY (USD)
  • TABLE 16 CHINA: IMPORT DATA, BY COUNTRY (USD)
  • TABLE 17 JAPAN: IMPORT DATA, BY COUNTRY (USD)
  • TABLE 18 INDIA: IMPORT DATA, BY COUNTRY (USD)
  • TABLE 19 US: EXPORT DATA, BY COUNTRY (USD)
  • TABLE 20 CHINA: EXPORT DATA, BY COUNTRY (USD)
  • TABLE 21 JAPAN: EXPORT DATA, BY COUNTRY (USD)
  • TABLE 22 INDIA: EXPORT DATA, BY COUNTRY (USD)
  • TABLE 23 NORTH AMERICA: REGULATORY BODIES, GOVERNMENT AGENCIES, AND OTHER ORGANIZATIONS
  • TABLE 24 EUROPE: REGULATORY BODIES, GOVERNMENT AGENCIES, AND OTHER ORGANIZATIONS
  • TABLE 25 ASIA PACIFIC: REGULATORY BODIES, GOVERNMENT AGENCIES, AND OTHER ORGANIZATIONS
  • TABLE 26 SAFETY REGULATIONS, BY COUNTRY/REGION
  • TABLE 27 KEY CONFERENCES AND EVENTS, 2024–2025
  • TABLE 28 AIR SUSPENSION MARKET, BY VEHICLE TYPE, 2019–2023 (THOUSAND UNITS)
  • TABLE 29 AIR SUSPENSION MARKET, BY VEHICLE TYPE, 2024–2030 (THOUSAND UNITS)
  • TABLE 30 AIR SUSPENSION MARKET, BY VEHICLE TYPE, 2019–2023 (USD MILLION)
  • TABLE 31 AIR SUSPENSION MARKET, BY VEHICLE TYPE, 2024–2030 (USD MILLION)
  • TABLE 32 PASSENGER CARS: AIR SUSPENSION MARKET, BY REGION, 2019–2023 (THOUSAND UNITS)
  • TABLE 33 PASSENGER CARS: AIR SUSPENSION MARKET, BY REGION, 2024–2030 (THOUSAND UNITS)
  • TABLE 34 PASSENGER CARS: AIR SUSPENSION MARKET, BY REGION, 2019–2023 (USD MILLION)
  • TABLE 35 PASSENGER CARS: AIR SUSPENSION MARKET, BY REGION, 2024–2030 (USD MILLION)
  • TABLE 36 LIGHT COMMERCIAL VEHICLES: AIR SUSPENSION MARKET, BY REGION, 2019–2023 (THOUSAND UNITS)
  • TABLE 37 LIGHT COMMERCIAL VEHICLES: AIR SUSPENSION MARKET, BY REGION, 2024–2030 (THOUSAND UNITS)
  • TABLE 38 LIGHT COMMERCIAL VEHICLES: AIR SUSPENSION MARKET, BY REGION, 2019–2023 (USD MILLION)
  • TABLE 39 LIGHT COMMERCIAL VEHICLES: AIR SUSPENSION MARKET, BY REGION, 2024–2030 (USD MILLION)
  • TABLE 40 TRUCKS: AIR SUSPENSION MARKET, BY REGION, 2019–2023 (THOUSAND UNITS)
  • TABLE 41 TRUCKS: AIR SUSPENSION MARKET, BY REGION, 2024–2030 (THOUSAND UNITS)
  • TABLE 42 TRUCKS: AIR SUSPENSION MARKET, BY REGION, 2019–2023 (USD MILLION)
  • TABLE 43 TRUCKS: AIR SUSPENSION MARKET, BY REGION, 2024–2030 (USD MILLION)
  • TABLE 44 BUSES: AIR SUSPENSION MARKET, BY REGION, 2019–2023 (THOUSAND UNITS)
  • TABLE 45 BUSES: AIR SUSPENSION MARKET, BY REGION, 2024–2030 (THOUSAND UNITS)
  • TABLE 46 BUSES: AIR SUSPENSION MARKET, BY REGION, 2019–2023 (USD MILLION)
  • TABLE 47 BUSES: AIR SUSPENSION MARKET, BY REGION, 2024–2030 (USD MILLION)
  • TABLE 48 AIR SUSPENSION MARKET, BY TECHNOLOGY, 2019–2023 (THOUSAND UNITS)
  • TABLE 49 AIR SUSPENSION MARKET, BY TECHNOLOGY, 2024–2030 (THOUSAND UNITS)
  • TABLE 50 AIR SUSPENSION MARKET, BY TECHNOLOGY, 2019–2023 (USD MILLION)
  • TABLE 51 AIR SUSPENSION MARKET, BY TECHNOLOGY, 2024–2030 (USD MILLION)
  • TABLE 52 ELECTRONICALLY CONTROLLED: AIR SUSPENSION MARKET, BY REGION, 2019–2023 (THOUSAND UNITS)
  • TABLE 53 ELECTRONICALLY CONTROLLED: AIR SUSPENSION MARKET, BY REGION, 2024–2030 (THOUSAND UNITS)
  • TABLE 54 ELECTRONICALLY CONTROLLED: AIR SUSPENSION MARKET, BY REGION, 2019–2023 (USD MILLION)
  • TABLE 55 ELECTRONICALLY CONTROLLED: AIR SUSPENSION MARKET, BY REGION, 2024–2030 (USD MILLION)
  • TABLE 56 NON-ELECTRONICALLY CONTROLLED: AIR SUSPENSION MARKET, BY REGION, 2019–2023 (THOUSAND UNITS)
  • TABLE 57 NON-ELECTRONICALLY CONTROLLED: AIR SUSPENSION MARKET, BY REGION, 2024–2030 (THOUSAND UNITS)
  • TABLE 58 NON-ELECTRONICALLY CONTROLLED: AIR SUSPENSION MARKET, BY REGION, 2019–2023 (USD MILLION)
  • TABLE 59 NON-ELECTRONICALLY CONTROLLED: AIR SUSPENSION MARKET, BY REGION, 2024–2030 (USD MILLION)
  • TABLE 60 AIR SUSPENSION MARKET, BY COMPONENT, 2019–2023 (THOUSAND UNITS)
  • TABLE 61 AIR SUSPENSION MARKET, BY COMPONENT, 2024–2030 (THOUSAND UNITS)
  • TABLE 62 AIR SUSPENSION MARKET, BY COMPONENT, 2019–2023 (USD MILLION)
  • TABLE 63 AIR SUSPENSION MARKET, BY COMPONENT, 2024–2030 (USD MILLION)
  • TABLE 64 AIR SPRINGS: AIR SUSPENSION MARKET, BY REGION, 2019–2023 (THOUSAND UNITS)
  • TABLE 65 AIR SPRINGS: AIR SUSPENSION MARKET, BY REGION, 2024–2030 (THOUSAND UNITS)
  • TABLE 66 AIR SPRINGS: AIR SUSPENSION MARKET, BY REGION, 2019–2023 (USD MILLION)
  • TABLE 67 AIR SPRINGS: AIR SUSPENSION MARKET, BY REGION, 2024–2030 (USD MILLION)
  • TABLE 68 SHOCK ABSORBERS: AIR SUSPENSION MARKET, BY REGION, 2019–2023 (THOUSAND UNITS)
  • TABLE 69 SHOCK ABSORBERS: AIR SUSPENSION MARKET, BY REGION, 2024–2030 (THOUSAND UNITS)
  • TABLE 70 SHOCK ABSORBERS: AIR SUSPENSION MARKET, BY REGION, 2019–2023 (USD MILLION)
  • TABLE 71 SHOCK ABSORBERS: AIR SUSPENSION MARKET, BY REGION, 2024–2030 (USD MILLION)
  • TABLE 72 AIR COMPRESSORS: AIR SUSPENSION MARKET, BY REGION, 2019–2023 (THOUSAND UNITS)
  • TABLE 73 AIR COMPRESSORS: AIR SUSPENSION MARKET, BY REGION, 2024–2030 (THOUSAND UNITS)
  • TABLE 74 AIR COMPRESSORS: AIR SUSPENSION MARKET, BY REGION, 2019–2023 (USD MILLION)
  • TABLE 75 AIR COMPRESSORS: AIR SUSPENSION MARKET, BY REGION, 2024–2030 (USD MILLION)
  • TABLE 76 ELECTRONIC CONTROL UNITS: AIR SUSPENSION MARKET, BY REGION, 2019–2023 (THOUSAND UNITS)
  • TABLE 77 ELECTRONIC CONTROL UNITS: AIR SUSPENSION MARKET, BY REGION, 2024–2030 (THOUSAND UNITS)
  • TABLE 78 ELECTRONIC CONTROL UNITS: AIR SUSPENSION MARKET, BY REGION, 2019–2023 (USD MILLION)
  • TABLE 79 ELECTRONIC CONTROL UNITS: AIR SUSPENSION MARKET, BY REGION, 2024–2030 (USD MILLION)
  • TABLE 80 AIR RESERVOIRS: AIR SUSPENSION MARKET, BY REGION, 2019–2023 (THOUSAND UNITS)
  • TABLE 81 AIR RESERVOIRS: AIR SUSPENSION MARKET, BY REGION, 2024–2030 (THOUSAND UNITS)
  • TABLE 82 AIR RESERVOIRS: AIR SUSPENSION MARKET, BY REGION, 2019–2023 (USD MILLION)
  • TABLE 83 AIR RESERVOIRS: AIR SUSPENSION MARKET, BY REGION, 2024–2030 (USD MILLION)
  • TABLE 84 HEIGHT SENSORS: AIR SUSPENSION MARKET, BY REGION, 2019–2023 (THOUSAND UNITS)
  • TABLE 85 HEIGHT SENSORS: AIR SUSPENSION MARKET, BY REGION, 2024–2030 (THOUSAND UNITS)
  • TABLE 86 HEIGHT SENSORS: AIR SUSPENSION MARKET, BY REGION, 2019–2023 (USD MILLION)
  • TABLE 87 HEIGHT SENSORS: AIR SUSPENSION MARKET, BY REGION, 2024–2030 (USD MILLION)
  • TABLE 88 SOLENOID VALVES: AIR SUSPENSION MARKET, BY REGION, 2019–2023 (THOUSAND UNITS)
  • TABLE 89 SOLENOID VALVES: AIR SUSPENSION MARKET, BY REGION, 2024–2030 (THOUSAND UNITS)
  • TABLE 90 SOLENOID VALVES: AIR SUSPENSION MARKET, BY REGION, 2019–2023 (USD MILLION)
  • TABLE 91 SOLENOID VALVES: AIR SUSPENSION MARKET, BY REGION, 2024–2030 (USD MILLION)
  • TABLE 92 PRESSURE SENSORS: AIR SUSPENSION MARKET, BY REGION, 2019–2023 (THOUSAND UNITS)
  • TABLE 93 PRESSURE SENSORS: AIR SUSPENSION MARKET, BY REGION, 2024–2030 (THOUSAND UNITS)
  • TABLE 94 PRESSURE SENSORS: AIR SUSPENSION MARKET, BY REGION, 2019–2023 (USD MILLION)
  • TABLE 95 PRESSURE SENSORS: AIR SUSPENSION MARKET, BY REGION, 2024–2030 (USD MILLION)
  • TABLE 96 AIR SUSPENSION AFTERMARKET, BY COMPONENT, 2019–2023 (MILLION UNITS)
  • TABLE 97 AIR SUSPENSION AFTERMARKET, BY COMPONENT, 2024–2030 (MILLION UNITS)
  • TABLE 98 AIR SUSPENSION AFTERMARKET, BY COMPONENT, 2019–2023 (USD MILLION)
  • TABLE 99 AIR SUSPENSION AFTERMARKET, BY COMPONENT, 2024–2030 (USD MILLION)
  • TABLE 100 AIR BELLOWS AFTERMARKET, BY REGION, 2019–2023 (MILLION UNITS)
  • TABLE 101 AIR BELLOWS AFTERMARKET, BY REGION, 2024–2030 (MILLION UNITS)
  • TABLE 102 AIR BELLOWS AFTERMARKET, BY REGION, 2019–2023 (USD MILLION)
  • TABLE 103 AIR BELLOWS AFTERMARKET, BY REGION, 2024–2030 (USD MILLION)
  • TABLE 104 SHOCK ABSORBER BUSHES AFTERMARKET, BY REGION, 2019–2023 (MILLION UNITS)
  • TABLE 105 SHOCK ABSORBER BUSHES AFTERMARKET, BY REGION, 2024–2030 (MILLION UNITS)
  • TABLE 106 SHOCK ABSORBER BUSHES AFTERMARKET, BY REGION, 2019–2023 (USD MILLION)
  • TABLE 107 SHOCK ABSORBER BUSHES AFTERMARKET, BY REGION, 2024–2030 (USD MILLION)
  • TABLE 108 CABIN AIR SUSPENSION MARKET, BY VEHICLE TYPE, 2019–2023 (THOUSAND UNITS)
  • TABLE 109 CABIN AIR SUSPENSION MARKET, BY VEHICLE TYPE, 2024–2030 (THOUSAND UNITS)
  • TABLE 110 CABIN AIR SUSPENSION MARKET, BY VEHICLE TYPE, 2019–2023 (USD MILLION)
  • TABLE 111 CABIN AIR SUSPENSION MARKET, BY VEHICLE TYPE, 2024–2030 (USD MILLION)
  • TABLE 112 RIGID TRUCKS: CABIN AIR SUSPENSION MARKET, BY REGION, 2019–2023 (THOUSAND UNITS)
  • TABLE 113 RIGID TRUCKS: CABIN AIR SUSPENSION MARKET, BY REGION, 2024–2030 (THOUSAND UNITS)
  • TABLE 114 RIGID TRUCKS: CABIN AIR SUSPENSION MARKET, BY REGION, 2019–2023 (USD MILLION)
  • TABLE 115 RIGID TRUCKS: CABIN AIR SUSPENSION MARKET, BY REGION, 2024–2030 (USD MILLION)
  • TABLE 116 SEMI-TRAILERS: CABIN AIR SUSPENSION MARKET, BY REGION, 2019–2023 (THOUSAND UNITS)
  • TABLE 117 SEMI-TRAILERS: CABIN AIR SUSPENSION MARKET, BY REGION, 2024–2030 (THOUSAND UNITS)
  • TABLE 118 SEMI-TRAILERS: CABIN AIR SUSPENSION MARKET, BY REGION, 2019–2023 (USD MILLION)
  • TABLE 119 SEMI-TRAILERS: CABIN AIR SUSPENSION MARKET, BY REGION, 2024–2030 (USD MILLION)
  • TABLE 120 ELECTRIC & HYBRID VEHICLE AIR SUSPENSION MARKET, BY TECHNOLOGY, 2019–2023 (THOUSAND UNITS)
  • TABLE 121 ELECTRIC & HYBRID VEHICLE AIR SUSPENSION MARKET, BY TECHNOLOGY, 2024–2030 (THOUSAND UNITS)
  • TABLE 122 ELECTRIC & HYBRID VEHICLE AIR SUSPENSION MARKET, BY TECHNOLOGY, 2019–2023 (USD MILLION)
  • TABLE 123 ELECTRIC & HYBRID VEHICLE AIR SUSPENSION MARKET, BY TECHNOLOGY, 2024–2030 (USD MILLION)
  • TABLE 124 ELECTRONICALLY CONTROLLED: ELECTRIC & HYBRID VEHICLE AIR SUSPENSION MARKET, BY REGION, 2019–2023 (THOUSAND UNITS)
  • TABLE 125 ELECTRONICALLY CONTROLLED: ELECTRIC & HYBRID VEHICLE AIR SUSPENSION MARKET, BY REGION, 2024–2030 (THOUSAND UNITS)
  • TABLE 126 ELECTRONICALLY CONTROLLED: ELECTRIC & HYBRID VEHICLE AIR SUSPENSION MARKET, BY REGION, 2019–2023 (USD MILLION)
  • TABLE 127 ELECTRONICALLY CONTROLLED: ELECTRIC & HYBRID VEHICLE AIR SUSPENSION MARKET, BY REGION, 2024–2030 (USD MILLION)
  • TABLE 128 NON-ELECTRONICALLY CONTROLLED: ELECTRIC & HYBRID VEHICLE AIR SUSPENSION MARKET, BY REGION, 2019–2023 (THOUSAND UNITS)
  • TABLE 129 NON-ELECTRONICALLY CONTROLLED: ELECTRIC & HYBRID VEHICLE AIR SUSPENSION MARKET, BY REGION, 2024–2030 (THOUSAND UNITS)
  • TABLE 130 NON-ELECTRONICALLY CONTROLLED: ELECTRIC & HYBRID VEHICLE AIR SUSPENSION MARKET, BY REGION, 2019–2023 (USD MILLION)
  • TABLE 131 NON-ELECTRONICALLY CONTROLLED: ELECTRIC & HYBRID VEHICLE AIR SUSPENSION MARKET, BY REGION, 2024–2030 (USD MILLION)
  • TABLE 132 ELECTRIC & HYBRID VEHICLE AIR SUSPENSION MARKET, BY VEHICLE TYPE, 2019–2023 (THOUSAND UNITS)
  • TABLE 133 ELECTRIC & HYBRID VEHICLE AIR SUSPENSION MARKET, BY VEHICLE TYPE, 2024–2030 (THOUSAND UNITS)
  • TABLE 134 ELECTRIC & HYBRID VEHICLE AIR SUSPENSION MARKET, BY VEHICLE TYPE, 2019–2023 (USD MILLION)
  • TABLE 135 ELECTRIC & HYBRID VEHICLE AIR SUSPENSION MARKET, BY VEHICLE TYPE, 2024–2030 (USD MILLION)
  • TABLE 136 LIGHT-DUTY VEHICLES: ELECTRIC & HYBRID VEHICLE AIR SUSPENSION MARKET, BY REGION, 2019–2023 (THOUSAND UNITS)
  • TABLE 137 LIGHT-DUTY VEHICLES: ELECTRIC & HYBRID VEHICLE AIR SUSPENSION MARKET, BY REGION, 2024–2030 (THOUSAND UNITS)
  • TABLE 138 LIGHT-DUTY VEHICLES: ELECTRIC & HYBRID VEHICLE AIR SUSPENSION MARKET, BY REGION, 2019–2023 (USD MILLION)
  • TABLE 139 LIGHT-DUTY VEHICLES: ELECTRIC & HYBRID VEHICLE AIR SUSPENSION MARKET, BY REGION, 2024–2030 (USD MILLION)
  • TABLE 140 TRUCKS: ELECTRIC & HYBRID VEHICLE AIR SUSPENSION MARKET, BY REGION, 2019–2023 (THOUSAND UNITS)
  • TABLE 141 TRUCKS: ELECTRIC & HYBRID VEHICLE AIR SUSPENSION MARKET, BY REGION, 2024–2030 (THOUSAND UNITS)
  • TABLE 142 TRUCKS: ELECTRIC & HYBRID VEHICLE AIR SUSPENSION MARKET, BY REGION, 2019–2023 (USD MILLION)
  • TABLE 143 TRUCKS: ELECTRIC & HYBRID VEHICLE AIR SUSPENSION MARKET, BY REGION, 2024–2030 (USD MILLION)
  • TABLE 144 BUSES: ELECTRIC & HYBRID VEHICLE AIR SUSPENSION MARKET, BY REGION, 2019–2023 (THOUSAND UNITS)
  • TABLE 145 BUSES: ELECTRIC & HYBRID VEHICLE AIR SUSPENSION MARKET, BY REGION, 2024–2030 (THOUSAND UNITS)
  • TABLE 146 BUSES: ELECTRIC & HYBRID VEHICLE AIR SUSPENSION MARKET, BY REGION, 2019–2023 (USD MILLION)
  • TABLE 147 BUSES: ELECTRIC & HYBRID VEHICLE AIR SUSPENSION MARKET, BY REGION, 2024–2030 (USD MILLION)
  • TABLE 148 AIR SUSPENSION MARKET, BY REGION, 2019–2023 (THOUSAND UNITS)
  • TABLE 149 AIR SUSPENSION MARKET, BY REGION, 2024–2030 (THOUSAND UNITS)
  • TABLE 150 AIR SUSPENSION MARKET, BY REGION, 2019–2023 (USD MILLION)
  • TABLE 151 AIR SUSPENSION MARKET, BY REGION, 2024–2030 (USD MILLION)
  • TABLE 152 ASIA PACIFIC: AIR SUSPENSION MARKET, BY COUNTRY, 2019–2023 (THOUSAND UNITS)
  • TABLE 153 ASIA PACIFIC: AIR SUSPENSION MARKET, BY COUNTRY, 2024–2030 (THOUSAND UNITS)
  • TABLE 154 ASIA PACIFIC: AIR SUSPENSION MARKET, BY COUNTRY, 2019–2023 (USD MILLION)
  • TABLE 155 ASIA PACIFIC: AIR SUSPENSION MARKET, BY COUNTRY, 2024–2030 (USD MILLION)
  • TABLE 156 CHINA: AIR SUSPENSION MARKET, BY VEHICLE TYPE, 2019–2023 (THOUSAND UNITS)
  • TABLE 157 CHINA: AIR SUSPENSION MARKET, BY VEHICLE TYPE, 2024–2030 (THOUSAND UNITS)
  • TABLE 158 CHINA: AIR SUSPENSION MARKET, BY VEHICLE TYPE, 2019–2023 (USD MILLION)
  • TABLE 159 CHINA: AIR SUSPENSION MARKET, BY VEHICLE TYPE, 2024–2030 (USD MILLION)
  • TABLE 160 INDIA: AIR SUSPENSION MARKET, BY VEHICLE TYPE, 2019–2023 (THOUSAND UNITS)
  • TABLE 161 INDIA: AIR SUSPENSION MARKET, BY VEHICLE TYPE, 2024–2030 (THOUSAND UNITS)
  • TABLE 162 INDIA: AIR SUSPENSION MARKET, BY VEHICLE TYPE, 2019–2023 (USD MILLION)
  • TABLE 163 INDIA: AIR SUSPENSION MARKET, BY VEHICLE TYPE, 2024–2030 (USD MILLION)
  • TABLE 164 JAPAN: AIR SUSPENSION MARKET, BY VEHICLE TYPE, 2019–2023 (THOUSAND UNITS)
  • TABLE 165 JAPAN: AIR SUSPENSION MARKET, BY VEHICLE TYPE, 2024–2030 (THOUSAND UNITS)
  • TABLE 166 JAPAN: AIR SUSPENSION MARKET, BY VEHICLE TYPE, 2019–2023 (USD MILLION)
  • TABLE 167 JAPAN: AIR SUSPENSION MARKET, BY VEHICLE TYPE, 2024–2030 (USD MILLION)
  • TABLE 168 SOUTH KOREA: AIR SUSPENSION MARKET, BY VEHICLE TYPE, 2019–2023 (THOUSAND UNITS)
  • TABLE 169 SOUTH KOREA: AIR SUSPENSION MARKET, BY VEHICLE TYPE, 2024–2030 (THOUSAND UNITS)
  • TABLE 170 SOUTH KOREA: AIR SUSPENSION MARKET, BY VEHICLE TYPE, 2019–2023 (USD MILLION)
  • TABLE 171 SOUTH KOREA: AIR SUSPENSION MARKET, BY VEHICLE TYPE, 2024–2030 (USD MILLION)
  • TABLE 172 REST OF ASIA PACIFIC: AIR SUSPENSION MARKET, BY VEHICLE TYPE, 2019–2023 (THOUSAND UNITS)
  • TABLE 173 REST OF ASIA PACIFIC: AIR SUSPENSION MARKET, BY VEHICLE TYPE, 2024–2030 (THOUSAND UNITS)
  • TABLE 174 REST OF ASIA PACIFIC: AIR SUSPENSION MARKET, BY VEHICLE TYPE, 2019–2023 (USD MILLION)
  • TABLE 175 REST OF ASIA PACIFIC: AIR SUSPENSION MARKET, BY VEHICLE TYPE, 2024–2030 (USD MILLION)
  • TABLE 176 EUROPE: AIR SUSPENSION MARKET, BY COUNTRY, 2019–2023 (THOUSAND UNITS)
  • TABLE 177 EUROPE: AIR SUSPENSION MARKET, BY COUNTRY, 2024–2030 (THOUSAND UNITS)
  • TABLE 178 EUROPE: AIR SUSPENSION MARKET, BY COUNTRY, 2019–2023 (USD MILLION)
  • TABLE 179 EUROPE: AIR SUSPENSION MARKET, BY COUNTRY, 2024–2030 (USD MILLION)
  • TABLE 180 GERMANY: AIR SUSPENSION MARKET, BY VEHICLE TYPE, 2019–2023 (THOUSAND UNITS)
  • TABLE 181 GERMANY: AIR SUSPENSION MARKET, BY VEHICLE TYPE, 2024–2030 (THOUSAND UNITS)
  • TABLE 182 GERMANY: AIR SUSPENSION MARKET, BY VEHICLE TYPE, 2019–2023 (USD MILLION)
  • TABLE 183 GERMANY: AIR SUSPENSION MARKET, BY VEHICLE TYPE, 2024–2030 (USD MILLION)
  • TABLE 184 FRANCE: AIR SUSPENSION MARKET, BY VEHICLE TYPE, 2019–2023 (THOUSAND UNITS)
  • TABLE 185 FRANCE: AIR SUSPENSION MARKET, BY VEHICLE TYPE, 2024–2030 (THOUSAND UNITS)
  • TABLE 186 FRANCE: AIR SUSPENSION MARKET, BY VEHICLE TYPE, 2019–2023 (USD MILLION)
  • TABLE 187 FRANCE: AIR SUSPENSION MARKET, BY VEHICLE TYPE, 2024–2030 (USD MILLION)
  • TABLE 188 SPAIN: AIR SUSPENSION MARKET, BY VEHICLE TYPE, 2019–2023 (THOUSAND UNITS)
  • TABLE 189 SPAIN: AIR SUSPENSION MARKET, BY VEHICLE TYPE, 2024–2030 (THOUSAND UNITS)
  • TABLE 190 SPAIN: AIR SUSPENSION MARKET, BY VEHICLE TYPE, 2019–2023 (USD MILLION)
  • TABLE 191 SPAIN: AIR SUSPENSION MARKET, BY VEHICLE TYPE, 2024–2030 (USD MILLION)
  • TABLE 192 ITALY: AIR SUSPENSION MARKET, BY VEHICLE TYPE, 2019–2023 (THOUSAND UNITS)
  • TABLE 193 ITALY: AIR SUSPENSION MARKET, BY VEHICLE TYPE, 2024–2030 (THOUSAND UNITS)
  • TABLE 194 ITALY: AIR SUSPENSION MARKET, BY VEHICLE TYPE, 2019–2023 (USD MILLION)
  • TABLE 195 ITALY: AIR SUSPENSION MARKET, BY VEHICLE TYPE, 2024–2030 (USD MILLION)
  • TABLE 196 UK: AIR SUSPENSION MARKET, BY VEHICLE TYPE, 2019–2023 (THOUSAND UNITS)
  • TABLE 197 UK: AIR SUSPENSION MARKET, BY VEHICLE TYPE, 2024–2030 (THOUSAND UNITS)
  • TABLE 198 UK: AIR SUSPENSION MARKET, BY VEHICLE TYPE, 2019–2023 (USD MILLION)
  • TABLE 199 UK: AIR SUSPENSION MARKET, BY VEHICLE TYPE, 2024–2030 (USD MILLION)
  • TABLE 200 RUSSIA: AIR SUSPENSION MARKET, BY VEHICLE TYPE, 2019–2023 (THOUSAND UNITS)
  • TABLE 201 RUSSIA: AIR SUSPENSION MARKET, BY VEHICLE TYPE, 2024–2030 (THOUSAND UNITS)
  • TABLE 202 RUSSIA: AIR SUSPENSION MARKET, BY VEHICLE TYPE, 2019–2023 (USD MILLION)
  • TABLE 203 RUSSIA: AIR SUSPENSION MARKET, BY VEHICLE TYPE, 2024–2030 (USD MILLION)
  • TABLE 204 REST OF EUROPE: AIR SUSPENSION MARKET, BY VEHICLE TYPE, 2019–2023 (THOUSAND UNITS)
  • TABLE 205 REST OF EUROPE: AIR SUSPENSION MARKET, BY VEHICLE TYPE, 2024–2030 (THOUSAND UNITS)
  • TABLE 206 REST OF EUROPE: AIR SUSPENSION MARKET, BY VEHICLE TYPE, 2019–2023 (USD MILLION)
  • TABLE 207 REST OF EUROPE: AIR SUSPENSION MARKET, BY VEHICLE TYPE, 2024–2030 (USD MILLION)
  • TABLE 208 NORTH AMERICA: AIR SUSPENSION MARKET, BY COUNTRY, 2019–2023 (THOUSAND UNITS)
  • TABLE 209 NORTH AMERICA: AIR SUSPENSION MARKET, BY COUNTRY, 2024–2030 (THOUSAND UNITS)
  • TABLE 210 NORTH AMERICA: AIR SUSPENSION MARKET, BY COUNTRY, 2019–2023 (USD MILLION)
  • TABLE 211 NORTH AMERICA: AIR SUSPENSION MARKET, BY COUNTRY, 2024–2030 (USD MILLION)
  • TABLE 212 US: AIR SUSPENSION MARKET, BY VEHICLE TYPE, 2019–2023 (THOUSAND UNITS)
  • TABLE 213 US: AIR SUSPENSION MARKET, BY VEHICLE TYPE, 2024–2030 (THOUSAND UNITS)
  • TABLE 214 US: AIR SUSPENSION MARKET, BY VEHICLE TYPE, 2019–2023 (USD MILLION)
  • TABLE 215 US: AIR SUSPENSION MARKET, BY VEHICLE TYPE, 2024–2030 (USD MILLION)
  • TABLE 216 CANADA: AIR SUSPENSION MARKET, BY VEHICLE TYPE, 2019–2023 (THOUSAND UNITS)
  • TABLE 217 CANADA: AIR SUSPENSION MARKET, BY VEHICLE TYPE, 2024–2030 (THOUSAND UNITS)
  • TABLE 218 CANADA: AIR SUSPENSION MARKET, BY VEHICLE TYPE, 2019–2023 (USD MILLION)
  • TABLE 219 CANADA: AIR SUSPENSION MARKET, BY VEHICLE TYPE, 2024–2030 (USD MILLION)
  • TABLE 220 MEXICO: AIR SUSPENSION MARKET, BY VEHICLE TYPE, 2019–2023 (THOUSAND UNITS)
  • TABLE 221 MEXICO: AIR SUSPENSION MARKET, BY VEHICLE TYPE, 2024–2030 (THOUSAND UNITS)
  • TABLE 222 MEXICO: AIR SUSPENSION MARKET, BY VEHICLE TYPE, 2019–2023 (USD MILLION)
  • TABLE 223 MEXICO: AIR SUSPENSION MARKET, BY VEHICLE TYPE, 2024–2030 (USD MILLION)
  • TABLE 224 REST OF THE WORLD: AIR SUSPENSION MARKET, BY COUNTRY, 2019–2023 (THOUSAND UNITS)
  • TABLE 225 REST OF THE WORLD: AIR SUSPENSION MARKET, BY COUNTRY, 2024–2030 (THOUSAND UNITS)
  • TABLE 226 REST OF THE WORLD: AIR SUSPENSION MARKET, BY COUNTRY, 2019–2023 (USD MILLION)
  • TABLE 227 REST OF THE WORLD: AIR SUSPENSION MARKET, BY COUNTRY, 2024–2030 (USD MILLION)
  • TABLE 228 BRAZIL: AIR SUSPENSION MARKET, BY VEHICLE TYPE, 2019–2023 (THOUSAND UNITS)
  • TABLE 229 BRAZIL: AIR SUSPENSION MARKET, BY VEHICLE TYPE, 2024–2030 (THOUSAND UNITS)
  • TABLE 230 BRAZIL: AIR SUSPENSION MARKET, BY VEHICLE TYPE, 2019–2023 (USD MILLION)
  • TABLE 231 BRAZIL: AIR SUSPENSION MARKET, BY VEHICLE TYPE, 2024–2030 (USD MILLION)
  • TABLE 232 SOUTH AFRICA: AIR SUSPENSION MARKET, BY VEHICLE TYPE, 2019–2023 (THOUSAND UNITS)
  • TABLE 233 SOUTH AFRICA: AIR SUSPENSION MARKET, BY VEHICLE TYPE, 2024–2030 (THOUSAND UNITS)
  • TABLE 234 SOUTH AFRICA: AIR SUSPENSION MARKET, BY VEHICLE TYPE, 2019–2023 (USD MILLION)
  • TABLE 235 SOUTH AFRICA: AIR SUSPENSION MARKET, BY VEHICLE TYPE, 2024–2030 (USD MILLION)
  • TABLE 236 OTHERS: AIR SUSPENSION MARKET, BY VEHICLE TYPE, 2019–2023 (THOUSAND UNITS)
  • TABLE 237 OTHERS: AIR SUSPENSION MARKET, BY VEHICLE TYPE, 2024–2030 (THOUSAND UNITS)
  • TABLE 238 OTHERS: AIR SUSPENSION MARKET, BY VEHICLE TYPE, 2019–2023 (USD MILLION)
  • TABLE 239 OTHERS: AIR SUSPENSION MARKET, BY VEHICLE TYPE, 2024–2030 (USD MILLION)
  • TABLE 240 AIR SUSPENSION MARKET: DEGREE OF COMPETITION, 2023
  • TABLE 241 LIST OF AIR COMPRESSOR SUPPLIERS, 2023
  • TABLE 242 LIST OF AIR SPRING SUPPLIERS, 2023
  • TABLE 243 AIR SUSPENSION MARKET: TECHNOLOGY FOOTPRINT
  • TABLE 244 AIR SUSPENSION MARKET: APPLICATION FOOTPRINT
  • TABLE 245 AIR SUSPENSION MARKET: REGION FOOTPRINT
  • TABLE 246 LIST OF START-UPS/SMES
  • TABLE 247 COMPETITIVE BENCHMARKING OF START-UPS/SMES, 2023
  • TABLE 248 AIR SUSPENSION MARKET: PRODUCT LAUNCHES/DEVELOPMENTS, 2020–2024
  • TABLE 249 AIR SUSPENSION MARKET: DEALS, 2020–2024
  • TABLE 250 AIR SUSPENSION MARKET: EXPANSIONS, 2020–2024
  • TABLE 251 AIR SUSPENSION MARKET: OTHERS, 2020–2024
  • TABLE 252 ZF FRIEDRICHSHAFEN AG: COMPANY OVERVIEW
  • TABLE 253 ZF FRIEDRICHSHAFEN AG: PRODUCTS/SOLUTIONS/SERVICES OFFERED
  • TABLE 254 ZF FRIEDRICHSHAFEN AG: PRODUCT LAUNCHES/DEVELOPMENTS
  • TABLE 255 ZF FRIEDRICHSHAFEN AG: DEALS
  • TABLE 256 ZF FRIEDRICHSHAFEN AG: EXPANSIONS
  • TABLE 257 CONTINENTAL AG: COMPANY OVERVIEW
  • TABLE 258 CONTINENTAL AG: PRODUCTS/SOLUTIONS/SERVICES OFFERED
  • TABLE 259 CONTINENTAL AG: PRODUCT LAUNCHES/DEVELOPMENTS
  • TABLE 260 CONTINENTAL AG: EXPANSIONS
  • TABLE 261 THYSSENKRUPP AG: COMPANY OVERVIEW
  • TABLE 262 THYSSENKRUPP AG: PRODUCTS/SOLUTIONS/SERVICES OFFERED
  • TABLE 263 THYSSENKRUPP AG: EXPANSIONS
  • TABLE 264 HL MANDO CORP.: COMPANY OVERVIEW
  • TABLE 265 HL MANDO CORP.: PRODUCTS/SOLUTIONS/SERVICES OFFERED
  • TABLE 266 MERITOR, INC.: COMPANY OVERVIEW
  • TABLE 267 MERITOR, INC.: PRODUCTS/SOLUTIONS/SERVICES OFFERED
  • TABLE 268 MERITOR, INC.: PRODUCT LAUNCHES/DEVELOPMENTS
  • TABLE 269 MERITOR, INC.: DEALS
  • TABLE 270 SAF-HOLLAND SE: COMPANY OVERVIEW
  • TABLE 271 SAF-HOLLAND SE: PRODUCTS/SOLUTIONS/SERVICES OFFERED
  • TABLE 272 SAF-HOLLAND SE: DEALS
  • TABLE 273 SAF-HOLLAND SE: EXPANSIONS
  • TABLE 274 SAF-HOLLAND SE: OTHERS
  • TABLE 275 HENDRICKSON USA, L.L.C.: COMPANY OVERVIEW
  • TABLE 276 HENDRICKSON USA, L.L.C.: PRODUCTS/SOLUTIONS/SERVICES OFFERED
  • TABLE 277 HENDRICKSON USA, L.L.C.: PRODUCT LAUNCHES/DEVELOPMENTS
  • TABLE 278 HENDRICKSON USA, L.L.C.: DEALS
  • TABLE 279 HENDRIKSON USA, L.L.C.: OTHERS
  • TABLE 281 FIRESTONE INDUSTRIAL PRODUCTS COMPANY, LLC: COMPANY OVERVIEW
  • TABLE 282 FIRESTONE INDUSTRIAL PRODUCTS COMPANY, LLC: PRODUCTS/SOLUTIONS/SERVICES OFFERED
  • TABLE 283 FIRESTONE INDUSTRIAL PRODUCTS COMPANY, LLC: EXPANSIONS
  • TABLE 284 VIBRACOUSTIC SE: COMPANY OVERVIEW
  • TABLE 285 VIBRACOUSTIC SE: PRODUCTS/SOLUTIONS/SERVICES OFFERED
  • TABLE 286 VIBRACOUSTIC SE: PRODUCT LAUNCHES/DEVELOPMENTS
  • TABLE 287 VIBRACOUSTIC SE: DEALS
  • TABLE 288 BWI GROUP: COMPANY OVERVIEW
  • TABLE 289 BWI GROUP: PRODUCTS/SOLUTIONS/SERVICES OFFERED
  • TABLE 290 BWI GROUP: DEALS
  • TABLE 291 ARNOTT LLC: COMPANY OVERVIEW
  • TABLE 292 THYSSENKRUPP BILSTEIN: COMPANY OVERVIEW
  • TABLE 293 AIR LIFT COMPANY: COMPANY OVERVIEW
  • TABLE 294 INFINITY ENGINEERED PRODUCTS: COMPANY OVERVIEW
  • TABLE 295 DUNLOP: COMPANY OVERVIEW
  • TABLE 296 VB-AIRSUSPENSION: COMPANY OVERVIEW
  • TABLE 297 LINK MANUFACTURING, LTD.: COMPANY OVERVIEW
  • TABLE 298 UNIVERSAL AIR INC.: COMPANY OVERVIEW
  • TABLE 299 LIFTMATIC: COMPANY OVERVIEW
  • TABLE 300 STEMCOPRODUCTS INC: COMPANY OVERVIEW
  • TABLE 301 SHANGHAI KOMMAN VEHICLE PARTS SYSTEM CO., LTD.: COMPANY OVERVIEW
  • TABLE 302 JAMNA AUTO INDUSTRIES LIMITED: COMPANY OVERVIEW
  • TABLE 303 ACCUAIR SUSPENSION: COMPANY OVERVIEW
  • TABLE 304 AEROSUS: COMPANY OVERVIEW
  • TABLE 305 AIRTECH SYSTEMS: COMPANY OVERVIEW
LIST OF FIGURES
 
  • FIGURE 1 AIR SUSPENSION MARKET SEGMENTATION
  • FIGURE 2 RESEARCH DESIGN
  • FIGURE 3 RESEARCH DESIGN MODEL
  • FIGURE 4 RESEARCH METHODOLOGY: HYPOTHESIS BUILDING
  • FIGURE 5 BOTTOM-UP APPROACH
  • FIGURE 6 DATA TRIANGULATION
  • FIGURE 7 REPORT SUMMARY
  • FIGURE 8 AIR SUSPENSION MARKET, BY REGION, 2024 VS. 2030
  • FIGURE 9 RISING DEMAND FOR ENHANCED RIDE COMFORT AND TECHNOLOGICAL ADVANCEMENTS TO DRIVE MARKET
  • FIGURE 10 TRUCKS TO BE LARGEST SEGMENT DURING FORECAST PERIOD
  • FIGURE 11 AIR SPRINGS TO BE DOMINANT DURING FORECAST PERIOD
  • FIGURE 12 ELECTRONICALLY CONTROLLED SEGMENT TO LEAD AIR SUSPENSION MARKET DURING FORECAST PERIOD
  • FIGURE 13 SEMI-TRAILERS TO HOLD HIGHER SHARE THAN RIGID TRUCKS DURING FORECAST PERIOD
  • FIGURE 14 AIR BELLOWS TO SECURE LEADING POSITION DURING FORECAST PERIOD
  • FIGURE 15 TRUCKS TO BE FASTEST-GROWING ELECTRIC & HYBRID VEHICLE SEGMENT DURING FORECAST PERIOD
  • FIGURE 16 ELECTRONICALLY CONTROLLED SEGMENT TO EXHIBIT FASTEST GROWTH DURING FORECAST PERIOD
  • FIGURE 17 ASIA PACIFIC TO BE LARGEST MARKET FOR AIR SUSPENSIONS DURING FORECAST PERIOD
  • FIGURE 18 AIR SUSPENSION MARKET DYNAMICS
  • FIGURE 19 GLOBAL COMMERCIAL VEHICLE PRODUCTION, 2021–2023 (THOUSAND UNITS)
  • FIGURE 20 GLOBAL PREMIUM PASSENGER CAR PRODUCTION, 2020–2023 (THOUSAND UNITS)
  • FIGURE 21 GLOBAL BEV AND PHEV PASSENGER CAR SALES, 2020–2030 (THOUSAND UNITS)
  • FIGURE 22 GLOBAL ELECTRIC TRUCK AND BUS SALES, 2020–2030 (THOUSAND UNITS)
  • FIGURE 23 TRENDS AND DISRUPTIONS IMPACTING CONSUMERS’ BUSINESSES
  • FIGURE 24 ECOSYSTEM ANALYSIS
  • FIGURE 25 SUPPLY CHAIN ANALYSIS
  • FIGURE 26 INVESTMENT AND FUNDING SCENARIO, 2021−2024
  • FIGURE 27 INFLUENCE OF STAKEHOLDERS ON BUYING PROCESS OF AIR SUSPENSION
  • FIGURE 28 KEY BUYING CRITERIA FOR AIR SUSPENSION, BY TECHNOLOGY
  • FIGURE 29 PATENT ANALYSIS
  • FIGURE 30 AIR SUSPENSION MARKET, BY VEHICLE TYPE, 2024–2030 (USD MILLION)
  • FIGURE 31 AIR SUSPENSION MARKET, BY TECHNOLOGY, 2024–2030 (USD MILLION)
  • FIGURE 32 AIR SUSPENSION MARKET, BY COMPONENT, 2024–2030 (USD MILLION)
  • FIGURE 33 AIR SUSPENSION AFTERMARKET, BY COMPONENT, 2024–2030 (USD MILLION)
  • FIGURE 34 CABIN AIR SUSPENSION MARKET, BY VEHICLE TYPE, 2024–2030 (USD MILLION)
  • FIGURE 35 ELECTRIC & HYBRID VEHICLE AIR SUSPENSION MARKET, BY TECHNOLOGY, 2024–2030 (USD MILLION)
  • FIGURE 36 ELECTRIC & HYBRID VEHICLE AIR SUSPENSION MARKET, BY VEHICLE TYPE, 2024–2030 (USD MILLION)
  • FIGURE 37 AIR SUSPENSION MARKET, BY REGION, 2024–2030 (USD MILLION)
  • FIGURE 38 ASIA PACIFIC: AIR SUSPENSION MARKET SNAPSHOT
  • FIGURE 39 EUROPE: AIR SUSPENSION MARKET SNAPSHOT
  • FIGURE 40 NORTH AMERICA: AIR SUSPENSION MARKET SNAPSHOT
  • FIGURE 41 REST OF THE WORLD: AIR SUSPENSION MARKET, BY COUNTRY, 2024–2030 (USD MILLION)
  • FIGURE 42 KEY PLAYER STRATEGIES/RIGHT TO WIN, 2020–2024
  • FIGURE 43 MARKET SHARE ANALYSIS OF KEY PLAYERS, 2023
  • FIGURE 44 REVENUE ANALYSIS OF TOP FIVE PLAYERS, 2019–2023
  • FIGURE 45 COMPANY EVALUATION MATRIX (KEY PLAYERS), 2023
  • FIGURE 46 AIR SUSPENSION MARKET: COMPANY FOOTPRINT
  • FIGURE 47 COMPANY EVALUATION MATRIX (START-UPS/SMES), 2023
  • FIGURE 48 VALUATION OF KEY PLAYERS, 2024
  • FIGURE 49 FINANCIAL METRICS OF KEY PLAYERS, 2024
  • FIGURE 50 PRODUCT/BRAND COMPARISON
  • FIGURE 51 ZF FRIEDRICHSHAFEN AG: COMPANY SNAPSHOT
  • FIGURE 52 CONTINENTAL AG: COMPANY SNAPSHOT
  • FIGURE 53 THYSSENKRUPP AG: COMPANY SNAPSHOT
  • FIGURE 54 HL MANDO CORP.: COMPANY SNAPSHOT
  • FIGURE 55 MERITOR, INC.: COMPANY SNAPSHOT
  • FIGURE 56 SAF-HOLLAND SE: COMPANY SNAPSHOT

The study encompassed four primary tasks to determine the present scope of the Air Suspension market. Initially, extensive secondary research was conducted to gather data on the market, its related sectors, and overarching industries. Subsequently, primary research involving industry experts across the value chain corroborated and validated these findings and assumptions. Employing both bottom-up and top-down methodologies, the complete market size was estimated. Following this, a market breakdown and data triangulation approach were utilized to determine the size of specific segments and subsegments within the market.

Secondary Research

The Secondary sources referred to in this research study include the Organization Internationale des Constructeurs d'Automobiles (OICA); European Automobile Manufacturers Association (ACEA); National Association of Automobile Manufacturers of South Africa (NAAMSA); corporate filings (such as annual reports, investor presentations, and financial statements); and trade, business, and automotive associations,  databases such as Factiva, MarkLines, and Bloomberg. The secondary data was collected and analyzed to determine the overall market size, further validated by primary research. Historical production data has been collected and analyzed, and the industry trend is considered to arrive at the forecast, further validated by primary research.

Primary Research

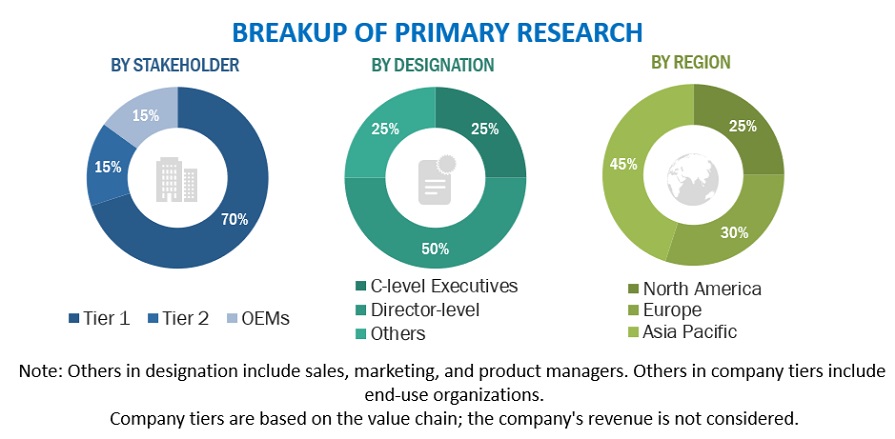
Extensive primary research has been conducted after understanding the air suspension market scenario through secondary research. Several primary interviews have been conducted with market experts from the demand- (OEMs) and the supply side (air suspension and component manufacturers) across major regions, namely, North America, Europe, Asia Pacific, and the Rest of the World. Approximately 85% and 15% of primary interviews have been conducted from the supply side and industry associations & dealers/distributors, respectively. Primary data has been collected through questionnaires, emails, and telephonic interviews. In the canvassing of primaries, we have strived to cover various departments within organizations, such as sales, operations, and administration, to provide a holistic viewpoint in our report.

After interacting with industry experts, we also conducted brief sessions with highly experienced independent consultants to reinforce the findings from our primaries. This and the in-house subject matter experts’ opinions have led us to the conclusions described in the remainder of this report.
Air Suspension Market  Size, and Share

Market Size Estimation

A detailed market estimation approach was followed to estimate and validate the value and volume of the air suspension market and other dependent submarkets, as mentioned below:

  • Key players in the air suspension market were identified through secondary research, and their global market shares were determined through primary and secondary research.
  • The research methodology included studying annual and quarterly financial reports, regulatory filings of significant market players (public), and interviews with industry experts for detailed market insights.
  • All industry-level penetration rates, percentage shares, splits, and breakdowns for the air suspension market were determined using secondary sources and verified through primary sources.
  • All key macro indicators affecting the revenue growth of the market segments and subsegments were accounted for, viewed in extensive detail, verified through primary research, and analyzed to get the validated and verified quantitative and qualitative data.
  • The gathered market data was consolidated and added with detailed inputs, analyzed, and presented in this report.

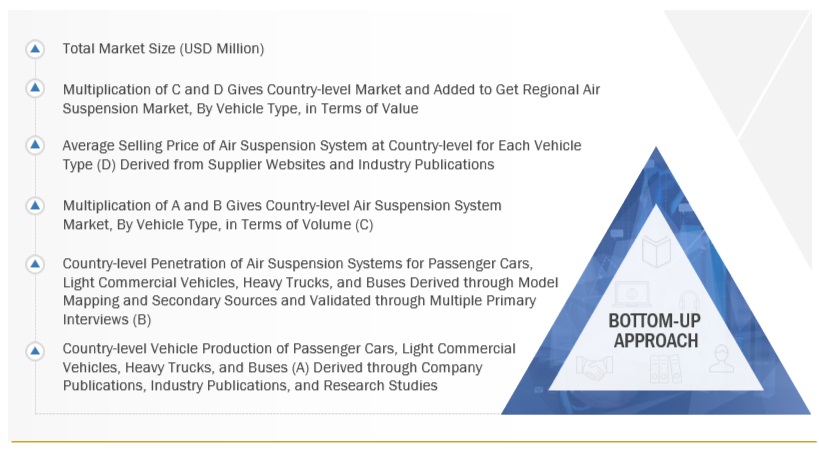
Bottom-up approach: Air suspension Market, by vehicle type
Air Suspension Market  Bottom Up Approach

To know about the assumptions considered for the study, Request for Free Sample Report

Market Breakdown and Data Triangulation

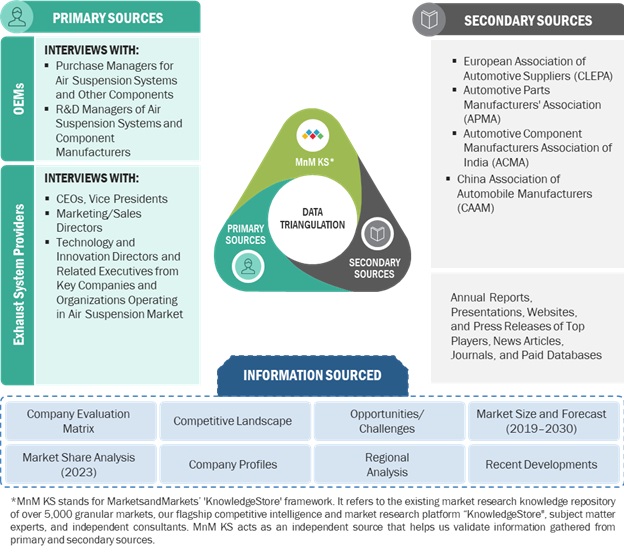
After arriving at the overall market size of the global market through the above-mentioned methodology, this market was split into several segments and subsegments. The data triangulation and market breakdown procedures were employed, wherever applicable, to complete the overall market engineering process and arrive at the exact data for the market by value for the key segments and subsegments. The extrapolated market data was triangulated by studying various macro indicators and regional trends from both the demand- and supply-side participants.

Data Triangulation
Air Suspension Market Data Triangulation

Market Definition

Air Suspension Systems:

An air suspension system replaces traditional metal springs, such as coils or leaf springs, with air springs or airbags to support the vehicle on its axles. This system relies on a network of airbags to provide the necessary suspension. Bellow type air suspension, piston-type air suspension, and elongated bellows type air suspension are the three prominent types of air suspension used in currently.

The key components of an air suspension system are air bellows, air compressors, and shock absorbers. Air suspension is crucial to a vehicle as it provides comfort, ride quality, stability, and safety.

Key Stakeholders

  • Senior Management
  • End User Finance/Procurement Department
  • R&D Department

Report Objectives

  • To define, describe, and forecast the air suspension market in terms of volume (units) and value (USD million)
  • OE Market By Component (air springs, shock absorbers, compressors, electronic control units, air reservoirs, height sensors, solenoid valves, and pressure sensors)
    • By Technology (electronically controlled and non-electronically controlled)
    • By Vehicle Type (passenger cars, LCVs, trucks, and buses)
    • Cabin Air Suspension Market By Vehicle Type (rigid trucks and semi-trailers)
    • Aftermarket, By Component (air bellows and shock absorber bushes)
    • Electric & Hybrid HDVs Air Suspension Market, By Vehicle Type (Light-duty Vehicles, Trucks and buses)
    • Electric & Hybrid HDVs Air Suspension Market, By Technology (Electronically controlled  and Non-electronically controlled)
    • By Region (Asia Pacific, Europe, North America, and Rest of the World)
  • To understand the market dynamics (drivers, restraints, opportunities, and challenges) of the air suspension market
  • To analyze the market share analysis of key players operating in the air suspension market
  • To analyze the competitive landscape and company profiles of global players operating in the air suspension market
  • To understand the dynamics of competitors and distinguish them into stars, emerging leaders, pervasive players, and emerging companies according to the strength of their product portfolio and business strategies
  • Strategically analyze the market with patent, trade, and supply chain analyses.
  • To analyze and understand the customer buying behavior in the air suspension market
  • To analyze recent developments, alliances, joint ventures, mergers & acquisitions, new product launches, and other activities carried out by key industry participants in the air suspension market

AVAILABLE CUSTOMIZATIONS

With the given market data, MarketsandMarkets offers customizations in accordance with the company’s specific needs.

Air Suspension Market, by Vehicle Type & Technology

  • Light Duty Vehicles
  • Trucks
  • Buses

Note: The market of Electronically Controlled vs. Non-electronically Controlled Air Suspension can be provided for each mentioned vehicle type in terms of volume and value

Air Suspension Componen Market by Vehicle Type

  • Light Duty Vehicles
  • Trucks
  • Buses

Note: The market of each considered component in the study can be provided for each mentioned vehicle type in terms of volume and value detailed analysis and profiling of additional market players (UP TO 5)

Custom Market Research Services

We will customize the research for you, in case the report listed above does not meet with your exact requirements. Our custom research will comprehensively cover the business information you require to help you arrive at strategic and profitable business decisions.

Request Customization

Instant Answers with GPT - Ask Now!

Ask real questions. Get complete answers !
Report Code
AT 4470
Published ON
Aug, 2024
Choose License Type
BUY NOW
  • SHARE
X
Request Customization
Speak to Analyst
Speak to Analyst
OR FACE-TO-FACE MEETING
PERSONALIZE THIS RESEARCH
  • Triangulate with your Own Data
  • Get Data as per your Format and Definition
  • Gain a Deeper Dive on a Specific Application, Geography, Customer or Competitor
  • Any level of Personalization
REQUEST A FREE CUSTOMIZATION
LET US HELP YOU!
  • What are the Known and Unknown Adjacencies Impacting the Air Suspension Market
  • What will your New Revenue Sources be?
  • Who will be your Top Customer; what will make them switch?
  • Defend your Market Share or Win Competitors
  • Get a Scorecard for Target Partners
CUSTOMIZED WORKSHOP REQUEST
knowledgestore logo

Want to explore hidden markets that can drive new revenue in Air Suspension Market?

Find Hidden Markets
  • Call Us
  • +1-888-600-6441 (Corporate office hours)
  • +1-888-600-6441 (US/Can toll free)
  • +44-800-368-9399 (UK office hours)
CONNECT WITH US
ABOUT TRUST ONLINE
©2024 MarketsandMarkets Research Private Ltd. All rights reserved
DMCA.com Protection Status
Website Feedback