X-by-Wire Systems Market by System Type [Shift-by-Wire, Throttle-by-Wire, Active Suspension (Suspension-by-Wire), Electronic Park Brake (Park-by-Wire), Fly-by-Wire & Other-by-Wire Technologies], by Vehicle Type (Passenger & Commercial) & by Geography - Global Market Trends & Forecast to 2014 to 2019


[298 Pages Report] The transition in automotive industry is greatly attributed to factors such as increasing push for fuel efficiency, safety, reduced emissions and others. In addition to this, highly precise and accurate motion control is also in great demand in the automotive industry. One such market driven by these factors is of Drive/X-by-Wire systems.
Drive/X-by-Wire technology replaces the mechanical linkages with electrical components such as control units, motors, actuators, sensors, batteries and others. The application of these systems reduces the overall weight thus making the vehicle lighter. This reduction in weight not only improves the fuel economy but also reduces the emissions from the vehicle. Moreover, the use of sensors, motors and actuators aid in providing an accurate, precise and quick response as and when required by the driver thus enhancing the performance of the vehicle.
Over the coming years, fuel economy and emission levels are anticipated to remain the focal point of the automotive industry and will drive the X-by-Wire systems market, globally. The increasing demand for hybrid electric vehicles has proved to be an opportunistic market for Drive/X-by-Wire systems as their installation is much easier in these vehicles as well as it will increase the effective range of electric vehicles owing to their light weight.
The report provides insights and comprehensive analysis on the Drive-by-Wire systems market, qualitative as well as quantitative. This report covers the market drivers, restraints, opportunities market dynamics, competitive landscape, and other aspects in context with the Drive-by-Wire systems market. The key players playing a major role in the market have also been identified and profiled.
Scope of the Report
The report covers the automotive Drive-by-Wire systems market size in terms of volume in thousand units from 2012 to 2019. The automotive X-by-Wire systems market is segmented by system type (Throttle-by-Wire, Suspension-by-Wire, Shift-by-Wire, Park-by-Wire, and Others-by-Wire), vehicle type (Passenger vehicles and Commercial vehicles), and geography (Asia-Oceania, Europe, and North America), focusing on key countries in each region.
Automotive X-by-Wire Systems Market, by System Type, 2012-2019 (�000 Units)
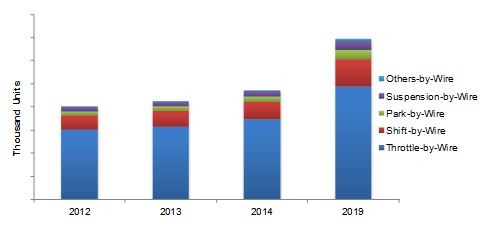
Source: MarketsandMarkets Analysis
The global X-by-Wire Systems Market is estimated to have sold over 139.3 Million Units by 2019. Both park-by-wire and shift-by-wire segments of the market will maintain a healthy growth rate during the forecasting period. The Shift-By-Wire and Park-by-Wire system market in terms of volume is projected to grow at a healthy CAGR of 9.14% and 12.31% respectively, from 2014 to 2019.
Nowadays, the automotive industry is more inclined to use advanced technologies to increase the fuel efficiency, reduce the emission levels and to enhance the driving dynamics of the vehicle.
These by-Wire systems have evolved from the need to lower the weight of the vehicles which is achieved by eliminating the mechanical connections in a vehicle. These transitions took place due to several reasons such as the stringent emission norms by the European Union and EPA, increase in fuel efficiency norms by CAF� and other authorities in European region, different road safety norms and the highly competitive market. These factors prompted companies to invest extensively in the X-by-Wire technologies so as to comply with these norms as well as to reduce the production costs and increase the driving comfort for the buyers.
In Europe and North America, X-by-Wire systems are well-established and have a high penetration rate. The use of these systems is also growing significantly in the Asia-Pacific regions, due to the increase in the consumer purchasing power and their preference for better safety measures and the need for higher fuel efficiency of the vehicle. China, Germany, U.S. and Japan, are expected to be the largest market for these by-Wire systems. Developing countries such as Mexico and others are expected to show a high growth rate in the demand for these technologies by the automobile manufactures which can also be seen with the increasing production of X-by-Wire systems during the years 2014 to 2019.
The global automotive X-by-Wire systems market is dominated by players such as Robert Bosch GmbH (Germany), Continental AG (Germany), Curtiss Wright Corp. (U.S.), TRW Automotive (U.S.), Nissan Motor Corporation (Japan), and P.S.A Citroen (France).
Automotive X-by-Wire System Market Size, by Systems Type, 2014-2019 (�000 Units)
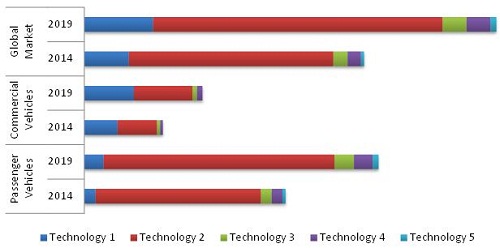
Source: MarketsandMarkets Analysis
 Exclusive indicates content/data unique to MarketsandMarkets and not available with any competitors.
Table of Contents
1 Introduction (Slide No.- 32)
1.1 Objectives of the Study
1.2 Definitions
1.3 Report Description
1.3.1 Report Catalyst
1.3.2 Report Structure
1.4 Glance At Markets
1.5 Stakeholders
1.6 Approach Adopted
1.7 Icons Used in the Report
2 Research Methodology (Slide No.- 42)
2.1 Market Estimation
2.1.1 Assumptions
2.1.2 Key Secondary Sources
2.1.3 Key Data Taken From Primary Sources
2.2 Key Data Taken From Secondary Sources
3 Executive Summary (Slide No.- 49)
3.1 Global Automotive X-By-Wire Systems Market
3.1.1 Automotive Systems Market By Vehicle Type
3.1.2 Automotive Systems Market By System Type
3.2 North American Automotive X-By-Wire Systems Market
3.3 European Automotive X-By-Wire Systems Market
3.4 Asia-Oceania Automotive X-By-Wire Systems Market
4 Market Overview (Slide No.- 60)
4.1 Introduction
4.2 Market Dynamics
4.2.1 Drivers
4.2.1.1 Gains in Performance & Efficiency
4.2.1.2 Less Maintenance Required
4.2.1.3 Easy Integration With Advanced Driver Assistance Systems (ADAS)
4.2.1.4 Provides the Manufacturer With Independence of Design
4.2.2 Restraints
4.2.2.1 Compatibility Issues With Existing 12v Vehicle Electronics Architecture
4.2.2.2 Slow Acceptance Among Vehicle Users
4.2.3 Opportunities
4.2.3.1 Electric & Hybrid Vehicles
4.3 Burning Issue
4.3.1 Are X-By-Wire Systems Fail-Safe?
4.4 Winning Imperative
4.4.1 Low-Cost Systems for Low-Cost Vehicles
4.5 Value Chain Analysis
4.6 Pestle Analysis
4.7 Porter�s Five forces Analysis
5 Technology Overview (Slide No.- 79)
5.1 What Are X-By-Wire Systems?
5.1.1 X-By-Wire Systems: Pros & Cons
5.2 Technology Roadmap
5.3 Throttle-By-Wire
5.3.1 Working of A Throttle-By-Wire System
5.3.2 Advantages
5.4 Shift-By-Wire Systems
5.4.1 Working of A Shift-By-Wire System
5.4.2 Advantages of A Shift-By-Wire System
5.5 Suspension-By-Wire
5.5.1 Working of A Suspension-By-Wire System
5.5.2 Pros & Cons of A Suspension-By-Wire System
5.6 Park-By-Wire System (Electronic Park Brake)
5.6.1 Working of A Park-By-Wire System
5.6.2 Advantages of A Park-By-Wire System
5.7 Brake-By-Wire System
5.7.1 Components and Working of Brake-By-Wire Systems
5.7.2 Types of A Brake-By-Wire System
5.7.3 Advantages and Disadvantages of A Brake-By-Wire System
5.8 Steer-By-Wire Systems
5.8.1 History of Steer-By-Wire Systems
5.8.2 Components of A Steer-By-Wire System
5.8.3 Working of A Steer-By-Wire System
5.8.4 Advantages and Disadvantages of A Steer-By-Wire System
5.9 Fly-By-Wire Systems
5.9.1 History of Fly-By-Wire System
5.9.2 Components of Fly-By-Wire System
5.9.3 Working of A Fly-By-Wire System
5.9.4 Applications of Fly-By-Wire System
5.9.5 Legislative Scenario Concerning Fly-By-Wire Systems
5.9.6 Further Advancements in Fly-By-Wire Technology
5.9.7 Advantages & Disadvantages of A Fly-By-Wire System
6 Market Analysis, By System Type (Slide No.- 113)
6.1 Automotive X-By-Wire Systems Market
6.1.1 Passenger Vehicles X-By-Wire Systems Market
6.1.2 Commercial Vehicles X-By-Wire Systems Market
6.2 Shift-By-Wire Systems Market
6.2.1 Market Analysis, By Region
6.2.2 Market Analysis, By Vehicle Type
6.3 Throttle-By-Wire Systems Market
6.3.1 Market Analysis, By Region
6.3.2 Market Analysis, By Vehicle Type
6.4 Suspension-By-Wire Systems Market
6.4.1 Market Analysis, By Region
6.4.2 Market Analysis, By Vehicle Type
6.5 Park-By-Wire Systems Market
6.5.1 Market Analysis, By Region
6.5.2 Market Analysis, By Vehicle Type
6.6 Others-By-Wire Systems Market
7 Market Analysis, By Region (Slide No.- 143)
7.1 Key Questions Answered
7.2 Global Market Outlook for X-By-Wire Systems Market, By 2019
7.3 Automotive X-By-Wire Systems Market
7.3.1 Regional Automotive Market, By Vehicle Type
7.4 North American Automotive Market
7.4.1 Passenger Vehicles Automotive Systems Market
7.4.2 Commercial Vehicles Automotive Systems Market
7.4.3 Key Country Level Markets
7.4.3.1 U.S. Automotive Systems Market
7.4.3.1.1 Passenger Vehicles Automotive Systems Market
7.4.3.1.2 Commercial Vehicles Automotive Systems Market
7.4.3.2 Canadian Automotive Systems Market
7.4.3.2.1 Passenger Vehicles Automotive Systems Market
7.4.3.2.2 Commercial Vehicles Automotive Systems Market
7.4.3.3 Mexican Automotive Systems Market
7.4.3.3.1 Passenger Vehicles Automotive Systems Market
7.4.3.3.2 Commercial Vehicles Automotive Systems Market
7.5 European Automotive Systems Market
7.5.1 Passenger Vehicles Automotive Systems Market
7.5.2 Commercial Vehicles Automotive Systems Market
7.5.3 Key Country Level Markets
7.5.3.1 German Automotive Systems Market
7.5.3.1.1 Passenger Vehicles Automotive Systems Market
7.5.3.1.2 Commercial Vehicles Automotive Systems Market
7.5.3.2 French Automotive Systems Market
7.5.3.2.1 Passenger Vehicles Automotive Systems Market
7.5.3.2.2 Commercial Vehicles Automotive Systems Market
7.5.3.3 U.K. Automotive Systems Market
7.5.3.3.1 Passenger Vehicles Automotive Systems Market
7.5.3.3.2 Commercial Vehicles Automotive Systems Market
7.5.3.4 Italian Automotive Systems Market
7.5.3.4.1 Passenger Vehicles Automotive Systems Market
7.5.3.4.2 Commercial Vehicles Automotive Systems Market
7.5.3.5 Rest of Europe Automotive Market
7.5.3.5.1 Passenger Vehicles Automotive Systems Market
7.5.3.5.2 Commercial Vehicles Automotive Systems Market
7.6 Asia-Oceania Automotive X-By-Wire Systems Market
7.6.1 Passenger Vehicles Automotive Systems Market
7.6.2 Commercial Vehicles Automotive Systems Market
7.6.3 Key Country Level Markets
7.6.3.1 Chinese Market
7.6.3.1.1 Passenger Vehicles Automotive Systems Market
7.6.3.1.2 Commercial Vehicles Automotive Systems Market
7.6.3.2 Japan: Market
7.6.3.2.1 Passenger Vehicles Automotive Systems Market
7.6.3.2.2 Commercial Vehicles Automotive Systems Market
7.6.3.3 South Korean Market
7.6.3.3.1 Passenger Vehicles Automotive Systems Market
7.6.3.3.2 Commercial Vehicles Automotive Systems Market
7.6.3.4 Rest of Asia-Oceania Market
7.6.3.4.1 Passenger Vehicles Automotive Systems Market
7.6.3.4.2 Commercial Vehicles Automotive Systems Market
8 Competitive Landscape (Slide No.- 259)
8.1 Key Growth Strategies
8.2 Key Market Players and their Geographic Revenue Split
9 Company Profiles (Slide No.- 267)
9.1 Continental AG
9.2 CTS Corporation
9.3 Curtis-Wright Corporation
9.4 Infineon Technologies AG
9.5 Jaguar Land-Rover Automotive PLC
9.6 Nissan Motor Co.
9.7 Orscheln Products LLC.
9.8 TRW Automotive PLC
9.9 ZF Friedrichshafen AG
List of Tables (68 Tables)
Table 1 X-By-Wire Systems Market Share (Volume), 2014-2019
Table 2 North America: Market Size, By Technology 2012-2019 (�000 Units)
Table 3 Europe: Market Size, By Technology 2012-2019 (�000 Units)
Table 4 Asia Oceania: Market Size, By Technology 2012-2019 (�000 Units)
Table 5 X-By-Wire Systems Market Size, By System Type, 2014�2019 (�000 Units)
Table 6 Passenger Vehicles Market Size, By System Type, 2014�2019 (�000 Units)
Table 7 Commercial Vehicles Market, By System Type, 2014�2019 (�000 Units)
Table 8 Shift-By-Wire Systems Market Size, By Region, 2014�2019 (�000 Units)
Table 9 Shift-By-Wire Systems Market Size, By Vehicle Type, 2014�2019 (�000 Units)
Table 10 Throttle-By-Wire Systems Market, By Region, 2014�2019 (�000 Units)
Table 11 Throttle-By-Wire Systems Market, By Vehicle Type, 2014�2019 (�000 Units)
Table 12 Suspension-By-Wire Systems Market, By Region, 2014�2019 (�000 Units)
Table 13 Suspension-By-Wire Systems Market, By Vehicle Type, 2014�2019 (�000 Units)
Table 14 Park-By-Wire Systems Market, By Region, 2014�2019 (�000 Units)
Table 15 Park-By-Wire Systems Market, By Vehicle Type, 2014�2019 (�000 Units)
Table 16 Others-By-Wire Systems Market, By Region, 2014�2019 (�000 Units)
Table 17 Market Size, By Region, 2014-2019 (�000 Units)
Table 18 North America: Systems Market Size, By Vehicle Type, 2012-2019 (�000 Units)
Table 19 Europe: Systems Market Size, By Vehicle Type, 2012-2019 (�000 Units)
Table 20 Asia-Oceania: Systems Market Size, By Vehicle Type, 2012-2019 (�000 Units)
Table 21 North America: Systems Market Size, By System Type, 2012-2019 (�000 Units)
Table 22 North America: Passenger Vehicles Market Size, By System Type, 2012-2019 (�000 Units)
Table 23 North America: Commercial Vehicles Systems Market Size, By System Type, 2012-2019 (�000 Units)
Table 24 North America: Automotive Market Size, By Country, 2012-2019 (�000 Units)
Table 25 U.S.: Automotive Market Size, By System Type, 2012-2019 (�000 Units)
Table 26 U.S: Passenger Vehicles Systems Market Size, By System Type, 2012-2019 (�000 Units)
Table 27 U.S.: Commercial Vehicles Systems Market Size, By System Type, 2012-2019 (�000 Units)
Table 28 Canada: Automotive Systems Market Size, By System Type, 2012-2019 (�000 Units)
Table 29 Canada: Passenger Vehicles Systems Market Size, By System Type, 2012-2019 (�000 Units)
Table 30 Canada: Commercial Vehicles Systems Market Size, By System Type, 2012-2019 (�000 Units)
Table 31 Mexico: X-By-Wire Systems Market Size, By System Type, 2012-2019 (�000 Units)
Table 32 Mexico: Passenger Vehicles Systems Market Size, By System Type, 2012-2019 (�000 Units)
Table 33 Mexico: Commercial Vehicles Systems Market Size, By System Type, 2012-2019 (�000 Units)
Table 34 Europe: X-By-Wire Systems Market Size, By System Type, 2012-2019 (�000 Units)
Table 35 Europe: Passenger Vehicles Systems Market Size, By System Type, 2012-2019 (�000 Units)
Table 36 Europe: Commercial Vehicles Systems Market Size, By System Type, 2012-2019 (�000 Units)
Table 37 Europe: Automotive Systems Market Size, By Country, 2012-2019 (�000 Units)
Table 38 Germany: Market Size, By System Type, 2012-2019 (�000 Units)
Table 39 Germany: Passenger Vehicles Systems Market Size, By System Type, 2012-2019 (�000 Units)
Table 40 Germany: Commercial Vehicles Systems Market Size, By System Type, 2012-2019 (�000 Units)
Table 41 France: Market Size, By System Type, 2012-2019 (�000 Units)
Table 42 France: Passenger Vehicles Systems Market Size, By System Type, 2012-2019 (�000 Units)
Table 43 France: Commercial Vehicles Systems Market Size, By System Type, 2012-2019 (�000 Units)
Table 44 U.K. X-By-Wire Systems Market Size, By System Type, 2012-2019 (�000 Units)
Table 45 U.K.: Passenger Vehicles Systems Market Size, By System Type, 2012-2019 (�000 Units)
Table 46 U.K.: Commercial Vehicles Systems Market Size, By System Type, 2012-2019 (�000 Units)
Table 47 Italy: Market Size, By System Type, 2012-2019 (�000 Units)
Table 48 Italy: Passenger Vehicles Systems Market Size, By System Type, 2012-2019 (�000 Units)
Table 49 Italy: Commercial Vehicles Systems Market Size, By System Type, 2012-2019 (�000 Units)
Table 50 Rest of Europe: Market Size, By System Type, 2012-2019 (�000 Units)
Table 51 Rest of Europe: Passenger Vehicles Systems Market Size, By System Type, 2012-2019 (�000 Units)
Table 52 Rest of Europe: Commercial Vehicles Systems Market Size, By System Type, 2012-2019 (�000 Units)
Table 53 Asia-Oceania:Market Size, By System Type, 2012-2019 (�000 Units)
Table 54 Asia-Oceania: Passenger Vehicles Systems Market Size, By System Type, 2012-2019 (�000 Units)
Table 55 Asia-Oceania: Commercial Vehicles Systems Market Size, By System Type, 2012-2019 (�000 Units)
Table 56 Asia-Oceania: Market Size, By Country, 2012-2019 (�000 Units)
Table 57 China: Market Size, By System Type, 2012-2019 (�000 Units)
Table 58 China: Passenger Vehicles Systems Market Size, By System Type, 2012-2019 (�000 Units)
Table 59 China: Commercial Vehicles Systems Market Size, By System Type, 2012-2019 (�000 Units)
Table 60 Japan X-By-Wire Systems Market Size, By System Type, 2012-2019 (�000 Units)
Table 61 Japan: Passenger Vehicles Systems Market Size, By System Type, 2012-2019 (�000 Units)
Table 62 Japan: Commercial Vehicles Systems Market Size, By System Type, 2012-2019 (�000 Units)
Table 63 South Korea X-By-Wire Systems Market Size, By System Type, 2012-2019 (�000 Units)
Table 64 South Korea: Passenger Vehicles Systems Market Size, By System Type, 2012-2019 (�000 Units)
Table 65 South Korea: Commercial Vehicles Systems Market Size, By System Type, 2012-2019 (�000 Units)
Table 66 Rest of Asia-Oceania: Market Size, By System Type, 2012-2019 (�000 Units)
Table 67 Rest of Asia-Oceania: Passenger Vehicles Systems Market Size, By System Type, 2012-2019 (�000 Units)
Table 68 Rest of Asia-Oceania: Commercial Vehicles Systems Market Size, By System Type, 2012-2019 (�000 Units)
List of Figures (33 Figures)
Figure 1 Global X-By-Wire Systems Market Size, 2014 (94.5 Million Units)
Figure 2 Passenger Vehicle Vs. Commercial Vehicle X-By-Wire Systems Market
Figure 3 Key North American Country Level Systems Market Size, By System Type, 2014
Fogire 4 Key European Country Level Systems Market, By System Type, 2014
Figure 5 Key Asia-Oceania Country Level Systems Market, By System Type, 2014
Figure 4 Market Size, By Country, 2012-2019 (Million Units)
Figure 5 Market Dynamics: Impact Analysis
Figure 6 EPA: Light Vehicles Corporate Average Fuel Economy Target, 2016-2025
Fogire 5 Conventional Power Steering System Components Vs. Steer-By-Wire Components
Figure 6 Brake, Steer, and Throttle-By-Wire: Associated Technologies & Sensors Mapping
Figure 7 Nissan Murano & Murano Ea2 Concept Wheelbase Comparison
Figure 8 EV Sales Outlook: 2012�2020 (Million Units)
Figure 9 X-By-Wire Systems Market: Value Chain Analysis
Fogire 6 Market: Value Chain Mapping
Figure 7 Porter�s Five forces Analysis
Figure 10 Major Automotive X-By-Wire Systems
Figure 11 Pros and Cons
Figure 12 Automotive X-By-Wire Systems: Technology Roadmap
Fogire 7 Throttle-By-Wire System
Figure 8 Shift-By-Wire System Components
Figure 13 Suspension-By-Wire System Components
Figure 14 Pros and Cons of Suspension-By-Wire Systems
Figure 15 Difference Between Electro-Hydraulic Brake and Electro-Mechanical Brake
Fogire 8 Advantages and Disadvantages of Brake-By-Wire
Figure 9 Working of Steer-By-Wire
Figure 16 Advantages and Disadvantages of Steer-By-Wire System
Figure 17 Working of Fly-By-Wire
Figure 18 Advantages and Disadvantages of Fly-By-Wire System
Fogire 9 Key Growth Strategies Adopted in the Automotive X-By-Wire Systems Market, By Approach, 2000-2014
Figure 10 Key Growth Strategies in Market, 2000-2014
Figure 19 Key Market Participants
Figure 20 Contribution By Different Market Players
Figure 21 Concept Vehicles Showcasing X-By-Wire Technologies
Figure 22 Pros And Cons of Suspension-By-Wire Systems
Figure 23 Difference Between Electro-Hydraulic Brake And Electro-Mechanical Brake
Figure 24 Advantages And Disadvantages Of Brake-By-Wire
Figure 25 Working of Steer-By-Wire
Figure 26 Advantages And Disadvantages of Steer-By-Wire System
Figure 27 Working of Fly-By-Wire
Figure 28 Advantages And Disadvantages of Fly-By-Wire System
Figure 29 Key Growth Strategies Adopted in the Market, By Approach, 2000-2014
Figure 30 Key Growth Strategies in Market, 2000-2014
Figure 31 Key Market Participants
Figure 32 Contribution By Different Market Players
Figure 33 Concept Vehicles Showcasing X-By-Wire Technologies
List of Graphs (64 Graphs)
Graph 1 X-By-Wire Systems Market Share (Volume), 2014-2019
Graph 2 Market Size, 2014 (�000 Units)
Graph 3 Market Size, By System Type, 2014�2019 (�000 Units)
Graph 4 Passenger Vehicles Systems Market Size, By System Type, 2014�2019 (�000 Units)
Graph 5 Commercial Vehicles Systems Market, By System Type, 2014�2019 (�000 Units)
Graph 6 Shift-By-Wire Systems Market Size, By Region, 2014�2019 (�000 Units)
Graph 7 Shift-By-Wire Systems Market Size, By Vehicle Type, 2014�2019 (�000 Units)
Graph 8 Throttle-By-Wire Systems Market, By Region, 2014�2019 (�000 Units)
Graph 9 Throttle-By-Wire Systems Market, By Vehicle Type, 2014�2019 (�000 Units)
Graph 10 Suspension-By-Wire Systems Market, By Region, 2014�2019 (�000 Units)
Graph 11 Suspension-By-Wire Systems Market, By Vehicle Type, 2014�2019 (�000 Units)
Graph 12 Park-By-Wire Systems Market, By Region, 2014�2019 (�000 Units)
Graph 13 Park-By-Wire Systems Market, By Vehicle Type, 2014�2019 (�000 Units)
Graph 14 Others-By-Wire Systems Market, By Region, 2014�2019 (�000 Units)
Graph 15 Automotive X-By-Wire Systems Market Size, By Region, 2014-2019 (�000 Units)
Graph 16 Regional Automotive Market Size, By Vehicle Type, 2012-2019 (�000 Units)
Graph 17 North America: Market Size, By System Type, 2012-2019 (�000 Units)
Graph 18 North America: Passenger Vehicles Systems Market Size, By System Type, 2012-2019 (�000 Units)
Graph 19 North America: Commercial Vehicles Systems Market Size, By System Type, 2012-2019 (�000 Units)
Graph 20 North America: Automotive Systems Market Size, By Country, 2012-2019 (�000 Units)
Graph 21 U.S. Automotive X-By-Wire Systems Market Size, By System Type, 2012-2019 (�000 Units)
Graph 22 U.S: Passenger Vehicles Systems Market Size, By System Type, 2012-2019 (�000 Units)
Graph 23 U.S.: Commercial Vehicles Systems Market Size, By System Type, 2012-2019 (�000 Units)
Graph 24 Canada: Market Size, By System Type, 2012-2019 (�000 Units)
Graph 25 Canada: Passenger Vehicles Systems Market Size, By System Type, 2012-2019 (�000 Units)
Graph 26 Canada: Commercial Vehicles Systems Market Size, By System Type, 2012-2019 (�000 Units)
Graph 27 Mexico: Market Size, By System Type, 2012-2019 (�000 Units)
Graph 28 Mexico: Passenger Vehicles Systems Market Size, By System Type, 2012-2019 (�000 Units)
Graph 29 Mexico: Commercial Vehicles Systems Market Size, By System Type, 2012-2019 (�000 Units)
Graph 30 Europe X-By-Wire Systems Market Size, By System Type, 2012-2019 (�000 Units)
Graph 31 Europe: Passenger Vehicles Systems Market Size, By System Type, 2012-2019 (�000 Units)
Graph 32 Europe: Commercial Vehicles Systems Market Size, By System Type, 2012-2019 (�000 Units)
Graph 33 Europe: Market Size, By Country, 2012-2019 (�000 Units)
Graph 34 Germany: Market Size, By System Type, 2012-2019 (�000 Units)
Graph 35 Germany: Passenger Vehicles Systems Market Size, By System Type, 2012-2019 (�000 Units)
Graph 36 Germany: Commercial Vehicles Systems Market Size, By System Type, 2012-2019 (�000 Units)
Graph 37 France: Market Size, By System Type, 2012-2019 (�000 Units)
Graph 38 France: Passenger Vehicles Systems Market Size, By System Type, 2012-2019 (�000 Units)
Graph 39 France: Commercial Vehicles Systems Market Size, By System Type, 2012-2019 (�000 Units)
Graph 40 U.K.: Market Size, By System Type, 2012-2019 (�000 Units)
Graph 41 U.K.: Passenger Vehicles Systems Market Size, By System Type, 2012-2019 (�000 Units)
Graph 42 U.K.: Commercial Vehicles Systems Market Size, By System Type, 2012-2019 (�000 Units)
Graph 43 Italy: Market Size, By System Type, 2012-2019 (�000 Units)
Graph 44 Italy: Passenger Vehicles Systems Market Size, By System Type, 2012-2019 (�000 Units)
Graph 45 Italy: Commercial Vehicles Systems Market Size, By System Type, 2012-2019 (�000 Units)
Graph 46 Rest of Europe: Market Size, By System Type, 2012-2019 (�000 Units)
Graph 47 Rest of Europe: Passenger Vehicles Systems Market Size, By System Type, 2012-2019 (�000 Units)
Graph 48 Rest of Europe: Commercial Vehicles Systems Market Size, By System Type, 2012-2019 (�000 Units)
Graph 49 Asia-Oceania: X-By-Wire Systems Market Size, By System Type, 2012-2019 (�000 Units)
Graph 50 Asia-Oceania: Passenger Vehicles Systems Market Size, By System Type, 2012-2019 (�000 Units)
Graph 51 Asia-Oceania: Commercial Vehicles Systems Market Size, By System Type, 2012-2019 (�000 Units)
Graph 52 Asia-Oceania: Automotive Systems Market Size, By Country, 2012-2019 (�000 Units)
Graph 53 China: Market Size, By System Type, 2012-2019 (�000 Units)
Graph 54 China: Passenger Vehicles Systems Market Size, By System Type, 2012-2019 (�000 Units)
Graph 55 China: Commercial Vehicles Systems Market Size, By System Type, 2012-2019 (�000 Units)
Graph 56 Japan: Market Size, By System Type, 2012-2019 (�000 Units)
Graph 57 Japan: Passenger Vehicles Systems Market Size, By System Type, 2012-2019 (�000 Units)
Graph 58 Japan: Commercial Vehicles Systems Market Size, By System Type, 2012-2019 (�000 Units)
Graph 59 South Korea: Market Size, By System Type, 2012-2019 (�000 Units)
Graph 60 South Korea: Passenger Vehicles Systems Market Size, By System Type, 2012-2019 (�000 Units)
Graph 61 South Korea: Commercial Vehicles Systems Market Size, By System Type, 2012-2019 (�000 Units)
Graph 62 Rest of Asia-Oceania: Systems Market Size, By System Type, 2012-2019 (�000 Units)
Graph 63 Rest of Asia-Oceania: Passenger Vehicles Systems Market Size, By System Type, 2012-2019 (�000 Units)
Graph 64 Rest of Asia-Oceania: Commercial Vehicles X-By-Wire Systems Market Size, By System Type, 2012-2019 (�000 Units)


Growth opportunities and latent adjacency in X-by-Wire Systems Market
Hello is brake and steer by wire included under "Other" in this report? (see overview graph) Or do you break out separately?