Air Starter Market Size, Share, Growth, Trends, Analysis

Air Starter Market by Type (Vane Air Starter, Turbine Air Starter, Electric Air Starter), End User (Oil & Gas, Military & Aviation, Mining, Marine), & Region (North America, Europe, APAC, South America and Middle East & Africa) - Global Forecast to 2029

Report Code: EP 4443 Aug, 2024, by marketsandmarkets.com

[179 Pages Report] The air starter market is forecast to reach USD 559 million by 2029 from an estimated USD 449 million in 2024, at a CAGR of 4.5% during the forecast period (2024-2029). Increasing industrialization and growing end use industries like oil & gas, military & aviation and marine are driving the air starters market. Air starters are increasingly being adopted for heavy industrial applications due to their safety and reliability. The market dynamics of air starters depend on growth in end use industries and advancements in engine starting technologies. Ongoing advancements in air starter technology, such as the use of enhanced materials and designs that improve durability and efficiency and provide increased torque capabilities are particularly being focused. Unlike electric starters, air starters can withstand extreme temperatures and dusty environments and eliminate the risk of sparks.

Air Starter Market

To know about the assumptions considered for the study, Request for Free Sample Report

Air Starter Market

To know about the assumptions considered for the study, download the pdf brochure

Air Starter Market Dynamics

Driver:  Thriving oil & gas and aviation industries

Increased drilling activities and investments in the oil & gas industry have been a notable trend in recent years. Despite some fluctuations in spending patterns, overall momentum exists toward increased investment in drilling and production activities. This trend is driven by energy security, supply reliability, and the need to expand production capacity. The rising drilling activities and investments in the oil & gas sector are expected to significantly impact the air starter market.

The oil and gas industry relies extensively on heavy machinery and equipment for exploration, drilling, and extraction. Air starters are highly reliable engine starting systems for in hazardous and explosive environments of oil & gas industry thus making them essential for this industry's operations. These starting systems provide a durable and dependable alternative for starting large engines, compressors, and pumps, thus reducing downtime. Furthermore, air starters offer a safer alternative to conventional electric starters, lowering the risk of sparks and fire in hazardous conditions.

Further the growth in commercial and military aircraft fleets is boosting the demand for air starters. Air starters are used in variety of aircraft, from commercial airliners to military jets. The commercial airliners consist of two segments: passenger aircraft and cargo aircraft. In recent times, both segments have seen a rapid rise in operations that provided a boost to the commercial aircraft industry. With the rising air traffic, the industry has seen a leap, which also has significant impact in the growth of air starters. Air starters serve as a reliable and efficient means of starting aircraft engines especially when safety and quick turnaround times are paramount. These starters are preferred in the aviation industry due to their high power-to-weight ratio, low maintenance requirements, and ability to start engines in extreme temperatures.

Thus, the growth in oil & gas and military and aviation industries is expected to drive the air starter market.

Restraint: Higher costs than electric starters

Air starters and associated equipment are economical in some applications such as running compressors, where the source of compressed air is readily available. But when air starters are installed along with the compression medium for compressed air supply, such as motor-driven compressors, controls, filters, valves, and others, they exceed the cost of electric starters and its support equipment. There are many reasons why air starters are more expensive that electric starters. Complexity of system, materials used, and their safety features. This limits the usage of air starters to very limited applications such as large-size diesel engines where size of electric starters and battery becomes difficult to accommodate despite low cost as compared to air starters.

Opportunities: Growing industrialization and stringent environmental regulations

The demand for air starter is driven by substantially as industrial activities increase globally. While the growth in industries like oil & gas, mining, and transport expands, the need for reliable and effective engine starting systems becomes increasingly pressing. Further, the stringent environmental regulations regarding lowering emissions and enhancing safety have resulted in a shift toward air starters, over conventional electric starters. Air starters use compressed air, instead of natural gas, to start internal combustion engines for compressors, generators, and pumps thus reducing methane emissions during engine startups. Stricter regulations encourage companies to adopt cleaner technologies like air starters to meet emission reduction targets.

Thus, the growing trajectory of air starters is expected to further be driven by increased investment in R&D and the creation of new technologies and innovations in the sector.

Challenges: Advancements in battery technology

While air starters remain essential today, evolving battery technologies could impact their future demand. Batteries have improved performance over the period and have become more protected against harsh environmental conditions. Advances in material technology have made batteries more efficient and less expensive.

Many companies are investing in the R&D for the advancements of solid-state batteries, which offer advantages like higher energy density, faster charging, and improved safety due to reduced fire risk. Moreover, low cost of electric starting systems is one of the key factors which may pose as a challenge to the growth of air starters.

Air Starter Market Ecosystem

Leading companies in this market include manufacturers of air starter which have been long operating in the market and have a differentiated product portfolio. Some of the major companies in this market include Ingersoll Rand (US), Caterpillar (US), Rheinmetall SG (Germany), Maradyne (US), KH Equipment (Australia), and Honeywell International (US).

Top Companies in Air Starter Market

Turbine air starters is expected to be the largest segment by type during the forecast period.

Turbine air starter initiate the rotation of gas turbine engines until they reach a self-sustaining speed. These devices leverage compressed air to produce the necessary torque to start the engine. Turbine air starters are commonly used in various industries, including aviation, marine, and oil and gas, particularly for starting jet engines, large reciprocating engines, and gas turbines. These air starters are smaller and lighter than electric starters, Capable of producing high torque at low speeds, from a compact, lightweight source, essential for starting large engines and ensuring reliable engine starts under various environmental conditions.

In oil & gas industry turbine air starters are used to start large gas turbines that drive pumps and generators on offshore drilling rigs. For example, General Electric's LM2500 gas turbines, commonly used on rigs, are started using air turbine starters due to their ability to provide high torque in a compact form.

By End user, oil & gas is expected to be the largest segment during the forecast period.

Oil & Gas is the dominant end use industry of air starters. In the oil & gas industry air starters are used to initiate the operation of large engines and gas turbines commonly installed in drilling rigs, production platforms, and refineries for power generation and mechanical drive applications. They also start large diesel engines for auxiliary power and backup systems, ensuring operational continuity in remote locations. The market is driven by increasing oil & gas exploration activities and the need for reliable starting solutions in harsh environments.

Air starters are preferred in the oil & gas sector due to their higher reliability and safety than electric starters. These starters reduce the risk of ignition in potentially explosive environments by eliminating the need for electrical spark-based starting mechanisms. This is crucial in oil & gas facilities where flammable gases are present. Designed to withstand harsh conditions, air starters offer reliable performance under extreme temperatures and high-vibration environments typically found in exploration sites.

“Asia pacific”: The fastest region in the air starter market.

Asia Pacific is the fastest region in the air starter market with China being the largest market in the region. The region is experiencing significant economic development and growth in industrialization, leading to a increasing demand of reliable engine starting systems for various end use industries. China is expected to witness highest growth throughout the forecast period owing to its substantial oil & gas activities The country’s rapidly expanding aviation sector is another key driver for increasing demand for air starters. The growth of domestic and international flights necessitates reliable engine start systems. Apart from China, India and rest of Asia Pacific region are also expected to be attractive markets for air starters during the forecast period.

Air Starter Market  Size, and Share

Key Market Players

The market is dominated by a few major players that have a wide regional presence. The major players in the air starter market are Ingersoll Rand (US), Caterpillar (US), Rheinmetall AG (Germany), Maradyne (US), KH Equipment (Australia), and Honeywell International (US). Between 2020 and 2024, strategies such as product launches, partnerships, collaborations, alliances, and expansions are followed by these companies to capture a larger share of market.

Want to explore hidden markets that can drive new revenue in Air Starter Market?

Scope of the Report

Report Metric

Details

Market size available for years

2021–2029

Base year considered

2023

Forecast period

2024–2029

Forecast units

Value (USD)

Segments covered

Type, End User and Region

Geographies covered

Asia Pacific, North America, Europe, Middle East & Africa, and South America

Companies covered

Ingersoll Rand (US), Caterpillar (US), Rheinmetall AG (Germany), Honeywell International Inc. (US) TLD (France), Maradyne (US), SPICO (South Korea), JetAll (US), Guinalt (France), MASCO (US), KH Equipment (Australia), TDI (US), Hilliard Corporation (US), Textron Specialized vehicles (US) YSwinch.com (China) Gali (Spain), Industrial Power Units ltd (UK), Powerworks (PTY) Ltd (South Africa), Dusterloh Fluidtechnik GmbH (Germany), Mak Controls (India).

This research report categorizes the air starter market by type, end user and region.

On the basis of type, the air starter market has been segmented as follows:
  • Vane Air Starters
  • Turbine Air Starters
  • Electric Air Starters
On the basis of End User, the air starter market has been segmented as follows:
  • Oil & Gas
  • Military & Aviation
  • Mining
  • Marine
  • Others
On the basis of region, the air starter market has been segmented as follows:
  • Asia Pacific
  • Europe
  • North America
  • Middle East & Africa
  • South America

Recent Developments

  • In March 2023, Ingersoll Rand introduced its ST2000 Air Starter led by an inline turbine design that allows for efficient air consumption. The ST2000 unlocks productivity for engines ranging from 15 liters up to 150 liters, packing a 70hp punch into a 40-pound package.
  • In April 2023, Ingersoll Rand unveiled its 2922 Series of pneumatic wrenches and productivity-boosting engine air starters. The new release pneumatic impact wrenches provide 2,000 foot-pounds of nut-busting torque in a durable, affordable 12-lb. package.
  • In September 2022, Rheinmetall’s Canadian branch Rheinmetall Canada showcased the world’s first zero-emission, all-electric air start unit. Air Canada has become a development partner and, upon successful completion of the trial, plans to incorporate the Rheinmetall eMSU into its fleet of mobile ground air start units.

Frequently Asked Questions (FAQ):

To speak to our analyst for a discussion on the above findings, click Speak to Analyst

Exclusive indicates content/data unique to MarketsandMarkets and not available with any competitors.

INTRODUCTION
20
RESEARCH METHODOLOGY
25
EXECUTIVE SUMMARY
37
PREMIUM INSIGHTS
40
MARKET OVERVIEW
42
  • 5.1 INTRODUCTION
  • 5.2 MARKET DYNAMICS
    DRIVERS
    - Thriving oil & gas and aviation sectors
    - Increasing deployment of air starters in hazardous industrial settings
    RESTRAINTS
    - Higher costs than electric starters
    OPPORTUNITIES
    - Increasing focus on R&D and integration of new technologies into air starters
    CHALLENGES
    - Advancements in battery technology
  • 5.3 CASE STUDY ANALYSIS
    IPU SUPPLIES ADVANCED AIR STARTS TO POWER CATERPILLAR 3616 ENGINES AT PEARL GTL PLANT IN QATAR TO ENSURE SAFETY AND RELIABILITY
    IPU DEPLOYS AIR STARTERS FOR GENERATORS AT SAKHALIN ISLAND LNG PLANT FOR RELIABLE POWER IN EXTREME CLIMATES
    IPU IMPLEMENTS STARTERS FOR GENERATORS AT SAKHALIN ISLAND LNG PLANT FOR RELIABLE PERFORMANCE UNDER EXTREME CONDITIONS
  • 5.4 INVESTMENT AND FUNDING SCENARIO
  • 5.5 TRENDS/DISRUPTIONS IMPACTING CUSTOMER BUSINESS
  • 5.6 VALUE CHAIN ANALYSIS
  • 5.7 ECOSYSTEM ANALYSIS
  • 5.8 TECHNOLOGY ANALYSIS
    KEY TECHNOLOGIES
    - Quick action relay sequencing valves
    ADJACENT TECHNOLOGIES
    - Engine control units (ECUs)
  • 5.9 TRADE ANALYSIS
    IMPORT SCENARIO (HS CODE 841239)
    EXPORT SCENARIO (HS CODE 841239)
  • 5.10 PATENT ANALYSIS
  • 5.11 KEY CONFERENCES AND EVENTS, 2024–2025
  • 5.12 PRICING ANALYSIS
    AVERAGE SELLING PRICE TREND OF AIR STARTERS, BY END-USE INDUSTRY
    AVERAGE SELLING PRICE TREND OF AIR STARTERS, BY REGION
  • 5.13 TARIFF AND REGULATORY LANDSCAPE
    TARIFF ANALYSIS (HS CODE 841239)
    REGULATORY BODIES, GOVERNMENT AGENCIES, AND OTHER ORGANIZATIONS
    REGULATORY FRAMEWORK
  • 5.14 PORTER’S FIVE FORCES ANALYSIS
    THREAT OF NEW ENTRANTS
    BARGAINING POWER OF SUPPLIERS
    BARGAINING POWER OF BUYERS
    THREAT OF SUBSTITUTES
    INTENSITY OF COMPETITIVE RIVALRY
  • 5.15 KEY STAKEHOLDERS AND BUYING CRITERIA
    KEY STAKEHOLDERS IN BUYING PROCESS
    BUYING CRITERIA
  • 5.16 IMPACT OF GENERATIVE AI ON AIR STARTER
    ADOPTION OF GENERATIVE AI/AI APPLICATIONS IN AIR STARTERS
    IMPACT OF GENERATIVE AI/AI ON SUPPLY CHAIN, BY TYPE AND REGION
    IMPACT OF AI ON MARKET, BY REGION
AIR STARTER MARKET, BY TYPE
69
  • 6.1 INTRODUCTION
  • 6.2 TURBINE AIR STARTER
    HIGH POWER-TO-WEIGHT RATIO AND LOW MAINTENANCE REQUIREMENTS TO BOOST SEGMENTAL GROWTH
  • 6.3 VANE AIR STARTER
    SIMPLE DESIGN AND ABILITY TO DELIVER HIGH TORQUE AT LOW SPEEDS TO FUEL SEGMENTAL GROWTH
  • 6.4 ELECTRIC AIR STARTER
    SUSTAINABILITY AND DEMAND FROM AVIATION SECTOR TO BOOST MARKET GROWTH
AIR STARTER MARKET, BY END-USE INDUSTRY
75
  • 7.1 INTRODUCTION
  • 7.2 OIL & GAS
    ONGOING OIL AND GAS EXPLORATION PROJECTS TO BOOST DEMAND
  • 7.3 MILITARY & AVIATION
    INCREASING MILITARY BUDGET AND AGING AVIATION FLEET TO CREATE GROWTH OPPORTUNITIES
  • 7.4 MARINE
    SIGNIFICANT FOCUS ON IMPROVING OVERALL OPERATIONAL EFFECTIVENESS OF MARINE VESSELS TO FOSTER MARKET GROWTH
  • 7.5 MINING
    SURGING ADOPTION OF SUSTAINABLE MINING SOLUTIONS TO CONTRIBUTE TO MARKET GROWTH
  • 7.6 OTHERS
AIR STARTER MARKET, BY REGION
84
  • 8.1 INTRODUCTION
  • 8.2 NORTH AMERICA
    US
    - Steady growth in air travel demand to support market growth
    CANADA
    - Significant focus of industrial players on reducing production delays and equipment maintenance costs to boost demand
    MEXICO
    - Presence of oil and gas reserves in offshore areas to accelerate market growth
  • 8.3 EUROPE
    GERMANY
    - Robust automotive industry to boost adoption
    UK
    - Transition toward clean energy to create growth opportunities
    ITALY
    - Robust growth in energy sector to fuel market growth
    FRANCE
    - Elevating demand for electric vehicles to create growth potential
    RUSSIA
    - Presence of extensive mineral sources and robust mining industry to fuel demand
    REST OF EUROPE
  • 8.4 ASIA PACIFIC
    CHINA
    - Airport and power plant expansion projects in country to fuel market growth
    JAPAN
    - Surging demand from automotive, aerospace, and oil & gas sectors to contribute to market growth
    INDIA
    - Government's emphasis on increasing power generation capacity to foster market growth
    SOUTH KOREA
    - Elevating demand for large ships and vessels to augment market growth
    AUSTRALIA
    - Growing oil and gas exploration activities to create opportunities for air starter providers
    REST OF ASIA PACIFIC
  • 8.5 MIDDLE EAST & AFRICA
    GCC
    - Saudi Arabia
    - UAE
    - Rest of GCC
    SOUTH AFRICA
    - Robust mining sector to support market growth
    NIGERIA
    - Increasing airline investments in fleet modernization to support market growth
    REST OF MIDDLE EAST & AFRICA
  • 8.6 SOUTH AMERICA
    BRAZIL
    - Rising focus on energy expansion capacity to create growth opportunities
    ARGENTINA
    - Development and modernization of ports to support market growth
    REST OF SOUTH AMERICA
COMPETITIVE LANDSCAPE
126
  • 9.1 OVERVIEW
  • 9.2 KEY PLAYER STRATEGIES/RIGHT TO WIN, 2021–2023
  • 9.3 MARKET SHARE ANALYSIS, 2023
  • 9.4 REVENUE ANALYSIS, 2019–2023
  • 9.5 COMPANY EVALUATION MATRIX: KEY PLAYERS, 2023
    STARS
    EMERGING LEADERS
    PERVASIVE PLAYERS
    PARTICIPANTS
    COMPANY FOOTPRINT: KEY PLAYERS, 2023
    - Company footprint
    - Region footprint
    - Type footprint
    - End-use industry footprint
  • 9.6 COMPANY VALUATION AND FINANCIAL METRICS
  • 9.7 BRAND/PRODUCT COMPARISON
  • 9.8 COMPETITIVE SCENARIO AND TRENDS
    PRODUCT LAUNCHES
    DEALS
COMPANY PROFILES
138
  • 10.1 KEY PLAYERS
    INGERSOLL RAND
    - Business overview
    - Products/Solutions/Services offered
    - Recent developments
    - MnM view
    CATERPILLAR
    - Business overview
    - Products/Solutions/Services offered
    - MnM view
    RHEINMETALL AG
    - Business overview
    - Products/Services/Solutions offered
    - Recent developments
    - MnM view
    HONEYWELL INTERNATIONAL INC.
    - Business overview
    - Products/Services/Solutions offered
    - MnM view
    MARADYNE
    - Business overview
    - Products/Services/Solutions offered
    KH EQUIPMENT
    - Business overview
    - Products/Services/Solutions offered
    GALI
    - Business overview
    - Products/Services/Solutions offered
    SPICO
    - Business overview
    - Products/Services/Solutions offered
    POWER WORKS (PTY) LTD.
    - Business overview
    - Products/Services/Solutions offered
    MASCO
    - Business overview
    - Products/Services/Solutions offered
    INDUSTRIAL POWER UNITS LTD
    - Business overview
    - Products/Services/Solutions offered
    TLD
    - Business overview
    - Products/Services/Solutions offered
    GUINAULT
    - Business overview
    - Products/Services/Solutions offered
    TEXTRON SPECIALIZED VEHICLES
    - Business overview
    - Products/Services/Solutions offered
    JETALL
    - Business overview
    - Products/Services/Solutions offered
    YSWINCH.COM
    - Business overview
    - Products/Services/Solutions offered
    HILLIARD CORPORATION
    - Business overview
    - Products/Services/Solutions offered
    TDI
    - Business overview
    - Products/Services/Solutions offered
    MAK CONTROLS
    - Business overview
    - Products/Services/Solutions offered
    DÜSTERLOH FLUIDTECHNIK GMBH
    - Business overview
    - Products/Services/Solutions offered
    SAFRAN
    - Business overview
    - Products/Services/Solutions offered
APPENDIX
172
  • 11.1 INSIGHTS FROM INDUSTRY EXPERTS
  • 11.2 DISCUSSION GUIDE
  • 11.3 KNOWLEDGESTORE: MARKETSANDMARKETS’ SUBSCRIPTION PORTAL
  • 11.4 CUSTOMIZATION OPTIONS
  • 11.5 RELATED REPORTS
  • 11.6 AUTHOR DETAILS
LIST OF TABLES
 
  • TABLE 1 INCLUSIONS AND EXCLUSIONS, BY END-USE INDUSTRY
  • TABLE 2 INCLUSIONS AND EXCLUSIONS, BY TYPE
  • TABLE 3 AIR STARTER MARKET SNAPSHOT
  • TABLE 4 ROLE OF PLAYERS IN ECOSYSTEM
  • TABLE 5 IMPORT DATA FOR HS CODE 841239-COMPLIANT PRODUCTS, BY COUNTRY, 2021–2023 (USD THOUSAND)
  • TABLE 6 EXPORT DATA FOR HS CODE 841239-COMPLIANT PRODUCTS, 2021–2023 (USD THOUSAND)
  • TABLE 7 LIST OF MAJOR PATENTS (MARCH 2020–JUNE 2024)
  • TABLE 8 MARKET: LIST OF CONFERENCES AND EVENTS
  • TABLE 9 INDICATIVE PRICING TREND OF AIR STARTERS, BY END-USE INDUSTRY, 2021 TO 2023 (USD PER UNIT)
  • TABLE 10 AVERAGE SELLING PRICE TREND OF AIR STARTERS, BY REGION, 2021–2023 (USD PER UNIT)
  • TABLE 11 IMPORT TARIFF DATA FOR HS CODE 841239-COMPLIANT PRODUCTS, BY COUNTRY, 2023
  • TABLE 12 NORTH AMERICA: LIST OF REGULATORY BODIES, GOVERNMENT AGENCIES, AND OTHER ORGANIZATIONS
  • TABLE 13 EUROPE: LIST OF REGULATORY BODIES, GOVERNMENT AGENCIES, AND OTHER ORGANIZATIONS
  • TABLE 14 ASIA PACIFIC: LIST OF REGULATORY BODIES, GOVERNMENT AGENCIES, AND OTHER ORGANIZATIONS
  • TABLE 15 MIDDLE EAST AND AFRICA: LIST OF REGULATORY BODIES, GOVERNMENT AGENCIES, AND OTHER ORGANIZATIONS
  • TABLE 16 SOUTH AMERICA: LIST OF REGULATORY BODIES, GOVERNMENT AGENCIES, AND OTHER ORGANIZATIONS
  • TABLE 17 AIR STARTER: REGULATORY FRAMEWORK
  • TABLE 18 AIR STARTER MARKET: PORTER’S FIVE FORCES ANALYSIS
  • TABLE 19 INFLUENCE OF STAKEHOLDERS ON BUYING PROCESS FOR TOP 5 END-USE INDUSTRIES (%)
  • TABLE 20 KEY BUYING CRITERIA FOR TOP 5 END-USE INDUSTRIES
  • TABLE 21 MARKET, BY TYPE, 2021–2023 (USD MILLION)
  • TABLE 22 AIR STARTER MARKET, BY TYPE, 2024–2029 (USD MILLION)
  • TABLE 23 TURBINE AIR STARTER: MARKET, BY REGION, 2021–2023 (USD MILLION)
  • TABLE 24 TURBINE AIR STARTER: MARKET, BY REGION, 2024–2029 (USD MILLION)
  • TABLE 25 VANE AIR STARTER: MARKET, BY REGION, 2021–2023 (USD MILLION)
  • TABLE 26 VANE AIR STARTER: MARKET, BY REGION, 2024–2029 (USD MILLION)
  • TABLE 27 ELECTRIC AIR STARTER: MARKET, BY REGION, 2021–2023 (USD MILLION)
  • TABLE 28 ELECTRIC AIR STARTER: MARKET, BY REGION, 2024–2029 (USD MILLION)
  • TABLE 29 MARKET, BY END-USE INDUSTRY, 2021–2023 USD MILLION)
  • TABLE 30 AIR STARTER MARKET, BY END-USE INDUSTRY, 2024–2029 (USD MILLION)
  • TABLE 31 OIL & GAS: AIR STARTER MARKET, BY REGION, 2021–2023 (USD MILLION)
  • TABLE 32 OIL & GAS: MARKET, BY REGION, 2024–2029 (USD MILLION)
  • TABLE 33 MILITARY & AVIATION: MARKET, BY REGION, 2021–2023 (USD MILLION)
  • TABLE 34 MILITARY & AVIATION: MARKET, BY REGION, 2024–2029 (USD MILLION)
  • TABLE 35 MARINE: MARKET, BY REGION, 2021–2023 (USD MILLION)
  • TABLE 36 MARINE: MARKET, BY REGION, 2024–2029 (USD MILLION)
  • TABLE 37 MINING: MARKET, BY REGION, 2021–2023 (USD MILLION)
  • TABLE 38 MINING: MARKET, BY REGION, 2024–2029 (USD MILLION)
  • TABLE 39 OTHERS: MARKET, BY REGION, 2021–2023 (USD MILLION)
  • TABLE 40 OTHERS: MARKET, BY REGION, 2024–2029 (USD MILLION)
  • TABLE 41 MARKET, BY REGION, 2021–2023 (USD MILLION)
  • TABLE 42 MARKET, BY REGION, 2024–2029 (USD MILLION)
  • TABLE 43 MARKET, BY REGION, 2021–2023 (THOUSAND UNITS)
  • TABLE 44 AIR STARTER MARKET, BY REGION, 2024–2029 (THOUSAND UNITS)
  • TABLE 45 NORTH AMERICA: AIR STARTER MARKET, BY END-USE INDUSTRY, 2021–2023 (USD MILLION)
  • TABLE 46 NORTH AMERICA: MARKET, BY END-USE INDUSTRY, 2024–2029 (USD MILLION)
  • TABLE 47 NORTH AMERICA: MARKET, BY TYPE, 2021–2023 (USD MILLION)
  • TABLE 48 NORTH AMERICA: MARKET, BY TYPE, 2024–2029 (USD MILLION)
  • TABLE 49 NORTH AMERICA: MARKET, BY COUNTRY, 2021–2023 (USD MILLION)
  • TABLE 50 NORTH AMERICA: MARKET, BY COUNTRY, 2024–2029 (USD MILLION)
  • TABLE 51 US: MARKET, BY END-USE INDUSTRY, 2021–2023 (USD MILLION)
  • TABLE 52 US: MARKET, BY END-USE INDUSTRY, 2024–2029 (USD MILLION)
  • TABLE 53 CANADA: MARKET, BY END-USE INDUSTRY, 2021–2023 (USD MILLION)
  • TABLE 54 CANADA: MARKET, BY END-USE INDUSTRY, 2024–2029 (USD MILLION)
  • TABLE 55 MEXICO: MARKET, BY END-USE INDUSTRY, 2021–2023 (USD MILLION)
  • TABLE 56 MEXICO: MARKET, BY END-USE INDUSTRY, 2024–2029 (USD MILLION)
  • TABLE 57 EUROPE: AIR STARTER MARKET, BY END-USE INDUSTRY, 2021–2023 (USD MILLION)
  • TABLE 58 EUROPE: MARKET, BY END-USE INDUSTRY, 2024–2029 (USD MILLION)
  • TABLE 59 EUROPE: MARKET, BY TYPE, 2021–2023 (USD MILLION)
  • TABLE 60 EUROPE: MARKET, BY TYPE 2024–2029 (USD MILLION)
  • TABLE 61 EUROPE: MARKET, BY COUNTRY, 2021–2023 (USD MILLION)
  • TABLE 62 EUROPE: MARKET, BY COUNTRY, 2024–2029 (USD MILLION)
  • TABLE 63 GERMANY: MARKET, BY END-USE INDUSTRY, 2021–2023 (USD MILLION)
  • TABLE 64 GERMANY: MARKET, BY END-USE INDUSTRY, 2024–2029 (USD MILLION)
  • TABLE 65 UK: MARKET, BY END-USE INDUSTRY, 2021–2023 (USD MILLION)
  • TABLE 66 UK: MARKET, BY END-USE INDUSTRY, 2024–2029 (USD MILLION)
  • TABLE 67 ITALY: MARKET, BY END-USE INDUSTRY, 2021–2023 (USD MILLION)
  • TABLE 68 ITALY: MARKET, BY END-USE INDUSTRY, 2024–2029 (USD MILLION)
  • TABLE 69 FRANCE: MARKET, BY END-USE INDUSTRY, 2021–2023 (USD MILLION)
  • TABLE 70 FRANCE: MARKET, BY END-USE INDUSTRY, 2024–2029 (USD MILLION)
  • TABLE 71 RUSSIA: MARKET, BY END-USE INDUSTRY, 2021–2023 (USD MILLION)
  • TABLE 72 RUSSIA: MARKET, BY END-USE INDUSTRY, 2024–2029 (USD MILLION)
  • TABLE 73 REST OF EUROPE: MARKET, BY END-USE INDUSTRY, 2021–2023 (USD MILLION)
  • TABLE 74 REST OF EUROPE: MARKET, BY END-USE INDUSTRY, 2024–2029 (USD MILLION)
  • TABLE 75 ASIA PACIFIC: AIR STARTER MARKET, BY END-USE INDUSTRY, 2021–2023 (USD MILLION)
  • TABLE 76 ASIA PACIFIC: MARKET, BY END-USE INDUSTRY, 2024–2029 (USD MILLION)
  • TABLE 77 ASIA PACIFIC: MARKET, BY TYPE, 2021–2023 (USD MILLION)
  • TABLE 78 ASIA PACIFIC: MARKET, BY TYPE, 2024–2029 (USD MILLION)
  • TABLE 79 ASIA PACIFIC: MARKET, BY COUNTRY, 2021–2023 (USD MILLION)
  • TABLE 80 ASIA PACIFIC: MARKET, BY COUNTRY, 2024–2029 (USD MILLION)
  • TABLE 81 CHINA: MARKET, BY END-USE INDUSTRY, 2021–2023 (USD MILLION)
  • TABLE 82 CHINA: MARKET, BY END-USE INDUSTRY, 2024–2029 (USD MILLION)
  • TABLE 83 JAPAN: MARKET, BY END-USE INDUSTRY, 2021–2023 (USD MILLION)
  • TABLE 84 JAPAN: MARKET, BY END-USE INDUSTRY, 2024–2029 (USD MILLION)
  • TABLE 85 INDIA: MARKET, BY END-USE INDUSTRY, 2021–2023 (USD MILLION)
  • TABLE 86 INDIA: MARKET, BY END-USE INDUSTRY, 2024–2029 (USD MILLION)
  • TABLE 87 SOUTH KOREA: MARKET, BY END-USE INDUSTRY, 2021–2023 (USD MILLION)
  • TABLE 88 SOUTH KOREA: MARKET, BY END-USE INDUSTRY, 2024–2029 (USD MILLION)
  • TABLE 89 AUSTRALIA: MARKET, BY END-USE INDUSTRY, 2021–2023 (USD MILLION)
  • TABLE 90 AUSTRALIA: MARKET, BY END-USE INDUSTRY, 2024–2029 (USD MILLION)
  • TABLE 91 REST OF ASIA PACIFIC: MARKET, BY END-USE INDUSTRY, 2021–2023 (USD MILLION)
  • TABLE 92 REST OF ASIA PACIFIC: MARKET, BY END-USE INDUSTRY, 2024–2029 (USD MILLION)
  • TABLE 93 MIDDLE EAST & AFRICA: AIR STARTER MARKET, BY END-USE INDUSTRY, 2021–2023 (USD MILLION)
  • TABLE 94 MIDDLE EAST & AFRICA: MARKET, BY END-USE INDUSTRY, 2024–2029 (USD MILLION)
  • TABLE 95 MIDDLE EAST & AFRICA: MARKET, BY TYPE, 2021–2023 (USD MILLION)
  • TABLE 96 MIDDLE EAST & AFRICA: MARKET, BY TYPE, 2024–2029 (USD MILLION)
  • TABLE 97 MIDDLE EAST & AFRICA: MARKET, BY COUNTRY, 2021–2023 (USD MILLION)
  • TABLE 98 MIDDLE EAST & AFRICA: MARKET, BY COUNTRY, 2024–2029 (USD MILLION)
  • TABLE 99 GCC: MARKET, BY COUNTRY, 2021–2023 (USD MILLION)
  • TABLE 100 GCC: MARKET, BY COUNTRY, 2024–2029 (USD MILLION)
  • TABLE 101 GCC: MARKET, BY END-USE INDUSTRY, 2021–2023 (USD MILLION)
  • TABLE 102 GCC: MARKET, BY END-USE INDUSTRY, 2024–2029 (USD MILLION)
  • TABLE 103 SAUDI ARABIA: MARKET, BY END-USE INDUSTRY, 2021–2023 (USD MILLION)
  • TABLE 104 SAUDI ARABIA: MARKET, BY END-USE INDUSTRY, 2024–2029 (USD MILLION)
  • TABLE 105 UAE: MARKET, BY END-USE INDUSTRY, 2021–2023 (USD MILLION)
  • TABLE 106 UAE: MARKET, BY END-USE INDUSTRY, 2024–2029 (USD MILLION)
  • TABLE 107 REST OF GCC: MARKET, BY END-USE INDUSTRY, 2021–2023 (USD MILLION)
  • TABLE 108 REST OF GCC: MARKET, BY END-USE INDUSTRY, 2024–2029 (USD MILLION)
  • TABLE 109 SOUTH AFRICA: MARKET, BY END-USE INDUSTRY, 2021–2023 (USD MILLION)
  • TABLE 110 SOUTH AFRICA: MARKET, BY END-USE INDUSTRY, 2024–2029 (USD MILLION)
  • TABLE 111 NIGERIA: MARKET, BY END-USE INDUSTRY, 2021–2023 (USD MILLION)
  • TABLE 112 NIGERIA: MARKET, BY END-USE INDUSTRY, 2024–2029 (USD MILLION)
  • TABLE 113 REST OF MIDDLE EAST & AFRICA: MARKET, BY END-USE INDUSTRY, 2021–2023 (USD MILLION)
  • TABLE 114 REST OF MIDDLE EAST & AFRICA: MARKET, BY END-USE INDUSTRY, 2024–2029 (USD MILLION)
  • TABLE 115 SOUTH AMERICA: AIR STARTER MARKET, BY END-USE INDUSTRY, 2021–2023 (USD MILLION)
  • TABLE 116 SOUTH AMERICA: MARKET, BY END-USE INDUSTRY, 2024–2029 (USD MILLION)
  • TABLE 117 SOUTH AMERICA: MARKET, BY TYPE, 2021–2023 (USD MILLION)
  • TABLE 118 SOUTH AMERICA: MARKET, BY TYPE, 2024–2029 (USD MILLION)
  • TABLE 119 SOUTH AMERICA: AIR STARTERS MARKET, BY COUNTRY, 2021–2023 (USD MILLION)
  • TABLE 120 SOUTH AMERICA: AIR STARTERS MARKET, BY COUNTRY, 2024–2029 (USD MILLION)
  • TABLE 121 BRAZIL: MARKET, BY END-USE INDUSTRY, 2021–2023 (USD MILLION)
  • TABLE 122 BRAZIL: MARKET, BY END-USE INDUSTRY, 2024–2029 (USD MILLION)
  • TABLE 123 ARGENTINA: MARKET, BY END-USE INDUSTRY, 2021–2023 (USD MILLION)
  • TABLE 124 ARGENTINA: MARKET, BY END-USE INDUSTRY, 2024–2029 (USD MILLION)
  • TABLE 125 REST OF SOUTH AMERICA: MARKET, BY END-USE INDUSTRY, 2021–2023 (USD MILLION)
  • TABLE 126 REST OF SOUTH AMERICA: MARKET, BY END-USE INDUSTRY, 2024–2029 (USD MILLION)
  • TABLE 127 AIR STARTER MARKET: OVERVIEW OF STRATEGIES ADOPTED BY KEY PLAYERS, 2021–2023
  • TABLE 128 MARKET: DEGREE OF COMPETITION, 2023
  • TABLE 129 MARKET: REGION FOOTPRINT
  • TABLE 130 MARKET: TYPE FOOTPRINT
  • TABLE 131 MARKET: END-USE INDUSTRY FOOTPRINT
  • TABLE 132 MARKET: PRODUCT LAUNCHES, JANUARY 2020–APRIL 2024
  • TABLE 133 MARKET: DEALS, JANUARY 2020–APRIL 2024
  • TABLE 134 INGERSOLL RAND: COMPANY OVERVIEW
  • TABLE 135 INGERSOLL RAND: PRODUCTS/SOLUTIONS/SERVICES OFFERED
  • TABLE 136 INGERSOLL RAND: PRODUCT LAUNCHES
  • TABLE 137 CATERPILLAR: COMPANY OVERVIEW
  • TABLE 138 CATERPILLAR: PRODUCTS/SOLUTIONS/SERVICES OFFERED
  • TABLE 139 RHEINMETALL AG: COMPANY OVERVIEW
  • TABLE 140 RHEINMETALL AG: PRODUCTS/SERVICES/SOLUTIONS OFFERED
  • TABLE 141 RHEINMETALL AG: DEALS
  • TABLE 142 HONEYWELL INTERNATIONAL INC.: COMPANY OVERVIEW
  • TABLE 143 HONEYWELL INTERNATIONAL INC.: PRODUCTS/SERVICES/SOLUTIONS OFFERED
  • TABLE 144 MARADYNE: COMPANY OVERVIEW
  • TABLE 145 MARADYNE: PRODUCTS/SERVICES/SOLUTIONS OFFERED
  • TABLE 146 KH EQUIPMENT: COMPANY OVERVIEW
  • TABLE 147 KH EQUIPMENT: PRODUCTS/SERVICES/SOLUTIONS OFFERED
  • TABLE 148 GALI: COMPANY OVERVIEW
  • TABLE 149 GALI: PRODUCTS/SERVICES/SOLUTIONS OFFERED
  • TABLE 150 SPICO: COMPANY OVERVIEW
  • TABLE 151 SPICO: PRODUCTS/SERVICES/SOLUTIONS OFFERED
  • TABLE 152 POWERWORKS (PTY) LTD.: COMPANY OVERVIEW
  • TABLE 153 POWERWORKS (PTY) LTD.: PRODUCTS/SERVICES/SOLUTIONS OFFERED
  • TABLE 154 MASCO: COMPANY OVERVIEW
  • TABLE 155 MASCO: PRODUCTS/SERVICES/SOLUTIONS OFFERED
  • TABLE 156 INDUSTRIAL POWER UNITS LTD: COMPANY OVERVIEW
  • TABLE 157 INDUSTRIAL POWER UNITS LTD: PRODUCTS/SERVICES/SOLUTIONS OFFERED
  • TABLE 158 TLD: COMPANY OVERVIEW
  • TABLE 159 TLD: PRODUCTS/SERVICES/SOLUTIONS OFFERED
  • TABLE 160 GUINAULT: COMPANY OVERVIEW
  • TABLE 161 GUINAULT: PRODUCTS/SERVICES/SOLUTIONS OFFERED
  • TABLE 162 TEXTRON SPECIALIZED VEHICLES: COMPANY OVERVIEW
  • TABLE 163 TEXTRON SPECIALIZED VEHICLES: PRODUCTS/SERVICES/SOLUTIONS OFFERED
  • TABLE 164 JETALL: COMPANY OVERVIEW
  • TABLE 165 JETALL: PRODUCTS/SERVICES/SOLUTIONS OFFERED
  • TABLE 166 YSWINCH.COM: COMPANY OVERVIEW
  • TABLE 167 YSWINCH.COM: PRODUCTS/SERVICES/SOLUTIONS OFFERED
  • TABLE 168 HILLIARD CORPORATION: COMPANY OVERVIEW
  • TABLE 169 HILLIARD CORPORATION: PRODUCTS/SERVICES/SOLUTIONS OFFERED
  • TABLE 170 TDI: COMPANY OVERVIEW
  • TABLE 171 TDI: PRODUCTS/SERVICES/SOLUTIONS OFFERED
  • TABLE 172 MAK CONTROLS: COMPANY OVERVIEW
  • TABLE 173 MAK CONTROLS: PRODUCTS/SERVICES/SOLUTIONS OFFERED
  • TABLE 174 DÜSTERLOH FLUIDTECHNIK GMBH: COMPANY OVERVIEW
  • TABLE 175 DÜSTERLOH FLUIDTECHNIK GMBH: PRODUCTS/SERVICES/SOLUTIONS OFFERED
  • TABLE 176 SAFRAN: COMPANY OVERVIEW
  • TABLE 177 SAFRAN: PRODUCTS/SERVICES/SOLUTIONS OFFERED
LIST OF FIGURES
 
  • FIGURE 1 MARKET SEGMENTATION AND REGIONAL SCOPE
  • FIGURE 2 AIR STARTER MARKET: RESEARCH DESIGN
  • FIGURE 3 KEY METRICS CONSIDERED TO ANALYZE DEMAND FOR AIR STARTERS
  • FIGURE 4 MARKET SIZE ESTIMATION METHODOLOGY: BOTTOM-UP APPROACH
  • FIGURE 5 MARKET SIZE ESTIMATION METHODOLOGY: TOP-DOWN APPROACH
  • FIGURE 6 KEY STEPS CONSIDERED TO ASSESS SUPPLY OF AIR STARTERS
  • FIGURE 7 SUPPLY-SIDE ANALYSIS
  • FIGURE 8 DATA TRIANGULATION
  • FIGURE 9 NORTH AMERICA DOMINATED AIR STARTER MARKET IN 2023
  • FIGURE 10 TURBINE AIR STARTER SEGMENT TO CAPTURE LARGEST SHARE OF MARKET DURING FORECAST PERIOD
  • FIGURE 11 OIL & GAS SEGMENT TO COMMAND AIR STARTER MARKET THROUGHOUT FORECAST PERIOD
  • FIGURE 12 RISING DRILLING ACTIVITIES AND GROWING AVIATION SECTOR TO DRIVE MARKET GROWTH
  • FIGURE 13 TURBINE AIR STARTER AND US WERE LARGEST SHAREHOLDERS IN MARKET IN NORTH AMERICA IN 2029
  • FIGURE 14 OIL & GAS INDUSTRY TO DOMINATE MARKET IN 2029
  • FIGURE 15 TURBINE AIR STARTER SEGMENT TO DOMINATE MARKET IN 2029
  • FIGURE 16 AIR STARTER MARKET: DRIVERS, RESTRAINTS, OPPORTUNITIES, AND CHALLENGES
  • FIGURE 17 WORLDWIDE CRUDE OIL PRODUCTION, 2015–2023 (MILLION BARRELS PER DAY)
  • FIGURE 18 INVESTMENT AND FUNDING SCENARIO IN MARKET, 2023 (USD MILLION)
  • FIGURE 19 TRENDS INFLUENCING USERS OF AIR STARTERS
  • FIGURE 20 MARKET: VALUE CHAIN ANALYSIS
  • FIGURE 21 MARKET: ECOSYSTEM ANALYSIS
  • FIGURE 22 IMPORT DATA FOR HS CODE 841239-COMPLIANT PRODUCTS IN TOP 5 COUNTRIES, 2021–2023 (USD THOUSAND)
  • FIGURE 23 EXPORT DATA FOR HS CODE 841239-COMPLIANT PRODUCTS IN TOP 5 COUNTRIES, 2021–2023 (USD THOUSAND)
  • FIGURE 24 INNOVATIONS AND PATENT REGISTRATIONS PERTAINING TO AIR STARTERS, 2013–2023
  • FIGURE 25 AVERAGE SELLING PRICE TREND OF AIR STARTERS, BY END-USE INDUSTRY, 2021–2023 (USD PER UNIT)
  • FIGURE 26 AVERAGE SELLING PRICE TREND OF AIR STARTERS, BY REGION, 2021–2023 (USD PER UNIT)
  • FIGURE 27 AIR STARTER MARKET: PORTER’S FIVE FORCES ANALYSIS
  • FIGURE 28 INFLUENCE OF STAKEHOLDERS ON BUYING PROCESS FOR TOP 5 END-USE INDUSTRIES
  • FIGURE 29 KEY BUYING CRITERIA FOR TOP 5 END-USE INDUSTRIES
  • FIGURE 30 IMPACT OF GENERATIVE AI/AI ON AIR STARTER TYPES, BY REGION
  • FIGURE 31 AIR STARTER MARKET SHARE, IN TERMS OF VALUE, BY TYPE, 2023
  • FIGURE 32 AIR STARTER MARKET SHARE, BY END-USE INDUSTRY, 2023
  • FIGURE 33 MARKET IN ASIA PACIFIC TO GROW AT FASTEST RATE DURING FORECAST PERIOD
  • FIGURE 34 AIR STARTER MARKET, BY REGION, 2023
  • FIGURE 35 NORTH AMERICA: MARKET SNAPSHOT
  • FIGURE 36 EUROPE: MARKET SNAPSHOT
  • FIGURE 37 AIR STARTER MARKET SHARE ANALYSIS OF MAJOR PLAYERS, 2023
  • FIGURE 38 INDUSTRY CONCENTRATION, 2023
  • FIGURE 39 REVENUE ANALYSIS OF TOP 4 PLAYERS, 2019–2023
  • FIGURE 40 MARKET: COMPANY EVALUATION MATRIX (KEY PLAYERS), 2023
  • FIGURE 41 MARKET: COMPANY FOOTPRINT
  • FIGURE 42 COMPANY VALUATION, 2023 (USD BILLION)
  • FIGURE 43 FINANCIAL METRICS (EV/EBITDA), 2023
  • FIGURE 44 MARKET: BRAND/PRODUCT COMPARISON
  • FIGURE 45 INGERSOLL RAND: COMPANY SNAPSHOT
  • FIGURE 46 CATERPILLAR: COMPANY SNAPSHOT
  • FIGURE 47 RHEINMETALL AG: COMPANY SNAPSHOT
  • FIGURE 48 HONEYWELL INTERNATIONAL INC.: COMPANY SNAPSHOT


The study involved major activities in estimating the current size of the Air Starter market. Exhaustive secondary research was done to collect information on the peer and parent markets. The next step was to validate these findings, assumptions, and sizing with industry experts across the value chain through primary research. Both top-down and bottom-up approaches were employed to estimate the complete market size. Thereafter, market breakdown and data triangulation were used to estimate the market size of the segments and subsegments.

Secondary Research

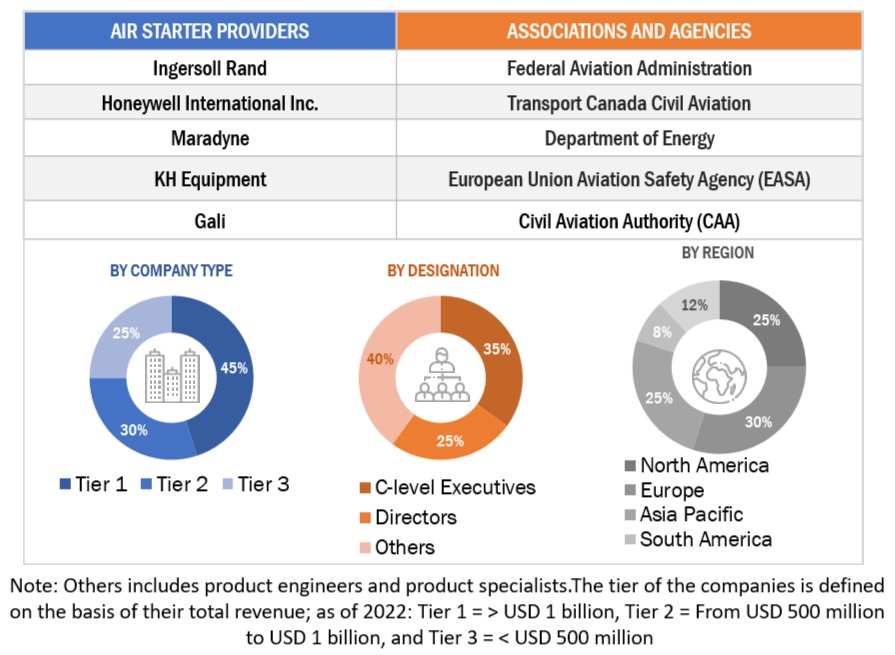
This research study on the market involved the use of extensive secondary sources, directories, and databases, such as Hoovers, Bloomberg, Businessweek, Factiva, International Energy Agency, and United States Energy Association, to identify and collect information useful for a technical, market-oriented, and commercial study of the global air starter market. The other secondary sources included annual reports, press releases & investor presentations of companies, white papers, certified publications, articles by recognized authors, manufacturer associations, trade directories, and databases.

Primary Research

The Air Starters market comprises several stakeholders such as Air Starter manufacturers, manufacturers of subcomponents of Air starter, manufacturing technology providers, and distributors in the supply chain. The demand side of this market is characterized by the increasing oil & gas exploration activities, growing fleet of commercial and military aircrafts. The supply side is characterized by technological advancements by big players. Various primary sources from both the supply and demand sides of the market were interviewed to obtain qualitative and quantitative information.
Air Starter Market  Size, and Share

To know about the assumptions considered for the study, download the pdf brochure

Market Size Estimation

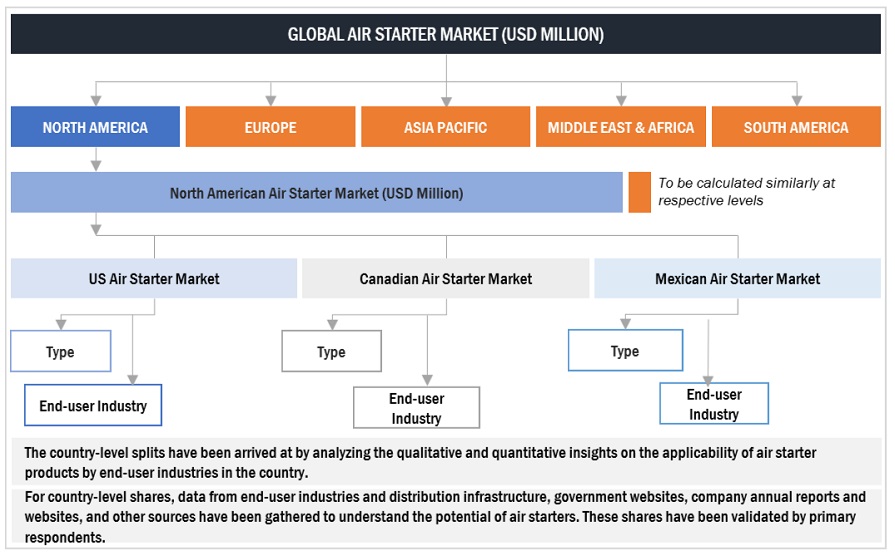
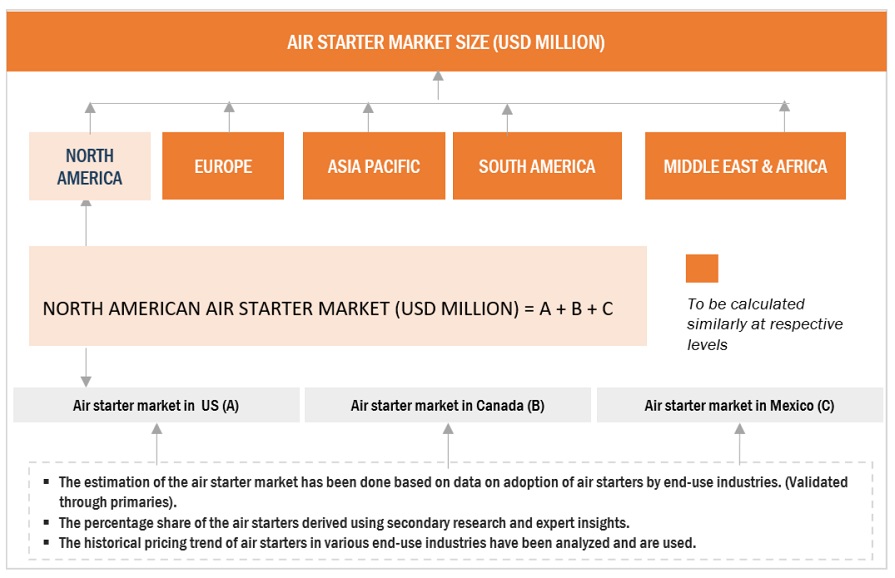
Both top-down and bottom-up approaches were used to estimate and validate the total size of the market. These methods were also used extensively to estimate the size of various subsegments in the market. The research methodology used to estimate the market size includes the following:

  • The key players in the industry and market have been identified through extensive secondary research, and their market share in the respective regions have been determined through both primary and secondary research.
  • The industry’s value chain and market size, in terms of value, have been determined through primary and secondary research processes.
  • All percentage shares, splits, and breakdowns have been determined using secondary sources and verified through primary sources.

Global Air Starter Market Size: Top-down Approach
Air Starter Market  Top Down Approach

To know about the assumptions considered for the study, Request for Free Sample Report

Global Air Starter Market Size: Bottom-Up Approach
Air Starter Market  Bottom Up Approach

Data Triangulation

After arriving at the overall market size from the estimation process explained above, the total market has been split into several segments and subsegments. To complete the overall market engineering process and arrive at the exact statistics for all the segments and subsegments, the data triangulation and market breakdown processes have been employed, wherever applicable. The data has been triangulated by studying various factors and trends from both the demand- and supply sides. Along with this, the market has been validated using both the top-down and bottom-up approaches.

Market Definition

An air starter is a pneumatic device which is used as a power source to provide the initial rotation to start large diesel engines and gas turbines or large internal combustion engines, particularly those found in heavy-duty industrial applications. These starters have simple in design, extremely reliable, and are used in places, where electric starters cannot be used.

Key Stakeholders

  • Aviation Associations
  • Power Companies
  • Air Starter Manufacturing Companies
  • Air Starter component Manufacturers
  • Government and Research Organizations
  • Consulting Companies in the Energy Sector
  • Environmental Associations
  • Investment Banks

Objectives of the Study

  • To define, describe, and forecast the air starter market on the basis of type, end-user, and region
  • To provide detailed information regarding major factors influencing the market growth (drivers, restraints, opportunities, and industry-specific challenges)
  • To strategically analyze the market with respect to individual growth trends of manufacturers and service providers, their future expansions, and contribution to the market
  • To forecast the growth of air starters market with respect to the main regions (Asia-Pacific, Europe, North America, South America, and the Middle East & Africa)
  • To strategically profile key market players and comprehensively analyze their market shares and core competencies
  • To track and analyze market opportunities for stakeholders and details of competitive developments, such as contracts & agreements, mergers & acquisitions, expansions, and new product/technology launch in the market

Available Customizations:

With the given market data, MarketsandMarkets offers customizations as per the client’s specific needs. The following customization options are available for this report:

Geographic Analysis

  • Further breakdown of region or country-specific analysis

Company Information

  • Detailed analyses and profiling of additional market players (up to 5)
Custom Market Research Services

We will customize the research for you, in case the report listed above does not meet with your exact requirements. Our custom research will comprehensively cover the business information you require to help you arrive at strategic and profitable business decisions.

Request Customization
Report Code
EP 4443
Published ON
Aug, 2024
Choose License Type
BUY NOW
  • SHARE
X
Request Customization
Speak to Analyst
Speak to Analyst
OR FACE-TO-FACE MEETING
PERSONALIZE THIS RESEARCH
  • Triangulate with your Own Data
  • Get Data as per your Format and Definition
  • Gain a Deeper Dive on a Specific Application, Geography, Customer or Competitor
  • Any level of Personalization
REQUEST A FREE CUSTOMIZATION
LET US HELP YOU!
  • What are the Known and Unknown Adjacencies Impacting the Air Starter Market
  • What will your New Revenue Sources be?
  • Who will be your Top Customer; what will make them switch?
  • Defend your Market Share or Win Competitors
  • Get a Scorecard for Target Partners
CUSTOMIZED WORKSHOP REQUEST
knowledgestore logo

Want to explore hidden markets that can drive new revenue in Air Starter Market?

Find Hidden Markets
  • Call Us
  • +1-888-600-6441 (Corporate office hours)
  • +1-888-600-6441 (US/Can toll free)
  • +44-800-368-9399 (UK office hours)
CONNECT WITH US
ABOUT TRUST ONLINE
©2024 MarketsandMarkets Research Private Ltd. All rights reserved
DMCA.com Protection Status
Website Feedback