3D Digital Asset Market

3D Digital Asset Market Size, Share, Growth Analysis, By Component (Hardware, Software (3D Modeling, 3D Scanning, 3D Animation), Services), Application (Visualization, Simulation, Live Experience), and Deployment Mode - Global Industry Forecast to 2029

Report Code: TC 9062 Jul, 2024, by marketsandmarkets.com

[309 Pages Report] The 3D Digital Asset market is expected to grow from USD 28.3 billion in 2024 to USD 51.8 billion by 2029 at a Compound Annual Growth Rate (CAGR) of 12.9% during the forecast period. The market is witnessing several notable trends shaping its trajectory. One significant trend is the increasing integration of 3D assets into mainstream applications such as e-commerce and advertising. Businesses leverage high-fidelity 3D models to enhance product visualization and customer engagement, leading to higher conversion and reduced return rates. Another key trend is the growing demand for virtual and augmented reality experiences, driving the need for realistic 3D assets to immerse users in virtual environments or overlay digital information onto the physical world. This trend is particularly evident in the gaming, education, and training industries, where interactive and immersive content is becoming increasingly prevalent.

Innovations and technologies are at the forefront of advancing the 3D digital asset market, with significant developments in areas such as 3D scanning, rendering, and asset management. One notable innovation is the evolution of 3D scanning technologies, which enable the rapid capture and digitization of physical objects into detailed 3D models. These advancements are enhancing the efficiency and accuracy of asset creation, particularly in industries like archaeology, architecture, and healthcare, where precise digital replicas are critical. Additionally, technologies like real-time rendering engines and cloud-based rendering services are revolutionizing how 3D assets are visualized and processed, allowing faster iteration cycles and improved stakeholder collaboration. Moreover, integrating artificial intelligence and machine learning algorithms enables automated creation and optimization of 3D assets, reducing manual labor and enhancing scalability in content production pipelines. These innovations collectively contribute to the growth and sophistication of the 3D digital asset market, opening up new possibilities across various sectors.

3D Digital Asset Market

To know about the assumptions considered for the study, Request for Free Sample Report

3D Digital Asset Market  Opportunities

To know about the assumptions considered for the study, download the pdf brochure

Recession Impact on the 3D Digital Asset Market

During a recession, the 3D digital asset market experienced challenges and opportunities. As businesses across sectors tighten budgets, there is typically a reduced willingness to invest in non-essential technologies like high-fidelity 3D modeling and virtual reality applications. This leads to a temporary slowdown in demand for 3D digital assets, particularly in industries heavily reliant on discretionary spending, such as advertising and entertainment.

Conversely, recessions often drive innovation and efficiency-seeking behaviors. Companies use 3D digital assets to enhance online marketing efforts, improve product visualization, and optimize operational processes. Additionally, industries like e-commerce and remote collaboration see increased adoption of 3D assets to enrich customer experiences and facilitate virtual interactions. While a recession poses challenges regarding reduced spending, it also presents opportunities for the 3D digital asset market to innovate and demonstrate its value in cost-effective solutions that drive productivity and engagement.

3D Digital Asset Market Dynamics

Driver:  Rapid technological advancements

Technological advancements have significantly driven the 3D digital asset market by enhancing these assets' creation, manipulation, and utilization. Developing sophisticated software like Blender, Autodesk Maya, and Unreal Engine, alongside real-time rendering and procedural modeling capabilities, has made high-quality 3D modeling more accessible and efficient. Improved hardware, particularly GPUs from NVIDIA and AMD, has boosted computational power, enabling handling complex 3D graphics and real-time ray tracing. Advances in VR and AR devices have also enhanced the user experience, increasing demand for high-quality 3D assets. Cloud computing and storage solutions offer scalable and collaborative platforms, facilitating remote work and faster rendering times. Artificial intelligence and machine learning have introduced AI-powered tools and procedural generation techniques, automating aspects of 3D asset creation and enabling the efficient generation of large-scale environments.

Additionally, 3D scanning technologies and photogrammetry provide accurate and detailed digital models from real-world objects. Virtual production techniques, such as LED volumes and motion capture, have revolutionized the film and television industry by enabling real-time adjustments and reducing the need for physical sets. Lastly, developing standardized file formats and APIs has improved interoperability, fostering collaboration and innovation across various software and platforms. These advancements collectively enhance the quality, accessibility, and application of 3D digital assets, driving the market forward.

Restraint: Technical standard and interoperability

Technical standards and interoperability play crucial roles in shaping the 3D digital asset market but also act as significant restraints. Technical standards refer to agreed-upon specifications and protocols that ensure compatibility across different platforms. However, the lack of universally adopted standards leads to market fragmentation and compatibility issues, making it difficult for users to transfer assets between platforms without data loss. This fragmentation can result in vendor lock-in, where proprietary standards limit user flexibility and reduce interoperability. Additionally, standards can sometimes stifle innovation by imposing rigid guidelines that may not accommodate emerging technologies. Interoperability, the ability of different systems to work together seamlessly, is also hindered by format incompatibility and metadata loss, which can impact asset functionality and legal aspects. Poor interoperability limits market growth by increasing transaction costs and discouraging investment in new technologies.

Opportunity: E-commerce integration

Integrating eCommerce into the 3D digital asset market represents a transformative opportunity, enhancing user engagement and market accessibility. By enabling interactive and immersive experiences, such integration allows customers to inspect and visualize assets in unprecedented detail, leveraging technologies like AR and VR for realistic previews. This improves the shopping experience and broadens market reach globally, connecting creators with a diverse customer base beyond traditional boundaries. Direct sales capabilities on e-commerce platforms offer creators higher profit margins and greater control over distribution, while subscription models foster recurring revenue streams. Collaboration and community-building features further enrich the ecosystem, encouraging partnerships and enhancing credibility. However, challenges such as technical integration complexities and marketplace competition must be navigated with strategic planning and robust execution to maximize the potential of this evolving intersection between digital content and online commerce.

Challenge: Intellectual Property (IP) and licensing issue

Intellectual Property (IP) and licensing issues present significant challenges in the 3D digital asset market due to the unique nature of digital content. Determining ownership and rights can be complex, involving the retention of copyright by creators, treatment of derivative works, and use of third-party elements. Copyright infringement, such as unauthorized reproduction or distribution, poses a risk, especially if assets are not adequately protected or licensed. Additionally, patents and trademarks incorporated in 3D assets require separate permissions to avoid legal liabilities. Licensing models, whether exclusive, non-exclusive, or royalty-free, impact the asset's availability and the creator's revenue, necessitating clear and specific license terms to define usage rights, modification permissions, and distribution conditions. Monitoring compliance is challenging and may require automated or manual systems. Unique market challenges include interoperability issues across different platforms, emerging technologies such as 3D printing and augmented reality (AR) implications, and navigating varying international IP laws.

3D Digital Asset Market Ecosystem

Top Companies in 3D Digital Asset Market

Based on deployment mode, on-premise deployment holds the largest market share during the forecast period.
On-premises deployment within the deployment mode segment of the 3D Digital Asset market involves hosting software and managing data locally within an organization's physical infrastructure. This approach offers direct control over security, customization, and compliance with regulatory requirements. Organizations opting for on-premises deployment typically invest in hardware, software licenses, and IT infrastructure to support digital asset management solutions. Industries favor this model with stringent data privacy concerns or specific operational requirements that necessitate maintaining assets within their controlled environments, such as government entities, financial services, and healthcare organizations aiming to manage sensitive information securely and efficiently.

Based on vertical, the automotive sector will grow at the highest CAGR during the forecast period.

In the 3D digital asset market, the automotive sector develops intricate and lifelike digital representations of automobiles. These resources mainly serve industries like automotive design, advertising, gaming, and virtual reality. Digital artists and designers carefully create these models to ensure visual accuracy, including each vehicle's detailed exterior and interior features. The need for automotive 3D assets arises from their usefulness in virtual prototyping, marketing visualizations, and immersive simulations. Quality is essential because these models must accurately depict actual vehicles to improve realism and functionality in different uses, thus playing a vital role in the digital revolution of the car industry.

Based on region, North America holds the largest market share during the forecast period.

North America is the most advanced region in the usage of 3D technology across a wide range of fields since it has an inventive economy and high levels of technological progress. The region experiences massive demand for advanced digital asset management services due to gaming, entertainment, architectural, and manufacturing factors. Key factors include the increasing popularity of virtual and augmented reality, as well as virtual and augmented reality technologies and a shift towards new business priorities like strategic digitization and digitalization. These drivers have driven the establishment of efficient asset management systems that can manage the complexity of work processes and improve efficiency through coordination and better use of resources. Being home to several 3D Digital Asset companies and boasting of a robust digital infrastructure and culture of innovation, North America continues to play a leading role in the evolution of the global 3D Digital Asset industry.

3D Digital Asset Market  Size, and Share

Key Market Players

The 3D Digital Asset market is dominated by a few globally established players such as  Autodesk (US), Siemens (Germany), Adobe (US), Unity (US), NVIDIA (US), Microsoft (US), Ansys (US), Epic Games (US), PTC (US), Trimble (US), Sony (Tokyo), Apple (US), Meta (US), Reply (Italy), Google (US), IKEA (Netherlands), Hexa (Israel),  Threekit (US), Sitecore (US), Daminion (US), Consortiq (UK), Modelry (US), Design Connected (Bulgaria), VNTANA (US), Cesium (US), Keyshot (US), and Moovly (Belgium) among others, are the key vendors that secured 3D Digital Asset contracts in last few years. The key drivers for 3D Digital Asset include efficient retrieval and organization through metadata tagging and version control, optimized collaboration via centralized repositories and access controls, seamless integration with existing tools through software compatibility and APIs, scalable cloud storage, robust security with encryption and DRM, user-friendly interfaces, mobile accessibility, detailed analytics, format compatibility, cost-efficient storage solutions, and regulatory compliance with audit trails. Vendors maintain their market position by continuously innovating to enhance these features, offering robust support and training, ensuring interoperability with popular 3D software, leveraging cloud technologies for scalability, and providing robust security measures to protect digital assets.

Get online access to the report on the World's First Market Intelligence Cloud

  • Easy to Download Historical Data & Forecast Numbers
  • Company Analysis Dashboard for high growth potential opportunities
  • Research Analyst Access for customization & queries
  • Competitor Analysis with Interactive dashboard
  • Latest News, Updates & Trend analysis
Request Sample

Scope of the Report

Report Metrics

Details

Market Size Available For Years

2019–2029

Base Year Considered

2023

Forecast Period

2024–2029

Forecast Units

Value (USD Million/Billion)

Segments Covered

Component, Application, Deployment Mode, Vertical and Region

Regions Covered

North America, Europe, Asia Pacific, Middle East & Africa, and Latin America

Companies Covered

Autodesk (US), Siemens (Germany), Adobe (US), Unity (US), NVIDIA (US), Microsoft (US), Ansys (US), Epic Games (US), PTC (US), Trimble (US), Sony (Tokyo), Apple (US), Meta (US), Reply (Italy), Google (US), IKEA (Netherlands), Hexa (Israel),  Threekit (US), Sitecore (US), Daminion (US), Consortiq (UK), Modelry (US), Design Connected (Bulgaria), VNTANA (US), Cesium (US), Keyshot (US), and Moovly (Belgium).

This research report categorizes the 3d digital asset market to forecast revenue and analyze trends in each of the following submarkets:

By Component:
  • Hardware
    • 3D Scanners
    • Motion Capture Systems
  • Software
    • 3D Modeling Software
    • 3D Scanning Software
    • 3D Animation Software
    • 3D Rendering & Visualization Software
    • Image Reconstruction Software
  • Services
    • Professional Services
    • Managed Services
By Application:
  • Visualization
  • Simulation
  • Digital Prototyping
  • Gaming & Animation
  • Virtual Experience
  • Marketing & Advertising
  • Other Applications
By Deployment:
  • On-Premise
  • Cloud
By Verticals:
  • Architecture & Construction
  • Media & Entertainment
  • Manufacturing
  • Healthcare & Lifescience
  • Retail & E-commerce
  • Automotive
  • Government & Public Sector
  • Other Verticals
By Region:
  • North America
    • United States
    • Canada
  • Europe
    • United Kingdom
    • Germany
    • France
    • Italy
    • Rest of Europe
  • Asia Pacific
    • China
    • Japan
    • India
    • Rest of Asia Pacific
  • Middle East & Africa
    • GCC
    • South Africa
    • Rest of the Middle East & Africa
  • Latin America
    • Brazil
    • Mexico
    • Rest of Latin America     

Recent Developments:

  • In March 2024, Siemens and NVIDIA expanded collaboration on generative AI for immersive real-time visualization.
  • In March 2024, NVIDIA introduced the X800 series, featuring the Quantum-X800 InfiniBand and Spectrum-X800 ethernet switches, which deliver an unprecedented 800Gb/s end-to-end throughput. The switches, including the Quantum Q3400 and ConnectX-8 SuperNIC, set a new standard for AI and GPU computing. Early adopters like Microsoft Azure and Oracle Cloud Infrastructure leverage these switches to enhance AI, cloud, and HPC performance.
  • In February 2024, Adobe announced the launch of AI Assistance in beta, a new generative AI-powered conversational engine in Reader and Acrobat.
  • In February 2024, Capgemini acquired Unity's Digital Twin Professional Services arm to accelerate enterprises' digital transformation through real-time 3D technology. The transaction will accelerate the iteration and implementation of the market-leading real-time 3D (RT3D) visualization software for the industrial application of digital twins. It will allow end users to envision, understand, and interact with physical systems - a key enabler for intelligent industry.
  • In November 2023, Autodesk launched Autodesk AI. It provides intelligent assistance and generative capabilities that allow customers to imagine and explore freely while producing precise, accurate, and innovative results.

Frequently Asked Questions (FAQ):

To speak to our analyst for a discussion on the above findings, click Speak to Analyst

TABLE OF CONTENTS
 
1 INTRODUCTION (Page No. - 41)
    1.1 STUDY OBJECTIVES 
    1.2 MARKET DEFINITION 
           1.2.1 INCLUSIONS AND EXCLUSIONS
                    TABLE 1 INCLUSIONS AND EXCLUSIONS
    1.3 MARKET SCOPE 
           1.3.1 MARKET SEGMENTATION
                    FIGURE 1 3D DIGITAL ASSET MARKET SEGMENTATION
           1.3.2 REGIONS COVERED
                    FIGURE 2 MARKET SEGMENTATION, BY REGION
           1.3.3 YEARS CONSIDERED
                    FIGURE 3 STUDY YEARS CONSIDERED
    1.4 CURRENCY 
           TABLE 2 USD EXCHANGE RATES, 2018–2023
    1.5 STAKEHOLDERS 
    1.6 RECESSION IMPACT 
 
2 RESEARCH METHODOLOGY (Page No. - 46)
    2.1 RESEARCH DATA 
           FIGURE 4 3D DIGITAL ASSET MARKET: RESEARCH DESIGN
           2.1.1 SECONDARY DATA
           2.1.2 PRIMARY DATA
                    2.1.2.1 Breakup of primary profiles
                               FIGURE 5 BREAKUP OF PRIMARY INTERVIEWS, BY COMPANY TYPE, DESIGNATION, AND REGION
                    2.1.2.2 Key industry insights
                               FIGURE 6 KEY INSIGHTS FROM INDUSTRY EXPERTS
    2.2 MARKET SIZE ESTIMATION 
           FIGURE 7 MARKET: TOP-DOWN AND BOTTOM-UP APPROACHES
           FIGURE 8 MARKET SIZE ESTIMATION METHODOLOGY: SUPPLY-SIDE ANALYSIS AND CORRESPONDING STAGE-WISE SOURCES
           FIGURE 9 BOTTOM-UP APPROACH (SUPPLY SIDE): COLLECTIVE REVENUE OF 3D DIGITAL ASSET VENDORS
           FIGURE 10 SUPPLY-SIDE ANALYSIS: ILLUSTRATION OF VENDOR REVENUE ESTIMATION
           FIGURE 11 APPROACH 2 (DEMAND SIDE): REVENUE GENERATED FROM COMPONENTS
           FIGURE 12 APPROACH 2 (DEMAND SIDE): REVENUE FROM COUNTRY-WISE SPENDING
    2.3 MARKET FORECAST 
           TABLE 3 FACTOR ANALYSIS
    2.4 DATA TRIANGULATION 
           FIGURE 13 DATA TRIANGULATION
    2.5 RESEARCH ASSUMPTIONS 
    2.6 IMPACT OF RECESSION ON GLOBAL 3D DIGITAL ASSET MARKET 
           TABLE 4 RECESSION IMPACT
    2.7 LIMITATIONS 
           FIGURE 14 LIMITATIONS
 
3 EXECUTIVE SUMMARY (Page No. - 58)
    FIGURE 15 3D DIGITAL ASSET MARKET SNAPSHOT, 2019–2029 
    FIGURE 16 TOP MARKET SEGMENTS IN TERMS OF GROWTH RATE 
    FIGURE 17 NORTH AMERICA TO ACCOUNT FOR LARGEST SHARE DURING FORECAST PERIOD 
 
4 PREMIUM INSIGHTS (Page No. - 62)
    4.1 ATTRACTIVE GROWTH OPPORTUNITIES FOR PLAYERS IN MARKET 
           FIGURE 18 INCREASING DEMAND FOR IMMERSIVE AND INTERACTIVE DIGITAL EXPERIENCES TO DRIVE 3D DIGITAL ASSET MARKET GROWTH
    4.2 MARKET, BY COMPONENT, 2024 VS. 2029 
           FIGURE 19 SOFTWARE TO ACCOUNT FOR LARGEST SHARE IN 2024
    4.3 MARKET, BY APPLICATION, 2024 VS. 2029 
           FIGURE 20 VISUALIZATION TO ACCOUNT FOR LARGEST SHARE IN 2024
    4.4 MARKET, BY DEPLOYMENT MODE, 2024 VS. 2029 
           FIGURE 21 ON-PREMISES SEGMENT TO ACCOUNT FOR LARGER SHARE IN 2024
    4.5 MARKET, BY VERTICAL, 2024 VS. 2029 
           FIGURE 22 ARCHITECTURE & CONSTRUCTION TO ACCOUNT FOR LARGEST SHARE IN 2024
    4.6 MARKET, BY REGION, 2024 VS. 2029 
           FIGURE 23 ASIA PACIFIC TO EMERGE AS BEST MARKET FOR INVESTMENTS IN NEXT FIVE YEARS
 
5 MARKET OVERVIEW AND INDUSTRY TRENDS (Page No. - 65)
    5.1 MARKET OVERVIEW 
    5.2 MARKET DYNAMICS 
           FIGURE 24 3D DIGITAL ASSET MARKET: DRIVERS, RESTRAINTS, OPPORTUNITIES, AND CHALLENGES
           5.2.1 DRIVERS
                    5.2.1.1 Rapid technological advancements
                    5.2.1.2 Demand across industries for immersive technologies
                    5.2.1.3 Educational and training applications
           5.2.2 RESTRAINTS
                    5.2.2.1 Technical standards and interoperability
                    5.2.2.2 Security concerns
           5.2.3 OPPORTUNITIES
                    5.2.3.1 E-commerce integration
                    5.2.3.2 Rise in interest in metaverse
           5.2.4 CHALLENGES
                    5.2.4.1 Intellectual Property (IP) and licensing issues
                    5.2.4.2 Market fragmentation
    5.3 INDUSTRY TRENDS 
           5.3.1 BRIEF HISTORY OF 3D DIGITAL ASSET INDUSTRY
                    FIGURE 25 BRIEF HISTORY OF 3D DIGITAL ASSET
                    5.3.1.1 1990–2000
                    5.3.1.2 2000–2010
                    5.3.1.3 2010–2020
                    5.3.1.4 2020–Present
           5.3.2 TRENDS/DISRUPTIONS IMPACTING BUYERS/CUSTOMERS
                    FIGURE 26 TRENDS/DISRUPTIONS IMPACTING BUYERS/CUSTOMERS IN MARKET
           5.3.3 PRICING ANALYSIS
                    5.3.3.1 Average selling price trend of key players, by offering
                               FIGURE 27 AVERAGE SELLING PRICE TREND OF KEY PLAYERS, BY OFFERING (USD)
                               TABLE 5 AVERAGE SELLING PRICE TREND OF KEY PLAYERS, BY OFFERING (USD)
                    5.3.3.2 Indicative pricing analysis of 3D digital assets
                               TABLE 6 INDICATIVE PRICING ANALYSIS OF 3D DIGITAL ASSETS
           5.3.4 SUPPLY CHAIN ANALYSIS
                    FIGURE 28 3D DIGITAL ASSET MARKET: SUPPLY CHAIN ANALYSIS
                    5.3.4.1 Content Creation
                    5.3.4.2 Processing & Optimization
                    5.3.4.3 Distribution & Monetization
                    5.3.4.4 End User Applications
           5.3.5 ECOSYSTEM ANALYSIS
                    FIGURE 29 3D DIGITAL ASSET ECOSYSTEM
                    TABLE 7 MARKET: ECOSYSTEM
           5.3.6 TECHNOLOGY ANALYSIS
                    5.3.6.1 Key Technologies
                               5.3.6.1.1 Procedural generation
                               5.3.6.1.2 Subdivision surfaces
                               5.3.6.1.3 Ray tracing
                               5.3.6.1.4 LIDAR
                               5.3.6.1.5 Photogrammetry
                               5.3.6.1.6 Simultaneous Localization and Mapping (SLAM)
                    5.3.6.2 Adjacent Technologies
                               5.3.6.2.1 IoT
                               5.3.6.2.2 5G Technology
                               5.3.6.2.3 Digital Twins
                               5.3.6.2.4 Data Mining
                               5.3.6.2.5 Predictive Analytics
                    5.3.6.3 Complementary Technologies
                               5.3.6.3.1 Virtualization
                               5.3.6.3.2 Computer Vision
                               5.3.6.3.3 Additive Manufacturing
                               5.3.6.3.4 Material Extrusion
                               5.3.6.3.5 Shader Technology
                               5.3.6.3.6 Vector Graphics
           5.3.7 PATENT ANALYSIS
                    5.3.7.1 Methodology
                               FIGURE 30 LIST OF MAJOR PATENTS ASSOCIATED WITH 3D DIGITAL ASSET
                               TABLE 8 LIST OF MAJOR PATENTS
           5.3.8 TRADE ANALYSIS
                    5.3.8.1 Export Scenario
                               TABLE 9 EXPORT SCENARIO FOR HS CODE: 903149, BY COUNTRY, 2021–2023 (USD THOUSAND)
                               FIGURE 31 EXPORT SCENARIO FOR HS CODE: 903149, BY COUNTRY, 2021–2023 (USD THOUSAND)
                    5.3.8.2 Import Scenario
                               TABLE 10 IMPORT SCENARIO FOR HS CODE: 903149, BY COUNTRY, 2021–2023 (USD THOUSAND)
                               FIGURE 32 IMPORT SCENARIO FOR HS CODE: 903149, BY COUNTRY, 2021–2023 (USD THOUSAND)
           5.3.9 CASE STUDIES
                    TABLE 11 SONY PICTURES ANIMATION TRANSFORMS PRE-PRODUCTION WITH NVIDIA OMNIVERSE AND FLIXIVERSE
                    TABLE 12 TRANSFORMING RAPID PROTOTYPING WITH AUTODESK FUSION AT RIVIAN
                    TABLE 13 UNITY EMPOWERED BOSCH REXROTH TO BOOST SALES AND CUSTOMER ENGAGEMENT WITH VIRTUAL SHOWROOM SOLUTION
                    TABLE 14 ENHANCING IN-STORE DISPLAY EFFICIENCY AND DECISION-MAKING WITH ADOBE’S 3D SOLUTIONS AT HERSHEY
                    TABLE 15 META’S VR SOLUTION ENHANCED COLLABORATION AND REDUCED COSTS FOR MORTENSON CONSTRUCTION PROJECTS
           5.3.10 KEY CONFERENCES & EVENTS
                    TABLE 16 3D DIGITAL ASSET MARKET: DETAILED LIST OF CONFERENCES & EVENTS, 2023–2024
           5.3.11 CURRENT AND EMERGING BUSINESS MODELS
                    5.3.11.1 Current Business Models
                               5.3.11.1.1 Licensing Model
                               5.3.11.1.2 Subscription-based Services Model
                               5.3.11.1.3 3D Asset Marketplaces Model
                    5.3.11.2 Emerging Business Models
                               5.3.11.2.1 Subscription with Customization Model
                               5.3.11.2.2 3D Asset-as-a-Service (AaaS) Model
                               5.3.11.2.3 NFT-based Ownership Model
           5.3.12 BEST PRACTICES IN MARKET
           5.3.13 TOOLS, FRAMEWORKS, AND TECHNIQUES
                    FIGURE 33 TOOLS, FRAMEWORKS, AND TECHNIQUES
           5.3.14 FUTURE LANDSCAPE OF 3D DIGITAL ASSET MARKET
                    5.3.14.1 3D Digital Asset Technology Roadmap Till 2030
                    5.3.14.2 Short-term Roadmap (2024–2025)
                    5.3.14.3 Mid-Term Roadmap (2026–2028)
                    5.3.14.4 Long-Term Roadmap (2029–2030)
           5.3.15 REGULATORY LANDSCAPE
                    5.3.15.1 REGULATORY BODIES, GOVERNMENT AGENCIES, AND OTHER ORGANIZATIONS
                               TABLE 17 NORTH AMERICA: REGULATORY BODIES, GOVERNMENT AGENCIES, AND OTHER ORGANIZATIONS
                               TABLE 18 EUROPE: REGULATORY BODIES, GOVERNMENT AGENCIES, AND OTHER ORGANIZATIONS
                               TABLE 19 ASIA PACIFIC: LIST OF REGULATORY BODIES, GOVERNMENT AGENCIES, AND OTHER ORGANIZATIONS
                               TABLE 20 MIDDLE EAST & AFRICA: REGULATORY BODIES, GOVERNMENT AGENCIES, AND OTHER ORGANIZATIONS
                               TABLE 21 LATIN AMERICA: REGULATORY BODIES, GOVERNMENT AGENCIES, AND OTHER ORGANIZATIONS
                    5.3.15.2 Regulations, By Region
                               5.3.15.2.1 North America
                                             5.3.15.2.1.1 US
                                             5.3.15.2.1.2 Canada
                               5.3.15.2.2 Europe
                                             5.3.15.2.2.1 UK
                                             5.3.15.2.2.2 Germany
                               5.3.15.2.3 Asia Pacific
                                             5.3.15.2.3.1 China
                                             5.3.15.2.3.2 India
                                             5.3.15.2.3.3 Japan
                               5.3.15.2.4 Middle East & Africa
                                             5.3.15.2.4.1 UAE
                                             5.3.15.2.4.2 South Africa
                               5.3.15.2.5 Latin America
                                             5.3.15.2.5.1 Brazil
           5.3.16 PORTER’S FIVE FORCES ANALYSIS
                    TABLE 22 IMPACT OF PORTER’S FIVE FORCES ON 3D DIGITAL ASSET MARKET
                    FIGURE 34 MARKET: PORTER’S FIVE FORCES MODEL
                    5.3.16.1 Threat of new entrants
                    5.3.16.2 Threat of substitutes
                    5.3.16.3 Bargaining power of buyers
                    5.3.16.4 Bargaining power of suppliers
                    5.3.16.5 Intensity of competitive rivalry
           5.3.17 KEY STAKEHOLDERS & BUYING CRITERIA
                    5.3.17.1 Key stakeholders in buying process
                               FIGURE 35 INFLUENCE OF STAKEHOLDERS ON BUYING PROCESS FOR TOP THREE VERTICALS
                               TABLE 23 INFLUENCE OF STAKEHOLDERS ON BUYING PROCESS FOR TOP THREE VERTICALS
                    5.3.17.2 Buying criteria
                               FIGURE 36 KEY BUYING CRITERIA FOR TOP THREE VERTICALS
                               TABLE 24 KEY BUYING CRITERIA FOR TOP THREE VERTICALS
           5.3.18 INVESTMENT AND FUNDING SCENARIO
                    FIGURE 37 INVESTMENT AND FUNDING SCENARIO, 2019–2023 (USD MILLION)
           5.3.19 KEY TRENDS ANALYSIS
                    5.3.19.1 Universal Scene Description (USD)
                    5.3.19.2 OPENUSD
                    5.3.19.3 Physically Based Rendering (PBR)
                    5.3.19.4 OPENBR
                    5.3.19.5 OPENVDB
                    5.3.19.6 METAVERSE
                    5.3.19.7 Digital twins
 
6 3D DIGITAL ASSET MARKET, BY COMPONENT (Page No. - 102)
    6.1 INTRODUCTION 
           6.1.1 COMPONENT: MARKET DRIVERS
                    FIGURE 38 SOFTWARE SEGMENT TO ACCOUNT FOR LARGEST MARKET IN 2024
                    TABLE 25 MARKET, BY COMPONENT, 2019–2023 (USD MILLION)
                    TABLE 26 MARKET, BY COMPONENT, 2024–2029 (USD MILLION)
    6.2 HARDWARE 
           6.2.1 ADVANCED COMPUTING DEVICES TO ENSURE HIGH PERFORMANCE AND COMPATIBILITY FOR MANAGING 3D DATA ACROSS INDUSTRIES
                    FIGURE 39 3D SCANNERS SEGMENT TO ACCOUNT FOR LARGER MARKET IN 2024
                    TABLE 27 MARKET, BY HARDWARE, 2019–2023 (USD MILLION)
                    TABLE 28 MARKET, BY HARDWARE, 2024–2029 (USD MILLION)
                    TABLE 29 HARDWARE: MARKET, BY REGION, 2019–2023 (USD MILLION)
                    TABLE 30 HARDWARE: MARKET, BY REGION, 2024–2029 (USD MILLION)
           6.2.2 3D SCANNERS
                    TABLE 31 3D SCANNERS: MARKET, BY REGION, 2019–2023 (USD MILLION)
                    TABLE 32 3D SCANNERS: MARKET, BY REGION, 2024–2029 (USD MILLION)
           6.2.3 MOTION CAPTURE SYSTEMS
                    TABLE 33 MOTION CAPTURE SYSTEMS: MARKET, BY REGION, 2019–2023 (USD MILLION)
                    TABLE 34 MOTION CAPTURE SYSTEMS: MARKET, BY REGION, 2024–2029 (USD MILLION)
    6.3 SOFTWARE 
           6.3.1 EFFICIENT 3D SOFTWARE SOLUTIONS TO ENHANCE DIGITAL ASSETS WITH ADVANCED FUNCTIONALITY AND COLLABORATION CAPABILITIES
                    FIGURE 40 3D MODELING SEGMENT TO ACCOUNT FOR LARGEST MARKET IN 2024
                    TABLE 35 MARKET, BY SOFTWARE, 2019–2023 (USD MILLION)
                    TABLE 36 MARKET, BY SOFTWARE, 2024–2029 (USD MILLION)
                    TABLE 37 SOFTWARE: MARKET, BY REGION, 2019–2023 (USD MILLION)
                    TABLE 38 SOFTWARE: MARKET, BY REGION, 2024–2029 (USD MILLION)
           6.3.2 3D MODELING SOFTWARE
                    TABLE 39 3D MODELING SOFTWARE: MARKET, BY REGION, 2019–2023 (USD MILLION)
                    TABLE 40 3D MODELING SOFTWARE: MARKET, BY REGION, 2024–2029 (USD MILLION)
                    6.3.2.1 Solid modeling
                    6.3.2.2 Wireframe modeling
                    6.3.2.3 Surface modeling
           6.3.3 3D SCANNING SOFTWARE
                    TABLE 41 3D SCANNING SOFTWARE: MARKET, BY REGION, 2019–2023 (USD MILLION)
                    TABLE 42 3D SCANNING SOFTWARE: MARKET, BY REGION, 2024–2029 (USD MILLION)
           6.3.4 3D RENDERING & VISUALIZATION SOFTWARE
                    TABLE 43 3D RENDERING & VISUALIZATION SOFTWARE: 3D DIGITAL ASSET MARKET, BY REGION, 2019–2023 (USD MILLION)
                    TABLE 44 3D RENDERING & VISUALIZATION SOFTWARE: MARKET, BY REGION, 2024–2029 (USD MILLION)
           6.3.5 3D ANIMATION SOFTWARE
                    TABLE 45 3D ANIMATION SOFTWARE: MARKET, BY REGION, 2019–2023 (USD MILLION)
                    TABLE 46 3D ANIMATION SOFTWARE: MARKET, BY REGION, 2024–2029 (USD MILLION)
           6.3.6 IMAGE RECONSTRUCTION SOFTWARE
                    TABLE 47 IMAGE RECONSTRUCTION SOFTWARE: MARKET, BY REGION, 2019–2023 (USD MILLION)
                    TABLE 48 IMAGE RECONSTRUCTION SOFTWARE: MARKET, BY REGION, 2024–2029 (USD MILLION)
    6.4 SERVICES 
           6.4.1 COMPREHENSIVE SERVICES TO SIMPLIFY CREATION, MANAGEMENT, AND MONETIZATION OF 3D DIGITAL ASSETS
                    FIGURE 41 PROFESSIONAL SERVICES TO ACCOUNT FOR LARGER MARKET IN 2024
                    TABLE 49 MARKET, BY SERVICE, 2019–2023 (USD MILLION)
                    TABLE 50 MARKET, BY SERVICE, 2024–2029 (USD MILLION)
                    TABLE 51 SERVICES: MARKET, BY REGION, 2019–2023 (USD MILLION)
                    TABLE 52 SERVICES: MARKET, BY REGION, 2024–2029 (USD MILLION)
           6.4.2 PROFESSIONAL SERVICES
                    TABLE 53 PROFESSIONAL SERVICES: MARKET, BY REGION, 2019–2023 (USD MILLION)
                    TABLE 54 PROFESSIONAL SERVICES: MARKET, BY REGION, 2024–2029 (USD MILLION)
                    6.4.2.1 Integration & implementation
                    6.4.2.2 Consulting & training
                    6.4.2.3 Support & maintenance
           6.4.3 MANAGED SERVICES
                    TABLE 55 MANAGED SERVICES: MARKET, BY REGION, 2019–2023 (USD MILLION)
                    TABLE 56 MANAGED SERVICES: MARKET, BY REGION, 2024–2029 (USD MILLION)
 
7 MARKET, BY DEPLOYMENT MODE (Page No. - 120)
    7.1 INTRODUCTION 
           FIGURE 42 ON-PREMISES TO ACCOUNT FOR LARGER MARKET IN 2029
           7.1.1 DEPLOYMENT MODE: 3D DIGITAL ASSET MARKET DRIVERS
                    TABLE 57 MARKET, BY DEPLOYMENT MODE, 2019–2023 (USD MILLION)
                    TABLE 58 MARKET, BY DEPLOYMENT MODE, 2024–2029 (USD MILLION)
    7.2 ON-PREMISES 
           7.2.1 NEED FOR SECURE AND CUSTOMIZED 3D DIGITAL ASSETS FOR HIGH-SECURITY INDUSTRIES TO DRIVE DEMAND
                    TABLE 59 ON-PREMISES: MARKET, BY REGION, 2019–2023 (USD MILLION)
                    TABLE 60 ON-PREMISES: MARKET, BY REGION, 2024–2029 (USD MILLION)
    7.3 CLOUD 
           7.3.1 CLOUD TO OFFER SECURE, CONTROLLED, AND COMPLIANT INFRASTRUCTURE FOR ENTERPRISES
                    TABLE 61 CLOUD: MARKET, BY REGION, 2019–2023 (USD MILLION)
                    TABLE 62 CLOUD: MARKET, BY REGION, 2024–2029 (USD MILLION)
 
8 3D DIGITAL ASSET MARKET, BY APPLICATION (Page No. - 125)
    8.1 INTRODUCTION 
           8.1.1 APPLICATION: MARKET DRIVERS
                    FIGURE 43 VISUALIZATION SEGMENT TO ACCOUNT FOR LARGEST MARKET IN 2024
    8.2 VISUALIZATION 
           TABLE 63 VISUALIZATION: MARKET, BY REGION, 2019–2023 (USD MILLION)
           TABLE 64 VISUALIZATION: MARKET, BY REGION, 2024–2029 (USD MILLION)
           8.2.1 ARCHITECTURAL RENDERING
           8.2.2 PRODUCT RENDERING FOR E-COMMERCE
           8.2.3 DATA VISUALIZATION
           8.2.4 OTHER VISUALIZATION APPLICATIONS
    8.3 SIMULATION 
           TABLE 65 SIMULATION: MARKET, BY REGION, 2019–2023 (USD MILLION)
           TABLE 66 SIMULATION: MARKET, BY REGION, 2024–2029 (USD MILLION)
           8.3.1 MEDICAL TRAINING SIMULATIONS
           8.3.2 FLIGHT TRAINING SIMULATORS
           8.3.3 MANUFACTURING PROCESS SIMULATIONS
           8.3.4 OTHER SIMULATION APPLICATIONS
    8.4 DIGITAL PROTOTYPING 
           TABLE 67 DIGITAL PROTOTYPING: 3D DIGITAL ASSET MARKET, BY REGION, 2019–2023 (USD MILLION)
           TABLE 68 DIGITAL PROTOTYPING: MARKET, BY REGION, 2024–2029 (USD MILLION)
           8.4.1 DIGITAL PROTOTYPING: APPLICATION AREAS
                    8.4.1.1 Automotive Concept Design
                    8.4.1.2 Consumer Product Prototyping
                    8.4.1.3 Interior Design Visualization
           8.4.2 OTHER DIGITAL PROTOTYPING APPLICATIONS
    8.5 GAMING & ANIMATION 
           TABLE 69 GAMING & ANIMATION: MARKET, BY REGION, 2019–2023 (USD MILLION)
           TABLE 70 GAMING & ANIMATION: MARKET, BY REGION, 2024–2029 (USD MILLION)
           8.5.1 GAMING & ANIMATION: APPLICATION AREAS
                    8.5.1.1 Character Modeling & Animation
                    8.5.1.2 Environment Design
                    8.5.1.3 Texturing & Shading
           8.5.2 OTHER GAMING & ANIMATION APPLICATIONS
    8.6 VIRTUAL EXPERIENCE 
           TABLE 71 VIRTUAL EXPERIENCE: MARKET, BY REGION, 2019–2023 (USD MILLION)
           TABLE 72 VIRTUAL EXPERIENCE: MARKET, BY REGION, 2024–2029 (USD MILLION)
           8.6.1 VIRTUAL TOURS
           8.6.2 VIRTUAL TRAINING ENVIRONMENTS
           8.6.3 VIRTUAL EVENTS & CONFERENCES
           8.6.4 OTHER VIRTUAL EXPERIENCE APPLICATIONS
    8.7 MARKETING & ADVERTISING 
           TABLE 73 MARKETING & ADVERTISING: MARKET, BY REGION, 2019–2023 (USD MILLION)
           TABLE 74 MARKETING & ADVERTISING: 3D DIGITAL ASSET MARKET, BY REGION, 2024–2029 (USD MILLION)
           8.7.1 PRODUCT MARKETING
           8.7.2 BRAND CAMPAIGNS
           8.7.3 DIGITAL SIGNAGE
           8.7.4 OTHER MARKETING & ADVERTISING APPLICATIONS
    8.8 OTHER APPLICATIONS 
           TABLE 75 OTHER APPLICATIONS: MARKET, BY REGION, 2019–2023 (USD MILLION)
           TABLE 76 OTHER APPLICATIONS: MARKET, BY REGION, 2024–2029 (USD MILLION)
 
9 MARKET, BY VERTICAL (Page No. - 140)
    9.1 INTRODUCTION 
           FIGURE 44 ARCHITECTURE & CONSTRUCTION VERTICAL TO GROW AT HIGHEST CAGR DURING FORECAST PERIOD
           9.1.1 VERTICAL: 3D DIGITAL ASSET MARKET DRIVERS
                    TABLE 77 MARKET, BY VERTICAL, 2019–2023 (USD MILLION)
                    TABLE 78 MARKET, BY VERTICAL, 2024–2029 (USD MILLION)
    9.2 MEDIA & ENTERTAINMENT 
           TABLE 79 MEDIA & ENTERTAINMENT: MARKET, BY TYPE, 2019–2023 (USD MILLION)
           TABLE 80 MEDIA & ENTERTAINMENT: MARKET, BY TYPE, 2024–2029 (USD MILLION)
           TABLE 81 MEDIA & ENTERTAINMENT: MARKET, BY REGION, 2019–2023 (USD MILLION)
           TABLE 82 MEDIA & ENTERTAINMENT: MARKET, BY REGION, 2024–2029 (USD MILLION)
           9.2.1 MEDIA & ENTERTAINMENT, BY TYPE
                    9.2.1.1 Film & broadcasting
                               TABLE 83 FILM & BROADCASTING: MARKET, BY REGION, 2019–2023 (USD MILLION)
                               TABLE 84 FILM & BROADCASTING: MARKET, BY REGION, 2024–2029 (USD MILLION)
                    9.2.1.2 Gaming
                               TABLE 85 GAMING: MARKET, BY REGION, 2019–2023 (USD MILLION)
                               TABLE 86 GAMING: MARKET, BY REGION, 2024–2029 (USD MILLION)
                    9.2.1.3 Other media & entertainment applications
                               TABLE 87 OTHER MEDIA & ENTERTAINMENT APPLICATIONS: MARKET, BY REGION, 2019–2023 (USD MILLION)
                               TABLE 88 OTHER MEDIA & ENTERTAINMENT APPLICATIONS: 3D DIGITAL ASSET MARKET, BY REGION, 2024–2029 (USD MILLION)
           9.2.2 MEDIA & ENTERTAINMENT: USE CASES
                    9.2.2.1 Gaming
                    9.2.2.2 Visual Effects (VFX)
                    9.2.2.3 Augmented Reality & Virtual Reality
                    9.2.2.4 Other Use Cases
    9.3 ARCHITECTURE & CONSTRUCTION 
           TABLE 89 ARCHITECTURE & CONSTRUCTION: MARKET, BY REGION, 2019–2023 (USD MILLION)
           TABLE 90 ARCHITECTURE & CONSTRUCTION: MARKET, BY REGION, 2024–2029 (USD MILLION)
           9.3.1 ARCHITECTURE & CONSTRUCTION: USE CASES
                    9.3.1.1 Architectural Visualization & Walkthrough
                    9.3.1.2 Building Information Modeling (BIM)
                    9.3.1.3 Site Analysis & Surveying
                    9.3.1.4 Other Use Cases
    9.4 HEALTHCARE & LIFE SCIENCES 
           TABLE 91 HEALTHCARE & LIFE SCIENCES: MARKET, BY REGION, 2019–2023 (USD MILLION)
           TABLE 92 HEALTHCARE & LIFE SCIENCES: MARKET, BY REGION, 2024–2029 (USD MILLION)
           9.4.1 HEALTHCARE & LIFE SCIENCES: USE CASES
                    9.4.1.1 Medical Imaging & Visualization
                    9.4.1.2 Surgical Planning & Simulation
                    9.4.1.3 Anatomical Education & Training
                    9.4.1.4 Other Use Cases
    9.5 RETAIL & E-COMMERCE 
           TABLE 93 RETAIL & E-COMMERCE: MARKET, BY REGION, 2019–2023 (USD MILLION)
           TABLE 94 RETAIL & E-COMMERCE: MARKET, BY REGION, 2024–2029 (USD MILLION)
           9.5.1 RETAIL & E-COMMERCE: USE CASES
                    9.5.1.1 Visual Try-ons
                    9.5.1.2 Product Visualization
                    9.5.1.3 Customization & Personalization
                    9.5.1.4 Other Use Cases
    9.6 GOVERNMENT & DEFENSE 
           TABLE 95 GOVERNMENT & DEFENSE: 3D DIGITAL ASSET MARKET, BY REGION, 2019–2023 (USD MILLION)
           TABLE 96 GOVERNMENT & DEFENSE: MARKET, BY REGION, 2024–2029 (USD MILLION)
           9.6.1 GOVERNMENT & DEFENSE: USE CASES
                    9.6.1.1 Urban Planning & GIS
                    9.6.1.2 Emergency Response & Disaster Management
                    9.6.1.3 Cultural Heritage Preservation
                    9.6.1.4 Other Use Cases
    9.7 MANUFACTURING 
           TABLE 97 MANUFACTURING: MARKET, BY REGION, 2019–2023 (USD MILLION)
           TABLE 98 MANUFACTURING: MARKET, BY REGION, 2024–2029 (USD MILLION)
           9.7.1 MANUFACTURING: USE CASES
                    9.7.1.1 Product Design & Prototyping
                    9.7.1.2 Factory Layout Planning
                    9.7.1.3 Maintenance & Repair Simulation
                    9.7.1.4 Other Use Cases
    9.8 AUTOMOTIVE 
           TABLE 99 AUTOMOTIVE: MARKET, BY REGION, 2019–2023 (USD MILLION)
           TABLE 100 AUTOMOTIVE: MARKET, BY REGION, 2024–2029 (USD MILLION)
           9.8.1 AUTOMOTIVE: USE CASES
                    9.8.1.1 Automated Parking Systems
                    9.8.1.2 Collision Avoidance Systems
                    9.8.1.3 Driver Assistance Systems
                    9.8.1.4 Other Use Cases
    9.9 OTHER VERTICALS 
           TABLE 101 OTHER VERTICALS: MARKET, BY REGION, 2019–2023 (USD MILLION)
           TABLE 102 OTHER VERTICALS: 3D DIGITAL ASSET MARKET, BY REGION, 2024–2029 (USD MILLION)
 
10 3D DIGITAL ASSET MARKET, BY REGION (Page No. - 161)
     10.1 INTRODUCTION 
               FIGURE 45 ASIA PACIFIC TO GROW AT HIGHEST CAGR DURING FORECAST PERIOD
               TABLE 103 MARKET, BY REGION, 2019–2023 (USD MILLION)
               TABLE 104 MARKET, BY REGION, 2024–2029 (USD MILLION)
     10.2 NORTH AMERICA 
             10.2.1 NORTH AMERICA: MARKET DRIVERS
             10.2.2 NORTH AMERICA: RECESSION IMPACT
                       FIGURE 46 NORTH AMERICA: MARKET SNAPSHOT
                       TABLE 105 NORTH AMERICA: MARKET, BY COMPONENT, 2019–2023 (USD MILLION)
                       TABLE 106 NORTH AMERICA: MARKET, BY COMPONENT, 2024–2029 (USD MILLION)
                       TABLE 107 NORTH AMERICA: MARKET, BY HARDWARE, 2019–2023 (USD MILLION)
                       TABLE 108 NORTH AMERICA: MARKET, BY HARDWARE, 2024–2029 (USD MILLION)
                       TABLE 109 NORTH AMERICA: MARKET, BY SOFTWARE, 2019–2023 (USD MILLION)
                       TABLE 110 NORTH AMERICA: 3D DIGITAL ASSET MARKET, BY SOFTWARE, 2024–2029 (USD MILLION)
                       TABLE 111 NORTH AMERICA: MARKET, BY SERVICE, 2019–2023 (USD MILLION)
                       TABLE 112 NORTH AMERICA: MARKET, BY SERVICE, 2024–2029 (USD MILLION)
                       TABLE 113 NORTH AMERICA: MARKET, BY DEPLOYMENT MODE, 2019–2023 (USD MILLION)
                       TABLE 114 NORTH AMERICA: MARKET, BY DEPLOYMENT MODE, 2024–2029 (USD MILLION)
                       TABLE 115 NORTH AMERICA: MARKET, BY APPLICATION, 2019–2023 (USD MILLION)
                       TABLE 116 NORTH AMERICA: MARKET, BY APPLICATION, 2024–2029 (USD MILLION)
                       TABLE 117 NORTH AMERICA: MARKET, BY VERTICAL, 2019–2023 (USD MILLION)
                       TABLE 118 NORTH AMERICA: MARKET, BY VERTICAL, 2024–2029 (USD MILLION)
                       TABLE 119 NORTH AMERICA: MARKET IN MEDIA & ENTERTAINMENT, BY TYPE, 2019–2023 (USD MILLION)
                       TABLE 120 NORTH AMERICA: MARKET IN MEDIA & ENTERTAINMENT, BY TYPE, 2024–2029 (USD MILLION)
                       TABLE 121 NORTH AMERICA: MARKET, BY COUNTRY, 2019–2023 (USD MILLION)
                       TABLE 122 NORTH AMERICA: MARKET, BY COUNTRY, 2024–2029 (USD MILLION)
             10.2.3 US
                       10.2.3.1 North America's competitive edge in MARKET defined by technological infrastructure and sector services
                                   TABLE 123 US: 3D DIGITAL ASSET MARKET, BY DEPLOYMENT MODE, 2019–2023 (USD MILLION)
                                   TABLE 124 US: MARKET, BY DEPLOYMENT MODE, 2024–2029 (USD MILLION)
             10.2.4 CANADA
                       10.2.4.1 Canada to drive 3D digital asset management with advanced technology and thriving creative industries
                                   TABLE 125 CANADA: MARKET, BY DEPLOYMENT MODE, 2019–2023 (USD MILLION)
                                   TABLE 126 CANADA: MARKET, BY DEPLOYMENT MODE, 2024–2029 (USD MILLION)
     10.3 EUROPE 
             10.3.1 EUROPE: MARKET DRIVERS
             10.3.2 EUROPE: RECESSION IMPACT
                       TABLE 127 EUROPE: 3D DIGITAL ASSET MARKET, BY COMPONENT, 2019–2023 (USD MILLION)
                       TABLE 128 EUROPE: MARKET, BY COMPONENT, 2024–2029 (USD MILLION)
                       TABLE 129 EUROPE: MARKET, BY HARDWARE, 2019–2023 (USD MILLION)
                       TABLE 130 EUROPE: MARKET, BY HARDWARE, 2024–2029 (USD MILLION)
                       TABLE 131 EUROPE: MARKET, BY SOFTWARE, 2019–2023 (USD MILLION)
                       TABLE 132 EUROPE: MARKET, BY SOFTWARE, 2024–2029 (USD MILLION)
                       TABLE 133 EUROPE: MARKET, BY SERVICE, 2019–2023 (USD MILLION)
                       TABLE 134 EUROPE: MARKET, BY SERVICE, 2024–2029 (USD MILLION)
                       TABLE 135 EUROPE: MARKET, BY DEPLOYMENT MODE, 2019–2023 (USD MILLION)
                       TABLE 136 EUROPE: MARKET, BY DEPLOYMENT MODE, 2024–2029 (USD MILLION)
                       TABLE 137 EUROPE: MARKET, BY APPLICATION, 2019–2023 (USD MILLION)
                       TABLE 138 EUROPE: MARKET, BY APPLICATION, 2024–2029 (USD MILLION)
                       TABLE 139 EUROPE: MARKET, BY VERTICAL, 2019–2023 (USD MILLION)
                       TABLE 140 EUROPE: MARKET, BY VERTICAL, 2024–2029 (USD MILLION)
                       TABLE 141 EUROPE: MARKET IN MEDIA & ENTERTAINMENT, BY TYPE, 2019–2023 (USD MILLION)
                       TABLE 142 EUROPE: MARKET IN MEDIA & ENTERTAINMENT, BY TYPE, 2024–2029 (USD MILLION)
                       TABLE 143 EUROPE: MARKET, BY COUNTRY, 2019–2023 (USD MILLION)
                       TABLE 144 EUROPE: MARKET, BY COUNTRY, 2024–2029 (USD MILLION)
             10.3.3 UK
                       10.3.3.1 UK to advance 3D digital asset management, fostering innovation in media and technology sectors
                                   TABLE 145 UK: 3D DIGITAL ASSET MARKET, BY DEPLOYMENT MODE, 2019–2023 (USD MILLION)
                                   TABLE 146 UK: MARKET, BY DEPLOYMENT MODE, 2024–2029 (USD MILLION)
             10.3.4 GERMANY
                       10.3.4.1 Germany to elevate 3D digital asset management with industrial innovation and strategic economic focus
                                   TABLE 147 GERMANY: MARKET, BY DEPLOYMENT MODE, 2019–2023 (USD MILLION)
                                   TABLE 148 GERMANY: MARKET, BY DEPLOYMENT MODE, 2024–2029 (USD MILLION)
             10.3.5 FRANCE
                       10.3.5.1 France to excel in European MARKET with strong industry focus and government-backed innovation initiatives
                                   TABLE 149 FRANCE: 3D DIGITAL ASSET MARKET, BY DEPLOYMENT MODE, 2019–2023 (USD MILLION)
                                   TABLE 150 FRANCE: MARKET, BY DEPLOYMENT MODE, 2024–2029 (USD MILLION)
             10.3.6 ITALY
                       10.3.6.1 Italy to catalyze 3D digital innovation in creative and industrial sectors across Europe and globally
                                   TABLE 151 ITALY: MARKET, BY DEPLOYMENT MODE, 2019–2023 (USD MILLION)
                                   TABLE 152 ITALY: MARKET, BY DEPLOYMENT MODE, 2024–2029 (USD MILLION)
             10.3.7 REST OF EUROPE
                       TABLE 153 REST OF EUROPE: 3D DIGITAL ASSET MARKET, BY DEPLOYMENT MODE, 2019–2023 (USD MILLION)
                       TABLE 154 REST OF EUROPE: MARKET, BY DEPLOYMENT MODE, 2024–2029 (USD MILLION)
     10.4 ASIA PACIFIC 
             10.4.1 ASIA PACIFIC: MARKET DRIVERS
             10.4.2 ASIA PACIFIC: RECESSION IMPACT
                       FIGURE 47 ASIA PACIFIC: MARKET SNAPSHOT
                       TABLE 155 ASIA PACIFIC: MARKET, BY COMPONENT, 2019–2023 (USD MILLION)
                       TABLE 156 ASIA PACIFIC: 3D DIGITAL ASSET MARKET, BY COMPONENT, 2024–2029 (USD MILLION)
                       TABLE 157 ASIA PACIFIC: MARKET, BY HARDWARE, 2019–2023 (USD MILLION)
                       TABLE 158 ASIA PACIFIC: MARKET, BY HARDWARE, 2024–2029 (USD MILLION)
                       TABLE 159 ASIA PACIFIC: MARKET, BY SOFTWARE, 2019–2023 (USD MILLION)
                       TABLE 160 ASIA PACIFIC: MARKET, BY SOFTWARE, 2024–2029 (USD MILLION)
                       TABLE 161 ASIA PACIFIC: MARKET, BY SERVICE, 2019–2023 (USD MILLION)
                       TABLE 162 ASIA PACIFIC: MARKET, BY SERVICE, 2024–2029 (USD MILLION)
                       TABLE 163 ASIA PACIFIC: MARKET, BY DEPLOYMENT MODE, 2019–2023 (USD MILLION)
                       TABLE 164 ASIA PACIFIC: MARKET, BY DEPLOYMENT MODE, 2024–2029 (USD MILLION)
                       TABLE 165 ASIA PACIFIC: MARKET, BY APPLICATION, 2019–2023 (USD MILLION)
                       TABLE 166 ASIA PACIFIC: MARKET, BY APPLICATION, 2024–2029 (USD MILLION)
                       TABLE 167 ASIA PACIFIC: MARKET, BY VERTICAL, 2019–2023 (USD MILLION)
                       TABLE 168 ASIA PACIFIC: MARKET, BY VERTICAL, 2024–2029 (USD MILLION)
                       TABLE 169 ASIA PACIFIC: MARKET IN MEDIA & ENTERTAINMENT, BY TYPE, 2019–2023 (USD MILLION)
                       TABLE 170 ASIA PACIFIC: MARKET IN MEDIA & ENTERTAINMENT, BY TYPE, 2024–2029 (USD MILLION)
                       TABLE 171 ASIA PACIFIC: MARKET, BY COUNTRY, 2019–2023 (USD MILLION)
                       TABLE 172 ASIA PACIFIC: MARKET, BY COUNTRY, 2024–2029 (USD MILLION)
             10.4.3 CHINA
                       10.4.3.1 China's strategic advancements in 3D digital asset management to fuel Asia Pacific market
                                   TABLE 173 CHINA: MARKET, BY DEPLOYMENT MODE, 2019–2023 (USD MILLION)
                                   TABLE 174 CHINA: MARKET, BY DEPLOYMENT MODE, 2024–2029 (USD MILLION)
             10.4.4 JAPAN
                       10.4.4.1 Japan to expand 3D digital asset market with technological integration and industry specialization
                                   TABLE 175 JAPAN: MARKET, BY DEPLOYMENT MODE, 2019–2023 (USD MILLION)
                                   TABLE 176 JAPAN: MARKET, BY DEPLOYMENT MODE, 2024–2029 (USD MILLION)
             10.4.5 AUSTRALIA & NEW ZEALAND
                       10.4.5.1 Australia and New Zealand to embrace advanced 3D digital asset solutions for creative industries
                                   TABLE 177 AUSTRALIA & NEW ZEALAND: MARKET, BY DEPLOYMENT MODE, 2019–2023 (USD MILLION)
                                   TABLE 178 AUSTRALIA & NEW ZEALAND: MARKET, BY DEPLOYMENT MODE, 2024–2029 (USD MILLION)
             10.4.6 REST OF ASIA PACIFIC
                       TABLE 179 REST OF ASIA PACIFIC: 3D DIGITAL ASSET MARKET, BY DEPLOYMENT MODE, 2019–2023 (USD MILLION)
                       TABLE 180 REST OF ASIA PACIFIC: MARKET, BY DEPLOYMENT MODE, 2024–2029 (USD MILLION)
     10.5 MIDDLE EAST & AFRICA 
             10.5.1 MIDDLE EAST & AFRICA: MARKET DRIVERS
             10.5.2 MIDDLE EAST & AFRICA: RECESSION IMPACT
                       TABLE 181 MIDDLE EAST & AFRICA: 3D DIGITAL ASSET MARKET, BY COMPONENT, 2019–2023 (USD MILLION)
                       TABLE 182 MIDDLE EAST & AFRICA: MARKET, BY COMPONENT, 2024–2029 (USD MILLION)
                       TABLE 183 MIDDLE EAST & AFRICA: MARKET, BY HARDWARE, 2019–2023 (USD MILLION)
                       TABLE 184 MIDDLE EAST & AFRICA: MARKET, BY HARDWARE, 2024–2029 (USD MILLION)
                       TABLE 185 MIDDLE EAST & AFRICA: MARKET, BY SOFTWARE, 2019–2023 (USD MILLION)
                       TABLE 186 MIDDLE EAST & AFRICA: MARKET, BY SOFTWARE, 2024–2029 (USD MILLION)
                       TABLE 187 MIDDLE EAST & AFRICA: MARKET, BY SERVICE, 2019–2023 (USD MILLION)
                       TABLE 188 MIDDLE EAST & AFRICA: MARKET, BY SERVICE, 2024–2029 (USD MILLION)
                       TABLE 189 MIDDLE EAST & AFRICA: MARKET, BY DEPLOYMENT MODE, 2019–2023 (USD MILLION)
                       TABLE 190 MIDDLE EAST & AFRICA: MARKET, BY DEPLOYMENT MODE, 2024–2029 (USD MILLION)
                       TABLE 191 MIDDLE EAST & AFRICA: MARKET, BY APPLICATION, 2019–2023 (USD MILLION)
                       TABLE 192 MIDDLE EAST & AFRICA: MARKET, BY APPLICATION, 2024–2029 (USD MILLION)
                       TABLE 193 MIDDLE EAST & AFRICA: MARKET, BY VERTICAL, 2019–2023 (USD MILLION)
                       TABLE 194 MIDDLE EAST & AFRICA: MARKET, BY VERTICAL, 2024–2029 (USD MILLION)
                       TABLE 195 MIDDLE EAST & AFRICA: MARKET IN MEDIA & ENTERTAINMENT, BY TYPE, 2019–2023 (USD MILLION)
                       TABLE 196 MIDDLE EAST & AFRICA: MARKET IN MEDIA & ENTERTAINMENT, BY TYPE, 2024–2029 (USD MILLION)
                       TABLE 197 MIDDLE EAST & AFRICA: MARKET, BY COUNTRY, 2019–2023 (USD MILLION)
                       TABLE 198 MIDDLE EAST & AFRICA: MARKET, BY COUNTRY, 2024–2029 (USD MILLION)
             10.5.3 GCC COUNTRIES (GULF COOPERATION COUNCIL)
                       10.5.3.1 Saudi Arabia
                                   10.5.3.1.1 Saudi Arabia to invest in 3D digital assets through Vision 2030 and expanding entertainment
                                   TABLE 199 GCC COUNTRIES: MARKET, BY DEPLOYMENT MODE, 2019–2023 (USD MILLION)
                                   TABLE 200 GCC COUNTRIES: 3D DIGITAL ASSET MARKET, BY DEPLOYMENT MODE, 2024–2029 (USD MILLION)
                                   TABLE 201 GCC COUNTRIES: MARKET, BY COUNTRY, 2019–2023 (USD MILLION)
                                   TABLE 202 GCC COUNTRIES: MARKET, BY COUNTRY, 2024–2029 (USD MILLION)
                       10.5.3.2 UAE
                                   10.5.3.2.1 UAE's role as tech and cultural hub to drive MARKET growth
                       10.5.3.3 Rest of GCC Countries
             10.5.4 SOUTH AFRICA
                       10.5.4.1 South Africa's emerging role in expanding 3D digital asset solutions in Sub-Saharan Africa to drive market
                                   TABLE 203 SOUTH AFRICA: MARKET, BY DEPLOYMENT MODE, 2019–2023 (USD MILLION)
                                   TABLE 204 SOUTH AFRICA: 3D DIGITAL ASSET MARKET, BY DEPLOYMENT MODE, 2024–2029 (USD MILLION)
             10.5.5 REST OF MIDDLE EAST & AFRICA
                       TABLE 205 REST OF MIDDLE EAST & AFRICA: MARKET, BY DEPLOYMENT MODE, 2019–2023 (USD MILLION)
                       TABLE 206 REST OF MIDDLE EAST & AFRICA: MARKET, BY DEPLOYMENT MODE, 2024–2029 (USD MILLION)
     10.6 LATIN AMERICA 
             10.6.1 LATIN AMERICA: MARKET DRIVERS
             10.6.2 LATIN AMERICA: RECESSION IMPACT
                       TABLE 207 LATIN AMERICA: 3D DIGITAL ASSET MARKET, BY COMPONENT, 2019–2023 (USD MILLION)
                       TABLE 208 LATIN AMERICA: MARKET, BY COMPONENT, 2024–2029 (USD MILLION)
                       TABLE 209 LATIN AMERICA: MARKET, BY HARDWARE, 2019–2023 (USD MILLION)
                       TABLE 210 LATIN AMERICA: MARKET, BY HARDWARE, 2024–2029 (USD MILLION)
                       TABLE 211 LATIN AMERICA: MARKET, BY SOFTWARE, 2019–2023 (USD MILLION)
                       TABLE 212 LATIN AMERICA: MARKET, BY SOFTWARE, 2024–2029 (USD MILLION)
                       TABLE 213 LATIN AMERICA: MARKET, BY SERVICE, 2019–2023 (USD MILLION)
                       TABLE 214 LATIN AMERICA: MARKET, BY SERVICE, 2024–2029 (USD MILLION)
                       TABLE 215 LATIN AMERICA: MARKET, BY DEPLOYMENT MODE, 2019–2023 (USD MILLION)
                       TABLE 216 LATIN AMERICA: MARKET, BY DEPLOYMENT MODE, 2024–2029 (USD MILLION)
                       TABLE 217 LATIN AMERICA: MARKET, BY APPLICATION, 2019–2023 (USD MILLION)
                       TABLE 218 LATIN AMERICA: MARKET, BY APPLICATION, 2024–2029 (USD MILLION)
                       TABLE 219 LATIN AMERICA: MARKET, BY VERTICAL, 2019–2023 (USD MILLION)
                       TABLE 220 LATIN AMERICA: MARKET, BY VERTICAL, 2024–2029 (USD MILLION)
                       TABLE 221 LATIN AMERICA: MARKET IN MEDIA & ENTERTAINMENT, BY TYPE, 2019–2023 (USD MILLION)
                       TABLE 222 LATIN AMERICA: MARKET IN MEDIA & ENTERTAINMENT, BY TYPE, 2024–2029 (USD MILLION)
                       TABLE 223 LATIN AMERICA: MARKET, BY COUNTRY, 2019–2023 (USD MILLION)
                       TABLE 224 LATIN AMERICA: MARKET, BY COUNTRY, 2024–2029 (USD MILLION)
             10.6.3 BRAZIL
                       10.6.3.1 Brazil to boost 3D digital asset management with tech innovation and strategic sector support
                                   TABLE 225 BRAZIL: MARKET, BY DEPLOYMENT MODE, 2019–2023 (USD MILLION)
                                   TABLE 226 BRAZIL: MARKET, BY DEPLOYMENT MODE, 2024–2029 (USD MILLION)
             10.6.4 MEXICO
                       10.6.4.1 Mexico's growing influence in 3D assets to be fueled by media expansion and digital transformation
                                   TABLE 227 MEXICO: MARKET, BY DEPLOYMENT MODE, 2019–2023 (USD MILLION)
                                   TABLE 228 MEXICO: MARKET, BY DEPLOYMENT MODE, 2024–2029 (USD MILLION)
             10.6.5 REST OF LATIN AMERICA
                       TABLE 229 REST OF LATIN AMERICA: 3D DIGITAL ASSET MARKET, BY DEPLOYMENT MODE, 2019–2023 (USD MILLION)
                       TABLE 230 REST OF LATIN AMERICA: MARKET, BY DEPLOYMENT MODE, 2024–2029 (USD MILLION)
 
11 COMPETITIVE LANDSCAPE (Page No. - 210)
     11.1 INTRODUCTION 
     11.2 KEY PLAYER STRATEGIES 
               TABLE 231 STRATEGIES ADOPTED BY KEY PLAYERS
     11.3 REVENUE ANALYSIS 
               FIGURE 48 3D DIGITAL ASSET MARKET: HISTORICAL REVENUE ANALYSIS, 2019–2023 (USD MILLION)
     11.4 MARKET SHARE ANALYSIS 
               TABLE 232 MARKET SHARE OF KEY VENDORS, 2023
               FIGURE 49 MARKET SHARE ANALYSIS, 2023
     11.5 MARKET: VENDOR PRODUCTS/BRANDS COMPARISON 
               FIGURE 50 VENDOR PRODUCT/BRAND COMPARISON
     11.6 COMPANY EVALUATION MATRIX: KEY PLAYERS, 2023 
               FIGURE 51 COMPANY EVALUATION MATRIX (KEY PLAYERS): CRITERIA WEIGHTAGE
             11.6.1 STARS
             11.6.2 EMERGING LEADERS
             11.6.3 PERVASIVE PLAYERS
             11.6.4 PARTICIPANTS
                       FIGURE 52 COMPANY EVALUATION MATRIX: KEY PLAYERS, 2023
             11.6.5 COMPANY FOOTPRINT: KEY PLAYERS, 2023
                       FIGURE 53 MARKET: COMPANY FOOTPRINT
                       TABLE 233 MARKET: REGION FOOTPRINT
                       TABLE 234 MARKET: COMPONENT FOOTPRINT
                       TABLE 235 MARKET: VERTICAL FOOTPRINT
     11.7 COMPANY EVALUATION MATRIX: STARTUPS/SMES, 2023 
               FIGURE 54 COMPANY EVALUATION MATRIX (STARTUPS/SMES): CRITERIA WEIGHTAGE
             11.7.1 PROGRESSIVE COMPANIES
             11.7.2 RESPONSIVE COMPANIES
             11.7.3 DYNAMIC COMPANIES
             11.7.4 STARTING BLOCKS
                       FIGURE 55 COMPANY EVALUATION MATRIX: STARTUPS/SMES, 2023
             11.7.5 COMPETITIVE BENCHMARKING: STARTUPS/SMES, 2023
                       11.7.5.1 Detailed list of key startups/SMEs
                                   TABLE 236 3D DIGITAL ASSET MARKET: COMPETITIVE BENCHMARKING FOR KEY STARTUPS/SMES
                       11.7.5.2 Competitive benchmarking of key startups/SMEs
                                   TABLE 237 MARKET: KEY STARTUPS/SMES
     11.8 COMPANY VALUATION AND FINANCIAL METRICS OF KEY VENDORS 
             11.8.1 COMPANY VALUATION
                       FIGURE 56 COMPANY VALUATION OF KEY VENDORS (USD BILLION)
             11.8.2 EV/EBITDA
                       FIGURE 57 FINANCIAL METRICS OF KEY VENDORS, 2024
                       FIGURE 58 YEAR-TO-DATE (YTD) PRICE TOTAL RETURN AND 5-YEAR STOCK BETA OF KEY VENDORS, 2024
     11.9 COMPETITIVE SCENARIO AND TRENDS 
             11.9.1 PRODUCT LAUNCHES
                       TABLE 238 MARKET: PRODUCT LAUNCHES, MARCH 2022–MAY 2024
             11.9.2 DEALS
                       TABLE 239 MARKET: DEALS, JANUARY 2022–MARCH 2024
 
12 COMPANY PROFILES (Page No. - 234)
     12.1 INTRODUCTION 
(Business Overview, Products/Solutions/Services Offered, Recent Developments, MnM view (Key strengths/Right to win, Strategic choices made, Weakness/competitive threats)*
     12.2 KEY PLAYERS 
             12.2.1 AUTODESK
                       TABLE 240 AUTODESK: BUSINESS OVERVIEW
                       FIGURE 59 AUTODESK: COMPANY SNAPSHOT
                       TABLE 241 AUTODESK: PRODUCTS/SOLUTIONS/SERVICES OFFERED
                       TABLE 242 AUTODESK: PRODUCT LAUNCHES & ENHANCEMENTS
                       TABLE 243 AUTODESK: DEALS
             12.2.2 SIEMENS
                       TABLE 244 SIEMENS: BUSINESS OVERVIEW
                       FIGURE 60 SIEMENS: COMPANY SNAPSHOT
                       TABLE 245 SIEMENS: PRODUCTS/SOLUTIONS/SERVICES OFFERED
                       TABLE 246 SIEMENS: DEALS
             12.2.3 ADOBE
                       TABLE 247 ADOBE: BUSINESS OVERVIEW
                       FIGURE 61 ADOBE: COMPANY SNAPSHOT
                       TABLE 248 ADOBE: PRODUCTS/SOLUTIONS/SERVICES OFFERED
                       TABLE 249 ADOBE: PRODUCT LAUNCHES AND ENHANCEMENTS
                       TABLE 250 ADOBE: DEALS
             12.2.4 UNITY
                       TABLE 251 UNITY: BUSINESS OVERVIEW
                       FIGURE 62 UNITY: COMPANY SNAPSHOT
                       TABLE 252 UNITY: PRODUCTS/SOLUTIONS/SERVICES OFFERED
                       TABLE 253 UNITY: PRODUCT LAUNCHES AND ENHANCEMENTS
                       TABLE 254 UNITY: DEALS
             12.2.5 NVIDIA
                       TABLE 255 NVIDIA: BUSINESS OVERVIEW
                       FIGURE 63 NVIDIA: COMPANY SNAPSHOT
                       TABLE 256 NVIDIA: PRODUCTS/SOLUTIONS/SERVICES OFFERED
                       TABLE 257 NVIDIA: PRODUCT LAUNCHES AND ENHANCEMENTS
                       TABLE 258 NVIDIA: DEALS
                       TABLE 259 NVIDIA: OTHER DEVELOPMENTS
             12.2.6 MICROSOFT
                       TABLE 260 MICROSOFT: BUSINESS OVERVIEW
                       FIGURE 64 MICROSOFT: COMPANY SNAPSHOT
                       TABLE 261 MICROSOFT: PRODUCTS/SOLUTIONS/SERVICES OFFERED
                       TABLE 262 MICROSOFT: DEALS
             12.2.7 ANSYS
                       TABLE 263 ANSYS: BUSINESS OVERVIEW
                       FIGURE 65 ANSYS: COMPANY SNAPSHOT
                       TABLE 264 ANSYS: PRODUCTS/SOLUTIONS/SERVICES OFFERED
                       TABLE 265 ANSYS: DEALS
             12.2.8 EPIC GAMES
                       TABLE 266 EPIC GAMES: BUSINESS OVERVIEW
                       TABLE 267 EPIC GAMES: PRODUCTS/SOLUTIONS/SERVICES OFFERED
                       TABLE 268 EPIC GAMES: PRODUCT LAUNCHES AND ENHANCEMENTS
                       TABLE 269 EPIC GAMES: DEALS
             12.2.9 PTC
                       TABLE 270 PTC: BUSINESS OVERVIEW
                       FIGURE 66 PTC: COMPANY SNAPSHOT
                       TABLE 271 PTC: PRODUCTS/SOLUTIONS/SERVICES OFFERED
             12.2.10 TRIMBLE
                                   TABLE 272 TRIMBLE: BUSINESS OVERVIEW
                                   FIGURE 67 TRIMBLE: COMPANY SNAPSHOT
                                   TABLE 273 TRIMBLE: PRODUCTS/SOLUTIONS/SERVICES OFFERED
                                   TABLE 274 TRIMBLE: PRODUCT LAUNCHES AND ENHANCEMENTS
                                   TABLE 275 TRIMBLE: DEALS
             12.2.11 SONY
                                   TABLE 276 SONY: BUSINESS OVERVIEW
                                   FIGURE 68 SONY: COMPANY SNAPSHOT
                                   TABLE 277 SONY: PRODUCTS/SOLUTIONS/SERVICES OFFERED
                                   TABLE 278 SONY: PRODUCT LAUNCHES AND ENHANCEMENTS
     12.3 OTHER PLAYERS 
             12.3.1 APPLE
             12.3.2 META
             12.3.3 REPLY
             12.3.4 GOOGLE
             12.3.5 IKEA
             12.3.6 PIXAR
             12.3.7 HEXA
             12.3.8 THREEKIT
             12.3.9 SITECORE
             12.3.10 DAMINION
             12.3.11 CONSORTIQ
             12.3.12 MODELRY
             12.3.13 DESIGN CONNECTED
             12.3.14 SPATIAL SYSTEMS
             12.3.15 VNTANA
             12.3.16 CESIUM
             12.3.17 ECHO 3D
             12.3.18 KEYSHOT
             12.3.19 MOOVLY
*Details on Business Overview, Products/Solutions/Services Offered, Recent Developments, MnM view (Key strengths/Right to win, Strategic choices made, Weakness/competitive threats)* might not be captured in case of unlisted companies.
 
13 ADJACENT AND RELATED MARKETS (Page No. - 294)
     13.1 INTRODUCTION 
             13.1.1 RELATED MARKETS
     13.2 3D IMAGING MARKET 
               TABLE 279 3D IMAGING MARKET, BY COMPONENT, 2018–2022 (USD MILLION)
               TABLE 280 3D IMAGING MARKET, BY COMPONENT, 2023–2028 (USD MILLION)
               TABLE 281 3D IMAGING MARKET, BY REGION, 2018–2022 (USD MILLION)
               TABLE 282 3D IMAGING MARKET, BY REGION, 2023–2028 (USD MILLION)
               TABLE 283 3D IMAGING MARKET, BY VERTICAL, 2018–2022 (USD MILLION)
               TABLE 284 3D IMAGING MARKET, BY VERTICAL, 2023–2028 (USD MILLION)
     13.3 AR VR SOFTWARE MARKET 
               TABLE 285 AR VR SOFTWARE MARKET, BY TECHNOLOGY TYPE, 2017–2022 (USD MILLION)
               TABLE 286 AR VR SOFTWARE MARKET, BY TECHNOLOGY TYPE, 2023–2028 (USD MILLION)
               TABLE 287 AR VR SOFTWARE MARKET, BY SOFTWARE TYPE, 2017–2022 (USD MILLION)
               TABLE 288 AR VR SOFTWARE MARKET, BY SOFTWARE TYPE, 2023–2028 (USD MILLION)
               TABLE 289 AR VR SOFTWARE MARKET, BY VERTICAL, 2017–2022 (USD MILLION)
               TABLE 290 AR VR SOFTWARE MARKET, BY VERTICAL, 2023–2028 (USD MILLION)
               TABLE 291 AR VR SOFTWARE MARKET, BY REGION, 2017–2022 (USD MILLION)
               TABLE 292 AR VR SOFTWARE MARKET, BY REGION, 2023–2028 (USD MILLION)
 
14 APPENDIX (Page No. - 301)
     14.1 DISCUSSION GUIDE 
     14.2 KNOWLEDGESTORE: MARKETSANDMARKETS’ SUBSCRIPTION PORTAL 
     14.3 CUSTOMIZATION OPTIONS 
     14.4 RELATED REPORTS 
     14.5 AUTHOR DETAILS 

The study involved four major activities in estimating the 3d digital asset market. We conducted secondary research to gather information on the market, competitors, and parent market. The next stage was to validate these findings and assumptions and size them with industry professionals across the value chain using primary research. Top-down and bottom-up methodologies were used to determine the total market size. We used the market breakup and data triangulation techniques to estimate the market size of the different segments in the 3d digital asset market.

Secondary Research

Several sources were used to locate and collect information for this study during the secondary research process. Secondary sources included company annual reports, press announcements, investor presentations, white papers, journals, certified publications, and articles from well-known writers, directories, and databases. Data was also gathered from other secondary sources, such as journals, government websites, blogs, and vendor websites.

Primary Research

Primary sources included industry experts from the core and associated industries, preferred software suppliers, hardware manufacturers, distributors, service providers, technology developers, alliances, and organizations representing all parts of the industry's value chain. In-depth interviews were conducted with primary respondents, including major industry participants, subject-matter experts, C-level executives of important market companies, and industry consultants, to acquire and verify critical qualitative and quantitative data and analyze the market's potential.

We performed primary interviews to gain insights such as market statistics, the current trends disrupting the industry, new use cases applied, revenue data collected from products and services, market breakdowns, market size projections, market predictions, and data triangulation. Primary research also helped me grasp different technology trends, segmentation types, industry trends, and geographies. Demand-side stakeholders, such as Chief Information Officers (CIOs), Chief Technology Officers (CTOs), and Chief Security Officers (CSOs); installation teams of governments/end users using 3d digital asset solutions and services; and digital initiatives project teams, were interviewed to understand the buyer's perspective on suppliers, products, service providers, and their current use of services, which will affect the overall data center networking market.

3D Digital Asset Market  Size, and Share

To know about the assumptions considered for the study, download the pdf brochure

Market Size Estimation

We estimated and forecasted 3d digital asset and other related submarkets using top-down and bottom-up methodologies. We used a bottom-up approach to calculate the overall market size by analyzing the revenues and offerings of significant market players. This study used data triangulation methods and validation through primary interviews to determine and confirm the precise worth of the whole parent market. We used the overall market size in the top-down process to estimate the size of other particular markets using percentage splits of market segments.

We used top-down and bottom-up approaches to estimate and validate the 3d digital asset market and other dependent subsegments.

The research methodology used to estimate the market size included the following details:

  • We identified key players in the market through secondary research. We then determined their revenue contributions in the respective countries through primary and secondary research.
  • This procedure included studying top market players' annual and financial reports and extensive interviews for key insights from industry leaders, such as Chief Executive Officers (CEOs), VPs, directors, and marketing executives.
  • All percentage splits and breakups were determined using secondary sources and verified through primary sources.

We estimated and forecasted 3d digital asset and other related submarkets using top-down and bottom-up methodologies. We used a bottom-up approach to calculate the overall market size by analyzing the revenues and offerings of significant market players. This study used data triangulation methods and validation through primary interviews to determine and confirm the precise worth of the whole parent market. We used the overall market size in the top-down process to estimate the size of other particular markets using percentage splits of market segments.

3d digital asset market: Top-down and Bottom-up approaches

3D Digital Asset Market Top Down and Bottom Up Approach

To know about the assumptions considered for the study, Request for Free Sample Report

Data Triangulation

After determining the overall market size, the market was divided into segments and subsegments using the previously described market size estimating techniques. Where applicable, data triangulation and market breakup methods were used to complete the whole market engineering process and ascertain the exact numbers for each market segment and subsegment. The data was triangulated by evaluating many elements and trends on the demand and supply sides of the 3d digital asset market.

Market Definition

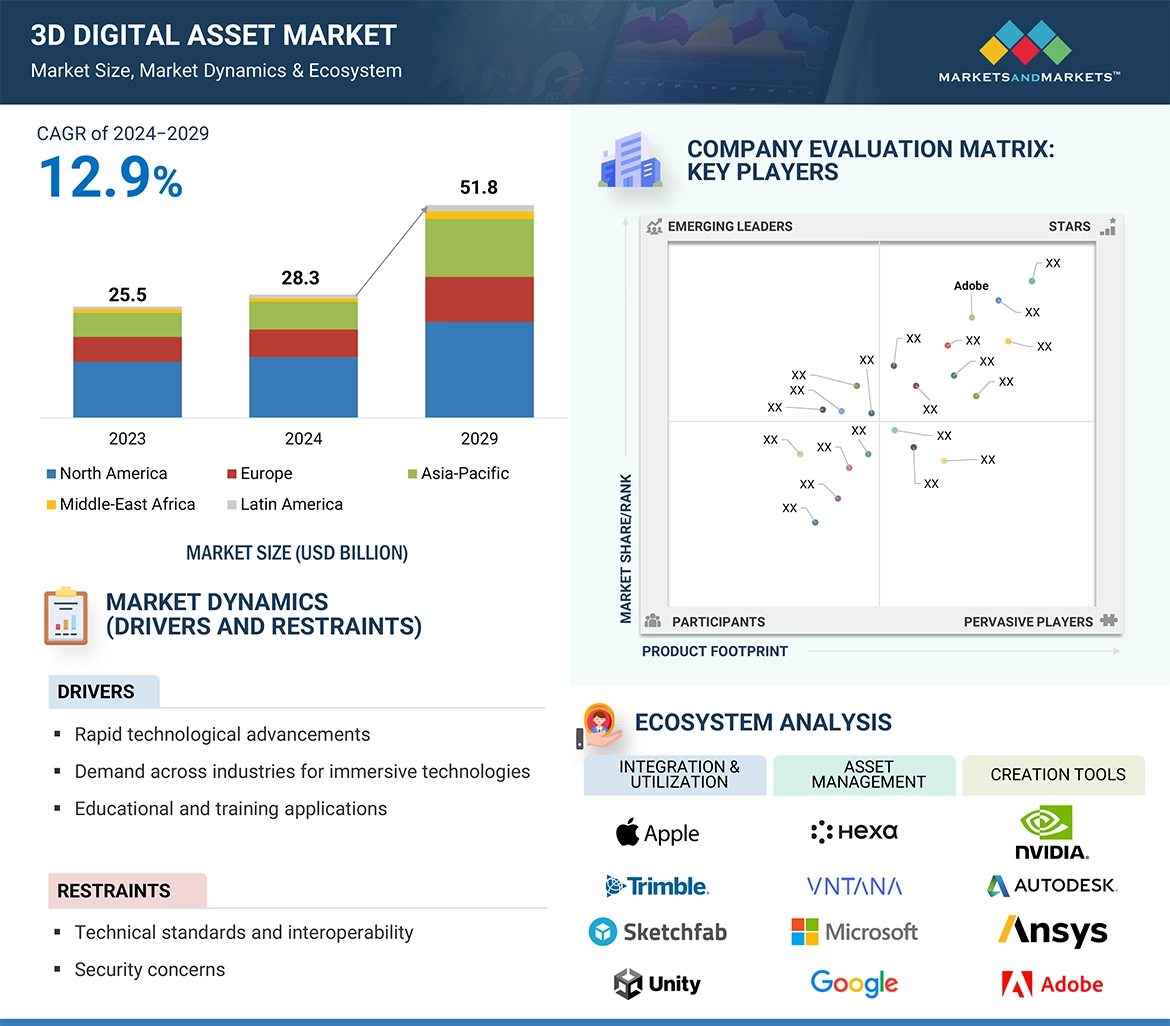
"The creation, distribution, and monetization of three-dimensional digital content used in various industries such as entertainment, gaming, e-commerce, architecture, education, and manufacturing. This market includes 3D models, textures, materials, animations, and environments created using software like Maya and Photoshop and distributed through platforms like Unity Asset Store and Sketchfab. Key applications range from immersive experiences in VR and AR to product visualization in e-commerce and architectural visualizations."

Key Stakeholders

  • 3D Artists and Designers
  • Software Developers
  • Marketplace Platforms
  • Game Developers
  • Film and Animation Studios
  • Virtual and Augmented Reality Companies
  • Architectural and Engineering Firms
  • Education and Training Providers
  • Manufacturers and Product Designers
  • Advertising and Marketing Agencies

Report Objectives

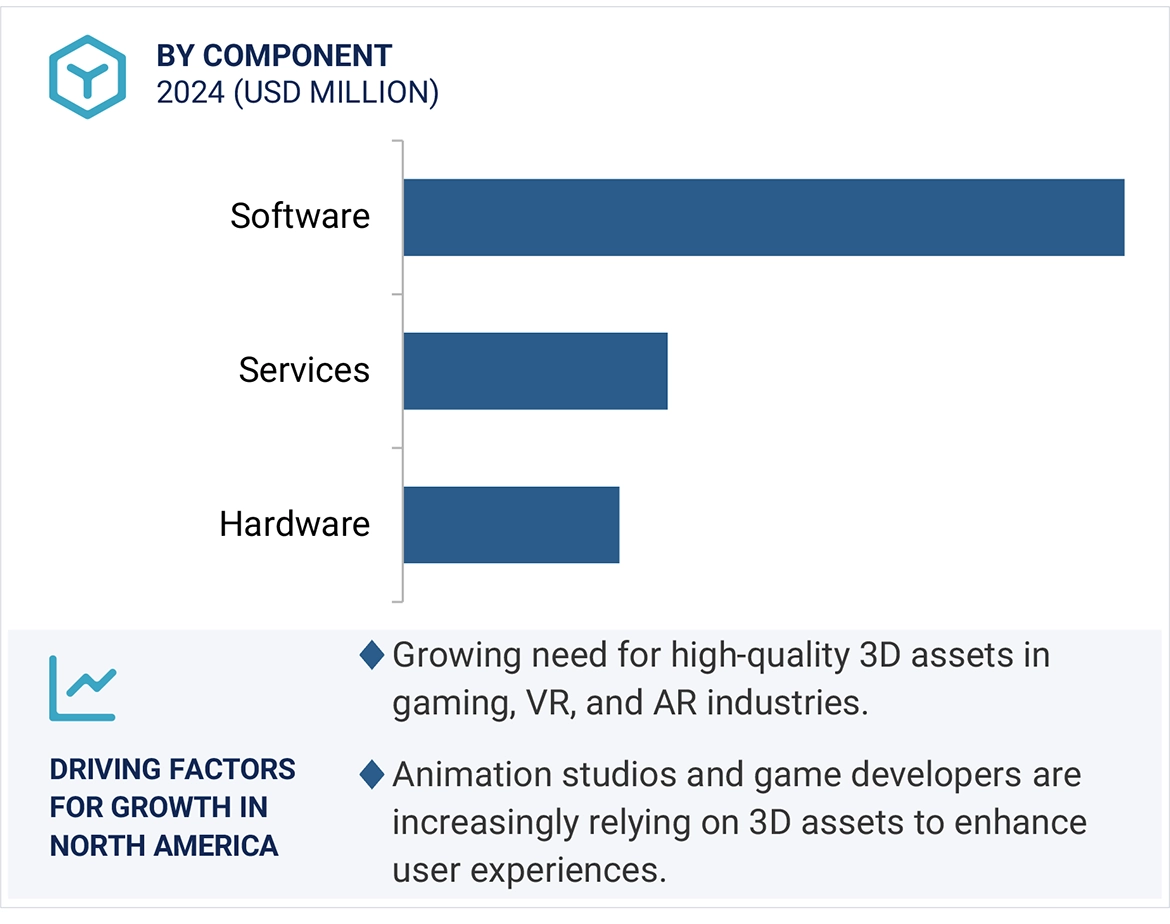
  • To define, describe, and forecast the global 3D Digital Asset market based on component, application, deployment mode, vertical, and region
  • To forecast the market size of the five major regional segments: North America, Europe, Asia Pacific, Middle East & Africa, and Latin America
  • To strategically analyze the market subsegments concerning individual growth trends, prospects, and contributions to the total market
  • To provide detailed information related to the major factors influencing the growth of the market (drivers, restraints, opportunities, and challenges)
  • To strategically analyze macro and micro markets concerning growth trends, prospects, and their contributions to the overall market
  • To analyze industry trends, patents and innovations, and pricing data related to the 3D Digital Asset market
  • To analyze the opportunities in the market for stakeholders and provide details of the competitive landscape for prominent players
  • To profile key players in the market and comprehensively analyze their market share/ranking and core competencies
  • To track and analyze competitive developments, such as mergers & acquisitions, product developments, and partnerships & collaborations in the market

Available Customizations

With the given market data, MarketsandMarkets offers customizations per the company's specific needs. The following customization options are available for the report:

Product Analysis

  • The product matrix provides a detailed comparison of each company's product portfolio.

Geographic Analysis

  • Further breakup of the Asia Pacific market into countries contributing 75% to the regional market size
  • Further breakup of the North American market into countries contributing 75% to the regional market size
  • Further breakup of the Latin American market into countries contributing 75% to the regional market size
  • Further breakup of the Middle Eastern & African market into countries contributing 75% to the regional market size
  • Further breakup of the European market into countries contributing 75% to the regional market size

Company Information

  • Detailed analysis and profiling of additional market players (up to 5)
Custom Market Research Services

We will customize the research for you, in case the report listed above does not meet with your exact requirements. Our custom research will comprehensively cover the business information you require to help you arrive at strategic and profitable business decisions.

Request Customization
Report Code
TC 9062
Published ON
Jul, 2024
Choose License Type
BUY NOW
  • SHARE
X
Request Customization
Speak to Analyst
Speak to Analyst
OR FACE-TO-FACE MEETING
PERSONALIZE THIS RESEARCH
  • Triangulate with your Own Data
  • Get Data as per your Format and Definition
  • Gain a Deeper Dive on a Specific Application, Geography, Customer or Competitor
  • Any level of Personalization
REQUEST A FREE CUSTOMIZATION
LET US HELP YOU!
  • What are the Known and Unknown Adjacencies Impacting the 3D Digital Asset Market
  • What will your New Revenue Sources be?
  • Who will be your Top Customer; what will make them switch?
  • Defend your Market Share or Win Competitors
  • Get a Scorecard for Target Partners
CUSTOMIZED WORKSHOP REQUEST
  • Call Us
  • +1-888-600-6441 (Corporate office hours)
  • +1-888-600-6441 (US/Can toll free)
  • +44-800-368-9399 (UK office hours)
CONNECT WITH US
ABOUT TRUST ONLINE
©2024 MarketsandMarkets Research Private Ltd. All rights reserved
DMCA.com Protection Status Website Feedback