The research process for this study included systematic gathering, recording, and analysis of data about customers and companies operating in the thin-film photovoltaic market. This process involved the extensive use of secondary sources, directories, and databases (Factiva, Oanda, and OneSource) for identifying and collecting valuable information for the comprehensive, technical, market-oriented, and commercial study of the thin-film photovoltaic industry . In-depth interviews were conducted with primary respondents, including experts from core and related industries and preferred manufacturers, to obtain and verify critical qualitative and quantitative information as well as to assess growth prospects. Key players in the thin-film photovoltaic industry were identified through secondary research, and their market rankings were determined through primary and secondary research. This research included studying annual reports of top players and interviewing key industry experts such as CEOs, directors, and marketing executives.
Secondary Research
In the secondary research process, various sources were used to identify and collect information important for this study. These include annual reports, press releases & investor presentations of companies, white papers, technology journals, certified publications, articles by recognized authors, directories, and databases.
Secondary research was mainly used to obtain key information about the industry's supply chain, the total pool of market players, the classification of the market according to industry trends to the bottom-most level, regional markets, and key developments from the market and technology-oriented perspectives.
Primary Research
Primary research was also conducted to identify the segmentation types, key players, competitive landscape, and key market dynamics, such as drivers, restraints, opportunities, challenges, and industry trends, along with key strategies adopted by players operating in the thin-film photovoltaic industry . Extensive qualitative and quantitative analyses were performed on the complete market engineering process to list key information and insights throughout the report.
Extensive primary research has been conducted after acquiring knowledge about the thin-film photovoltaic industry scenarios through secondary research. Several primary interviews have been conducted with experts from both demand (end users) and supply side (thin-film photovoltaic hardware manufacturers/providers) across four major geographic regions: North America, Europe, Asia Pacific, and RoW. Approximately 80% and 20% of the primary interviews were conducted from the supply and demand side, respectively. These primary data have been collected through questionnaires, emails, and telephonic interviews.

To know about the assumptions considered for the study, download the pdf brochure
Market Size Estimation
In the complete market engineering process, both top-down and bottom-up approaches were implemented, along with several data triangulation methods, to estimate and validate the size of the thin-film photovoltaic market and various other dependent submarkets. Key players in the market were identified through secondary research, and their market share in the respective regions was determined through primary and secondary research. This entire research methodology included the study of annual and financial reports of the top players, as well as interviews with experts (such as CEOs, VPs, directors, and marketing executives) for key insights (quantitative and qualitative).
All percentage shares, splits, and breakdowns were determined using secondary sources and verified through primary sources. All the possible parameters that affect the markets covered in this research study were accounted for, viewed in detail, verified through primary research, and analyzed to obtain the final quantitative and qualitative data. This data was consolidated and supplemented with detailed inputs and analysis from MarketsandMarkets and presented in this report.
Thin-film photovoltaic Market: Bottom-Up Approach

Thin-film photovoltaic Market: Top-Down Approach

Data Triangulation
After arriving at the overall market size from the market size estimation process, as explained above, the total market has been split into several segments and subsegments. To complete the overall market engineering process and arrive at the exact statistics for all segments and subsegments, market breakdown and data triangulation procedures have been employed, wherever applicable. The data have been triangulated by studying various factors and trends from both the demand and supply sides. Along with this, the market has been validated using top-down and bottom-up approaches.
Market Definition
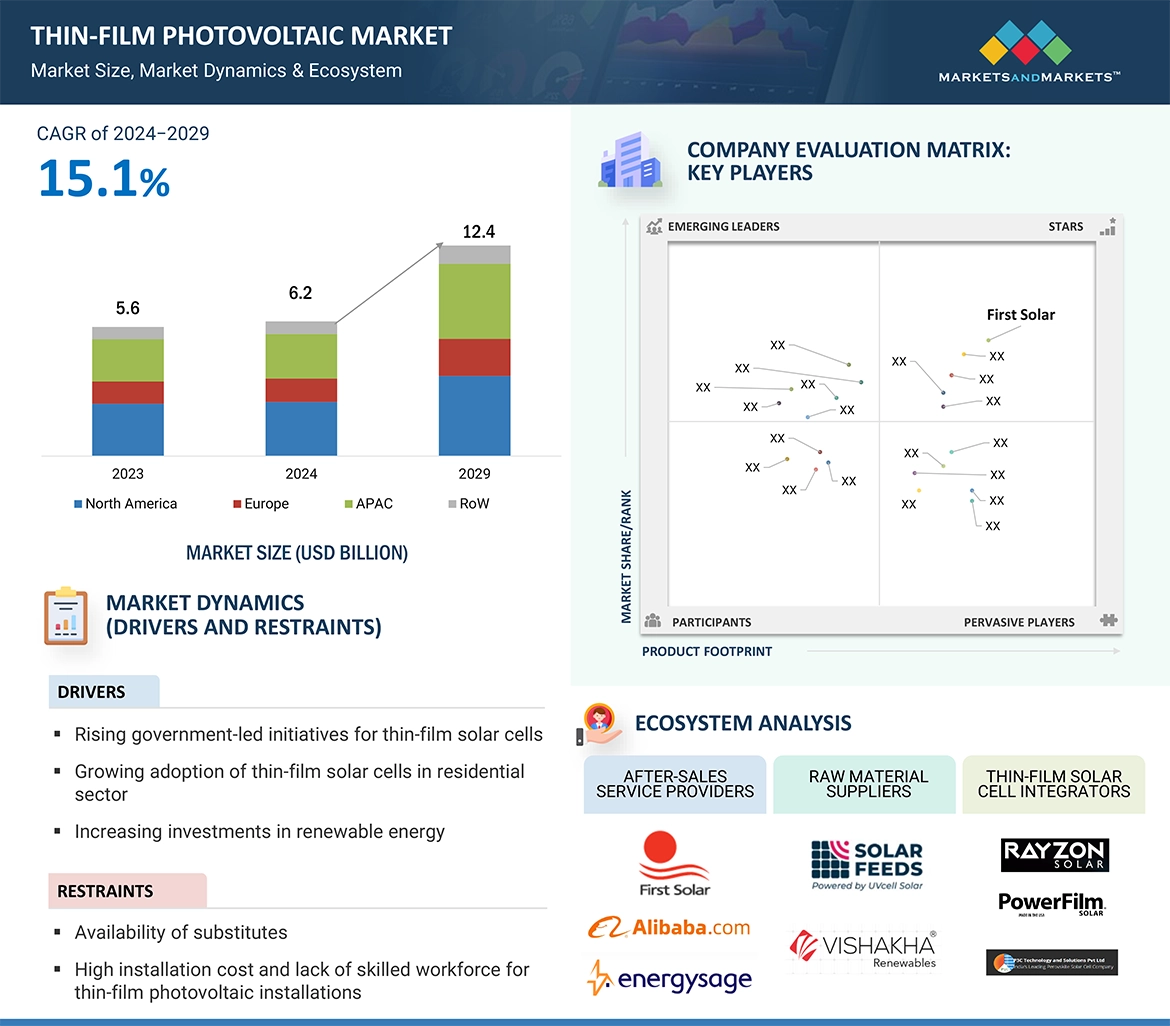
Thin-film photovoltaic (PV) is a term used to describe a form of solar technology that turns sunlight into electricity using thin semiconductor layers. In contrast to conventional crystalline silicon solar cells constructed from solid silicon blocks, thin-film solar cells are developed by depositing thin layers of semiconductor materials in a substrate. Rapid advancements in emerging thin-film technologies, such as the development of perovskite solar cells, have increased their high efficiency and potential.
The thin-film photovoltaic market continues to evolve and expand, driven by ongoing research and development efforts, cost-reduction initiatives, and increasing demand for solar energy solutions. The market is expected to grow as technology advances and economies of scale continue to improve the efficiency and cost-effectiveness of thin-film PV modules.
Key Stakeholders
-
Solar cell manufacturers
-
Solar module manufacturers
-
Energy companies
-
Raw material and manufacturing equipment suppliers
-
Solar market technical consultants
-
Technology standards organizations, forums, alliances, and associations
-
Governments, financial institutions, and investment communities
-
Research organizations
-
Analysts and strategic business planners
-
Venture capitalists, private equity firms, and startups
-
Distributors
Report Objectives
-
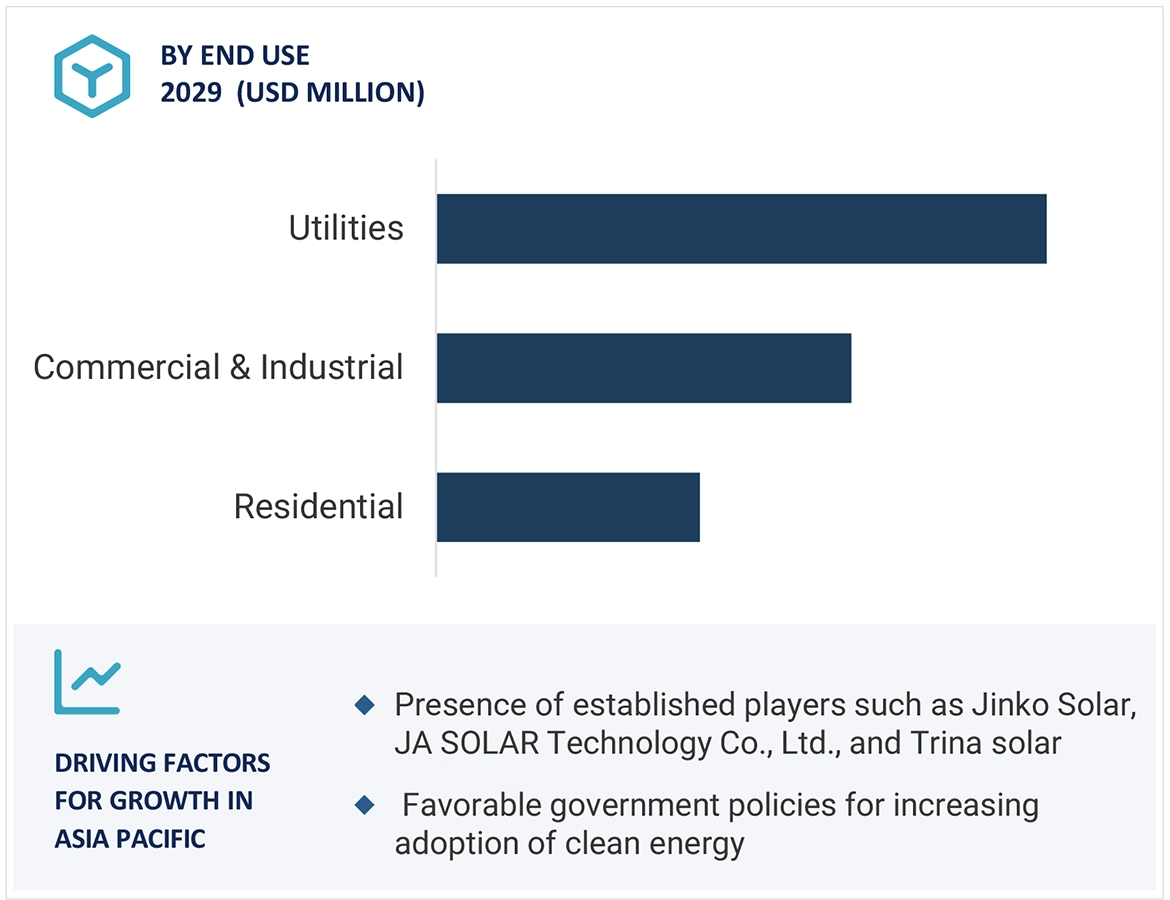
To define, describe, estimate, and forecast the thin-film photovoltaic industry in terms of material, component, end use, type. and region.
-
To describe and forecast the thin-film photovoltaic industry , by region, in terms of value. Regional markets covered are North America, Europe, Asia Pacific, and the Rest of the World (RoW)
-
To provide detailed information regarding the drivers, restraints, opportunities, and challenges influencing market growth
-
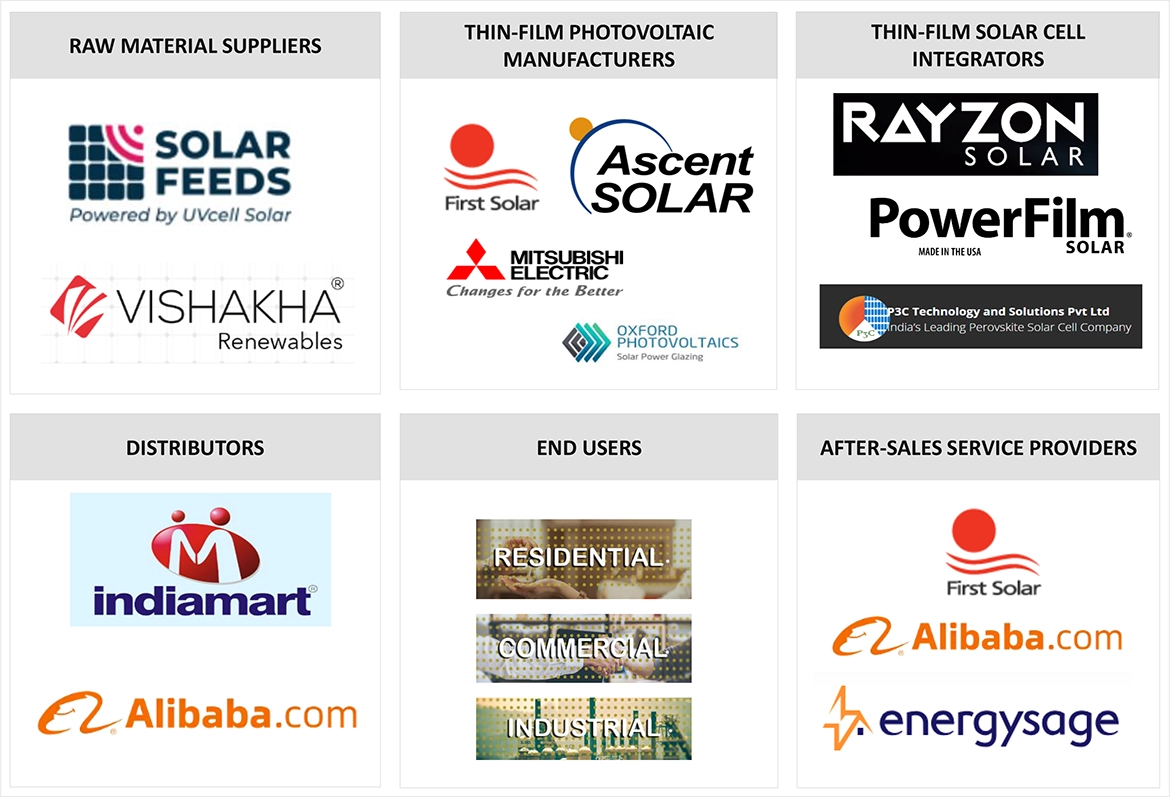
To provide a detailed overview of the thin-film photovoltaic industry value chain
-
To strategically analyze micro markets with respect to individual growth trends, prospects, and contributions to the total market
-
To profile key players and comprehensively analyze their ranking based on their revenues and core competencies along with detailing the competitive landscape.
-
To analyze competitive developments, such as expansions, agreements, partnerships, acquisitions, and product launches in the thin-film photovoltaic industry
-
To analyze market opportunities for various stakeholders by identifying the high-growth segments of the market
-
To benchmark market players using the proprietary company evaluation quadrant, which analyzes them on various parameters.
Available Customizations
With the given market data, MarketsandMarkets offers customizations according to the company’s specific needs. The following customization options are available for the report:
Company Information
-
Detailed analysis and profiling of additional market players (up to 5)


Growth opportunities and latent adjacency in Thin-Film Photovoltaic Market