Therapeutic Drug Monitoring Market by Product (Consumables, Equipment-Immunoassay Analyzers, Chromatography & MS Detectors, Clinical Chemistry Analyzers), Technology, Class of drugs, End user and Region - Global Forecast to 2027
The global therapeutic drug monitoring market in terms of revenue was estimated to be worth $1.8 billion in 2022 and is poised to reach $2.9 billion by 2027, growing at a CAGR of 9.6% from 2022 to 2027. The growth of this market is primarily driven by an amplifying focus on research experimentation associated with therapeutic drug monitoring and an increase in severe diseases. However, the requirement for massive capital investments and the hesitancy of compact hospitals to offer therapeutic drug monitoring services may restrain the growth of this market.
Attractive Opportunities in the Therapeutic Drug Monitoring Market
To know about the assumptions considered for the study, Request for Free Sample Report
Recession Impact on the Therapeutic Drug Monitoring Market
Market growth is anticipated to slow due to concerns about a possible recession. According to an article published in the Wall Street Journal in 2022, the fear of recession has driven a 9% gain for the NYSE Arca Pharmaceutical Index over the past year and a 13.1% decline for the S&P 500. Trends are expected to be like the COVID-19 recession, wherein procedural volumes and routine testing in a particular country or region depended on the spread of COVID-19 and actions taken by regional authorities. For instance, global cardiovascular and neuromodulation procedural volumes dropped during COVID-19, directly affecting the demand for Abbott's medical devices and diagnostic tests.
- The recession has had an impact on the quarterly revenue of companies such as Abbott Laboratories (US) and may have an impact on capital spending.
- The primaries also confirmed the impact of the recession.
- The company's volume analysis for 2020–2021 further aided the recession impact analysis.
Therapeutic Drug Monitoring Market Dynamics
Driver: Importance of therapeutic drug monitoring in organ transplant procedures
Conducting therapeutic drug monitoring for immunosuppressive medications is essential in managing patients undergoing solid-organ transplantation. A person receiving an organ transplant is prescribed immunosuppressants so the body does not reject the organ. When administering immunosuppressants, clinicians need to individualise a patient's drug therapy and ensure an optimal balance between therapeutic efficacy and the probability of adverse effects. Patients present different pharmacodynamics and pharmacokinetics, so achieving this goal with immunosuppressant therapy monitoring can be challenging.
Therapeutic drug monitoring is used before administering immunosuppressants as it minimises the pharmacokinetic component of variability. Improper drug concentrations in immunosuppressants can lead to adverse effects in transplant patients. Supra-therapeutic drug concentrations can put the patient at risk of over-immunosuppression, which may cause infection. On the other hand, sub-therapeutic drug concentrations can cause the recipient's body to reject an allograft. This inter-individual variability in drug concentrations creates the need for therapeutic drug monitoring.
The importance of therapeutic drug monitoring has grown due to the rising number of organ transplant procedures being performed. In 2020, 39,000 transplants will be performed in the US, and 106,771 children, women, and men are on the national transplant waiting list (source: HRSA).
Opportunity: increasing prevalence of autoimmune diseases.
Autoimmune diseases affect approximately 3% of the US population (10 million people) (Johns Hopkins University, 2022). Similarly, around 4% of the world's population is affected by one of more than 80 different autoimmune diseases. The most common autoimmune disorders include type 1 diabetes, multiple sclerosis, rheumatoid arthritis, lupus, Crohn's disease, psoriasis, and scleroderma. It is also estimated by the American Autoimmune Related Diseases Association (AARDA) that as many as 50 million Americans are living with an autoimmune disease, at a cost of USD 86 billion a year. According to the US Department of Health and Human Services (HHS), these diseases represent the fourth-largest cause of disability among women in the US. They are the eighth-leading cause of death for women between the ages of 15 and 64. As a result, the introduction of new therapeutics for treating inflammatory autoimmune diseases has increased rapidly in the last decade. For instance, tacrolimus is a widely used immunosuppressive drug in patients with autoimmune diseases.
Challenge: Alternatives to conventional therapeutic drug monitoring
In therapeutic drug monitoring, many patients require regular blood testing to monitor their health and progress. After specific procedures, such as renal transplants, physicians must monitor the patient's condition frequently through blood analysis to help ensure consistent drug concentrations in the patient's bloodstream. Generally, therapeutic drug monitoring is challenging to maintain in this process without compromising the specimen quality and accuracy or the patient's comfort and convenience, if not both. It becomes significantly more challenging when it requires participation from children, the elderly, or those who live in rural or isolated areas.
To reduce drawbacks, dried blood spot (DBS) sampling for therapeutic drug monitoring can be an alternative to conventional blood sampling, especially in children. As per a research article, switching to DBS for therapeutic drug monitoring offered easy results and improved cost-effectiveness. For instance, for children with renal transplants treated with immunosuppressants, the total societal costs for conventional sampling were USD 287.5 (EUR 259) for one sample. In contrast, home sampling costs were $113.2 (EUR 102) for a sample.
Companies have also adopted the benefits offered by DBS to provide ease in therapeutic drug monitoring compared to the conventional method. For instance, Neoteryx, LLC, provides the Mitra Device, a single-use, non-sterile device that enables easy at-home sampling for therapeutic drug monitoring in paediatric patients.
chemiluminescence immunoassays (CLIAs) in the product's immunoassay therapeutic drug monitoring segment to witness the highest growth as well as the largest share in the therapeutic drug monitoring market during the forecast period.
The market is divided into chemiluminescence immunoassays, colorimetric immunoassays, fluorescence immunoassays, radioimmunoassays, and other immunoassays based on the immunoassay. The chemiluminescence immunoassays segment is projected to grow at the highest CAGR during the forecast period because these assays are commonly used in TDM in either enzyme-amplified or direct chemiluminescence measurements.
In 2021, the US accounted for the largest share of the North American therapeutic drug monitoring market.
Based on the region, the North American Therapeutic Drug Monitoring market is segmented into the US and Canada. In 2021, the US accounted for the largest share of the North American therapeutic drug monitoring market. Growth in this market can be attributed to rising awareness and adoption of precision medicine, the rising number of drug development activities or launches, and the well-established reimbursement framework for clinical diagnostics.
To know about the assumptions considered for the study, download the pdf brochure
Some of the major players operating in this market are Abbott (US), F. Hoffmann-La Roche (Switzerland), Siemens Healthineers AG. (Germany), Thermo Fisher Scientific (US), Danaher Corporation (US), and Bio-Rad Laboratories (US). In 2021, Abbott (US held the leading position in the market. The company has a strong geographic presence across North America, Europe, and Asia Pacific. Thermo Fisher Scientific (US) held the second position in the therapeutic drug monitoring market in 2021.
Therapeutic Drug Monitoring Market Report Scope
Report Metric |
Details |
Market Revenue in 2022 |
$1.8 billion |
Estimated Value by 2027 |
$2.9 billion |
Growth Rate |
Poised to grow at a CAGR of 9.6% |
Forecast Units |
Value (USD) |
Segments Covered |
Product, Technology, Class of drugs, End User and Region |
Geographies Covered |
North America (US, Canada), Europe (Germany, France, UK, Spain, Italy, and RoE), APAC (China, India, Japan, and the RoAPAC), and Rest of the World (Latin America- and Middle East & Africa) |
Companies Covered |
Abbott (US) |
This research report categorizes the Therapeutic Drug Monitoring market into the following segments and subsegments:
Product Split
- Consumables
- Equipment
- Immunoassay Analyzers
- Chromatography & MS Detectors
- Clinical Chemistry Analyzers
Technology Split
- Immunoassays.
- Chemiluminescence Immunoassays
- Colorimetric Immunoassays
- Fluorescence Immunoassays
- Radioimmunoassay
- Other Immunoassays
- Chromatography-MS
- LC-MS
- GC-MS
Class of drug Split
- Antiepileptic Drugs
- Antibiotic Drugs
- Immunosuppressant Drugs
- Antiarrhythmic Drugs
- Bronchodilator Drugs
- Psychoactive Drugs
- Other Drugs
End user Split
- Hospital Laboratories
- Commercial & Private Laboratories
- Other End Users
Recent Developments:
- In May 2012, Theradiag (France) announced the launch of ez-Track1, a point-of-care testing solution for therapeutic drug monitoring.
- In January 2021, Theradiag (France) announced CE marking for four new i-Tracker test kits for biotherapy monitoring.
Frequently Asked Questions (FAQ):
What is the projected market value of the global Therapeutic Drug Monitoring Market?
The global market of Therapeutic Drug Monitoring is projected to reach USD 2.9 billion by 2027.
What is the estimated growth rate (CAGR) of the global Therapeutic Drug Monitoring Market for the next five years?
The global Therapeutic Drug Monitoring market is projected to grow at a Compound Annual Growth Rate (CAGR) of 9.6% from 2022 to 2027.
Who are the major players offering Therapeutic Drug Monitoring in the market?
Abbott (US), Thermo Fisher Scientific (US), F. Hoffmann-La Roche Ltd. (Switzerland), Siemens Healthineers AG (Germany), Danaher Corporation (US), Bio-Rad Laboratories (US), bioMérieux SA (France), Theradiag SA (France), Grifols S.A. (Spain), Exagen Inc. (US), R-Biopharm AG (Germany)
Who are the significant end users in Therapeutic Drug Monitoring Market?
Hospital laboratories, commercial & private laboratories, are the major end users in Therapeutic Drug Monitoring Market.
Which Immunoassay will have the highest shares in Therapeutic Drug Monitoring Market during the forecast period?
Chemiluminescence Immunoassays will have the highest shares of the Therapeutic Drug Monitoring market during the forecast period. .
To speak to our analyst for a discussion on the above findings, click Speak to Analyst
Exclusive indicates content/data unique to MarketsandMarkets and not available with any competitors.
- 5.1 INTRODUCTION
-
5.2 MARKET DYNAMICSDRIVERS- Importance of TDM in organ transplant procedures- Use of TDM across various therapeutic fields- Increasing preference for precision medicine- Growing focus on R&D related to TDM- Increasing incidence of chronic and infectious diseases and growing awareness about early disease diagnosisRESTRAINTS- High capital investments- Reluctance of small hospitals to offer TDM servicesOPPORTUNITIES- Increasing prevalence of autoimmune diseases- Significant opportunities in BRICS countriesCHALLENGES- Alternatives to conventional TDM- Operational barriers faced in conducting TDM tests- Lack of infrastructure and low awareness in low/ middle-income countries
- 5.3 TECHNOLOGY ANALYSIS
- 5.4 VALUE CHAIN ANALYSIS
- 5.5 SUPPLY CHAIN ANALYSIS
-
5.6 PORTER’S FIVE FORCES ANALYSISTHREAT OF NEW ENTRANTSINTENSITY OF COMPETITIVE RIVALRYBARGAINING POWER OF BUYERSBARGAINING POWER OF SUPPLIERSTHREAT OF SUBSTITUTES
-
5.7 KEY STAKEHOLDERS AND BUYING CRITERIAKEY STAKEHOLDERS IN BUYING PROCESSBUYING CRITERIA
- 5.8 REGULATORY LANDSCAPE
- 5.9 KEY CONFERENCES AND EVENTS IN 2022 AND 2023
- 5.10 PATENT ANALYSIS
- 5.11 PRICING ANALYSIS
- 5.12 TRADE ANALYSIS
- 5.13 ECOSYSTEM ANALYSIS
- 5.14 TRENDS/DISRUPTIONS IMPACTING CUSTOMER BUSINESSES
- 6.1 INTRODUCTION
-
6.2 CONSUMABLESREPEAT PURCHASES AND HIGH USAGE OF CONSUMABLES TO DRIVE MARKET
-
6.3 EQUIPMENTIMMUNOASSAY ANALYZERS- High efficiency of immunoassay analyzers to ensure end-user demandCHROMATOGRAPHY & MS DETECTORS- Technological advancements to propel growthCLINICAL CHEMISTRY ANALYZERS- Automation to raise preference for clinical chemistry analyzers
- 7.1 INTRODUCTION
-
7.2 IMMUNOASSAYSCHEMILUMINESCENCE IMMUNOASSAYS- Rapid detection time and good specificity to support growthFLUORESCENCE IMMUNOASSAYS- High operability and better sensitivity of FIAs to drive market growthCOLORIMETRIC IMMUNOASSAYS- Demand for colorimetric immunoassays to decline due to rising preference for advanced equipmentRADIOIMMUNOASSAYS- High sensitivity in drug detection applications to support market growthOTHER IMMUNOASSAYS
-
7.3 CHROMATOGRAPHY-MSLIQUID CHROMATOGRAPHY-MASS SPECTROMETRY- High accuracy to drive demand for LC-MSGAS CHROMATOGRAPHY-MASS SPECTROMETRY- Drawbacks of GC-MS to challenge market growth
- 8.1 INTRODUCTION
-
8.2 ANTIEPILEPTIC DRUGSHIGH COMPLEXITY AND HETEROGENEITY OF EPILEPSY TO DRIVE GROWTH
-
8.3 ANTIARRHYTHMIC DRUGSINCREASING INCIDENCE OF HEART DISORDERS TO BOOST DEMAND
-
8.4 IMMUNOSUPPRESSANT DRUGSRISING IMMUNOSUPPRESSANT DEMAND DRIVEN BY INCREASE IN ORGAN TRANSPLANTATION PROCEDURES
-
8.5 ANTIBIOTIC DRUGSTECHNOLOGICAL ADVANCEMENTS TO PROPEL DEMAND FOR ANTIBIOTIC DRUG MONITORING
-
8.6 BRONCHODILATOR DRUGSRISING PREVALENCE OF RESPIRATORY DISEASES TO ENSURE DEMAND FOR BRONCHODILATOR DRUG MONITORING
-
8.7 PSYCHOACTIVE DRUGSSURGING CASES OF MENTAL ILLNESS TO AUGMENT MARKET GROWTH
- 8.8 OTHER DRUGS
- 9.1 INTRODUCTION
-
9.2 HOSPITAL LABORATORIESHOSPITAL LABS TO DOMINATE END-USER MARKET
-
9.3 COMMERCIAL & PRIVATE LABORATORIESEXTENSIVE TEST MENUS OF COMMERCIAL & PRIVATE LABS TO SUSTAIN DEMAND FOR SERVICES
- 9.4 OTHER END USERS
- 10.1 INTRODUCTION
-
10.2 NORTH AMERICANORTH AMERICA: RECESSION IMPACTUS- Awareness regarding precision medicine to propel marketCANADA- Availability of funding for research to offer growth opportunities
-
10.3 EUROPEEUROPE: RECESSION IMPACTGERMANY- Prevalence of chronic medical conditions such as cancer and diabetes to support market growthITALY- Rising incidence of cancer to drive demand for TDMFRANCE- Rising awareness of benefits of TDM to accelerate demandSPAIN- Adoption of technologically advanced immunoassays to boost marketUK- Increasing cases of chronic diseases to support marketREST OF EUROPE
-
10.4 ASIA PACIFICASIA PACIFIC: RECESSION IMPACTJAPAN- Japan to dominate APAC marketCHINA- Rising number of organ transplants to boost marketINDIA- Rising incidence of cancer to propel marketROAPAC
-
10.5 REST OF THE WORLDROW: RECESSION IMPACT
- 11.1 OVERVIEW
- 11.2 STRATEGIES ADOPTED BY KEY PLAYERS
- 11.3 REVENUE SHARE ANALYSIS
- 11.4 MARKET SHARE ANALYSIS
-
11.5 COMPANY EVALUATION QUADRANTSTARSEMERGING LEADERSPERVASIVE PLAYERSPARTICIPANTS
-
11.6 COMPANY EVALUATION QUADRANT FOR SMES/START-UPSPROGRESSIVE COMPANIESSTARTING BLOCKSRESPONSIVE COMPANIESDYNAMIC COMPANIES
- 11.7 COMPANY FOOTPRINT ANALYSIS
- 11.8 THERAPEUTIC DRUG MONITORING MARKET: DETAILED LIST OF KEY START-UPS/SMES
-
11.9 COMPETITIVE SCENARIOPRODUCT LAUNCHES & APPROVALSDEALSOTHER DEVELOPMENTS
-
12.1 KEY PLAYERSABBOTT- Business overview- Products offered- MnM viewTHERMO FISHER SCIENTIFIC- Business overview- Products offered- Recent developments- MnM viewF. HOFFMANN-LA ROCHE- Business overview- Products offered- Recent developments- MnM viewSIEMENS HEALTHINEERS AG- Business overview- Products offered- MnM viewDANAHER CORPORATION- Business overview- Products offered- MnM viewBIO-RAD LABORATORIES- Business overview- Products offered- Recent developmentsBIOMÉRIEUX SA- Business overview- Products offeredTHERADIAG- Business overview- Products offered- Recent developmentsGRIFOLS S.A.- Business overview- Products offered- Recent developmentsEXAGEN INC.- Business overview- Products offeredARK DIAGNOSTICS, INC.- Business overview- Products offeredR-BIOPHARM AG- Business overview- Products offered- Recent developments
-
12.2 OTHER PLAYERSAPDIA GROUPBIOTEZ BERLIN BUCH GMBHEAGLE BIOSCIENCES, INC.JASEM LABORATORY SYSTEMS AND SOLUTIONSAALTO SCIENTIFIC, LTD.IMMUNDIAGNOSTIK AGUTAKSEKISUI MEDICAL CO., LTD.DIASYSTEM SCANDINAVIA ABCAMBRIDGE LIFE SCIENCES LIMITEDCHROMSYSTEMS INSTRUMENTS & CHEMICALS GMBHBÜHLMANN LABORATORIES AGSJK GLOBAL, LLC.EPITOPE DIAGNOSTICS, INC.
- 13.1 INSIGHTS FROM INDUSTRY EXPERTS
- 13.2 DISCUSSION GUIDE
- 13.3 KNOWLEDGESTORE: MARKETSANDMARKETS’ SUBSCRIPTION PORTAL
- 13.4 CUSTOMIZATION OPTIONS
- 13.5 RELATED REPORTS
- 13.6 AUTHOR DETAILS
- TABLE 1 KEY DATA FROM PRIMARY SOURCES
- TABLE 2 CLASSES OF DRUGS THAT REQUIRE MONITORING
- TABLE 3 GLOBAL INCIDENCE OF INFECTIOUS DISEASES
- TABLE 4 INFLUENCE OF STAKEHOLDERS ON BUYING PROCESS FOR TOP THREE END USERS (%)
- TABLE 5 KEY BUYING CRITERIA FOR TOP THREE END USERS
- TABLE 6 REGULATORY AUTHORITIES GOVERNING TDM MARKET
- TABLE 7 LIST OF CONFERENCES AND EVENTS, 2022–2023
- TABLE 8 AVERAGE SELLING PRICE OF PRODUCTS OFFERED BY KEY PLAYERS (2022)
- TABLE 9 PRICE RANGE FOR THERAPEUTIC DRUG MONITORING PRODUCTS
- TABLE 10 IMPORT DATA FOR INSTRUMENTS AND APPLIANCES USED IN PHYSICAL AND CHEMICAL ANALYSIS, BY COUNTRY, 2016–2021 (USD MILLION)
- TABLE 11 EXPORT DATA FOR INSTRUMENTS AND APPLIANCES USED IN PHYSICAL AND CHEMICAL ANALYSIS, BY COUNTRY, 2016–2021 (USD MILLION)
- TABLE 12 ROLE IN ECOSYSTEM
- TABLE 13 THERAPEUTIC DRUG MONITORING MARKET, BY PRODUCT, 2020–2027 (USD MILLION)
- TABLE 14 THERAPEUTIC DRUG MONITORING CONSUMABLES MARKET, BY REGION, 2020–2027 (USD MILLION)
- TABLE 15 DRUGS MONITORED USING ANALYTICAL EQUIPMENT
- TABLE 16 THERAPEUTIC DRUG MONITORING EQUIPMENT MARKET, BY TYPE, 2020–2027 (USD MILLION)
- TABLE 17 THERAPEUTIC DRUG MONITORING EQUIPMENT MARKET, BY REGION, 2020–2027 (USD MILLION)
- TABLE 18 THERAPEUTIC DRUG MONITORING MARKET FOR IMMUNOASSAY ANALYZERS, BY REGION, 2020–2027 (USD MILLION)
- TABLE 19 CHROMATOGRAPHY & MS DETECTORS: PRODUCT LAUNCHES, BY COMPANY(2020 TO 2021)
- TABLE 20 THERAPEUTIC DRUG MONITORING MARKET FOR CHROMATOGRAPHY & MS DETECTORS, BY REGION, 2020–2027 (USD MILLION)
- TABLE 21 THERAPEUTIC DRUG MONITORING MARKET FOR CLINICAL CHEMISTRY ANALYZERS, BY REGION, 2020–2027 (USD MILLION)
- TABLE 22 THERAPEUTIC DRUG MONITORING MARKET, BY TECHNOLOGY, 2020–2027 (USD MILLION)
- TABLE 23 THERAPEUTIC DRUG MONITORING IMMUNOASSAYS MARKET, BY TYPE, 2020–2027 (USD MILLION)
- TABLE 24 THERAPEUTIC DRUG MONITORING IMMUNOASSAYS MARKET, BY REGION, 2020–2027 (USD MILLION)
- TABLE 25 CLIA SYSTEMS OFFERED, BY COMPANY
- TABLE 26 LIST OF COMPOUNDS ANALYZED BY CHEMILUMINESCENCE IMMUNOASSAYS
- TABLE 27 CHEMILUMINESCENCE IMMUNOASSAYS MARKET, BY REGION, 2020–2027 (USD MILLION)
- TABLE 28 LIST OF COMPOUNDS ANALYZED BY FLUORESCENCE POLARIZATION IMMUNOASSAYS
- TABLE 29 FLUORESCENCE IMMUNOASSAYS MARKET, BY REGION, 2020–2027 (USD MILLION)
- TABLE 30 COLORIMETRIC IMMUNOASSAYS MARKET, BY REGION, 2020–2027 (USD MILLION)
- TABLE 31 LIST OF COMPOUNDS ANALYZED BY RADIOIMMUNOASSAYS
- TABLE 32 RADIOIMMUNOASSAYS MARKET, BY REGION, 2020–2027 (USD MILLION)
- TABLE 33 OTHER IMMUNOASSAYS MARKET, BY REGION, 2020–2027 (USD MILLION)
- TABLE 34 THERAPEUTIC DRUG MONITORING MARKET FOR CHROMATOGRAPHY-MS, BY TYPE, 2020–2027 (USD MILLION)
- TABLE 35 LIQUID CHROMATOGRAPHY-MASS SPECTROMETRY MARKET, BY REGION, 2020–2027 (USD MILLION)
- TABLE 36 GAS CHROMATOGRAPHY-MASS SPECTROMETRY MARKET, BY REGION, 2020–2027 (USD MILLION)
- TABLE 37 THERAPEUTIC DRUG MONITORING MARKET, BY DRUG CLASS, 2020–2027 (USD MILLION)
- TABLE 38 TDM: LIMITATIONS FACED IN NEW ANTIEPILEPTIC DRUGS
- TABLE 39 ANTIEPILEPTIC DRUG MONITORING MARKET, BY REGION, 2020–2027 (USD MILLION)
- TABLE 40 ANTIARRHYTHMIC DRUG MONITORING MARKET, BY REGION, 2020–2027 (USD MILLION)
- TABLE 41 IMMUNOSUPPRESSANT DRUG MONITORING MARKET, BY REGION, 2020–2027 (USD MILLION)
- TABLE 42 COMPARISON OF DIFFERENT TECHNOLOGIES FOR DETERMINING ANTIMICROBIALS LEVELS IN BIOFLUIDS
- TABLE 43 ANTIBIOTIC DRUG MONITORING MARKET, BY REGION, 2020–2027 (USD MILLION)
- TABLE 44 BRONCHODILATOR DRUG MONITORING MARKET, BY REGION, 2020–2027 (USD MILLION)
- TABLE 45 PSYCHOACTIVE DRUG MONITORING MARKET, BY REGION, 2020–2027 (USD MILLION)
- TABLE 46 OTHER DRUG MONITORING MARKET, BY REGION, 2020–2027 (USD MILLION)
- TABLE 47 THERAPEUTIC DRUG MONITORING MARKET, BY END USER, 2020–2027 (USD MILLION)
- TABLE 48 THERAPEUTIC DRUG MONITORING MARKET FOR HOSPITAL LABORATORIES, BY REGION, 2020–2027 (USD MILLION)
- TABLE 49 THERAPEUTIC DRUG MONITORING MARKET FOR COMMERCIAL & PRIVATE LABORATORIES, BY REGION, 2020–2027 (USD MILLION)
- TABLE 50 THERAPEUTIC DRUG MONITORING MARKET FOR OTHER END USERS, BY REGION, 2020–2027 (USD MILLION)
- TABLE 51 THERAPEUTIC DRUG MONITORING MARKET, BY REGION, 2020–2027 (USD MILLION)
- TABLE 52 NORTH AMERICA: THERAPEUTIC DRUG MONITORING MARKET, BY COUNTRY, 2020–2027 (USD MILLION)
- TABLE 53 NORTH AMERICA: THERAPEUTIC DRUG MONITORING MARKET, BY PRODUCT, 2020–2027 (USD MILLION)
- TABLE 54 NORTH AMERICA: THERAPEUTIC DRUG MONITORING EQUIPMENT MARKET, BY TYPE, 2020–2027 (USD MILLION)
- TABLE 55 NORTH AMERICA: THERAPEUTIC DRUG MONITORING MARKET, BY TECHNOLOGY, 2020–2027 (USD MILLION)
- TABLE 56 NORTH AMERICA: THERAPEUTIC DRUG MONITORING IMMUNOASSAYS MARKET, BY TYPE, 2020–2027 (USD MILLION)
- TABLE 57 NORTH AMERICA: THERAPEUTIC DRUG MONITORING MARKET FOR CHROMATOGRAPHY-MS, BY TYPE, 2020–2027 (USD MILLION)
- TABLE 58 NORTH AMERICA: THERAPEUTIC DRUG MONITORING MARKET, BY DRUG CLASS, 2020–2027 (USD MILLION)
- TABLE 59 NORTH AMERICA: THERAPEUTIC DRUG MONITORING MARKET, BY END USER, 2020–2027 (USD MILLION)
- TABLE 60 NUMBER OF TESTS COVERED BY MEDICARE FOR EACH DRUG CLASS
- TABLE 61 US: THERAPEUTIC DRUG MONITORING MARKET, BY PRODUCT, 2020–2027 (USD MILLION)
- TABLE 62 US: THERAPEUTIC DRUG MONITORING MARKET, BY TECHNOLOGY, 2020–2027 (USD MILLION)
- TABLE 63 US: THERAPEUTIC DRUG MONITORING IMMUNOASSAYS MARKET, BY TYPE, 2020–2027 (USD MILLION)
- TABLE 64 US: THERAPEUTIC DRUG MONITORING MARKET FOR CHROMATOGRAPHY-MS, BY TYPE, 2020–2027 (USD MILLION)
- TABLE 65 US: THERAPEUTIC DRUG MONITORING MARKET, BY DRUG CLASS, 2020–2027 (USD MILLION)
- TABLE 66 US: THERAPEUTIC DRUG MONITORING MARKET, BY END USER, 2020–2027 (USD MILLION)
- TABLE 67 CANADA: THERAPEUTIC DRUG MONITORING MARKET, BY PRODUCT, 2020–2027 (USD MILLION)
- TABLE 68 CANADA: THERAPEUTIC DRUG MONITORING MARKET, BY TECHNOLOGY, 2020–2027 (USD MILLION)
- TABLE 69 CANADA: THERAPEUTIC DRUG MONITORING IMMUNOASSAYS MARKET, BY TYPE, 2020–2027 (USD MILLION)
- TABLE 70 CANADA: THERAPEUTIC DRUG MONITORING MARKET FOR CHROMATOGRAPHY-MS, BY TYPE, 2020–2027 (USD MILLION)
- TABLE 71 CANADA: THERAPEUTIC DRUG MONITORING MARKET, BY DRUG CLASS, 2020–2027 (USD MILLION)
- TABLE 72 CANADA: THERAPEUTIC DRUG MONITORING MARKET, BY END USER, 2020–2027 (USD MILLION)
- TABLE 73 EUROPE: THERAPEUTIC DRUG MONITORING MARKET, BY COUNTRY, 2020–2027 (USD MILLION)
- TABLE 74 EUROPE: THERAPEUTIC DRUG MONITORING MARKET, BY PRODUCT, 2020–2027 (USD MILLION)
- TABLE 75 EUROPE: THERAPEUTIC DRUG MONITORING EQUIPMENT MARKET, BY TYPE, 2020–2027 (USD MILLION)
- TABLE 76 EUROPE: THERAPEUTIC DRUG MONITORING MARKET, BY TECHNOLOGY, 2020–2027 (USD MILLION)
- TABLE 77 EUROPE: THERAPEUTIC DRUG MONITORING IMMUNOASSAYS MARKET, BY TYPE, 2020–2027 (USD MILLION)
- TABLE 78 EUROPE: THERAPEUTIC DRUG MONITORING MARKET FOR CHROMATOGRAPHY-MS, BY TYPE, 2020–2027 (USD MILLION)
- TABLE 79 EUROPE: THERAPEUTIC DRUG MONITORING MARKET, BY DRUG CLASS, 2020–2027 (USD MILLION)
- TABLE 80 EUROPE: THERAPEUTIC DRUG MONITORING MARKET, BY END USER, 2020–2027 (USD MILLION)
- TABLE 81 GERMANY: THERAPEUTIC DRUG MONITORING MARKET, BY PRODUCT, 2020–2027 (USD MILLION)
- TABLE 82 GERMANY: THERAPEUTIC DRUG MONITORING MARKET, BY TECHNOLOGY, 2020–2027 (USD MILLION)
- TABLE 83 GERMANY: THERAPEUTIC DRUG MONITORING IMMUNOASSAYS MARKET, BY TYPE, 2020–2027 (USD MILLION)
- TABLE 84 GERMANY: THERAPEUTIC DRUG MONITORING MARKET FOR CHROMATOGRAPHY-MS, BY TYPE, 2020–2027 (USD MILLION)
- TABLE 85 GERMANY: THERAPEUTIC DRUG MONITORING MARKET, BY DRUG CLASS, 2020–2027 (USD MILLION)
- TABLE 86 GERMANY: THERAPEUTIC DRUG MONITORING MARKET, BY END USER, 2020–2027 (USD MILLION)
- TABLE 87 ITALY: CANCER INCIDENCE, BY TYPE, 2020 VS. 2025
- TABLE 88 ITALY: THERAPEUTIC DRUG MONITORING MARKET, BY PRODUCT, 2020–2027 (USD MILLION)
- TABLE 89 ITALY: THERAPEUTIC DRUG MONITORING MARKET, BY TECHNOLOGY, 2020–2027 (USD MILLION)
- TABLE 90 ITALY: THERAPEUTIC DRUG MONITORING IMMUNOASSAYS MARKET, BY TYPE, 2020–2027 (USD MILLION)
- TABLE 91 ITALY: THERAPEUTIC DRUG MONITORING MARKET FOR CHROMATOGRAPHY-MS, BY TYPE, 2020–2027 (USD MILLION)
- TABLE 92 ITALY: THERAPEUTIC DRUG MONITORING MARKET, BY DRUG CLASS, 2020–2027 (USD MILLION)
- TABLE 93 ITALY: THERAPEUTIC DRUG MONITORING MARKET, BY END USER, 2020–2027 (USD MILLION)
- TABLE 94 FRANCE: THERAPEUTIC DRUG MONITORING MARKET, BY PRODUCT, 2020–2027 (USD MILLION)
- TABLE 95 FRANCE: THERAPEUTIC DRUG MONITORING MARKET, BY TECHNOLOGY, 2020–2027 (USD MILLION)
- TABLE 96 FRANCE: THERAPEUTIC DRUG MONITORING IMMUNOASSAYS MARKET, BY TYPE, 2020–2027 (USD MILLION)
- TABLE 97 FRANCE: THERAPEUTIC DRUG MONITORING MARKET FOR CHROMATOGRAPHY-MS, BY TYPE, 2020–2027 (USD MILLION)
- TABLE 98 FRANCE: THERAPEUTIC DRUG MONITORING MARKET, BY DRUG CLASS, 2020–2027 (USD MILLION)
- TABLE 99 FRANCE: THERAPEUTIC DRUG MONITORING MARKET, BY END USER, 2020–2027 (USD MILLION)
- TABLE 100 SPAIN: CANCER INCIDENCE, BY TYPE, 2020 VS. 2025
- TABLE 101 SPAIN: THERAPEUTIC DRUG MONITORING MARKET, BY PRODUCT, 2020–2027 (USD MILLION)
- TABLE 102 SPAIN: THERAPEUTIC DRUG MONITORING MARKET, BY TECHNOLOGY, 2020–2027 (USD MILLION)
- TABLE 103 SPAIN: THERAPEUTIC DRUG MONITORING IMMUNOASSAYS MARKET, BY TYPE, 2020–2027 (USD MILLION)
- TABLE 104 SPAIN: THERAPEUTIC DRUG MONITORING MARKET FOR CHROMATOGRAPHY-MS, BY TYPE, 2020–2027 (USD MILLION)
- TABLE 105 SPAIN: THERAPEUTIC DRUG MONITORING MARKET, BY DRUG CLASS, 2020–2027 (USD MILLION)
- TABLE 106 SPAIN: THERAPEUTIC DRUG MONITORING MARKET, BY END USER, 2020–2027 (USD MILLION)
- TABLE 107 UK: THERAPEUTIC DRUG MONITORING MARKET, BY PRODUCT, 2020–2027 (USD MILLION)
- TABLE 108 UK: THERAPEUTIC DRUG MONITORING MARKET, BY TECHNOLOGY, 2020–2027 (USD MILLION)
- TABLE 109 UK: THERAPEUTIC DRUG MONITORING IMMUNOASSAYS MARKET, BY TYPE, 2020–2027 (USD MILLION)
- TABLE 110 UK: THERAPEUTIC DRUG MONITORING MARKET FOR CHROMATOGRAPHY-MS, BY TYPE, 2020–2027 (USD MILLION)
- TABLE 111 UK: THERAPEUTIC DRUG MONITORING MARKET, BY DRUG CLASS, 2020–2027 (USD MILLION)
- TABLE 112 UK: THERAPEUTIC DRUG MONITORING MARKET, BY END USER, 2020–2027 (USD MILLION)
- TABLE 113 ROE: THERAPEUTIC DRUG MONITORING MARKET, BY PRODUCT, 2020–2027 (USD MILLION)
- TABLE 114 ROE: THERAPEUTIC DRUG MONITORING MARKET, BY TECHNOLOGY, 2020–2027 (USD MILLION)
- TABLE 115 ROE: THERAPEUTIC DRUG MONITORING IMMUNOASSAYS MARKET, BY TYPE, 2020–2027 (USD MILLION)
- TABLE 116 ROE: THERAPEUTIC DRUG MONITORING MARKET FOR CHROMATOGRAPHY-MS, BY TYPE, 2020–2027 (USD MILLION)
- TABLE 117 ROE: THERAPEUTIC DRUG MONITORING MARKET, BY DRUG CLASS, 2020–2027 (USD MILLION)
- TABLE 118 ROE: THERAPEUTIC DRUG MONITORING MARKET, BY END USER, 2020–2027 (USD MILLION)
- TABLE 119 ASIA PACIFIC: THERAPEUTIC DRUG MONITORING MARKET, BY COUNTRY, 2020–2027 (USD MILLION)
- TABLE 120 ASIA PACIFIC: THERAPEUTIC DRUG MONITORING MARKET, BY PRODUCT, 2020–2027 (USD MILLION)
- TABLE 121 ASIA PACIFIC: THERAPEUTIC DRUG MONITORING EQUIPMENT MARKET, BY TYPE, 2020–2027 (USD MILLION)
- TABLE 122 ASIA PACIFIC: THERAPEUTIC DRUG MONITORING MARKET, BY TECHNOLOGY, 2020–2027 (USD MILLION)
- TABLE 123 ASIA PACIFIC: THERAPEUTIC DRUG MONITORING IMMUNOASSAYS MARKET, BY TYPE, 2020–2027 (USD MILLION)
- TABLE 124 ASIA PACIFIC: THERAPEUTIC DRUG MONITORING MARKET FOR CHROMATOGRAPHY- MS, BY TYPE, 2020–2027 (USD MILLION)
- TABLE 125 ASIA PACIFIC: THERAPEUTIC DRUG MONITORING MARKET, BY DRUG CLASS, 2020–2027 (USD MILLION)
- TABLE 126 ASIA PACIFIC: THERAPEUTIC DRUG MONITORING MARKET, BY END USER, 2020–2027 (USD MILLION)
- TABLE 127 JAPAN: CANCER INCIDENCE, BY TYPE, 2020 VS. 2025
- TABLE 128 JAPAN: THERAPEUTIC DRUG MONITORING MARKET, BY PRODUCT, 2020–2027 (USD MILLION)
- TABLE 129 JAPAN: THERAPEUTIC DRUG MONITORING MARKET, BY TECHNOLOGY, 2020–2027 (USD MILLION)
- TABLE 130 JAPAN: THERAPEUTIC DRUG MONITORING IMMUNOASSAYS MARKET, BY TYPE, 2020–2027 (USD MILLION)
- TABLE 131 JAPAN: THERAPEUTIC DRUG MONITORING MARKET FOR CHROMATOGRAPHY-MS, BY TYPE, 2020–2027 (USD MILLION)
- TABLE 132 JAPAN: THERAPEUTIC DRUG MONITORING MARKET, BY DRUG CLASS, 2020–2027 (USD MILLION)
- TABLE 133 JAPAN: THERAPEUTIC DRUG MONITORING MARKET, BY END USER, 2020–2027 (USD MILLION)
- TABLE 134 CHINA: THERAPEUTIC DRUG MONITORING MARKET, BY PRODUCT, 2020–2027 (USD MILLION)
- TABLE 135 CHINA: THERAPEUTIC DRUG MONITORING MARKET, BY TECHNOLOGY, 2020–2027 (USD MILLION)
- TABLE 136 CHINA: THERAPEUTIC DRUG MONITORING IMMUNOASSAYS MARKET, BY TYPE, 2020–2027 (USD MILLION)
- TABLE 137 CHINA: THERAPEUTIC DRUG MONITORING MARKET FOR CHROMATOGRAPHY-MS, BY TYPE, 2020–2027 (USD MILLION)
- TABLE 138 CHINA: THERAPEUTIC DRUG MONITORING MARKET, BY DRUG CLASS, 2020–2027 (USD MILLION)
- TABLE 139 CHINA: THERAPEUTIC DRUG MONITORING MARKET, BY END USER, 2020–2027 (USD MILLION)
- TABLE 140 INDIA: THERAPEUTIC DRUG MONITORING MARKET, BY PRODUCT, 2020–2027 (USD MILLION)
- TABLE 141 INDIA: THERAPEUTIC DRUG MONITORING MARKET, BY TECHNOLOGY, 2020–2027 (USD MILLION)
- TABLE 142 INDIA: THERAPEUTIC DRUG MONITORING IMMUNOASSAYS MARKET, BY TYPE, 2020–2027 (USD MILLION)
- TABLE 143 INDIA: THERAPEUTIC DRUG MONITORING MARKET FOR CHROMATOGRAPHY-MS, BY TYPE, 2020–2027 (USD MILLION)
- TABLE 144 INDIA: THERAPEUTIC DRUG MONITORING MARKET, BY DRUG CLASS, 2020–2027 (USD MILLION)
- TABLE 145 INDIA: THERAPEUTIC DRUG MONITORING MARKET, BY END USER, 2020–2027 (USD MILLION)
- TABLE 146 ROAPAC: THERAPEUTIC DRUG MONITORING MARKET, BY PRODUCT, 2020–2027 (USD MILLION)
- TABLE 147 ROAPAC: THERAPEUTIC DRUG MONITORING MARKET, BY TECHNOLOGY, 2020–2027 (USD MILLION)
- TABLE 148 ROAPAC: THERAPEUTIC DRUG MONITORING IMMUNOASSAYS MARKET, BY TYPE, 2020–2027 (USD MILLION)
- TABLE 149 ROAPAC: THERAPEUTIC DRUG MONITORING MARKET FOR CHROMATOGRAPHY-MS, BY TYPE, 2020–2027 (USD MILLION)
- TABLE 150 ROAPAC: THERAPEUTIC DRUG MONITORING MARKET, BY DRUG CLASS, 2020–2027 (USD MILLION)
- TABLE 151 ROAPAC: THERAPEUTIC DRUG MONITORING MARKET, BY END USER, 2020–2027 (USD MILLION)
- TABLE 152 ROW: THERAPEUTIC DRUG MONITORING MARKET, BY PRODUCT, 2020–2027 (USD MILLION)
- TABLE 153 ROW: THERAPEUTIC DRUG MONITORING EQUIPMENT MARKET, BY TYPE, 2020–2027 (USD MILLION)
- TABLE 154 ROW: THERAPEUTIC DRUG MONITORING MARKET, BY TECHNOLOGY, 2020–2027 (USD MILLION)
- TABLE 155 ROW: THERAPEUTIC DRUG MONITORING IMMUNOASSAYS MARKET, BY TYPE, 2020–2027 (USD MILLION)
- TABLE 156 ROW: THERAPEUTIC DRUG MONITORING MARKET FOR CHROMATOGRAPHY-MS, BY TYPE, 2020–2027 (USD MILLION)
- TABLE 157 ROW: THERAPEUTIC DRUG MONITORING MARKET, BY DRUG CLASS, 2020–2027 (USD MILLION)
- TABLE 158 ROW: THERAPEUTIC DRUG MONITORING MARKET, BY END USER, 2020–2027 (USD MILLION)
- TABLE 159 OVERVIEW OF STRATEGIES ADOPTED BY KEY PLAYERS
- TABLE 160 THERAPEUTIC DRUG MONITORING MARKET: DEGREE OF COMPETITION
- TABLE 161 COMPANY FOOTPRINT
- TABLE 162 COMPANY REGIONAL FOOTPRINT
- TABLE 163 COMPANY PRODUCT FOOTPRINT
- TABLE 164 KEY PRODUCT LAUNCHES & APPROVALS
- TABLE 165 KEY DEALS
- TABLE 166 KEY OTHER DEVELOPMENTS
- TABLE 167 ABBOTT: BUSINESS OVERVIEW
- TABLE 168 THERMO FISHER SCIENTIFIC: BUSINESS OVERVIEW
- TABLE 169 F. HOFFMANN-LA ROCHE: BUSINESS OVERVIEW
- TABLE 170 SIEMENS HEALTHINEERS AG: BUSINESS OVERVIEW
- TABLE 171 DANAHER CORPORATION: BUSINESS OVERVIEW
- TABLE 172 BIO-RAD LABORATORIES: BUSINESS OVERVIEW
- TABLE 173 BIOMÉRIEUX SA: BUSINESS OVERVIEW
- TABLE 174 THERADIAG: BUSINESS OVERVIEW
- TABLE 175 GRIFOLS S.A.: BUSINESS OVERVIEW
- TABLE 176 EXAGEN INC.: BUSINESS OVERVIEW
- TABLE 177 ARK DIAGNOSTICS, INC.: BUSINESS OVERVIEW
- TABLE 178 R-BIOPHARM AG: BUSINESS OVERVIEW
- FIGURE 1 RESEARCH DESIGN
- FIGURE 2 PRIMARY SOURCES
- FIGURE 3 KEY INDUSTRY INSIGHTS
- FIGURE 4 BREAKDOWN OF PRIMARY INTERVIEWS: SUPPLY-SIDE AND DEMAND-SIDE PARTICIPANTS
- FIGURE 5 BREAKDOWN OF PRIMARY INTERVIEWS: BY COMPANY TYPE, DESIGNATION, AND REGION
- FIGURE 6 BOTTOM-UP APPROACH: COMPANY REVENUE ESTIMATION APPROACH
- FIGURE 7 APPROACH 3: MARKET SIZE ESTIMATION FROM PARENT MARKET
- FIGURE 8 CAGR PROJECTIONS: SUPPLY-SIDE ANALYSIS
- FIGURE 9 MARKET SIZE ESTIMATION: TOP-DOWN APPROACH
- FIGURE 10 DATA TRIANGULATION METHODOLOGY
- FIGURE 11 THERAPEUTIC DRUG MONITORING MARKET, BY PRODUCT, 2022 VS. 2027 (USD MILLION)
- FIGURE 12 THERAPEUTIC DRUG MONITORING MARKET, BY TECHNOLOGY, 2022 VS. 2027 (USD MILLION)
- FIGURE 13 THERAPEUTIC DRUG MONITORING MARKET, BY DRUG CLASS, 2022 VS. 2027 (USD MILLION)
- FIGURE 14 THERAPEUTIC DRUG MONITORING MARKET, BY END USER, 2022 VS. 2027 (USD MILLION)
- FIGURE 15 GEOGRAPHIC ANALYSIS: THERAPEUTIC DRUG MONITORING MARKET
- FIGURE 16 RISING PREFERENCE FOR PRECISION MEDICINE TO DRIVE TDM MARKET
- FIGURE 17 ANTIEPILEPTIC DRUGS ACCOUNTED FOR LARGEST SHARE IN 2021
- FIGURE 18 CHINA TO REGISTER HIGHEST CAGR
- FIGURE 19 ASIA PACIFIC MARKET TO WITNESS HIGHEST GROWTH DURING FORECAST PERIOD
- FIGURE 20 DEVELOPING ECONOMIES TO REGISTER HIGHER GROWTH DURING FORECAST PERIOD
- FIGURE 21 THERAPEUTIC DRUG MONITORING MARKET: DRIVERS, RESTRAINTS, OPPORTUNITIES, AND CHALLENGES
- FIGURE 22 UK: NUMBER OF DECEASED DONORS AND TRANSPLANTS (APRIL 1, 2017–MARCH 31, 2021)
- FIGURE 23 PERSONALIZED MEDICINE APPROVALS BY US FDA, 2015–2021
- FIGURE 24 NUMBER OF RESEARCH PUBLICATIONS ON TDM (2015–2021)
- FIGURE 25 INCIDENCE OF DIABETES, BY REGION, 2019 VS. 2030 VS. 2045 (MILLION)
- FIGURE 26 GROWTH IN CURRENT HEALTHCARE EXPENDITURE PER CAPITA IN BRICS COUNTRIES, 2012–2019
- FIGURE 27 VALUE CHAIN ANALYSIS: MAJOR VALUE ADDED DURING MANUFACTURING AND ASSEMBLY PHASE
- FIGURE 28 DIRECT DISTRIBUTION—PREFERRED STRATEGY FOR PROMINENT COMPANIES
- FIGURE 29 INFLUENCE OF STAKEHOLDERS ON BUYING PROCESS FOR TOP THREE END USERS
- FIGURE 30 KEY BUYING CRITERIA FOR TOP THREE END USERS
- FIGURE 31 PATENT ANALYSIS FOR IMMUNOASSAY ANALYZERS
- FIGURE 32 PATENT ANALYSIS FOR CLINICAL CHEMISTRY ANALYZERS
- FIGURE 33 KEY MARKET PLAYERS
- FIGURE 34 REVENUE SHIFT FOR THERAPEUTIC DRUG MONITORING
- FIGURE 35 PATIENTS ON WAITING LIST VS. TRANSPLANTS PERFORMED, BY ORGAN, 2021
- FIGURE 36 NORTH AMERICA: THERAPEUTIC DRUG MONITORING MARKET SNAPSHOT
- FIGURE 37 ASIA PACIFIC: THERAPEUTIC DRUG MONITORING MARKET SNAPSHOT
- FIGURE 38 REVENUE ANALYSIS OF KEY PLAYERS
- FIGURE 39 COMPANY EVALUATION QUADRANT: THERAPEUTIC DRUG MONITORING MARKET, 2021
- FIGURE 40 COMPANY EVALUATION MATRIX FOR SMES/START-UPS: THERAPEUTIC DRUG MONITORING MARKET, 2021
- FIGURE 41 ABBOTT: COMPANY SNAPSHOT (2021)
- FIGURE 42 THERMO FISHER SCIENTIFIC: COMPANY SNAPSHOT (2021)
- FIGURE 43 F. HOFFMANN-LA ROCHE: COMPANY SNAPSHOT (2021)
- FIGURE 44 SIEMENS HEALTHINEERS AG: COMPANY SNAPSHOT (2022)
- FIGURE 45 DANAHER CORPORATION: COMPANY SNAPSHOT (2021)
- FIGURE 46 BIO-RAD LABORATORIES: COMPANY SNAPSHOT (2021)
- FIGURE 47 BIOMÉRIEUX: COMPANY SNAPSHOT (2021)
- FIGURE 48 THERADIAG: COMPANY SNAPSHOT (2021)
- FIGURE 49 GRIFOLS S.A.: COMPANY SNAPSHOT (2021)
- FIGURE 50 EXAGEN INC.: COMPANY SNAPSHOT (2021)
The study involved four major activities in estimating the current size of the Therapeutic Drug Monitoring market. Exhaustive secondary research was done to collect information on the market and its different subsegments. The next step was to validate these findings, assumptions, and sizing with industry experts across the value chain through primary research. Both top-down and bottom-up approaches were employed to estimate the complete market size. After that, market breakdown and data triangulation procedures were used to estimate the market size of the segments and subsegments.
Secondary Research
In the secondary research process, various secondary sources such as annual reports, press releases & investor presentations of companies, white papers, certified publications, articles by recognized authors, gold-standard & silver-standard websites, regulatory bodies, and databases (such as D&B Hoovers, Bloomberg Business, and Factiva) were referred to identify and collect information for this study.
Primary Research
Extensive primary research was conducted after acquiring knowledge about the global market scenario through secondary research. Primary interviews were conducted from both the demand (heads of private labs, Diagnostics and hospitals, Scientists, Researchers) and supply sides (Therapeutic Drug Monitoring manufacturers and distributors).
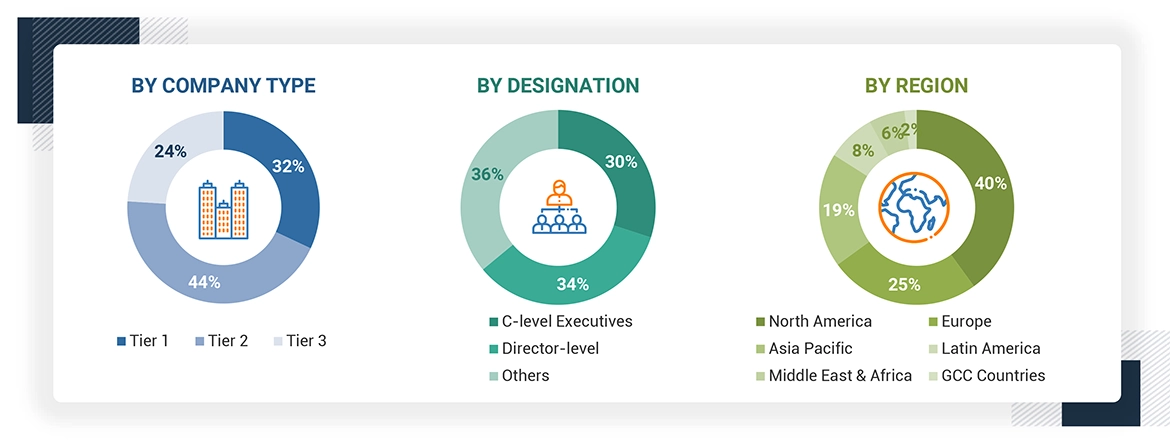
The following is a breakdown of the primary respondents:
Breakdown of Primary Participants:
Note 1: Others include sales managers, marketing managers, and product managers.
Note 2. Tiers of companies are defined based on their total revenue. As of 2020: Tier 1 = >USD 5 billion, Tier 2 = USD 500 million to USD 5 billion, and Tier 3 = <USD 500 million.
To know about the assumptions considered for the study, download the pdf brochure
Market Size Estimation
Both top-down and bottom-up approaches were used to estimate and validate the total size of the Therapeutic Drug Monitoring market. These methods were also used extensively to estimate the size of various subsegments in the market. The research methodology used to estimate the market size includes the following:
- The key players in the industry and markets have been identified through extensive secondary research
- The industry’s supply chain and market size, in terms of value, have been determined through primary and secondary research processes
- All percentage shares, splits, and breakdowns have been determined using secondary sources and verified through primary sources
Data Triangulation
After arriving at the overall market size—using the market size estimation processes—the market was split into several segments and subsegments. To complete the overall market engineering process and arrive at the exact statistics of each market segment and subsegment, the data triangulation, and market breakdown procedures were employed, wherever applicable. The data was triangulated by studying various factors and trends from both the demand and supply sides in the Therapeutic Drug Monitoring industry.
Report Objectives
- To define, describe, and forecast the global Therapeutic Drug Monitoring market based on product, and region
- To provide detailed information regarding the major factors influencing the growth of the market (drivers, opportunities, and industry-specific challenges)
- To strategically analyze micromarkets1 with respect to individual growth trends, prospects, and contributions to the total market
- To analyze opportunities in the market for stakeholders and provide details of the competitive landscape for market leaders
- To forecast the size of market segments with respect to four main regions—North America, Europe, Asia Pacific, and the Rest of the World (RoW)2
- To strategically profile key players and comprehensively analyze their product portfolios, market shares, and core competencies3
- To track and analyze competitive developments such as acquisitions, expansions, new product launches, and partnerships in the Therapeutic Drug Monitoring market
Available Customizations:
With the given market data, MarketsandMarkets offers customizations as per the company’s specific needs. The following customization options are available for the report:
- Product Analysis: Product matrix, which gives a detailed comparison of the product portfolios of each company
- Geographic Analysis: Further breakdown of the European Therapeutic Drug Monitoring market into specific countries.
Growth opportunities and latent adjacency in Therapeutic Drug Monitoring Market