Synthetic Rope Market

Synthetic Rope Market by Material Type (Polypropylene, Polyester, Nylon, Polyethylene, Specialty Fibers), End-Use Industry (Marine & Fishing, Oil & Gas, Construction, Cranes, Sports & Leisure, Others), and by Region - Global Forecast to 2021

Report Code: AD 4302 May, 2016, by marketsandmarkets.com

[182 Pages] Synthetic Rope Market size is projected to reach USD 1.69 Billion by 2021. The market is projected to witness a CAGR of 5.9%, in terms of value, during the forecast period. In this study, 2015 is considered as the base year for estimating the market size of synthetic ropes. The market size is projected for the period between 2016 and 2021. The report presents the size and the potential growth of the synthetic ropes market across different market segments categorized on the basis of material type, application, and region.

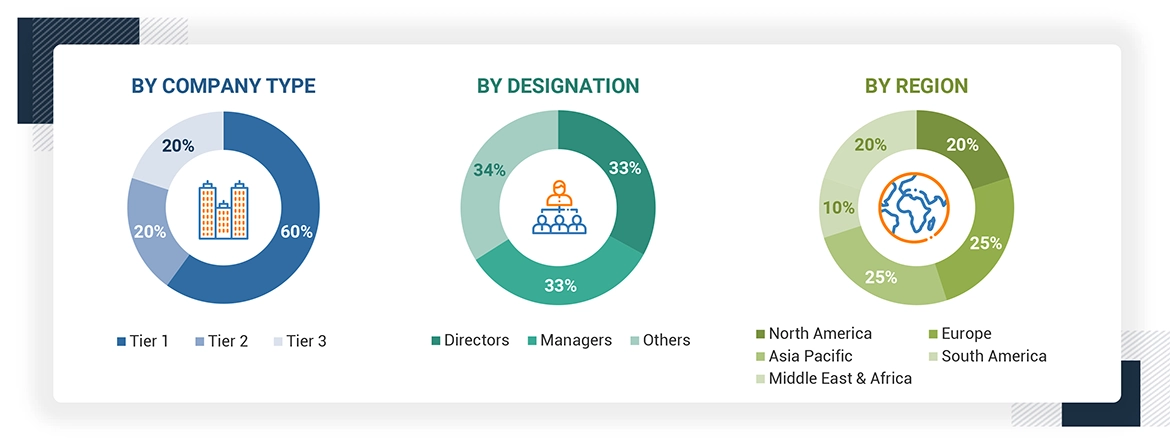
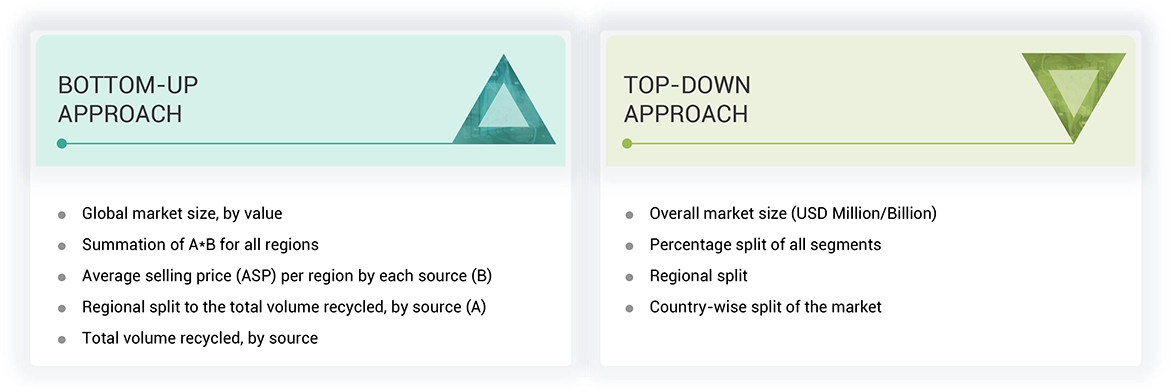
In this report, the market sizes have been derived through various research methodologies. In the secondary research process, different sources have been referred to identify and collect information for this study. These secondary sources include annual reports, press releases, and investor presentations of companies, white papers, certified publications, and articles from recognized authors. In the primary research process, sources from both supply and demand sides have been interviewed to obtain qualitative and quantitative information for this report. The bottom-up approach has been used to estimate market size, in terms of value and volume. The top-down approach has been implemented to validate the market size, in terms of value. With the data triangulation procedure and validation of data through primaries, the exact values of the overall parent market size and individual market sizes have been determined and confirmed in this study. The figure below illustrates the breakdown of the profiles of primary interview participants.

Synthetic Ropes Market

To know about the assumptions considered for the study, download the pdf brochure

The synthetic rope market includes raw material suppliers, manufacturers, and end users. Raw material suppliers are Royal DSM (Netherlands), Teijin Aramid (Netherlands), Honeywell International Inc. (U.S.), and many others. The manufacturers include various companies such as Samson Rope Technologies (U.S.), WireCo World Group (U.S.), Cortland Limited (U.S.), Bridon International Limited (U.K.), Marlow Ropes (U.K.), and others. The end users include industries such as marine & fishing, oil & gas, construction, cranes, and many others.

Target Audience:

  • Synthetic rope manufacturing companies
  • Synthetic rope distributors
  • Raw material suppliers
  • Commercial research & development (R&D) institutes
  • Research institutes, trade associations, and government agencies

Want to explore hidden markets that can drive new revenue in Synthetic Rope Market?

Scope of the Report
:

The report forecasts revenue growth and analysis of trends in each of the submarkets. This research report categorizes the synthetic ropes market based on the following:

Material Type:

  • Polypropylene (PP)
  • Polyester
  • Nylon
  • Polyethylene (PE)
  • Specialty fibers

End-Use Industry:

  • Marine & fishing
  • Sports & leisure
  • Oil & gas
  • Construction
  • Cranes
  • Others

Region:

  • North America
  • Europe
  • Asia-Pacific
  • RoW (Middle East & Africa and Central & South America)

Each region is further segmented by key countries.

Available Customizations:

 The following customization options are available for the report:

  1. Country Information
    • Synthetic ropes market analysis for additional countries
  2. Company Information
    • Detailed analysis and profiling of additional market players (up to 5)

The global synthetic rope market is projected to witness a CAGR of 5.9% from 2016 to reach a market size of USD 1.69 Billion by 2021. The market is highly driven by the low weight and high strength characteristics of synthetic ropes. Another key factor that is expected to drive this market is the safety aspect of synthetic ropes. Synthetic ropes are relatively safer to use compared with steel wire rope that are widely used by the marine, mining, and oil & gas industries.

Nylon and specialty fibers such as high-molecular polyethylene (HMPE) and aramid are expected to register high CAGRs between 2016 and 2021, in terms of volume. Polypropylene (PP) ropes accounted for the highest market share as these ropes are widely used in the marine & fishing industry, sometimes in combination with polyester. Specialty fibers account for a small share because of their high costs; however, they are expected to garner high demand because of their exceptional high strength properties.

The marine & fishing industry is projected to account for the highest market share during the forecast period. Synthetic ropes are widely used in the marine sector for mooring, lifting, towing, and other applications. Moreover, synthetic ropes have a huge scope to become a better alternative to the steel wire ropes used in the marine industry. The Synthetic ropes used in the cranes segment are projected to witness the highest CAGR during the forecast period.

North America accounted for the largest share of the global synthetic rope market and is projected to continue dominating the market during the forecast period. Asia-Pacific is projected to witness the highest CAGR during the forecast period. The region’s booming fishing or aquaculture industry is expected to trigger the demand for synthetic ropes during the forecast period. Moreover, construction, cranes, and mining industries of the region are likely to provide growth opportunities to the market.

Synthetic Ropes Market

High raw materials cost for manufacturing synthetic ropes compared with that for steel wire rope is the only restraint in the market. However, advantages related to the total cost of ownership of synthetic rope products and increasing awareness of the product among end-use industries are expected to overcome this restraint during the forecast period.

The market players adopted both organic and inorganic growth strategies from 2011 to 2016 to strengthen their market position. Capacity expansions and new product developments are the major organic growth strategies adopted by the market players to enhance their regional footprint and meet the growing demand of synthetic ropes in emerging economies. WireCo World Group (U.S.), Samson Rope Technologies (U.S.), and Cortland Limited (U.S.) are some of the prominent players in the market.

To speak to our analyst for a discussion on the above findings, click Speak to Analyst

Exclusive indicates content/data unique to MarketsandMarkets and not available with any competitors.

Table of Contents

1 Introduction (Page No. - 16)
    1.1 Objectives of the Study
    1.2 Market Definition
    1.3 Market Scope
           1.3.1 Market Segmentation
           1.3.2 Years Considered for the Study
    1.4 Currency
    1.5 Package Size
    1.6 Stakeholders

2 Research Methodology (Page No. - 19)
    2.1 Research Data
           2.1.1 Secondary Data
                     2.1.1.1 Key Data From Secondary Sources
           2.1.2 Primary Data
                     2.1.2.1 Key Data From Primary Sources
                     2.1.2.2 Key Industry Insights
    2.2 Market Size Estimation
           2.2.1 Bottom-Up Approach
           2.2.2 Top-Down Approach
    2.3 Market Breakdown and Data Triangulation
    2.4 Research Assumptions and Limitations
           2.4.1 Assumptions
           2.4.2 Limitations

3 Executive Summary (Page No. - 28)

4 Premium Insights (Page No. - 32)
    4.1 Attractive Opportunity in the Synthetic Ropes Market
    4.2 Synthetic Ropes Market Growth, By Material Type
    4.3 Synthetic Ropes Market Size in Asia-Pacific
    4.4 Synthetic Ropes Market Attractiveness
    4.5 Synthetic Ropes Market Share, By End-Use Industry and Region, 2021
    4.6 Synthetic Ropes Market Size: Developing Countries
    4.7 Life Cycle Analysis, By Region (2016)

5 Market Overview (Page No. - 37)
    5.1 Introduction
    5.2 Evolution
    5.3 Segmentation
           5.3.1 Material Type Segmentation
           5.3.2 End-Use Industry Segmentation
           5.3.3 Regional Segmentation
    5.4 Market Dynamics
           5.4.1 Drivers
                     5.4.1.1 High Strength and Light Weight of Synthetic Ropes
                     5.4.1.2 Safety Aspects of Synthetic Ropes
           5.4.2 Restraints
                     5.4.2.1 High Cost of Raw Materials and Frequent Preventive Maintenance
           5.4.3 Opportunities
                     5.4.3.1 Better Alternative to Steel Wire Ropes
                     5.4.3.2 Growth Opportunities in Asia-Pacific
           5.4.4 Challenges
                     5.4.4.1 Lack of Awareness Among Potential End-Industries

6 Industry Trends (Page No. - 45)
    6.1 Introduction
    6.2 Value Chain Analysis
    6.3 Porter’s Five Forces Analysis
           6.3.1 Bargaining Power of Suppliers
           6.3.2 Bargaining Power of Buyers
           6.3.3 Threat of Substitute
           6.3.4 Threat of New Entrants
           6.3.5 Intensity of Rivalry
    6.4 Patent Analysis

7 Synthetic Ropes Market, By Material Type (Page No. - 51)
    7.1 Introduction
    7.2 Polypropylene (PP)
    7.3 Polyester
    7.4 Nylon
    7.5 Polyethylene (PE)
    7.6 Specialty Fibers

8 Synthetic Ropes Market, By End-Use Industry (Page No. - 62)
    8.1 Introduction
    8.2 Marine & Fishing
           8.2.1 Industry Trend
    8.3 Oil & Gas
           8.3.1 Industry Trend
    8.4 Sports & Leisure
    8.5 Construction
           8.5.1 Industry Trend
    8.6 Cranes
    8.7 Others
           8.7.1 Industry Trend

9 Synthetic Ropes Market, By Region (Page No. - 76)
    9.1 Introduction
    9.2 North America
           9.2.1 U.S.
                     9.2.1.1 U.S.: Economic Outlook (2014)
           9.2.2 Canada
                     9.2.2.1 Canada: Economic Outlook (2014)
           9.2.3 Mexico
    9.3 Europe
           9.3.1 Germany
           9.3.2 U.K.
                     9.3.2.1 U.K.: Economic Outlook (2014)
           9.3.3 Norway
           9.3.4 Italy
           9.3.5 Netherlands
           9.3.6 Rest of Europe
    9.4 Asia-Pacific
           9.4.1 China
                     9.4.1.1 China: Economic Outlook (2014)
           9.4.2 Japan
           9.4.3 South Korea
           9.4.4 India
           9.4.5 Indonesia
           9.4.6 Rest of Asia-Pacific
    9.5 RoW: Rest of the World
           9.5.1 Central & South America
           9.5.2 Middle East & Africa

10 Competitive Landscape (Page No. - 130)
     10.1 Overview
     10.2 Market Ranking of Key Players
     10.3 Competitive Situation and Trends
               10.3.1 New Product Development
               10.3.2 Capacity Expansions
               10.3.3 Mergers & Acquisitions
               10.3.4 Partnerships & Agreements and Joint Ventures, 2011–2016
               10.3.5 Research & Development

11 Company Profiles (Page No. - 138)
(Overview, Financial*, Products & Services, Strategy, and Developments)
     11.1 Introduction
     11.2 Cortland Limited
     11.3 Wireco Worldgroup Inc.
     11.4 Samson Rope Technologies, Inc.
     11.5 Southern Ropes
     11.6 English Braids Ltd
     11.7 Marlow Ropes Ltd
     11.8 Teufelberger Holding AG
     11.9 Bridon International Ltd
     11.10 Yale Cordage Inc.
     11.11 Lanex A.S.
     11.12 Some Other Market Players

*Details Might Not Be Captured in Case of Unlisted Companies

12 Appendix (Page No. - 179)
     12.1 Discussion Guide
     12.2 Introducing RT: Real Time Market Intelligence
     12.3 Available Customizations
     12.4 Value Chain
     12.5 Knowledge Store: Marketsandmarkets’ Subscription Portal


List of Tables (136 Tables)

Table 1 Segmentation, By Material Type
Table 2 Segmentation, By End-Use Industry
Table 3 Low Weight, High Strength, and Safety Aspects of Synthetic Ropes Expected to Drive the Market
Table 4 High Cost of Raw Materials and Frequent Maintenance Expected to Restrict the Market Growth
Table 5 Synthetic Ropes A Better Alternative to Steel Wire Ropes
Table 6 Lack of Awareness Among End Users Acts as Challenge for the Market Players
Table 7 Categorization of Patents Related to Synthetic Ropes
Table 8 Trade Names of Some Raw Material Fibers
Table 9 Fiber Characteristics
Table 10 Synthetic Rope Market Size, By Material Type, 2014–2021 (USD Million)
Table 11 Synthetic Rope Market Size, By Material Type, 2014–2021 (Kiloton)
Table 12 Polypropylene Rope Market Size, By Region, 2014–2021 (USD Million)
Table 13 Polypropylene Rope Market Size, By Region, 2014–2021 (Kiloton)
Table 14 Polyester Rope Market Size, By Region, 2014–2021 (USD Million)
Table 15 Polyester Rope Market Size, By Region, 2014–2021 (Kiloton)
Table 16 Nylon Rope Market Size, By Region, 2014–2021 (USD Million)
Table 17 Nylon Rope Market Size, By Region, 2014–2021 (Kiloton)
Table 18 Polyethylene Rope Market Size, By Region, 2014–2021 (USD Million)
Table 19 Polyethylene Rope Market Size, By Region, 2014–2021 (Kiloton)
Table 20 Specialty Fiber Rope Market Size, By Region, 2014–2021 (USD Million)
Table 21 Specialty Fiber Rope Market Size, By Region, 2014–2021 (Kiloton)
Table 22 Synthetic Rope Market Size, By End-Use Industry,2014–2021 (USD Million)
Table 23 Synthetic Rope Market Size, By End-Use Industry, 2014–2021 (Kiloton)
Table 24 Synthetic Rope Market Size in Marine & Fishing Industry, By Region, 2014–2021 (USD Million)
Table 25 Synthetic Rope Market Size in Marine & Fishing Industry, By Region, 2014–2021 (Kiloton)
Table 26 Synthetic Rope Market Size in Oil & Gas Industry, By Region,2014–2021 (USD Million)
Table 27 Synthetic Rope Market Size in Oil & Gas Industry, By Region,2014–2021 (Kiloton)
Table 28 Synthetic Rope Market Size in Sports & Leisure Industry, By Region, 2014–2021 (USD Million)
Table 29 Synthetic Rope Market Size in Sports & Leisure Industry, By Region, 2014–2021 (Kiloton)
Table 30 Country-Wise Contribution of Construction Sector to the World Gross Value in 2013, USD Billion
Table 31 Synthetic Ropes Market Size in Construction Industry, By Region, 2014–2021 (USD Million)
Table 32 Synthetic Ropes Market Size in Construction Industry, By Region, 2014–2021 (Kiloton)
Table 33 Synthetic Ropes Market Size in Cranes Industry, By Region,2014–2021 (USD Million)
Table 34 Synthetic Ropes Market Size in Cranes Industry, By Region,2014–2021 (Kiloton)
Table 35 World Mining Percentage Share, By Region (2014)
Table 36 Synthetic Ropes Market Size in Other Industries, By Region,2014–2021 (USD Million)
Table 37 Synthetic Ropes Market Size in Other Industries, By Region,2014–2021 (Kiloton)
Table 38 Synthetic Ropes Market Size, By Region, 2014–2021 (USD Million)
Table 39 Synthetic Ropes Market Size, By Region, 2014–2021 (Kiloton)
Table 40 North America: Synthetic Ropes Market Size, By Material Type,2014–2021 (USD Million)
Table 41 North America: Synthetic Ropes Market Size, By Material Type, 2014–2021 (Kiloton)
Table 42 North America: Synthetic Ropes Market Size, By End-Use Industry, 2014–2021 (USD Million)
Table 43 North America: Synthetic Ropes Market Size, By End-Use Industry, 2014–2021 (Kiloton)
Table 44 North America: Synthetic Ropes Market Size, By Country,2014–2021 (USD Million)
Table 45 North America: Synthetic Ropes Market Size, By Country,2014–2021 (USD Million)
Table 46 U.S.: Synthetic Ropes Market Size, By Material Type,2014–2021 (USD Million)
Table 47 U.S.: Synthetic Ropes Market Size, By Material Type, 2014–2021 (Kiloton)
Table 48 U.S.: Synthetic Ropes Market Size, By End-Use Industry,2014–2021 (USD Million)
Table 49 U.S.: Synthetic Ropes Market Size, By End-Use Industry,2014–2021 (Kiloton)
Table 50 Canada: Synthetic Ropes Market Size, By Material Type,2014–2021 (USD Million)
Table 51 Canada: Synthetic Ropes Market Size, By Material Type,2014–2021 (Kiloton)
Table 52 Canada: Synthetic Ropes Market Size, By End-Use Industry,2014–2021 (USD Million)
Table 53 Canada: Synthetic Ropes Market Size, By End-Use Industry,2014–2021 (Kiloton)
Table 54 Mexico: Synthetic Ropes Market Size, By Material Type,2014–2021 (USD Million)
Table 55 Mexico: Synthetic Ropes Market Size, By Material Type,2014–2021 (Kiloton)
Table 56 Mexico: Synthetic Ropes Market Size, By End-Use Industry,2014–2021 (USD Million)
Table 57 Mexico: Synthetic Ropes Market Size, By End-Use Industry,2014–2021 (Kiloton)
Table 58 Europe: Synthetic Ropes Market Size, By Material Type,2014–2021 (USD Million)
Table 59 Europe: Synthetic Ropes Market Size, By Material Type,2014–2021 (Kiloton)
Table 60 Europe: Synthetic Ropes Market Size, By End-Use Industry,2014–2021 (USD Million)
Table 61 Europe: Synthetic Ropes Market Size, By End-Use Industry,2014–2021 (Kilotons)
Table 62 Europe: Synthetic Ropes Market Size, By Country,2014–2021 (USD Million)
Table 63 Europe: Synthetic Ropes Market Size, By Country, 2014–2021 (Kiloton)
Table 64 Germany: Synthetic Ropes Market Size, By Material Type,2014–2021 (USD Million)
Table 65 Germany: Synthetic Ropes Market Size, By Material Type,2014–2021 (Kiloton)
Table 66 Germany: Synthetic Ropes Market Size, By End-Use Industry,2014–2021 (USD Million)
Table 67 Germany: Synthetic Ropes Market Size, By End-Use Industry,2014–2021 (Kiloton)
Table 68 U.K.: Synthetic Ropes Market Size, By Material Type,2014–2021 (USD Million)
Table 69 U.K.: Synthetic Ropes Market Size, By Material Type, 2014–2021 (Kiloton)
Table 70 U.K.: Synthetic Ropes Market Size, By End-Use Industry,2014–2021 (USD Million)
Table 71 U.K.: Synthetic Ropes Market Size, By End-Use Industry,2014–2021 (Kiloton)
Table 72 Norway: Synthetic Ropes Market Size, By Material Type,2014–2021 (USD Million)
Table 73 Norway: Synthetic Ropes Market Size, By Material Type, 2014–2021 (Kiloton)
Table 74 Norway: Synthetic Ropes Market Size, By End-Use Industry,2014–2021 (USD Million)
Table 75 Norway: Synthetic Ropes Market Size, By End-Use Industry,2014–2021 (Kiloton)
Table 76 Italy: Synthetic Ropes Market Size, By Material Type,2014–2021 (USD Million)
Table 77 Italy: Synthetic Ropes Market Size, By Material Type,2013–2020 (Kiloton)
Table 78 Italy: Synthetic Ropes Market Size, By End-Use Industry,2014–2021 (USD Million)
Table 79 Italy: Synthetic Ropes Market Size, By End-Use Industry,2014–2021 (Kiloton)
Table 80 Netherlands: Synthetic Ropes Market Size, By Material Type,2014–2021 (USD Million)
Table 81 Netherlands: Synthetic Ropes Market Size, By Material Type,2014–2021 (Kiloton)
Table 82 Netherlands: Synthetic Ropes Market Size, By End-Use Industry,2014–2021 (USD Million)
Table 83 Netherlands: Synthetic Ropes Market Size, By End-Use Industry,2014–2021 (Kiloton)
Table 84 Rest of Europe: Synthetic Ropes Market Size, By Material Type,2014–2021 (USD Million)
Table 85 Rest of Europe: Synthetic Ropes Market Size, By Material Type,2014–2021 (Kiloton)
Table 86 Rest of Europe: Synthetic Ropes Market Size, By End-Use Industry, 2014–2021 (USD Million)
Table 87 Rest of Europe: Synthetic Ropes Market Size, By End-Use Industry, 2014–2021 (Kiloton)
Table 88 Asia-Pacific: Synthetic Ropes Market Size, By Material Type,2014-2021 (USD Million)
Table 89 Asia-Pacific: Synthetic Ropes Market Size, By Material Type,2014-2021 (Kiloton)
Table 90 Asia-Pacific: Synthetic Ropes Market Size, By End-Use Industry,2014-2021 (USD Million)
Table 91 Asia-Pacific: Synthetic Ropes Market Size, By End-Use Industry,2014-2021 (Kiloton)
Table 92 Asia-Pacific: Synthetic Ropes Market Size, By Country,2014-2021 (USD Million)
Table 93 Asia-Pacific: Synthetic Ropes Market Size, By Country, 2014-2021 (Kiloton)
Table 94 China: Synthetic Ropes Market Size, By Material Type,2014-2021 (USD Million)
Table 95 China: Synthetic Ropes Market Size, By Material Type,2014-2021 (Kiloton)
Table 96 China: Synthetic Ropes Market Size, By End-Use Industry,2014-2021 (USD Million)
Table 97 China: Synthetic Ropes Market Size, By End-Use Industry,2014-2021 (Kiloton)
Table 98 Japan: Synthetic Ropes Market Size, By Material Type,2014-2021 (USD Million)
Table 99 Japan: Synthetic Ropes Market Size, By Material Type,2014-2021 (Kiloton)
Table 100 Japan: Synthetic Ropes Market Size, By End-Use Industry,2014-2021 (USD Million)
Table 101 Japan: Synthetic Ropes Market Size, By End-Use Industry,2014-2021 (Kiloton)
Table 102 South Korea: Synthetic Ropes Market Size, By Material Type, 2014-2021 (USD Million)
Table 103 South Korea: Synthetic Ropes Market Size, By Material Type, 2014-2021 (Kiloton)
Table 104 South Korea: Synthetic Ropes Market Size, By End-Use Industry,2014-2021 (USD Million)
Table 105 South Korea: Synthetic Ropes Market Size, By End-Use Industry, 2014-2021 (Kiloton)
Table 106 India: Synthetic Ropes Market Size, By Material Type,2014-2021 (USD Million)
Table 107 India: Synthetic Ropes Market Size, By Material Type, 2014-2021 (Kiloton)
Table 108 India: Synthetic Ropes Market Size, By End-Use Industry,2014-2021 (USD Million)
Table 109 India: Synthetic Ropes Market Size, By End-Use Industry, 2014-2021 (Kiloton)
Table 110 Indonesia: Synthetic Ropes Market Size, By Material Type,2014-2021 (USD Million)
Table 111 Indonesia: Synthetic Ropes Market Size, By Material Type,2014-2021 (Kiloton)
Table 112 Indonesia: Synthetic Ropes Market Size, By End-Use Industry, 2014-2021 (USD Million)
Table 113 Indonesia: Synthetic Ropes Market Size, By End-Use Industry,2014-2021 (Kiloton)
Table 114 Rest of Asia-Pacific: Synthetic Ropes Market Size, By Material Type, 2014-2021 (USD Million)
Table 115 Rest of Asia-Pacific: Synthetic Ropes Market Size, By Material Type, 2014-2021 (Kiloton)
Table 116 Rest of Asia-Pacific: Synthetic Ropes Market Size, By End-Use Industry, 2014-2021 (USD Million)
Table 117 Rest of Asia-Pacific: Synthetic Ropes Market Size, By End-Use Industry, 2014-2021 (Kiloton)
Table 118 RoW: Synthetic Ropes Market Size, By Material Type,2014-2021 (USD Million)
Table 119 RoW: Synthetic Ropes Market Size, By Material Type, 2014-2021 (Kiloton)
Table 120 RoW: Synthetic Ropes Market Size, By End-Use Industry,2014-2021 (USD Million)
Table 121 RoW: Synthetic Ropes Market Size, By End-Use Industry,2014-2021 (Kiloton)
Table 122 RoW: Synthetic Ropes Market Size, By Country, 2014-2021 (USD Million)
Table 123 RoW: Synthetic Ropes Market Size, By Country, 2014-2021 (Kiloton)
Table 124 Central & South America: Synthetic Ropes Market Size, By Material Type, 2014-2021 (USD Million)
Table 125 Central & South America: Synthetic Ropes Market Size, By Material Type, 2014-2021 (Kiloton)
Table 126 Central & South America: Synthetic Ropes Market Size, By End-Use Industry, 2014-2021 (USD Million)
Table 127 Central & South America: Synthetic Ropes Market Size, By End-Use Industry, 2014-2021 (Kiloton)
Table 128 Middle East & Africa: Synthetic Ropes Market Size, By Material Type, 2014-2021 (USD Million)
Table 129 Middle East & Africa: Synthetic Ropes Market Size, By Material Type, 2014-2021 (Kiloton)
Table 130 Middle East & Africa: Synthetic Ropes Market Size, By End-Use Industry, 2014-2021 (USD Million)
Table 131 Middle East & Africa: Synthetic Ropes Market Size, By End-Use Industry, 2014-2021 (Kiloton)
Table 132 New Product Development, 2011–2016
Table 133 Capacity Expansions, 2011–2016
Table 134 Mergers & Acquisitions, 2011–2016
Table 135 Partnerships & Agreements and Joint Ventures, 2011–2016
Table 136 Research & Development, 2011–2016
 
 
List of Figures (41 Figures)
 
Figure 1 Synthetic Ropes Market Segmentation
Figure 2 Synthetic Ropes Market: Research Design
Figure 3 Breakdown of Primary Interviews
Figure 4 Market Size Estimation Methodology: Bottom-Up Approach
Figure 5 Market Size Estimation Methodology: Top-Down Approach
Figure 6 Data Triangulation: Synthetic Ropes Market
Figure 7 Specialty Fibers to Witness Highest CAGR Between 2016 and 2021
Figure 8 Marine & Fishing Projected to Account for the Highest Market Share During the Forecast Period
Figure 9 North America Accounted for the Largest Market Share, By Value, 2016
Figure 10 Synthetic Ropes Market Size, 2016 vs. 2021 (USD Billion)
Figure 11 Specialty Fibers to Witness the Highest CAGR During Forecast Period
Figure 12 Marine & Fishing Application has the Maximum Share in Asia-Pacific
Figure 13 Asia-Pacific to Grow Rapidly During Forecast Period
Figure 14 North America to Dominate the Global Synthetic Ropes Market Across All Segments (2021)
Figure 15 China to Witness the Highest CAGR Between 2016–2021
Figure 16 Asia-Pacific Market to Grow Rapidly During 2016–2021
Figure 17 Segmentation, By Region
Figure 18 Overview of Drivers, Restraints, Opportunities, and Challenges in the Synthetic Ropes Market
Figure 19 Manufacturers are the Most Important Entity in the Value Chain
Figure 20 Manufacturing Process
Figure 21 Porter’s Five Forces Analysis: Synthetic Ropes Market
Figure 22 Patents Filed Related to Manufacturing and Structure of Synthetic Ropes Were the Highest Between 2011 and 2015
Figure 23 PP Ropes Market Size, 2016 vs. 2021 (Kiloton)
Figure 24 PE Ropes to Witness the Highest CAGR in Asia-Pacific
Figure 25 Cranes Expected to Witness the Highest Growth Rate Between 2016 and 2021
Figure 26 Overview: Synthetic Ropes Market Size in Marine & Fishing Industry, 2016 vs. 2021
Figure 27 Major Shipbuilding Nations Based on Gross Tonnage (2014)
Figure 28 World Sea Route Trade, By Region, 2014
Figure 29 Global Offshore Rig Count
Figure 30 Asia-Pacific to Dominate the Synthetic Ropes Market in the Cranes Sector Between 2016 and 2021
Figure 31 Hoist Synthetic Ropes are the Most Preferred Type in the Mining Industry
Figure 32 Overview of the Regional Segments in Other End-User Industries
Figure 33 North America Projected to Remain the Largest Market (Ton)
Figure 34 Germany Accounted for the Largest Market Share (Value) in Europe
Figure 35 Asia-Pacific: India to Grow Fastest in Synthetic Ropes Market
Figure 36 China: Projected to Witness Second-Highest CAGR Between2016 and 2021
Figure 37 Organic Growth Strategies Accounted for the Largest Share Between 2011 and 2016
Figure 38 Mapping of Major Market Players
Figure 39 Wireco Worldgroup Inc.: Company Snapshot
Figure 40 Samson Rope Technologies, Inc.: SWOT Analysis
Figure 41 Bridon International Ltd: SWOT Analysis


Request for detailed methodology, assumptions & how numbers were triangulated.

Please share your problem/objectives in greater details so that our analyst can verify if they can solve your problem(s).
9 3 3 9 2  
  • Select all
  • News-Letters with latest Market insights
  • Information & discussion on the relevant new products and services
  • Information & discussion on Market insights and Market information
  • Information & discussion on our events and conferences
    • Select all
    • Email Phone Professional and social network (Linkedin, etc)
Custom Market Research Services

We will customize the research for you, in case the report listed above does not meet with your exact requirements. Our custom research will comprehensively cover the business information you require to help you arrive at strategic and profitable business decisions.

Request Customization
Report Code
AD 4302
Published ON
May, 2016
Choose License Type
BUY NOW
  • SHARE
X
Request Customization
Speak to Analyst
Speak to Analyst
OR FACE-TO-FACE MEETING
PERSONALIZE THIS RESEARCH
  • Triangulate with your Own Data
  • Get Data as per your Format and Definition
  • Gain a Deeper Dive on a Specific Application, Geography, Customer or Competitor
  • Any level of Personalization
REQUEST A FREE CUSTOMIZATION
LET US HELP YOU!
  • What are the Known and Unknown Adjacencies Impacting the Synthetic Rope Market
  • What will your New Revenue Sources be?
  • Who will be your Top Customer; what will make them switch?
  • Defend your Market Share or Win Competitors
  • Get a Scorecard for Target Partners
CUSTOMIZED WORKSHOP REQUEST
knowledgestore logo

Want to explore hidden markets that can drive new revenue in Synthetic Rope Market?

Find Hidden Markets
  • Call Us
  • +1-888-600-6441 (Corporate office hours)
  • +1-888-600-6441 (US/Can toll free)
  • +44-800-368-9399 (UK office hours)
CONNECT WITH US
ABOUT TRUST ONLINE
©2024 MarketsandMarkets Research Private Ltd. All rights reserved
DMCA.com Protection Status
Website Feedback