Network Switches Market Size, Share & Industry Trends

Report Code SE 5909
Published in Feb, 2023, By MarketsandMarkets™
Download PDF

Choose License Type

Buy Report Now Inquire Before Buying

Network Switches Market Size, Share & Industry Trends Growth Analysis Report by Type (Fixed Configuration Switches, Modular Switches), End User, Switching Port (100 MBE & 1 GBE, 2.5 GBE & 5 GBE, 10 GBE, 25 GBE & 50 GBE, 100 GBE, 200 GBE & 400 GBE) and Region – Global Forecast to 2028

Overview

According to MarketsandMarkets, the network switches market is projected to grow from USD 33.0 billion in 2023 to reach USD 45.5 billion by 2028; it is expected to grow at a Compound Annual Growth Rate (CAGR) of 6.6 % from 2023 to 2028.

The need for simplified networking communication management and automation and growing investments in digital platforms coupled with the augmented global demand for data centers is expected to fuel the growth of the network switches market. However, high operational cost of network switches limiting the growth of the network switches industry.

Global Network Switches Market Dynamics

Drivers: Augmented global demand for data centers

Data centers are playing a major role with rising technologies like IoT, AI and 5G. The global data center market is expected to register an impressive growth rate of 7.5%. The market garnered a valuation of USD 101.79 Billion in 2022 and is expected to accumulate a market value of USD 209.8 Billion by 2032. The increase in cloud migration has accelerated growth and expansion of data centers globally, causing major data center operators to expand their footprints. In 2021, U.S. users absorbed 500 megawatts (MW) of data space. Most of the absorption was driven by hyperscalers, the largest occupiers of data centers, which are mostly cloud services firms including Google Cloud, Amazon Web Services (AWS) and Microsoft. For instance, in 2019 Google Cloud plans to build new data centers in Nebraska, South Carolina, Virginia, Nevada and Texas. Similarly, Microsoft unveiled an aggressive plan to build 50 to 100 new data centers across the U.S. These investments will boost the demand for data center network switches. Additionally, there has been a rising number of smart devices like smartphones, IoT based devices, smart TVs, autonomous vehicles, and home appliances. This surge is expected to drive the integration of the chips in the data center servers, which will provide lucrative growth opportunities for the global network switch market.

Restraint: Technological complexity involved in network switches making it vulnerable towards security attacks

Routers, switches, and firewalls, collectively known as Network Infrastructure Devices, which are most important elements of any network. In terms of security, they should be the most hardened devices, however, due to their importance, administrators are seldom inclined to update them to ensure they do not inadvertently affect any network uptime. Network misconfigurations cost companies an average of 9% of annual revenues. It is found of that 96% of the organizations overlook routers and switches auditing resulting in vulnerabilities. One of the most common security weaknesses found in routers and switches is that some network engineers fail to change the default configurations of the devices. This can include administrator login credentials or security settings. This makes easy for hackers to gain access to enterprise servers, causing severe data breaches.


Opportunity: Rising data volumes across enterprises

IT infrastructure has seen tremendous shift with developments in technologies like edge computing, AI, IoT, 5G and Machine learning applications. The application of these technologies across different industry verticals like healthcare & life science, finance, smart agriculture, smart infrastructure, manufacturing retail, logistics, aviation, and defense systems. Additionally, 5G has given huge boost to many industries with its high-speed data transmission and internet coverage to every corner made customer span even wider. With growing customer base and applications, the data loads have increased significantly. These data volumes had to be transferred to servers and storage systems at higher bandwidth, which require advanced network switches for carrying out these operations. Globally 2.5 quintillion bytes data is generated per day. By 2025 this data volumes are further expected to reach 463 exabytes globally. Some major giants like Google, Facebook, Microsoft, and Amazon store at least 1,200 petabytes of information. Adding to this by 2025, there would be 75 billion Internet-of-Things (IoT) devices in the world which adds to data loads across local servers and data center operations. All these trends will bring in more opportunities for network switches market across advancing countries.

Challenge: High operational cost of network switches

Network switches are extremely good for networking operations. They can move enormous amounts of data in milliseconds without ever having to slow down. This makes them perfect for applications which require high bandwidth and low latency – like gamers, video editors and cryptocurrency miners. The R&D cost of network switches is marginally high. The cost of switch goes high with added features like processors, memory, cabling, and connectors. The latest hardware being produced by bigger companies such as Intel and Broadcom usually cost a hundred dollars just for small 5-port models and can easily skyrocket up to thousands of dollars for a 24-48 port switch. However, the cost of the switch gets cheaper with technology becoming more efficient. Additionally, the added security features which is one of the most important aspects of network switch in the present generation, adds up to the overall cost of network switch. Network switches usually last for around four to five years, whereas an industrial switch lasts for 10 years, and hence gradual maintenance is required for uninterrupted functionality. An issue in any of the port of the network switch disrupts the performance of other ports and this creates more load on other ports making the operation difficult. Furthermore, the replacement cost is more since after every cycle these switches have to be replaced with new ones. This increases the cost of operation. Large-scale firms which extract larger data install switches with high durability, but the cost of procurement is quite high.

Global Network Switches Market Ecosystem Analysis


PoE Fixed Configuration Switches to exhibit highest growth during the forecast period.

The fixed configuration network switches include managed, unmanaged and PoE switches. The market for PoE Fixed Configuration Switches is expected to grow at the highest CAGR during the forecast period. The proliferation of power over automation and data center & enterprise networking are major factors influencing the power over ethernet market growth. With PoE network switch, there is no need for users to purchase and install additional electrical wires and outlets, which creates significant savings on installation and maintenance costs and time. Thus, these switches are cost-efficient. Thus , there would be a significant demand for the adoption of PoE switches in the near future.

Network Switches for cloud service providers data center end user segment is expected to grow at a significant CAGR from during forecast period

The cloud service providing industry is set to rise owing to the high efficiency and economies of scale offered by cloud computing. Cloud service providers offer services to several customers from a common shared infrastructure and help companies to save their IT infrastructure cost. Various cloud initiatives by different companies are bringing the network switch market forward. Also, these network switches over cloud assist the connectivity within data centers to support service delivery and back-office functions. To fulfill the bandwidth requirements over managed and unmanaged networks, cloud service providers are increasingly adopting switching solutions to scale up the existing infrastructure and to amend at a higher bandwidth solution. The advancements in networking technologies in this industry demand high scalability and management solutions, which are effectively being addressed by network switches. Thus, there would be an increase in the adoption of network switches by cloud service providers during the forecast period.

Network Switches Market in Asia Pacific Estimated to Grow at the Fastest Rate During the Forecast Period

The network swiches market in Asia Pacific is expected to grow at the highest CAGR during the forecast period. Increasing government initiatives and investments from technologically developing countries in Asia Pacific, such as India, Japan, and China, are driving the increasing deployments of data centers in the region, which in turn is expected to drive the market for network switches. Also, the increasing number of small- and medium-scale enterprises and the adoption of digital technologies in them further drive the demand for network switches. Moreover, the increasing penetration of the internet and the rising population of internet users in the region creates a massive amount of data that drives the demand for cloud-based services. All these parameters generate the need for deployment of network switches across the network infrastructure in data centers.

HIGHEST CAGR MARKET IN 2022
CHINA FASTEST GROWING MARKET IN THE REGION

Recent Developments of Network Switches Market

  • In June 2022, Cisco Systems (US) introduced new Nexus 9000 400G performance options at scale with a migration path to 800G performance in the near future. It has a new compact, modular chassis that offers up to 64 ports of 400G line-rate performance (or up to 128 ports of 100/200G performance). The Nexus 9400 is an ideal solution for customers who want the flexibility of modular line cards in a 4 RU compact form factor leveraging a single 25.6 Tbps industry leading Cisco ASIC. Use cases include compact spine designs and efficient multi-plane scale-out fabric designs enabling gradual transition from 100G to 200G to 400G links.
  • In June 2022, HPE Aruba (US) introduced 400GbE switches that designed for the most demanding environments. The Aruba CX 9300-32D is a next-generation 12.8Tbps, 1U fixed configuration switch with 32 ports of 400GbE that supports port breakouts for 200G, 100G, and 25G. The switch is designed to provide flexible, cost-effective, high-density 100/200/400GbE for servers, storage, and intra-fabric connectivity.
  • In January 2022, Cisco Systems (US) has announced its Cisco Catalyst 9000 portfolio, based on the powerful Unified Access Data Plane (UADP) ASIC silicon, to bring more enterprise-grade switching capabilities to the industrial edge for industries operating in harsh environments and supporting critical infrastructure like utilities, oil and gas, roadways, and rail.

Key Market Players

Want to explore hidden markets that can drive new revenue in Network Switches Market?

Scope of the Report

Report Attribute Details
Market size available for years 2019-2028
Forecast units Value (USD Million/USD Thousand)
Segments Covered Type, End User, Switching Port and Region
Geographies covered North America, Europe, Asia Pacific, and RoW

Key Questions Addressed by the Report

What will be the dynamics for the adoption of network switches market based on type?
The fixed configuration switches segment held the largest share of the network switches market in 2022 and is expected to retain its dominant position throughout the forecast period. Fixed configuration switches include managed, unmanaged and PoE switches. The reason for the growth can be attributed to the fact that fixed configuration switches provide ethernet switching solutions for a variety of applications, including enterprise branch offices, campus, midsize companies, and small and medium-sized business (SMB), and provide access security, sustainability, operations excellence, and enhanced work experience. These factors play a vital role in fueling the demand for fixed configuration switches across the globe.
Which switching port will contribute more to the overall market share by 2028?
The 100 MBE & 1 GBE switching port will contribute the most to the network switches market. The market for 100 MBE & 1 GBE switching port segment is expected to account for largest share of the network switches market during the forecast period. This can be attributed to the increasing adoption of 100 MBE & 1 GBE switching ports in non-data center applications like small businesses, campuses of universities and k-12 schools. For many small businesses, a 1 GbE switch is sufficient when transferring data. These devices support a bandwidth of up to 1000Mbps which is a drastic improvement on the 100Mbps of Fast Ethernet.
How will technological developments such as Artificial Intelligence (AI) technology, machine learning (ML) technology change the network switches landscape in the future?
Today, many Ethernet switches feature software, or they can connect with software that takes in and analyzes data that the switch collects. By applying artificial intelligence (AI) and machine learning (ML), that data can be turned into actionable data and used to optimize smart environments. Several established network switches vendors are introducing network switches that possess advanced AI/ML capabilities.
Which region is expected to adopt network switches at a fast rate?
Asia Pacific region is expected to adopt network switches at the fastest rate. Developing countries such as India and China are expected to have a high potential for the future growth of the market.
What are the key market dynamics influencing market growth? How will they turn into strengths or weaknesses of companies operating in the market space?
Network operators are looking for a more simplified network management systems which can not only make the operation automatic but also reduce the effort of managing such a huge network channel. Switches allow devices to share and transfer data, enabling communication between devices on the network. Switches work by processing packets of data and routing them to the intended destination. A simplified network switches consisting of network switches can reduce cost, minimize downtime, and provide the performance and resiliency needed to support an agile business.


Personalize This Research

  • Triangulate with your Own Data
  • Get Data as per your Format and Definition
  • Gain a Deeper Dive on a Specific Application, Geography, Customer or Competitor
  • Any level of Personalization
Request A Free Customisation

Let Us Help You

  • What are the Known and Unknown Adjacencies Impacting the Network Switches Market
  • What will your New Revenue Sources be?
  • Who will be your Top Customer; what will make them switch?
  • Defend your Market Share or Win Competitors
  • Get a Scorecard for Target Partners
Customized Workshop Request

Table of Contents

Exclusive indicates content/data unique to MarketsandMarkets and not available with any competitors.

TITLE
PAGE NO
INTRODUCTION
23
RESEARCH METHODOLOGY
27
EXECUTIVE SUMMARY
38
PREMIUM INSIGHTS
43
MARKET OVERVIEW
47
  • 5.1 INTRODUCTION
  • 5.2 MARKET DYNAMICS
    DRIVERS
    - Need for simplified networking communications management and automation
    - Augmented global demand for data centers
    - Growing investments in digital platforms
    RESTRAINTS
    - Susceptibility of network switches to security attacks due to technological complexities
    OPPORTUNITIES
    - Rising data volumes across enterprises
    - Exponential growth in number of devices and technologies that require network connectivity
    CHALLENGES
    - High operational cost of network switches
    - Lack of trained employees for handling network switches
  • 5.3 VALUE CHAIN ANALYSIS
    EXPERTS RESPONSIBLE FOR PLANNING AND REVISING FUNDS
    RESEARCH AND DEVELOPMENT ENGINEERS
    HARDWARE PROVIDERS
    SYSTEM INTEGRATORS AND RESELLERS
    DISTRIBUTORS AND SUPPLIERS
    END USERS
    AFTER-SALES SERVICE PROVIDERS
  • 5.4 ECOSYSTEM/MARKET MAP
  • 5.5 TRENDS/DISRUPTIONS IMPACTING CUSTOMER BUSINESS
  • 5.6 PORTER’S FIVE FORCES ANALYSIS
    INTENSITY OF COMPETITIVE RIVALRY
    BARGAINING POWER OF SUPPLIERS
    BARGAINING POWER OF BUYERS
    THREAT OF SUBSTITUTES
    THREAT OF NEW ENTRANTS
  • 5.7 KEY STAKEHOLDERS AND BUYING CRITERIA
    BUYING CRITERIA
  • 5.8 CASE STUDIES
    CARILION CLINIC IMPROVED NETWORK PERFORMANCE WITH CISCO CATALYST SERIES SWITCHES
    ALBERT MAGNUS IMPLEMENTED COMMSCOPE’S RUCKUS SERIES NETWORK SWITCHES TO ACHIEVE BETTER WI-FI EXPERIENCE
    MULTINATIONAL MEDIA COMPANY LEVERAGED SWITCHES FROM KYNDRYL TO UPGRADE NETWORK INFRASTRUCTURE
    HOTEL IN MALAYSIA UPGRADED SECURITY LEVELS WITH VOLKTEK’S POE SWITCHES
    ALARMPRO HELPED FOOD PROCESSING COMPANY ELIMINATE NETWORK DOWNTIME AND ENABLE ROUND-THE-CLOCK EFFICIENCY
  • 5.9 TECHNOLOGY ANALYSIS
    KEY TECHNOLOGIES
    - Terabit switching technology
    - AI/ML technology
    - Security services
    - Remote management services
    ADJACENT TECHNOLOGIES
    - Co-packaged optics (CPO)
    - ESnet6
  • 5.10 TRADE ANALYSIS
    IMPORT SCENARIO
    - Import scenario for network switches
    EXPORT SCENARIO
    - Export scenario for network switches
  • 5.11 PATENT ANALYSIS
  • 5.12 TARIFFS
  • 5.13 REGULATORY LANDSCAPE
  • 5.14 KEY CONFERENCES AND EVENTS, 2022–2023
  • 5.15 PRICING ANALYSIS
    AVERAGE SELLING PRICE OF NETWORK SWITCHES OFFERED BY KEY PLAYERS, BY SWITCHING PORT
NETWORK SWITCHES MARKET, BY TYPE
85
  • 6.1 INTRODUCTION
  • 6.2 FIXED CONFIGURATION SWITCHES
    USE CASE: UNIVERSITY HOSPITAL SCHLESWIG-HOLSTEIN (UKSH) DELIVERS IMPROVED PERFORMANCE AND RELIABILITY WITH ARISTA CAMPUS NETWORK
    MANAGED SWITCHES
    - Fully configurable, scalable, and customizable attributes to drive market
    - Use case: Deployment of 10 G switching solution on government police force premises
    UNMANAGED SWITCHES
    - Applicability in small networks to generate demand
    - Use case: Huawei CloudFabric upgraded NIC.br’s IXP network
    POWER OVER ETHERNET (POE) SWITCHES
    - Capability to transmit both power and data simultaneously through Ethernet cable to fuel market
    - Use case: Norfolk Southern redefined employee experience with Cisco Smart Building solutions
  • 6.3 MODULAR SWITCHES
    FLEXIBILITY IN CONFIGURATION AND SCALABILITY TO BOOST MARKET GROWTH
    USE CASE: JUNIPER’S NETWORK SWITCHES HELPED CENGN TO CREATE MULTISITE DATA CENTER FABRIC FOR SMES
COMMON FEATURES OF NETWORK SWITCHES
102
  • 7.1 INTRODUCTION
  • 7.2 VIRTUAL LOCAL REA NETWORK (VLAN)
    IMPROVES PERFORMANCE, TIGHTENS SECURITY, AND EASES ADMINISTRATION
  • 7.3 BRIDGE
    TYPICALLY OPERATES AT DATA LINK LAYER (LAYER 2) OF OSI MODEL
  • 7.4 ACCESS CONTROL LIST (ACL)
    CAN BE USED TO IMPROVE NETWORK SECURITY BY KEEPING OUT MALICIOUS TRAFFIC
  • 7.5 DYNAMIC HOST CONFIGURATION PROTOCOL (DHCP)
    AUTOMATICALLY UPGRADES SOFTWARE ON CLIENT SYSTEMS
NETWORK SWITCHES MARKET, BY SWITCHING PORT
105
  • 8.1 INTRODUCTION
  • 8.2 100 MBE & 1 GBE
    LOW LATENCY, GOOD PERFORMANCE, AND HIGH DENSITY FEATURES TO SUPPORT MARKET GROWTH
    USE CASE: ITN (UK) CHOSE ARISTA NETWORKS FOR MAJOR SMPTE ST2110 MEDIA NETWORK UPGRADE
  • 8.3 2.5 GBE & 5 GBE
    RISING ADOPTION BY ENTERPRISES AND HOMES TO DRIVE MARKET
    USE CASE: NSK GMBH & CO. KG BUILT ENTERPRISE NETWORK WITH FS SWITCHES
  • 8.4 10 GBE
    COST-EFFECTIVENESS AND LOW LATENCY BENEFITS TO BOOST DEMAND FOR 10 GBE SWITCHING PORTS IN LARGE-SCALE ENTERPRISES
    USE CASE: MAHARASHTRA STATE POWER GENERATION CO. LTD., (INDIA) LEVERAGED ETHERNET SWITCHES TO UPGRADE ITS NETWORK
    - Use case: FIS-ASP selected Arista Networks to achieve high resiliency, scalability, and automation
  • 8.5 25 GBE & 50 GBE
    HIGH-SPEED DESKTOP CONNECTIVITY AND FLEXIBLE WIRELESS CONNECTIVITY FEATURES TO GENERATE DEMAND FOR 25 GBE & 50 GBE SWITCHING PORTS
    USE CASE: SMC CORPORATION RUNS ARISTA’S CAMPUS WIRED AND WIRELESS SOLUTIONS GLOBALLY
    USE CASE: AUTOMATED NETWORK OPERATIONS HELP FIRST BANK DELIVER BETTER CLIENT EXPERIENCES
  • 8.6 100 GBE
    ADOPTION BY LARGE ENTERPRISES FOR ACHIEVING HIGHER DATA SPEEDS AND GREATER BANDWIDTH TO PROPEL MARKET
    USE CASE: UNIVERSITY OF SOUTH CAROLINA DEPLOYED JUNIPER’S 100 GBPS NETWORK TO ADVANCE RESEARCH AGENDA
    USE CASE: ARISTA NETWORKS HELPED FACEBOOK REIMAGINE ITS DATA CENTERS
    USE CASE: ARISTA NETWORKS DELIVERED CLOUD NETWORKING BASED ON MODERN LEAF-SPINE ARCHITECTURE AND AUTOMATION PRINCIPLES TO TÜRK TELEKOM
  • 8.7 200 GBE & 400 GBE
    SUPERIOR PERFORMANCE IN ENTERPRISE DATA CENTERS AND STORAGE ENVIRONMENTS TO PROPEL DEMAND FOR 200 GBE & 400 GBE SWITCHING PORTS
    USE CASE: OZON GROUP USED ARISTA’S 400 G MICROSERVICES ARCHITECTURE TO UPGRADE ITS NETWORK
    USE CASE: AMERITRUST LEVERAGES 400 GBE QFX SERIES SWITCHES OFFERED BY JUNIPER NETWORKS IN ITS NETWORK
NETWORK SWITCHES MARKET, BY END USER
114
  • 9.1 INTRODUCTION
  • 9.2 DATA CENTER
    USE CASE: CISCO HELPED BOSCH TRANSFORM ITS DATA CENTER
    USE CASE: HUAWEI’S MODULAR DATA CENTER HELPED BUILD CLOUD INFRASTRUCTURE IN LUZHOU
    TELECOM SERVICE PROVIDERS
    - Use network switches for optimum interconnectivity and monitoring
    - Use case: Huawei CloudFabric upgraded NIC.br’s IXP network
    - Use case: Arqiva selected Arista Networks for innovative transition to All-IP communication infrastructure
    CLOUD SERVICE PROVIDERS
    - Leverage network switches to enhance operational efficiency of networking infrastructure
    - Use case: Nokia (Finland) selected to supply data center switches for Microsoft’s Azure cloud
    - Use case: MacStadium automated and simplified its software-defined infrastructure and unified tooling with Cisco
    LARGE ENTERPRISES/PRIVATE CLOUD
    - Use network switches to improve network performance in terms of monitoring and management
    - Use case: Carilion Clinic used Cisco’s data center network switches to improve network performance
  • 9.3 NON-DATA CENTER
    ETHERNET SWITCHES DEPLOYED IN UNIVERSITY CAMPUSES, K-12 SCHOOLS, ADMINISTRATION BLOCKS, TOWN CENTERS, SHOPPING MALLS, OR MILITARY BASES
    - Use case: Kent State University enhances student experiences with Aruba’s network switches
NETWORK SWITCHES MARKET, BY REGION
130
  • 10.1 INTRODUCTION
  • 10.2 NORTH AMERICA
    IMPACT OF RECESSION ON NORTH AMERICA
    US
    - US to dominate North American network switches market during forecast period
    - Use case: Kaleida Health (US) leveraged network switches from Cisco Systems (US) to align and automate its two data centers
    - Use case: Fresno Pacific University (US) used network switches from HPE Aruba to streamline deployment and management of its networking infrastructure
    - Use case: Sheraton Hotels & Resorts leveraged switching solution from D-Link Corporation to address networking needs
    CANADA
    - Canada to hold significant share of North American market during forecast period
    - Use case: Canada-based internet service provider leveraged network switches from NETGEAR to facilitate network expansion
    MEXICO
    - Expanding telecommunications industry to drive market
  • 10.3 EUROPE
    IMPACT OF RECESSION ON EUROPE
    UK
    - Presence of numerous data centers to foster market growth
    - Use case: Hawk-Eye (UK) chose Netgear’s switching solutions for network connectivity
    - Use case: Aneurin Bevan University (UK) leveraged Cisco’s Catalyst switches for network upgrade
    - Use case: University of Reading (UK) leveraged Juniper’s EX Series Ethernet Switches to upgrade its campus network
    GERMANY
    - Focus on development of 6G to create opportunities for network switch vendors
    - Use case: Daimler AG (Germany) created blueprint for global data centers with Cisco’s Nexus 9000 Switches
    - Use case: Airbus Helicopter (Germany) deployed network switches to upgrade its data center
    ITALY
    - Growing cloud investments to create opportunities for deployment of network switches
    - Use case: Kuwait Petroleum Italia (Italy) leveraged network switches from D-Link Corporation for its networking solution
    FRANCE
    - Increasing focus on 5G rollout to contribute to market growth
    - Use case: Gamestream (France) scaled its Gaming-as-a-Service Solution with Netgear’s M4300 switches
    SPAIN
    - Public cloud adoption to push market growth
    REST OF EUROPE
    - Use case: D-Link collaborated with aQuestora to provide switches for consumer glass fiber network
    - Use case: Colruyt Group (Belgium) selected Juniper Networks’ switches to support its digital transformation
  • 10.4 ASIA PACIFIC
    IMPACT OF RECESSION ON ASIA PACIFIC
    CHINA
    - China to dominate network switches market in Asia Pacific during forecast period
    - Use case: Sunwah Kingsway (Hong Kong, China) leveraged network switches from H3C (China) to simplify its network infrastructure
    JAPAN
    - Demand for high bandwidth to propel market growth
    - Use case: Rakuten Mobile built world’s first cloud-native, software-defined 5G network
    INDIA
    - Unprecedented increase in data consumption to fuel demand for network switches
    - Use case: Deployment of Layer 2 Metro Ethernet switches for Indian Railways
    SOUTH KOREA
    - Increasing focus on 5G rollout to drive market
    - Use case: SK Telecom (South Korea) leveraged network switches offered by Arista Networks (US) for building its data center network
    REST OF ASIA PACIFIC
    - Use case: Doane University (Australia) leveraged network switches from Aruba Networks for network upgrade
    - Use case: Vessel Instrument Networks (Australia) leveraged Moxa’s network switches for network building
    - Use case: EVA Air (Taiwan) deployed switches from Juniper Networks to simplify its networks
  • 10.5 REST OF THE WORLD
    IMPACT OF RECESSION ON REST OF THE WORLD
    MIDDLE EAST & AFRICA
    - Adoption of cloud services to foster market growth
    - Use case: Dur Hospitality (Saudi Arabia) deployed Huawei's network switches to improve network performance
    SOUTH AMERICA
    - South America to hold larger share of RoW network switches market during forecast period
    - Use case: Instituto Tecnológico Metropolitano (ITM) (South America) leverages PoE-enabled installation switches
COMPETITIVE LANDSCAPE
169
  • 11.1 OVERVIEW
  • 11.2 REVENUE ANALYSIS
  • 11.3 MARKET SHARE ANALYSIS, 2022
  • 11.4 COMPANY EVALUATION QUADRANT, 2022
    STARS
    EMERGING LEADERS
    PERVASIVE PLAYERS
    PARTICIPANTS
  • 11.5 STARTUPS/SMES EVALUATION MATRIX
    PROGRESSIVE COMPANIES
    RESPONSIVE COMPANIES
    DYNAMIC COMPANIES
    STARTING BLOCKS
  • 11.6 NETWORK SWITCHES MARKET: COMPANY FOOTPRINT
  • 11.7 COMPETITIVE SCENARIOS AND TRENDS
    PRODUCT LAUNCHES
    DEALS
    OTHERS
COMPANY PROFILES
207
  • 12.1 KEY PLAYERS
    HUAWEI TECHNOLOGIES
    - Business overview
    - Products/Solutions/Services offered
    - Recent developments
    - MnM view
    JUNIPER NETWORKS
    - Business overview
    - Products/Solutions/Services offered
    - Recent developments
    - MnM view
    CISCO SYSTEMS
    - Business overview
    - Products/Solutions/Services offered
    - Recent developments
    - MnM view
    ARISTA NETWORKS
    - Business overview
    - Products/Solutions/Services offered
    - Recent developments
    - MnM view
    HPE ARUBA
    - Business overview
    - Products/Solutions/Services offered
    - Recent developments
    - MnM view
    D-LINK CORPORATION
    - Business overview
    - Products/Solutions/Services offered
    - Recent developments
    NETGEAR
    - Business overview
    - Products/Solutions/Services offered
    - Recent developments
    EXTREME NETWORKS
    - Business overview
    - Products/Solutions/Services offered
    - Recent developments
    NVIDIA CORPORATION
    - Business overview
    - Products/Solutions/Services offered
    - Recent developments
    TRENDNET, INC.
    - Business overview
    - Products/Solutions/Services offered
    - Recent developments
    LANTRONIX
    - Business overview
    - Products/Solutions/Services offered
    - Recent developments
  • 12.2 OTHER PLAYERS
    ALCATEL-LUCENT ENTERPRISE
    IBM CORPORATION
    DELL TECHNOLOGIES
    PICA8, INC.
    LARCH NETWORK, LTD.
    STORDIS
    IP INFUSION
    BUFFALO AMERICAS INC.
    LINKSYS HOLDINGS, INC.
    TELEFLY TELECOMMUNICATIONS EQUIPMENT CO., LTD.
    ALLIED TELESIS, INC.
    MOXA INC.
    BLACK BOX CORPORATION
    BELDEN INC.
    TP-LINK CORPORATION LIMITED
APPENDIX
326
  • 13.1 DISCUSSION GUIDE
  • 13.2 KNOWLEDGESTORE: MARKETSANDMARKETS’ SUBSCRIPTION PORTAL
  • 13.3 CUSTOMIZATION OPTIONS
  • 13.4 RELATED REPORTS
  • 13.5 AUTHOR DETAILS
LIST OF TABLES
 
  • TABLE 1 PLAYERS AND THEIR ROLE IN ECOSYSTEM
  • TABLE 2 IMPACT OF PORTERS FIVE FORCES ON NETWORK SWITCHES MARKET
  • TABLE 3 INFLUENCE OF STAKEHOLDERS ON BUYING PROCESS FOR TOP THREE END USERS (%)
  • TABLE 4 KEY BUYING CRITERIA FOR TOP THREE END USERS
  • TABLE 5 IMPORT DATA, BY COUNTRY, 2017–2021 (USD MILLION)
  • TABLE 6 EXPORT DATA, BY COUNTRY, 2017–2021 (USD MILLION)
  • TABLE 7 NUMBER OF PATENTS REGISTERED IN NETWORK SWITCHES MARKET FROM 2013 TO 2022
  • TABLE 8 LIST OF MAJOR PATENTS RELATED TO NETWORK SWITCHES MARKET
  • TABLE 9 MFN TARIFF FOR NETWORK SWITCHES EXPORTED BY US
  • TABLE 10 MFN TARIFF FOR NETWORK SWITCHES EXPORTED BY CHINA
  • TABLE 11 MFN TARIFF FOR NETWORK SWITCHES EXPORTED BY US
  • TABLE 12 NORTH AMERICA: LIST OF REGULATORY BODIES, GOVERNMENT AGENCIES, AND OTHER ORGANIZATIONS
  • TABLE 13 EUROPE: LIST OF REGULATORY BODIES, GOVERNMENT AGENCIES, AND OTHER ORGANIZATIONS
  • TABLE 14 ASIA PACIFIC: LIST OF REGULATORY BODIES, GOVERNMENT AGENCIES, AND OTHER ORGANIZATIONS
  • TABLE 15 REST OF THE WORLD: LIST OF REGULATORY BODIES, GOVERNMENT AGENCIES, AND OTHER ORGANIZATIONS
  • TABLE 16 NETWORK SWITCHES MARKET: DETAILED LIST OF CONFERENCES AND EVENTS
  • TABLE 17 PRICE RANGE OF NETWORK SWITCHES OFFERED BY DIFFERENT PLAYERS
  • TABLE 18 PRICE RANGE OF DIFFERENT MODELS OF NETWORK SWITCHES, BY APPLICATION AND VENDOR
  • TABLE 19 AVERAGE SELLING PRICE OF NETWORK SWITCHES OFFERED BY KEY PLAYERS, BY SWITCHING PORT (USD)
  • TABLE 20 NETWORK SWITCHES MARKET, BY TYPE, 2019–2022 (USD BILLION)
  • TABLE 21 NETWORK SWITCHES MARKET, BY TYPE, 2023–2028 (USD BILLION)
  • TABLE 22 FIXED CONFIGURATION SWITCHES: NETWORK SWITCHES MARKET, BY TYPE, 2019–2022 (USD BILLION)
  • TABLE 23 FIXED CONFIGURATION SWITCHES: NETWORK SWITCHES MARKET, BY TYPE, 2023–2028 (USD BILLION)
  • TABLE 24 FIXED CONFIGURATION SWITCHES: NETWORK SWITCHES MARKET, BY REGION, 2019–2022 (USD BILLION)
  • TABLE 25 FIXED CONFIGURATION SWITCHES: NETWORK SWITCHES MARKET, BY REGION, 2023–2028 (USD BILLION)
  • TABLE 26 FIXED CONFIGURATION SWITCHES: NETWORK SWITCHES MARKET, BY END USER, 2019–2022 (USD BILLION)
  • TABLE 27 FIXED CONFIGURATION SWITCHES: NETWORK SWITCHES MARKET, BY END USER, 2023–2028 (USD BILLION)
  • TABLE 28 FIXED CONFIGURATION SWITCHES: NETWORK SWITCHES MARKET FOR DATA CENTERS, BY END USER, 2019–2022 (USD BILLION)
  • TABLE 29 FIXED CONFIGURATION SWITCHES: NETWORK SWITCHES MARKET FOR DATA CENTERS, BY END USER, 2023–2028 (USD BILLION)
  • TABLE 30 MANAGED SWITCHES: NETWORK SWITCHES MARKET, BY REGION, 2019–2022 (USD BILLION)
  • TABLE 31 MANAGED SWITCHES: NETWORK SWITCHES MARKET, BY REGION, 2023–2028 (USD BILLION)
  • TABLE 32 MANAGED SWITCHES: NETWORK SWITCHES MARKET, BY END USER, 2019–2022 (USD BILLION)
  • TABLE 33 MANAGED SWITCHES: NETWORK SWITCHES MARKET, BY END USER, 2023–2028 (USD BILLION)
  • TABLE 34 MANAGED SWITCHES: NETWORK SWITCHES MARKET FOR DATA CENTERS, BY END USER, 2019–2022 (USD BILLION)
  • TABLE 35 MANAGED SWITCHES: NETWORK SWITCHES MARKET FOR DATA CENTERS, BY END USER, 2023–2028 (USD BILLION)
  • TABLE 36 UNMANAGED SWITCHES: NETWORK SWITCHES MARKET, BY REGION, 2019–2022 (USD MILLION)
  • TABLE 37 UNMANAGED SWITCHES: NETWORK SWITCHES MARKET, BY REGION, 2023–2028 (USD MILLION)
  • TABLE 38 UNMANAGED SWITCHES: NETWORK SWITCHES MARKET, BY END USER, 2019–2022 (USD BILLION)
  • TABLE 39 UNMANAGED SWITCHES: NETWORK SWITCHES MARKET, BY END USER, 2023–2028 (USD BILLION)
  • TABLE 40 UNMANAGED SWITCHES: NETWORK SWITCHES MARKET FOR DATA CENTERS, BY END USER, 2019–2022 (USD BILLION)
  • TABLE 41 UNMANAGED SWITCHES: NETWORK SWITCHES MARKET FOR DATA CENTERS, BY END USER, 2023–2028 (USD BILLION)
  • TABLE 42 POE SWITCHES: NETWORK SWITCHES MARKET, BY REGION, 2019–2022 (USD MILLION)
  • TABLE 43 POE SWITCHES: NETWORK SWITCHES MARKET, BY REGION, 2023–2028 (USD MILLION)
  • TABLE 44 POE SWITCHES: NETWORK SWITCHES MARKET, BY END USER, 2019–2022 (USD BILLION)
  • TABLE 45 POE SWITCHES: NETWORK SWITCHES MARKET, BY END USER, 2023–2028 (USD BILLION)
  • TABLE 46 POE SWITCHES: NETWORK SWITCHES MARKET FOR DATA CENTERS, BY END USER, 2019–2022 (USD MILLION)
  • TABLE 47 POE SWITCHES: NETWORK SWITCHES MARKET FOR DATA CENTERS, BY END USER, 2023–2028 (USD MILLION)
  • TABLE 48 MODULAR SWITCHES: NETWORK SWITCHES MARKET, BY REGION, 2019–2022 (USD MILLION)
  • TABLE 49 MODULAR SWITCHES: NETWORK SWITCHES MARKET, BY REGION, 2023–2028 (USD MILLION)
  • TABLE 50 MODULAR SWITCHES: NETWORK SWITCHES MARKET, BY END USER, 2019–2022 (USD BILLION)
  • TABLE 51 MODULAR SWITCHES: NETWORK SWITCHES MARKET, BY END USER, 2023–2028 (USD BILLION)
  • TABLE 52 MODULAR SWITCHES: NETWORK SWITCHES MARKET FOR DATA CENTERS, BY END USER, 2019–2022 (USD BILLION)
  • TABLE 53 MODULAR SWITCHES: NETWORK SWITCHES MARKET FOR DATA CENTERS, BY END USER, 2023–2028 (USD BILLION)
  • TABLE 54 NETWORK SWITCHES MARKET, BY SWITCHING PORT, 2019–2022 (USD MILLION)
  • TABLE 55 NETWORK SWITCHES MARKET, BY SWITCHING PORT, 2023–2028 (USD MILLION)
  • TABLE 56 NETWORK SWITCHES MARKET, BY SWITCHING PORT, 2019–2022 (MILLION PORTS)
  • TABLE 57 NETWORK SWITCHES MARKET, BY SWITCHING PORT, 2023–2028 (MILLION PORTS)
  • TABLE 58 NETWORK SWITCHES MARKET, BY END USER, 2019–2022 (USD BILLION)
  • TABLE 59 NETWORK SWITCHES MARKET, BY END USER, 2023–2028 (USD BILLION)
  • TABLE 60 DATA CENTER: NETWORK SWITCHES MARKET, BY TYPE, 2019–2022 (USD BILLION)
  • TABLE 61 DATA CENTER: NETWORK SWITCHES MARKET, BY TYPE, 2023–2028 (USD BILLION)
  • TABLE 62 DATA CENTER: NETWORK SWITCHES MARKET FOR FIXED CONFIGURATION SWITCHES, BY TYPE, 2019–2022 (USD BILLION)
  • TABLE 63 DATA CENTER: NETWORK SWITCHES MARKET FOR FIXED CONFIGURATION SWITCHES, BY TYPE, 2023–2028 (USD BILLION)
  • TABLE 64 DATA CENTER: NETWORK SWITCHES MARKET, BY END USER, 2019–2022 (USD BILLION)
  • TABLE 65 DATA CENTER: NETWORK SWITCHES MARKET, BY END USER, 2023–2028 (USD BILLION)
  • TABLE 66 TELCOM SERVICE PROVIDERS: NETWORK SWITCHES MARKET, BY TYPE, 2019–2022 (USD BILLION)
  • TABLE 67 TELCOM SERVICE PROVIDERS: NETWORK SWITCHES MARKET, BY TYPE, 2023–2028 (USD BILLION)
  • TABLE 68 TELCOM SERVICE PROVIDERS: NETWORK SWITCHES MARKET FOR FIXED CONFIGURATION SWITCHES, BY TYPE, 2019–2022 (USD MILLION)
  • TABLE 69 TELCOM SERVICE PROVIDERS: NETWORK SWITCHES MARKET FOR FIXED CONFIGURATION SWITCHES, BY TYPE, 2023–2028 (USD MILLION)
  • TABLE 70 CLOUD SERVICE PROVIDERS: NETWORK SWITCHES MARKET, BY TYPE, 2019–2022 (USD BILLION)
  • TABLE 71 CLOUD SERVICE PROVIDERS: NETWORK SWITCHES MARKET, BY TYPE, 2023–2028 (USD BILLION)
  • TABLE 72 CLOUD SERVICE PROVIDERS: NETWORK SWITCHES MARKET FOR FIXED CONFIGURATION SWITCHES, BY TYPE, 2019–2022 (USD BILLION)
  • TABLE 73 CLOUD SERVICE PROVIDERS: NETWORK SWITCHES MARKET FOR FIXED CONFIGURATION SWITCHES, BY TYPE, 2023–2028 (USD BILLION)
  • TABLE 74 LARGE ENTERPRISES/PRIVATE CLOUD: NETWORK SWITCHES MARKET, BY TYPE, 2019–2022 (USD BILLION)
  • TABLE 75 LARGE ENTERPRISES/PRIVATE CLOUD: NETWORK SWITCHES MARKET, BY TYPE, 2023–2028 (USD BILLION)
  • TABLE 76 LARGE ENTERPRISES/PRIVATE CLOUD: NETWORK SWITCHES MARKET FOR FIXED CONFIGURATION SWITCHES, BY TYPE, 2019–2022 (USD BILLION)
  • TABLE 77 LARGE ENTERPRISES/PRIVATE CLOUD: NETWORK SWITCHES MARKET FOR FIXED CONFIGURATION SWITCHES, BY TYPE, 2023–2028 (USD BILLION)
  • TABLE 78 NON-DATA CENTER: NETWORK SWITCHES MARKET, BY TYPE, 2019–2022 (USD BILLION)
  • TABLE 79 NON-DATA CENTER: NETWORK SWITCHES MARKET, BY TYPE, 2023–2028 (USD BILLION)
  • TABLE 80 NON-DATA CENTER: NETWORK SWITCHES MARKET FOR FIXED CONFIGURATION SWITCHES, BY TYPE, 2019–2022 (USD BILLION)
  • TABLE 81 NON-DATA CENTER: NETWORK SWITCHES MARKET FOR FIXED CONFIGURATION SWITCHES, BY TYPE, 2023–2028 (USD BILLION)
  • TABLE 82 NETWORK SWITCHES MARKET, BY REGION, 2019–2022 (USD BILLION)
  • TABLE 83 NETWORK SWITCHES MARKET, BY REGION, 2023–2028 (USD BILLION)
  • TABLE 84 NORTH AMERICA: NETWORK SWITCHES MARKET, BY TYPE, 2019–2022 (USD BILLION)
  • TABLE 85 NORTH AMERICA: NETWORK SWITCHES MARKET, BY TYPE, 2023–2028 (USD BILLION)
  • TABLE 86 NORTH AMERICA: NETWORK SWITCHES MARKET FOR FIXED CONFIGURATION SWITCHES, BY TYPE, 2019–2022 (USD BILLION)
  • TABLE 87 NORTH AMERICA: NETWORK SWITCHES MARKET FOR FIXED CONFIGURATION SWITCHES, BY TYPE, 2023–2028 (USD BILLION)
  • TABLE 88 NORTH AMERICA: NETWORK SWITCHES MARKET, BY COUNTRY, 2019–2022 (USD BILLION)
  • TABLE 89 NORTH AMERICA: NETWORK SWITCHES MARKET, BY COUNTRY, 2023–2028 (USD BILLION)
  • TABLE 90 EUROPE: NETWORK SWITCHES MARKET, BY TYPE, 2019–2022 (USD BILLION)
  • TABLE 91 EUROPE: NETWORK SWITCHES MARKET, BY TYPE, 2023–2028 (USD BILLION)
  • TABLE 92 EUROPE: NETWORK SWITCHES MARKET FOR FIXED CONFIGURATION SWITCHES, BY TYPE, 2019–2022 (USD BILLION)
  • TABLE 93 EUROPE: NETWORK SWITCHES MARKET FOR FIXED CONFIGURATION SWITCHES, BY TYPE, 2023–2028 (USD BILLION)
  • TABLE 94 EUROPE: NETWORK SWITCHES MARKET, BY COUNTRY, 2019–2022 (USD MILLION)
  • TABLE 95 EUROPE: NETWORK SWITCHES MARKET, BY COUNTRY, 2023–2028 (USD MILLION)
  • TABLE 96 ASIA PACIFIC: NETWORK SWITCHES MARKET, BY TYPE, 2019–2022 (USD BILLION)
  • TABLE 97 ASIA PACIFIC: NETWORK SWITCHES MARKET, BY TYPE, 2023–2028 (USD BILLION)
  • TABLE 98 ASIA PACIFIC: NETWORK SWITCHES MARKET FOR FIXED CONFIGURATION SWITCHES, BY TYPE, 2019–2022 (USD BILLION)
  • TABLE 99 ASIA PACIFIC: NETWORK SWITCHES MARKET FOR FIXED CONFIGURATION SWITCHES, BY TYPE, 2023–2028 (USD BILLION)
  • TABLE 100 ASIA PACIFIC: NETWORK SWITCHES MARKET, BY COUNTRY, 2019–2022 (USD MILLION)
  • TABLE 101 ASIA PACIFIC: NETWORK SWITCHES MARKET, BY COUNTRY, 2023–2028 (USD MILLION)
  • TABLE 102 REST OF THE WORLD: NETWORK SWITCHES MARKET, BY TYPE, 2019–2022 (USD MILLION)
  • TABLE 103 REST OF THE WORLD: NETWORK SWITCHES MARKET, BY TYPE, 2023–2028 (USD MILLION)
  • TABLE 104 REST OF THE WORLD: NETWORK SWITCHES MARKET FOR FIXED CONFIGURATION SWITCHES, BY TYPE, 2019–2022 (USD BILLION)
  • TABLE 105 REST OF THE WORLD: NETWORK SWITCHES MARKET FOR FIXED CONFIGURATION SWITCHES, BY TYPE, 2023–2028 (USD BILLION)
  • TABLE 106 REST OF THE WORLD: NETWORK SWITCHES MARKET, BY REGION, 2019–2022 (USD MILLION)
  • TABLE 107 REST OF THE WORLD: NETWORK SWITCHES MARKET, BY REGION, 2023–2028 (USD MILLION)
  • TABLE 108 KEY GROWTH STRATEGIES ADOPTED BY MAJOR COMPANIES, 2019–2022
  • TABLE 109 NETWORK SWITCHES MARKET: DEGREE OF COMPETITION
  • TABLE 110 STARTUPS/SMES IN NETWORK SWITCHES MARKET
  • TABLE 111 STARTUPS MATRIX: DETAILED LIST OF KEY STARTUPS/SMES
  • TABLE 112 NETWORK SWITCHES MARKET: COMPETITIVE BENCHMARKING OF KEY STARTUPS/SMES
  • TABLE 113 COMPANY FOOTPRINT
  • TABLE 114 TYPE: COMPANY FOOTPRINT
  • TABLE 115 END USER: COMPANY FOOTPRINT
  • TABLE 116 REGION: COMPANY FOOTPRINT
  • TABLE 117 PRODUCT LAUNCHES, 2019–2022
  • TABLE 118 DEALS, 2019–2022
  • TABLE 119 OTHERS, 2019–2022
  • TABLE 120 HUAWEI TECHNOLOGIES: COMPANY OVERVIEW
  • TABLE 121 HUAWEI TECHNOLOGIES: PRODUCTS/SOLUTIONS/SERVICES OFFERED
  • TABLE 122 HUAWEI TECHNOLOGIES: DEALS
  • TABLE 123 HUAWEI TECHNOLOGIES: PRODUCT LAUNCHES
  • TABLE 124 JUNIPER NETWORKS: COMPANY OVERVIEW
  • TABLE 125 JUNIPER NETWORKS: PRODUCTS/SOLUTIONS/SERVICES OFFERED
  • TABLE 126 JUNIPER NETWORKS: PRODUCT LAUNCHES
  • TABLE 127 JUNIPER NETWORKS: DEALS
  • TABLE 128 CISCO SYSTEMS: COMPANY OVERVIEW
  • TABLE 129 CISCO SYSTEMS: PRODUCTS/SOLUTIONS/SERVICES OFFERED
  • TABLE 130 CISCO SYSTEMS: PRODUCT LAUNCHES
  • TABLE 131 CISCO SYSTEMS: DEALS
  • TABLE 132 ARISTA NETWORKS: BUSINESS OVERVIEW
  • TABLE 133 ARISTA NETWORKS: PRODUCTS/SOLUTIONS/SERVICES OFFERED
  • TABLE 134 ARISTA NETWORKS: PRODUCT LAUNCHES
  • TABLE 135 ARISTA NETWORKS: DEALS
  • TABLE 136 HPE ARUBA: COMPANY OVERVIEW
  • TABLE 137 HPE ARUBA: PRODUCTS/SOLUTIONS/SERVICES OFFERED
  • TABLE 138 HPE ARUBA: PRODUCT LAUNCHES
  • TABLE 139 HPE ARUBA: DEALS
  • TABLE 140 HPE ARUBA: OTHERS
  • TABLE 141 D-LINK CORPORATION: COMPANY OVERVIEW
  • TABLE 142 D-LINK CORPORATION: PRODUCTS/SOLUTIONS/SERVICES OFFERED
  • TABLE 143 D-LINK CORPORATION: PRODUCT LAUNCHES
  • TABLE 144 NETGEAR: COMPANY OVERVIEW
  • TABLE 145 NETGEAR: PRODUCTS/SOLUTIONS/SERVICES OFFERED
  • TABLE 146 NETGEAR: PRODUCT LAUNCHES
  • TABLE 147 NETGEAR: DEALS
  • TABLE 148 EXTREME NETWORKS: COMPANY OVERVIEW
  • TABLE 149 EXTREME NETWORKS: PRODUCTS/SOLUTIONS/SERVICES OFFERED
  • TABLE 150 EXTREME NETWORKS: PRODUCT LAUNCHES
  • TABLE 151 EXTREME NETWORKS: DEALS
  • TABLE 152 NVIDIA CORPORATION: COMPANY OVERVIEW
  • TABLE 153 NVIDIA CORPORATION: PRODUCTS/SOLUTIONS/SERVICES OFFERED
  • TABLE 154 NVIDIA CORPORATION: PRODUCT LAUNCHES
  • TABLE 155 NVIDIA CORPORATION: DEALS
  • TABLE 156 TRENDNET, INC.: COMPANY OVERVIEW
  • TABLE 157 TRENDNET, INC.: PRODUCTS/SOLUTIONS/SERVICES OFFERED
  • TABLE 158 TRENDNET, INC.: PRODUCT LAUNCHES
  • TABLE 159 TRENDNET, INC.: DEALS
  • TABLE 160 LANTRONIX: COMPANY OVERVIEW
  • TABLE 161 LANTRONIX: PRODUCTS/SOLUTIONS/SERVICES OFFERED
  • TABLE 162 LANTRONIX: DEALS
  • TABLE 163 LANTRONIX: PRODUCT LAUNCHES
LIST OF FIGURES
 
  • FIGURE 1 NETWORK SWITCHES MARKET SEGMENTATION
  • FIGURE 2 NETWORK SWITCHES MARKET: RESEARCH DESIGN
  • FIGURE 3 MARKET SIZE ESTIMATION METHODOLOGY: REVENUE OF MARKET PLAYERS
  • FIGURE 4 MARKET SIZE ESTIMATION METHODOLOGY: BOTTOM-UP APPROACH
  • FIGURE 5 MARKET SIZE ESTIMATION METHODOLOGY: TOP-DOWN APPROACH
  • FIGURE 6 DATA TRIANGULATION
  • FIGURE 7 GDP GROWTH PROJECTION TILL 2023 FOR MAJOR ECONOMIES
  • FIGURE 8 MODULAR SWITCHES SEGMENT TO GROW AT HIGHER CAGR DURING FORECAST PERIOD
  • FIGURE 9 DATA CENTER SEGMENT TO EXHIBIT HIGHER GROWTH DURING FORECAST PERIOD
  • FIGURE 10 200 GBE & 400 GBE SEGMENT TO GROW AT HIGHEST CAGR DURING FORECAST PERIOD
  • FIGURE 11 NORTH AMERICA ACCOUNTED FOR LARGEST SHARE OF NETWORK SWITCHES MARKET IN 2022
  • FIGURE 12 NEED FOR SIMPLIFIED NETWORKING COMMUNICATION MANAGEMENT TO BOOST MARKET
  • FIGURE 13 FIXED CONFIGURATION SWITCHES TO HOLD LARGER MARKET SHARE DURING FORECAST PERIOD
  • FIGURE 14 200 GBE & 400 GBE SEGMENT TO GROW AT HIGHEST CAGR DURING FORECAST PERIOD
  • FIGURE 15 DATA CENTER SEGMENT TO GROW AT HIGHER CAGR DURING FORECAST PERIOD
  • FIGURE 16 NETWORK SWITCHES MARKET TO GROW AT HIGHEST CAGR IN ASIA PACIFIC DURING FORECAST PERIOD
  • FIGURE 17 CHINA AND FIXED CONFIGURATION SWITCHES HELD LARGEST MARKET SHARES, BY COUNTRY AND TYPE, RESPECTIVELY, IN 2022
  • FIGURE 18 CHINA TO RECORD HIGHEST CAGR IN NETWORK SWITCHES MARKET DURING FORECAST PERIOD
  • FIGURE 19 NETWORK SWITCHES MARKET: DRIVERS, RESTRAINTS, OPPORTUNITIES, AND CHALLENGES
  • FIGURE 20 NETWORK SWITCHES MARKET DRIVERS AND THEIR IMPACT
  • FIGURE 21 GLOBAL CLOUD DATA CENTER IP TRAFFIC, 2015–2021
  • FIGURE 22 NETWORK SWITCHES MARKET RESTRAINTS AND THEIR IMPACT
  • FIGURE 23 NETWORK SWITCHES MARKET OPPORTUNITIES AND THEIR IMPACT
  • FIGURE 24 GLOBAL DATA CONSUMPTION VOLUME, 2021–2024
  • FIGURE 25 NETWORK SWITCHES MARKET CHALLENGES AND THEIR IMPACT
  • FIGURE 26 VALUE CHAIN ANALYSIS OF NETWORK SWITCH ECOSYSTEM
  • FIGURE 27 REVENUE SHIFTS AND NEW REVENUE POCKETS FOR NETWORK SWITCH MANUFACTURERS
  • FIGURE 28 NETWORK SWITCHES MARKET: PORTER’S FIVE FORCES ANALYSIS
  • FIGURE 29 KEY STAKEHOLDERS IN BUYING PROCESS
  • FIGURE 30 KEY BUYING CRITERIA FOR TOP THREE END USERS
  • FIGURE 31 TOP 10 COMPANIES WITH HIGHEST NUMBER OF PATENT APPLICATIONS BETWEEN 2013 AND 2022
  • FIGURE 32 NETWORK SWITCHES PATENTS PUBLISHED BETWEEN 2013 AND 2022
  • FIGURE 33 AVERAGE SELLING PRICE OF NETWORK SWITCHES OFFERED BY KEY PLAYERS, BY SWITCHING PORT
  • FIGURE 34 MODULAR SWITCHES SEGMENT TO GROW AT HIGHER CAGR DURING FORECAST PERIOD
  • FIGURE 35 NETWORK SWITCHES MARKET FOR 200 & 400 MBE SWITCHES TO GROW AT HIGHEST CAGR DURING FORECAST PERIOD
  • FIGURE 36 DATA CENTER SEGMENT TO GROW AT HIGHER CAGR DURING FORECAST PERIOD
  • FIGURE 37 TELECOM SERVICE PROVIDERS TO GROW AT HIGHEST CAGR DURING FORECAST PERIOD
  • FIGURE 38 NETWORK SWITCHES MARKET, BY REGION
  • FIGURE 39 NORTH AMERICA TO DOMINATE NETWORK SWITCHES MARKET DURING FORECAST PERIOD
  • FIGURE 40 NORTH AMERICA: NETWORK SWITCHES MARKET SNAPSHOT
  • FIGURE 41 EUROPE: NETWORK SWITCHES MARKET SNAPSHOT
  • FIGURE 42 ASIA PACIFIC: NETWORK SWITCHES MARKET SNAPSHOT
  • FIGURE 43 REST OF THE WORLD: NETWORK SWITCHES MARKET SNAPSHOT
  • FIGURE 44 FOUR-YEAR REVENUE ANALYSIS OF TOP FIVE PLAYERS IN NETWORK SWITCHES MARKET
  • FIGURE 45 MARKET SHARE, 2022
  • FIGURE 46 NETWORK SWITCHES MARKET: COMPANY EVALUATION QUADRANT, 2022
  • FIGURE 47 NETWORK SWITCHES MARKET: STARTUPS/SMES EVALUATION QUADRANT, 2022
  • FIGURE 48 HUAWEI TECHNOLOGIES: COMPANY SNAPSHOT
  • FIGURE 49 JUNIPER NETWORKS: COMPANY SNAPSHOT
  • FIGURE 50 CISCO SYSTEMS: COMPANY SNAPSHOT
  • FIGURE 51 ARISTA NETWORKS: COMPANY SNAPSHOT
  • FIGURE 52 HPE ARUBA: COMPANY SNAPSHOT
  • FIGURE 53 D-LINK CORPORATION: COMPANY SNAPSHOT
  • FIGURE 54 NETGEAR: COMPANY SNAPSHOT
  • FIGURE 55 EXTREME NETWORKS: COMPANY SNAPSHOT
  • FIGURE 56 NVIDIA CORPORATION: COMPANY SNAPSHOT
  • FIGURE 57 LANTRONIX: COMPANY SNAPSHOT

The study involved four major activities in estimating the size for network switches market. Exhaustive secondary research was done to collect information on the market, peer market, and parent market. The next step was to validate these findings, assumptions, and sizing with industry experts across value chains through primary research. The bottom-up approach was employed to estimate the overall market size. After that, market breakdown and data triangulation were used to estimate the market size of segments and subsegments.

Secondary Research

In the secondary research process, various sources were used to identify and collect information important for this study. These include annual reports, press releases & investor presentations of companies, white papers, technology journals, and certified publications, articles by recognized authors, directories, and databases.

Secondary research was mainly used to obtain key information about the supply chain of the industry, the total pool of market players, classification of the market according to industry trends to the bottom-most level, regional markets, and key developments from the market and technology-oriented perspectives.

Primary research was also conducted to identify the segmentation types, key players, competitive landscape, and key market dynamics such as drivers, restraints, opportunities, challenges, and industry trends, along with key strategies adopted by players operating in the network switches market. Extensive qualitative and quantitative analyses were performed on the complete market engineering process to list key information and insights throughout the report.

Primary Research

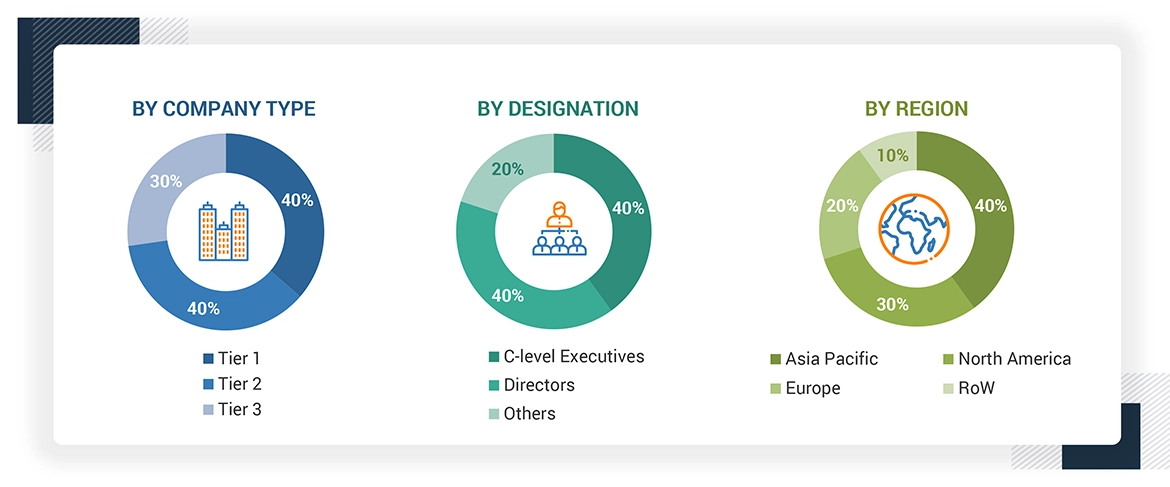
Extensive primary research has been conducted after acquiring knowledge about the network switches market scenario through secondary research. Several primary interviews have been conducted with experts from both demand (end users) and supply side (network switches providers) across 4 major geographic regions: North America, Europe, Asia Pacific, and RoW. Approximately 80% and 20% of the primary interviews have been conducted from the supply and demand side, respectively. These primary data have been collected through questionnaires, emails, and telephonic interviews.
About the assumptions considered for the study, To know download the pdf brochure

Market Size Estimation

In the complete market engineering process, both the top-down and bottom-up approaches were implemented, along with several data triangulation methods, to estimate and validate the size of the network switches market and various other dependent submarkets. Key players in the market were identified through secondary research, and their market share in the respective regions was determined through primary and secondary research. This entire research methodology included the study of annual and financial reports of the top players, as well as interviews with experts (such as CEOs, VPs, directors, and marketing executives) for key insights (quantitative and qualitative).

All percentage shares, splits, and breakdowns were determined using secondary sources and verified through primary sources. All the possible parameters that affect the markets covered in this research study were accounted for, viewed in detail, verified through primary research, and analyzed to obtain the final quantitative and qualitative data. This data was consolidated and supplemented with detailed inputs and analysis from MarketsandMarkets and presented in this report.

Data Triangulation

After arriving at the overall market size from the market size estimation process as explained above, the total market has been split into several segments and subsegments. To complete the overall market engineering process and arrive at the exact statistics for all segments and subsegments, market breakdown and data triangulation procedures have been employed, wherever applicable. The data has been triangulated by studying various factors and trends from both demand and supply sides. Along with this, the market has been validated using top-down and bottom-up approaches.


Report Objectives

  • To define, describe, and estimate the network switches market based on type, switching port, end user, and region.
  • To forecast the size of the market, by region—North America, Europe, Asia Pacific, and the Rest of the World (RoW)—in terms of value
  • To forecast the network switches market size, in terms of volume, by type
  • To provide detailed information regarding the drivers, restraints, opportunities, and challenges influencing the growth of the network switches market
  • To strategically analyze the micromarkets1 with respect to the individual growth trends, prospects, and their contribution to the network switches market
  • To map the competitive landscape based on company profiles, key player strategies, and key developments.
  • To provide a detailed overview of the network switches value chain and ecosystem
  • To provide information about the key technology trends and patents related to the network switches market.
  • To provide information regarding trade data related to the network switches market.
  • To identify the key players operating in the network switches market and comprehensively analyze their market shares and core competencies2. 
  • To analyze opportunities in the market for stakeholders by identifying high-growth segments of the network switches market
  • To benchmark the market players using the proprietary company evaluation matrix framework, which analyzes them on various parameters within the broad categories of market ranking/share and product portfolio.
  • To analyze competitive developments such as contracts, acquisitions, product launches, collaborations, partnerships, and research and development (R&D) in the network switches market.

Previous Versions of this Report

Custom Market Research Services

We Will Customise The Research For You, In Case The Report Listed Above Does Not Meet With Your Requirements

Get 10% Free Customisation

Growth opportunities and latent adjacency in Network Switches Market

DMCA.com Protection Status