This research involved using extensive secondary sources and databases, such as Factiva and Bloomberg, to identify and collect valuable information for a technical and market-oriented study of the steel rebar market. Primary sources included industry experts from related industries and preferred suppliers, manufacturers, distributors, technologists, standards & certification organizations, and organizations related to all segments of this industry's value chain. In-depth interviews have been conducted with various primary respondents, such as key industry participants, subject matter experts (SMEs), executives of key companies, and industry consultants, to obtain and verify critical qualitative and quantitative information and assess growth prospects.
Secondary Research
In the secondary research process, various sources such as annual reports, press releases, and investor presentations of companies, white papers, and publications from recognized websites and databases have been referred to for identifying and collecting information. Secondary research has been used to obtain key information about the industry's supply chain, the total pool of key players, market classification and segmentation according to the industry trends to the bottom-most level, regional markets, and key developments from both market-and technology-oriented perspectives.
Primary Research
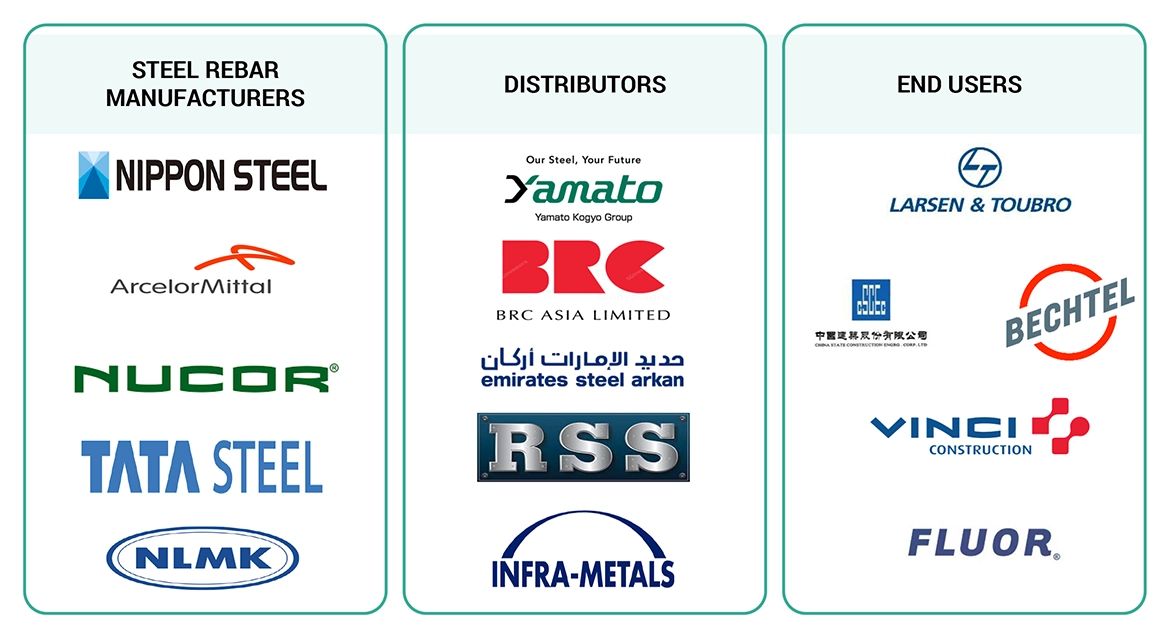
The steel rebar market comprises several stakeholders in the supply chain, which include suppliers, processors, and end-product manufacturers. Various primary sources from the supply and demand sides of the markets have been interviewed to obtain qualitative and quantitative information. The primary participants from the demand side include key opinion leaders, executives, and CXOs of companies in the steel rebar market. Primary sources from the supply side include associations and institutions involved in the steel rebar industry, key opinion leaders, and processing players.
Following is the breakdown of primary respondents—
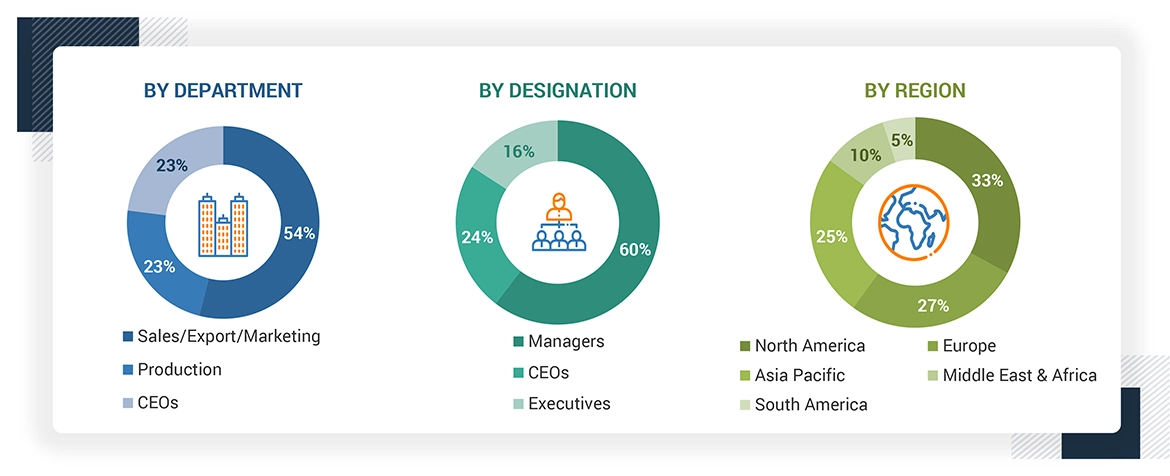
Tiers of the companies are classified based on their annual revenues as of 2021, Tier 1 = >USD 5 Billion, Tier 2 = USD 1 Billion to USD 5 Billion, and Tier 3= < USD 1 Billion.
To know about the assumptions considered for the study, download the pdf brochure
Market Size Estimation
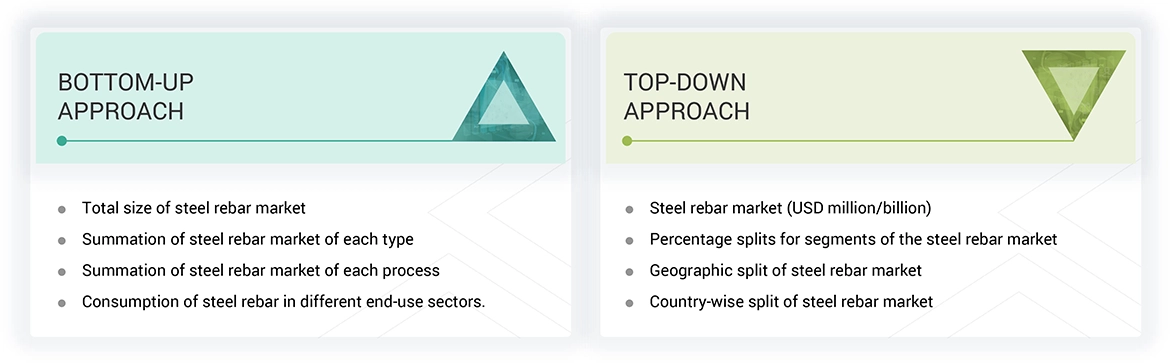
Both top-down and bottom-up approaches were used to estimate and validate the size of the global steel rebar market. The research methodology used to estimate the market size includes the following:
-
The key players in the industry were identified through extensive secondary research.
-
The supply chain of the industry and market size, in terms of value, were determined through primary and secondary research.
-
All percentage share split, and breakdowns were determined using secondary sources and verified through primary sources.
-
All possible parameters that affect the markets covered in this research study were accounted for, viewed in extensive detail, verified through primary research, and analyzed to obtain the final quantitative and qualitative data.
-
The research includes the study of reports, reviews, and newsletters of key industry players, along with extensive interviews with key officials, such as directors and marketing executives.
Data Triangulation
After arriving at the total market size from the estimation process explained above, the overall market was split into several segments and subsegments. To complete the overall market size estimation process and arrive at the exact statistics for all segments and subsegments, data triangulation and market breakdown procedures have been employed, wherever applicable. The data have been triangulated by studying various factors and trends from both the demand and supply sides. In addition, the market size has been validated by using both the top-down and bottom-up approaches.
Report Objectives
-
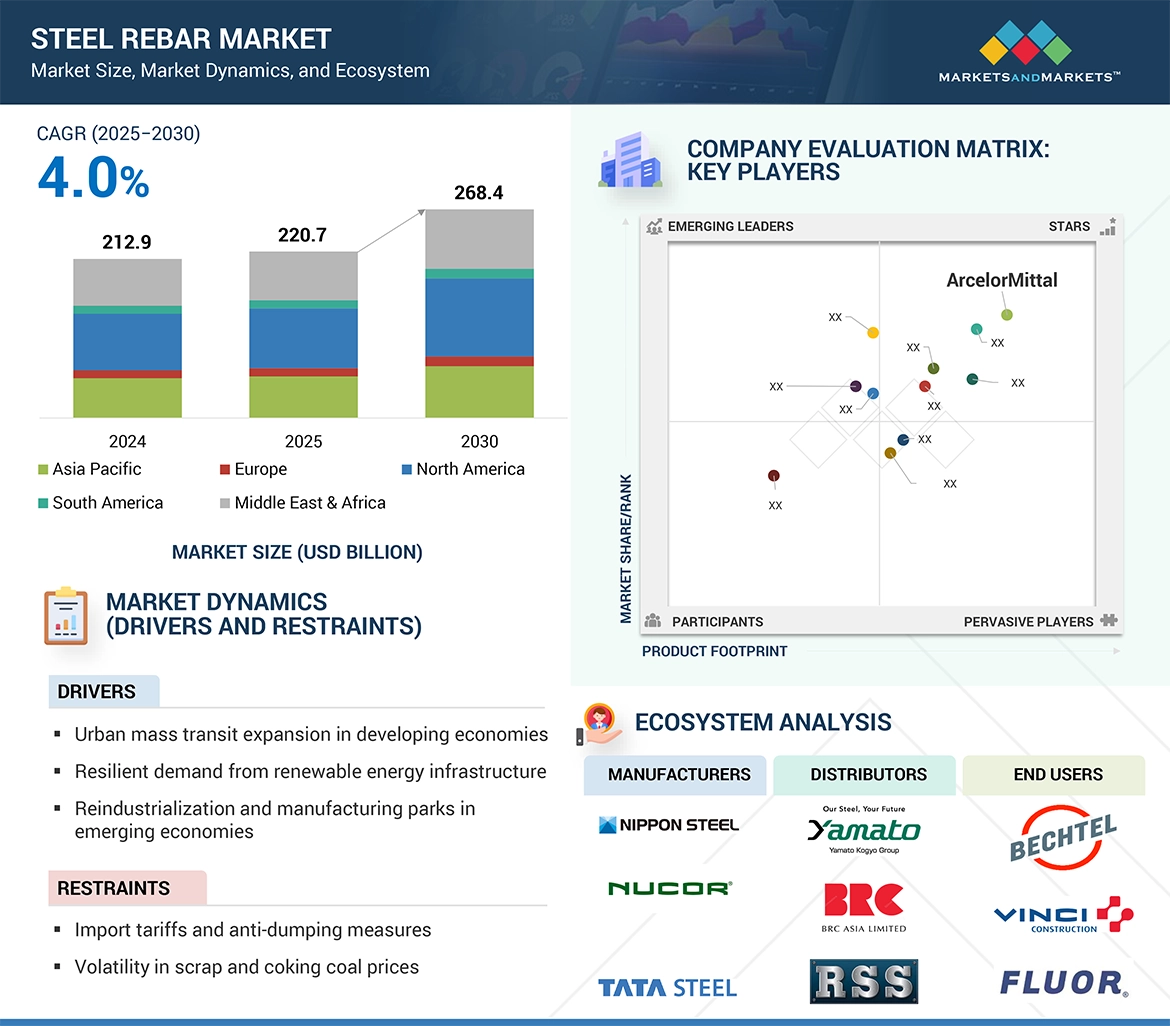
To define, describe, and forecast the global steel rebar market in terms of value
-
To provide insights regarding the significant factors influencing the growth of the market (drivers, restraints, opportunities, and challenges)
-
To analyze and forecast the market based on Type, By Bar Size, By Coating Type, By Process, By End-Use Sector, and Region.
-
To forecast the market size, in terms of value, with respect to five main regions: North America, Europe, South America, Asia Pacific, Middle East & Africa.
-
To analyze the opportunities in the market for stakeholders and provide details of the competitive landscape
-
To strategically profile key players in the market
-
To analyze competitive developments in the market, such as new product launches, capacity expansions, and mergers & acquisitions
-
To strategically profile the leading players and comprehensively analyze their key developments in the market


 HIGHEST CAGR MARKET IN 2021
 CHINA FASTEST GROWING MARKET IN THE REGION
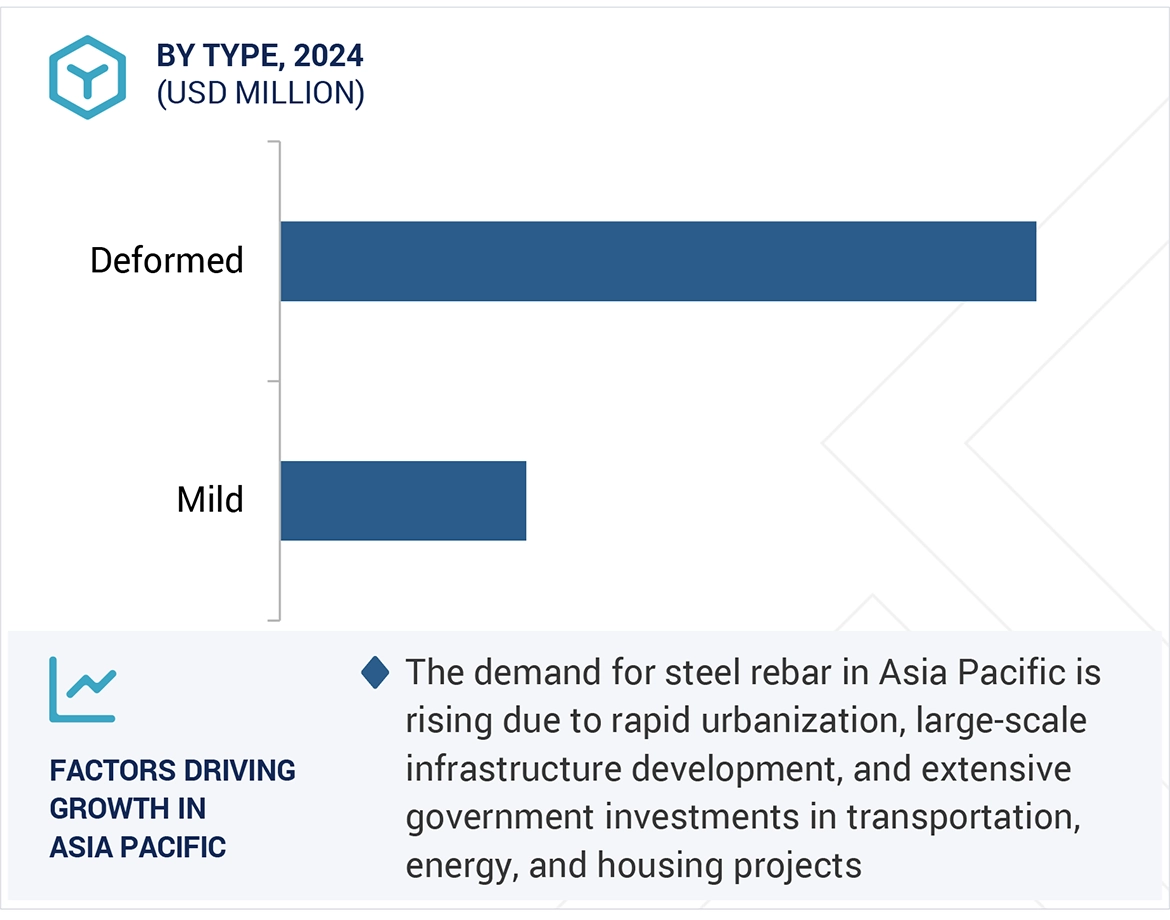


Growth opportunities and latent adjacency in Steel Rebar Market