The study involved four major activities in estimating the market size of the RO membrane market. Exhaustive secondary research was done to collect information on the market, the peer market, and the grandparent market. The next step was to validate these findings, assumptions, and sizing with industry experts across the value chain through primary research. Both top-down and bottom-up approaches were employed to estimate the complete market size. Thereafter, the market breakdown and data triangulation procedures were used to estimate the market size of the segments and subsegments.
Secondary Research
In the secondary research process, various secondary sources have been referred to for identifying and collecting information for this study. These secondary sources include annual reports, press releases, investor presentations of companies, white papers, certified publications, trade directories, articles from recognized authors, gold standard and silver standard websites, and databases. Secondary research has been used to obtain key information about the value chain of the industry, monetary chain of the market, the total pool of key players, market classification and segmentation according to industry trends to the bottom-most level, and regional markets. It was also used to obtain information about the key developments from a market-oriented perspective.
Primary Research
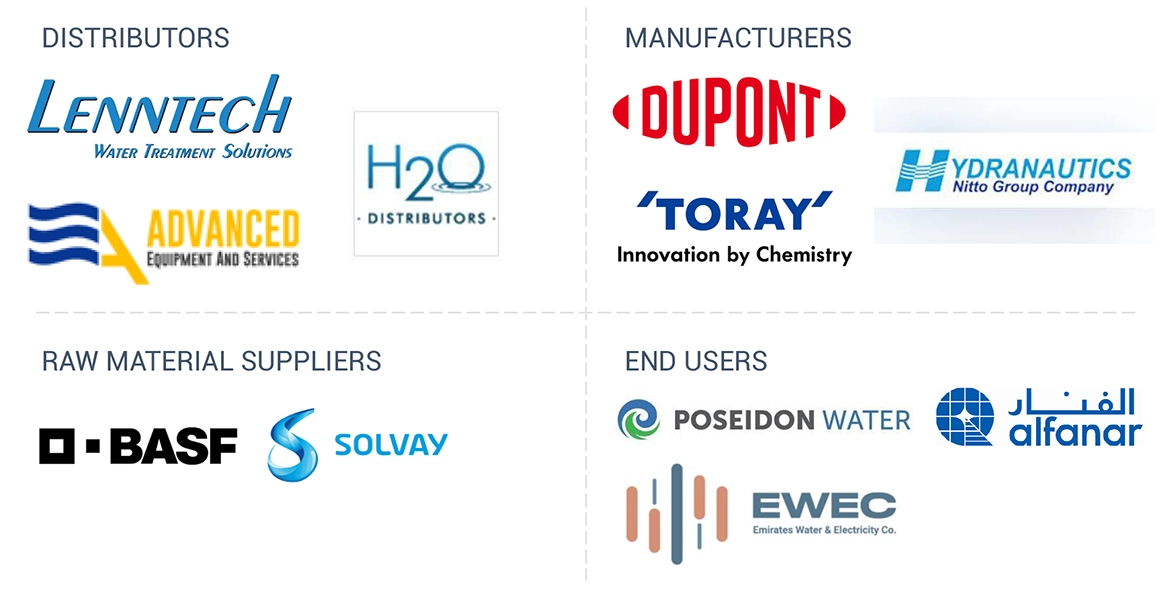
The RO membrane market comprises several stakeholders in the value chain, which include manufacturers, and end users. Various primary sources from the supply and demand sides of the RO membrane market have been interviewed to obtain qualitative and quantitative information. The primary interviewees from the demand side include key opinion leaders in industrial sectors. The primary sources from the supply side include manufacturers, associations, and institutions involved in the RO membrane industry. Primary interviews were conducted to gather insights such as market statistics, data of revenue collected from the products and services, market breakdowns, market size estimations, market forecasting, and data triangulation. Primary research also helped in understanding the various trends related to type, material, end-use industry, and region. Stakeholders from the demand side, such as CIOs, CTOs, and CSOs were interviewed to understand the buyer’s perspective on the suppliers, products, component providers, and their current usage of RO membranes and outlook of their business, which will affect the overall market.
The breakdown of profiles of the primary interviewees is illustrated in the figure below:
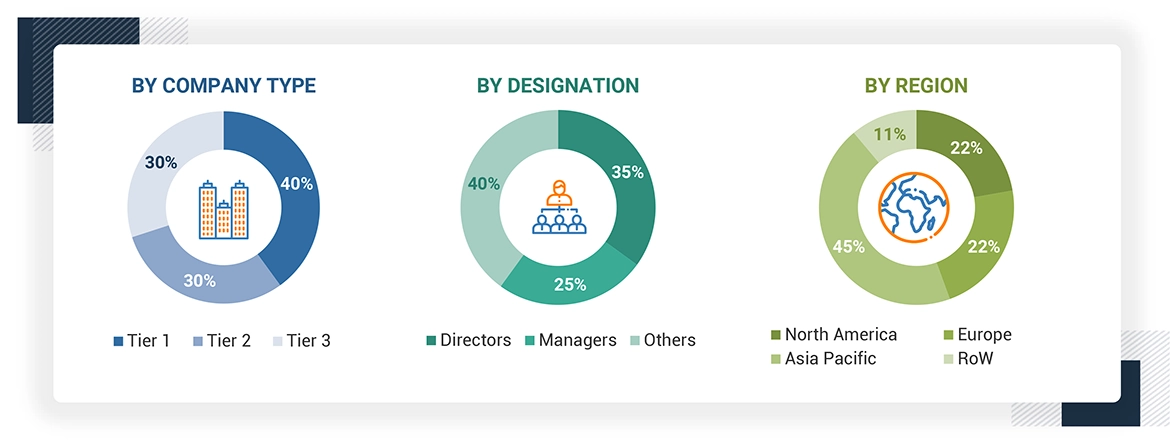
Note: Tier 1, Tier 2, and Tier 3 companies are classified based on their market revenue in 2022 available in the public domain, product portfolios, and geographical presence.
Other designations include consultants and sales, marketing, and procurement managers.
To know about the assumptions considered for the study, download the pdf brochure
Market Size Estimation
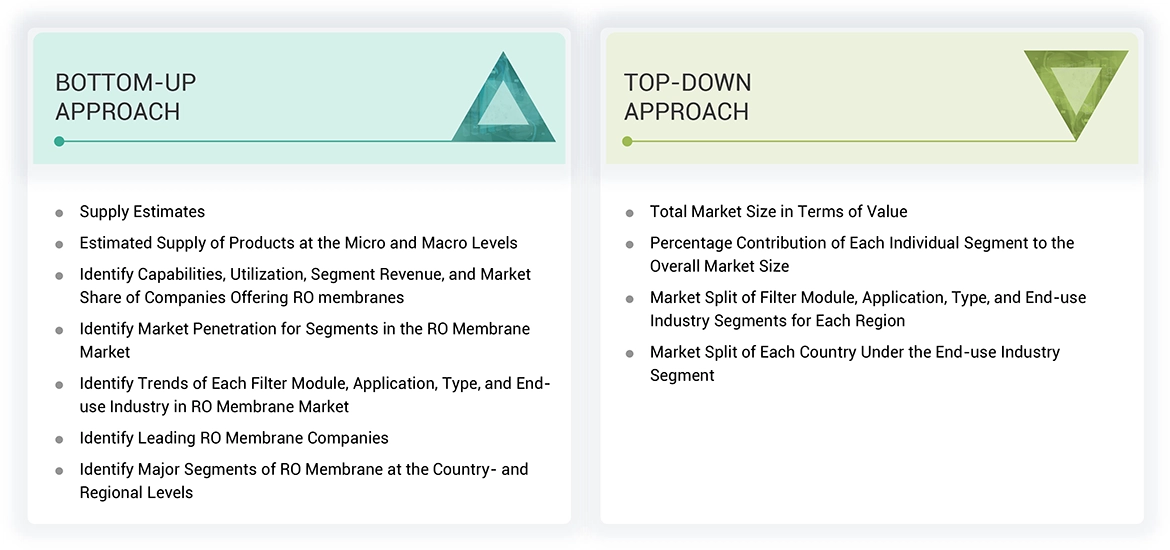
The top-down and bottom-up approaches have been used to estimate and validate the size of the RO membrane market.
-
The key players in the industry have been identified through extensive secondary research.
-
The supply chain of the industry has been determined through primary and secondary research.
-
All percentage shares, splits, and breakdowns have been determined using secondary sources and verified through primary sources.
-
All possible parameters that affect the markets covered in this research study have been accounted for, viewed in extensive detail, verified through primary research, and analyzed to obtain the final quantitative and qualitative data.
-
The research includes the study of reports, reviews, and newsletters of the key market players, along with extensive interviews for opinions with leaders such as directors and marketing executives.
Data Triangulation
After arriving at the total market size from the estimation process, the overall market has been split into several segments and sub-segments. To complete the overall market engineering process and arrive at the exact statistics for all the segments and sub-segments, the data triangulation and market breakdown procedures have been employed, wherever applicable. The data has been triangulated by studying various factors and trends from both the demand and supply sides. Along with this, the market size has been validated by using both the top-down and bottom-up approaches and primary interviews. Hence, for every data segment, there have been three sources—top-down approach, bottom-up approach, and expert interviews. The data was assumed correct when the values arrived from the three sources matched.
Market Definition
RO membranes are thin and semi permeable layers which are used in purification of water in order to separate dissolved solids and impurities. When pressure is applied and water is passed through these membranes, it allows clean water to pass and blocks substances such as salts, bacteria and viruses. RO membranes are used in various applications such as desalination, water & wastewater treatment, and different industries for production purified water with high quality by efficiently removing unwanted contaminants.
Stakeholders
-
Senior Management
-
End User
-
Finance/Procurement Department
-
R&D Department
-
Manufacturers
-
Raw Material Suppliers
Report Objectives
-
To define, describe, and forecast the size of the RO membrane market, in terms of value and volume.
-
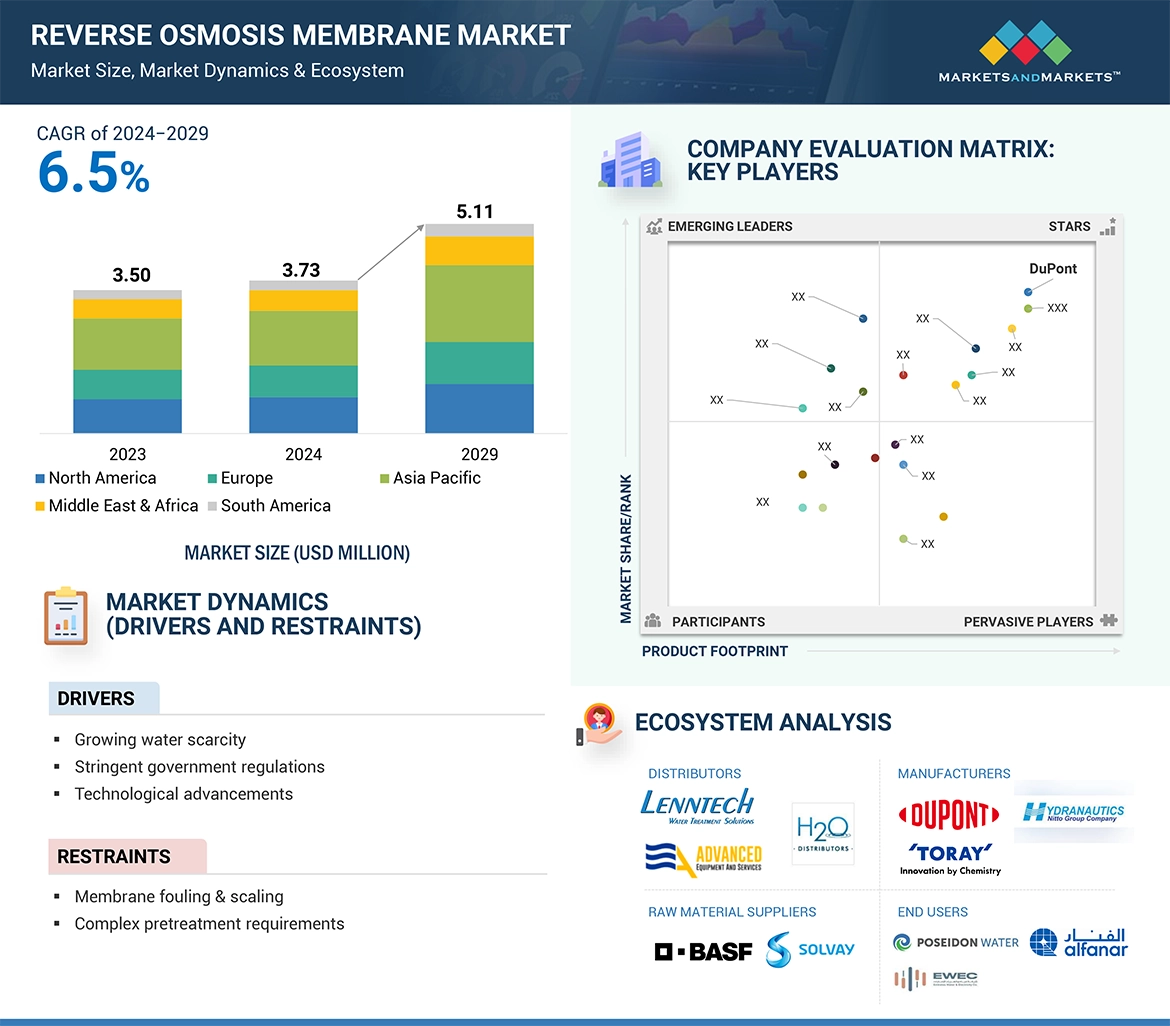
To provide detailed information regarding the major factors (drivers, opportunities, restraints, and challenges) influencing the growth of the market
-
To estimate and forecast the market size based on filter module, application, type, end-use industry, and region.
-
To forecast the size of the market with respect to major regions, namely, Europe, North America, Asia Pacific, Middle East & Africa, and South America, along with their key countries
-
To strategically analyze micro-markets with respect to individual growth trends, prospects, and their contribution to the overall market
-
To analyze opportunities in the market for stakeholders and provide a competitive landscape of market leaders.
-
To track and analyze recent developments such as expansions, new product launches, partnerships & agreements, and acquisitions in the market.
-
To strategically profile key market players and comprehensively analyze their core competencies.


 HIGHEST CAGR MARKET IN 2023
 CHINA FASTEST GROWING MARKET IN THE REGION


Growth opportunities and latent adjacency in Reverse Osmosis (RO) Membrane Market