Reactive Hot Melt Adhesives Market

Reactive Hot Melt Adhesives Market by Resin Type (Polyurethane, Polyolefin), Substrate (Plastic, Wood), Application (Automotive & Transportation, Doors & Windows, Furniture & Upholstery, Lamination, Textile), & Region - Global Forecast to 2028

Report Code: CH 7741 Nov, 2023, by marketsandmarkets.com

The reactive hot melt adhesives market is projected to grow from USD 1.6 billion in 2022 to USD 2.6 billion by 2028, at a CAGR of 7.5% between 2023 and 2028. The increase in building activities is fueled by infrastructure spending.

Attractive Opportunities in the Reactive Hot Melt Adhesives Market

Reactive Hot Melt Adhesives Market

To know about the assumptions considered for the study, Request for Free Sample Report

Reactive Hot Melt Adhesives Market

Source: Interviews with Experts, Secondary Sources, and MarketsandMarkets Analysis

Reactive Hot Melt Adhesives Market Dynamics

Drivers: Superior properties over conventional adhesives

Reactive hot melt adhesives stand out for their environmentally friendly profile, boasting low or zero VOC content compared to traditional solvent-based counterparts. Compliant with VOC regulations, these adhesives are gaining traction due to manufacturers prioritizing eco-friendly solutions. Their solvent-free composition not only benefits the environment but also results in cost savings, including lower labor and energy expenses. Additionally, these adhesives, with properties like flexibility, high strength, and excellent adhesion to various substrates, outperform conventional options. Their notable heat resistance further attracts end users, establishing reactive hot melt adhesives as a preferred choice across diverse applications.


Restraints: High curing time compared to other technologies


Unlike some adhesives, reactive hot melt adhesives have an extended curing period, often taking several hours or even overnight. This prolonged curing time is attributed to their reliance on moisture from the air, necessitating patience for optimal bonding strength. Notably, one-part reactive hot melt adhesives may not be the ideal choice for thick bond lines due to their inherent curing characteristics. In PU-based reactive hot melt adhesives, the reaction proceeds slowly as it depends on the moisture in the substrate or air, and its adhesiveness is affected by external conditions, such as low humidity and low temperature. However, in condensation cure, radiation cure, and UV cure adhesives, the curing time is comparatively less, which negatively influences the growth of the reactive hot melt adhesives market. In condensation cure adhesives, the curing time ranges from 30 minutes to 4 hours, while UV-cure adhesives, once exposed to a UV light source, can cure almost instantly. Radiation cure adhesives take as little as a second to several minutes for curing when exposed to radiation. The presence of such potential alternatives is expected to restrain the growth of the reactive hot melt adhesives market.

Opportunities: Technological advancements in reactive hot melt adhesives

Technological advancements contribute to improved performance, versatility, and application efficiency of reactive hot melt adhesives. Advancements in curing technologies contribute to faster and more efficient curing processes. This includes the development of adhesives with quicker curing times, enabling faster production cycles in various industries. Some reactive hot melt adhesives now incorporate dual-cure systems, combining both hot melt and UV (ultraviolet) curing technologies. This provides versatility in bonding different materials and allows for enhanced curing control.Technolo gical advancements aim to enhance the temperature resistance of reactive hot melt adhesives, making them suitable for applications in extreme temperature conditions, such as those encountered in the automotive and aerospace industries. There is more focus on developing bio-based and sustainable formulations for reactive hot melt adhesives. This addresses the growing demand for eco-friendly adhesives that have minimal environmental impact.

Challenges: Low open time for application

Open time refers to the period during which the adhesive remains in a state suitable for bonding after application. If the open time is too short (low open time), there is limited time available for assembling or positioning the bonded components. This can be challenging, especially in applications that require precision or involve complex assemblies. The open time of reactive hot melt adhesives can be influenced by ambient temperature and humidity. In environments with elevated temperatures, the open time may be further reduced, making it challenging to control the bonding process. In situations where adjustments are needed after initial bonding, a short open time limits the window for repositioning or disassembly. This lack of flexibility may be a drawback in applications where modifications or rework are common.

Reactive Hot Melt Adhesives Ecosystem

The diagram below indicates MnM coverage of the reactive hot melt adhesives ecosystem. Knowledgestore provides strategic insights on each of the nodes in the ecosystem through a cloud based, highly interactive market intellence platform.

Reactive Hot Melt Adhesives Market Ecosystem

Polyurethane by resin type accounted for the largest segment of reactive hot melt adhesives market

Polyurethane is ideal for a wide variety of applications, such as automotive interior, carpentry, woodworking, furniture repair, shoe repair, laminate countertops, broken glassware repair, ceramic ceiling tiles, and construction and remodeling. As polyurethane hot melt forms a strong bond in the initial period and then continues to strengthen as the adhesive reacts with moisture, it provides a stronger bond than a traditional hot melt.

Plastic is the fastest-growing substrate segment of reactive hot melt adhesives market

Reactive hot melt adhesives can be formulated to activate and cure at temperatures that are suitable for bonding plastics without causing damage to the material. This makes them well-suited for use on heat-sensitive plastics. These adhesives exhibit versatility in bonding various types of plastics, including polyethylene, polypropylene, and PVC, among others. This versatility is advantageous in industries where multiple types of plastics are used in manufacturing. The demand for plastics is rising as they are used in automotive & transportation, assembly, textile, construction, woodworking, and electronics, among other end-use industries. They are lightweight and ensure superior performance, dimension stability, and good clarity in end-products.

Automotive & Transportation by application accounted for the largest segment of reactive hot melt adhesives market

Weight reduction of automobiles is found to be an excellent way to improve fuel economy, extend the cruising range of e-cars, and decrease combustion emissions. Lightweight materials, such as composites, have started to replace steel as the preferred material in automobile components. The use of composite materials has allowed a reduction of up to 75% of vehicle weight, along with the same or higher strength. This results in savings of up to 25% in fuel consumption. Reactive hot melt adhesives help in achieving the bonding of such lighter and alternative substrates in the automobile industry. Unlike epoxy systems that are cured at high temperatures, they do not provide sufficient elongation to work with composite materials, which have a low resistance to temperature changes. Polyurethane reactive hot melt systems are widely spread to overcome this issue.

Reactive Hot Melt Adhesives Market by Region

To know about the assumptions considered for the study, download the pdf brochure

Asia Pacific is the largest growing reactive hot melt adhesives market.

The Asia Pacific is the largest reactive hot melt adhesives market, in terms of both, value and volume, and is projected to be the fastest-growing market during the forecast period. The Chinese market for reactive hot melt adhesives has grown rapidly. It is projected to witness growth in the near future because of the continuous shift of global automobile production facilities in the country. India, China, and Indonesia are investing heavily in various end-use industries, which is likely to influence the growth of the reactive hot melt adhesives market in these countries.

Key Market Players

Henkel AG & Co. KGaA (Germany), The Dow Chemical Company (US), H.B. Fuller Company (US), Jowat SE (Germany), and 3M (US) are the key players in the global reactive hot melt adhesives market.

Henkel operates globally with a well-balanced and diversified portfolio. It manufactures and distributes, homecare, laundry, cosmetics, and adhesive products. The company operates through four main business segments: Adhesive Technologies, Laundry & Home Care, Beauty Care, and Corporate. Adhesives & Ssealants are produced under the adhesive technologies segment. Henkel offers a multitude of applications to cater to the needs of different target groups: consumers, craftsmen, and industrial businesses. Henkel Adhesive Technologies is the global leader in adhesives, sealants, and functional coatings worldwide.

Read More: Reactive Hot Melt Adhesives Companies

Want to explore hidden markets that can drive new revenue in Reactive Hot Melt Adhesives Market?

Scope of the Report

Report Metric

Details

Years Considered for the study

2018-2028

Base year

2022

Forecast period

2023–2028

Units considered

Value (USD)

Segments

By Resin Type
By Type
By Substrate
By Application
By Region

Regions covered

Asia Pacific, Europe, North America, South America, Middle East & Africa

Companies profiled

Henkel AG & Co. KGaA (Germany), The Dow Chemical Company (US), H.B. Fuller Company (US), Jowat SE (Germany), and 3M (US). A total of 25 players have been covered.

This research report categorizes the reactive hot melt adhesives market based on Type, Technology, End-use Industry, and Region.

By Resin Type:
  • Polyurethane
  • Polyolefin
  • Others
By Type:
  • High Temperature
  • Low Temperature
By Substrate:
  • Plastic
  • Wood
  • Others
By Application:
  • Automotive & Transportation
  • Doors & Windows
  • Furniture & Upholstery
  • Lamination
  • Textile
  • Assembly
  • Others
By Region:
  • Asia Pacific
  • Europe
  • North America
  • South America
  • Middle East & Africa

Recent Developments

  • In August 2023, the new PUR hot melt adhesive reactor at Henkel's Dragon Factory in Shanghai officially began production, marking a new milestone for the world's largest adhesive factory. PUR hot melt adhesive is mainly used in bonding furniture and building materials.
  • In May 2023, Henkel inaugurated its Technology Center in Bridgewater, New Jersey, USA, spanning 70,000 square feet. This facility serves as an engaging hub for Henkel's strategic partners and customers, featuring the company's comprehensive technology lineup, including adhesives, sealants, functional coatings, and specialty materials. With a focus on collaboration, it encourages innovative solution development with customers across 800 industry segments.

Frequently Asked Questions (FAQ):

To speak to our analyst for a discussion on the above findings, click Speak to Analyst

Exclusive indicates content/data unique to MarketsandMarkets and not available with any competitors.

INTRODUCTION
32
RESEARCH METHODOLOGY
38
EXECUTIVE SUMMARY
49
PREMIUM INSIGHTS
52
MARKET OVERVIEW
55
  • 5.1 INTRODUCTION
    MANUFACTURING PROCESS OF REACTIVE HOT MELT ADHESIVES
    ADVANTAGES AND DISADVANTAGES OF REACTIVE HOT MELT ADHESIVES
  • 5.2 MARKET DYNAMICS
    DRIVERS
    - Superior properties over conventional adhesives
    - Growing demand for lightweight and low-carbon emitting vehicles
    - Increasing construction activities
    - Stringent regulatory standards
    RESTRAINTS
    - Availability of alternative adhesive technologies
    - High curing time compared to other technologies
    OPPORTUNITIES
    - Technological advancements in reactive hot melt adhesives
    - Increasing demand in emerging economies
    CHALLENGES
    - Low open time for application
  • 5.3 PORTER’S FIVE FORCES ANALYSIS
    INTENSITY OF COMPETITIVE RIVALRY
    BARGAINING POWER OF BUYERS
    BARGAINING POWER OF SUPPLIERS
    THREAT OF SUBSTITUTES
    THREAT OF NEW ENTRANTS
  • 5.4 MACROECONOMIC INDICATORS
    INTRODUCTION
    GDP TRENDS AND FORECAST
    TRENDS & FORECAST OF GLOBAL AUTOMOTIVE INDUSTRY
    - Launch of electric vehicle models, 2025–2028
    TRENDS AND FORECAST OF FURNITURE INDUSTRY
    TRENDS AND FORECAST OF BUILDING & CONSTRUCTION INDUSTRY
INDUSTRY TRENDS
69
  • 6.1 SUPPLY CHAIN ANALYSIS
  • 6.2 ECOSYSTEM MAPPING
  • 6.3 TRENDS AND DISRUPTIONS IMPACTING CUSTOMER BUSINESS
  • 6.4 KEY STAKEHOLDERS & BUYING CRITERIA
    KEY STAKEHOLDERS IN BUYING PROCESS
    BUYING CRITERIA
  • 6.5 PRICING ANALYSIS
    REACTIVE HOT MELT ADHESIVES MARKET: AVERAGE SELLING PRICE TREND, BY REGION
    AVERAGE SELLING PRICE TREND, BY RESIN TYPE
    AVERAGE SELLING PRICE TREND, BY SUBSTRATE
    AVERAGE SELLING PRICE TREND, BY APPLICATION
    AVERAGE SELLING PRICE COMPETITIVENESS IN REACTIVE HOT MELT ADHESIVES MARKET, BY MAJOR COUNTRIES
    AVERAGE SELLING PRICE TREND OF KEY PLAYERS, BY APPLICATION
  • 6.6 TRADE ANALYSIS
    EXPORT SCENARIO OF REACTIVE HOT MELT ADHESIVES
    IMPORT SCENARIO OF REACTIVE HOT MELT ADHESIVES
  • 6.7 GLOBAL ECONOMIC SCENARIO AFFECTING MARKET GROWTH
    RUSSIA-UKRAINE WAR
    CHINA
    - China’s debt problem
    - Environmental commitments
    EUROPE
    - Political instability in Germany
    - Energy crisis in Europe
  • 6.8 TARIFF & REGULATORY LANDSCAPE
    REGULATIONS RELATED TO REACTIVE HOT MELT ADHESIVES
    REGULATORY BODIES, GOVERNMENT AGENCIES, AND OTHER ORGANIZATIONS
  • 6.9 PATENT ANALYSIS
    LIST OF MAJOR PATENTS
  • 6.10 CASE STUDY ANALYSIS
  • 6.11 TECHNOLOGY ANALYSIS
  • 6.12 KEY CONFERENCES & EVENTS IN 2023–2024
REACTIVE HOT MELT ADHESIVES MARKET, BY RESIN TYPE
92
  • 7.1 INTRODUCTION
  • 7.2 POLYURETHANE (PU)
    PROVIDES STRONGER BOND THAN TRADITIONAL HOT MELT
  • 7.3 POLYOLEFIN
    ELIMINATES NEED FOR PRE-TREATING LOW-SURFACE ENERGY PLASTICS
  • 7.4 OTHERS
    ETHYLENE-VINYL ACETATE (EVA)
    POLYAMIDE
    POLYESTER
    POLYETHYLENE
REACTIVE HOT MELT ADHESIVES MARKET, BY TYPE
101
  • 8.1 INTRODUCTION
  • 8.2 HIGH TEMPERATURE
    EXHIBIT EXCELLENT RESISTANCE TO ELEVATED TEMPERATURES AND MAINTAIN BOND STRENGTH UNDER EXTREME HEAT CONDITIONS
  • 8.3 LOW TEMPERATURE
    PROVIDE FLEXIBILITY IN APPLICATION INVOLVING TEMPERATURE-SENSITIVE SUBSTRATES OR COMPONENTS
REACTIVE HOT MELT ADHESIVES MARKET, BY SUBSTRATE
103
  • 9.1 INTRODUCTION
  • 9.2 PLASTIC
    ASIA PACIFIC TO REGISTER HIGHEST GROWTH IN PLASTIC SEGMENT DURING FORECAST PERIOD
  • 9.3 WOOD
    LARGE POPULATION AND HUGE DEMAND FOR FURNITURE IN ASIA PACIFIC DRIVING MARKET
  • 9.4 OTHERS
REACTIVE HOT MELT ADHESIVES MARKET, BY APPLICATION
112
  • 10.1 INTRODUCTION
  • 10.2 AUTOMOTIVE & TRANSPORTATION
    PREFERENCE FOR LIGHTWEIGHT ASSEMBLY MATERIAL AND DEMAND FOR LOW-VOC PRODUCTS TO BOOST MARKET
  • 10.3 FURNITURE & UPHOLSTERY
    HIGH DEMAND IN FURNITURE & UPHOLSTERY DUE TO HEAT & MOISTURE RESISTANCE AND DURABLE BOND STRENGTH
  • 10.4 TEXTILE
    ASIA PACIFIC TO BE FASTEST-GROWING MARKET DURING FORECAST PERIOD
  • 10.5 LAMINATION
    PU-BASED REACTIVE HOT MELT ADHESIVES WIDELY USED FOR LAMINATION APPLICATIONS
  • 10.6 ASSEMBLY
    REACTIVE HOT MELT ADHESIVES WIDELY USED IN INDUSTRIAL ASSEMBLY DUE TO THEIR RAPID BONDING PROPERTIES
  • 10.7 DOORS & WINDOWS
    REACTIVE HOT MELT ADHESIVES OFFER BETTER BOND OF WOODEN SUBSTRATES AND REDUCTION IN STRESS ON JOINTS
  • 10.8 OTHERS
REACTIVE HOT MELT ADHESIVES MARKET, BY REGION
130
  • 11.1 INTRODUCTION
  • 11.2 ASIA PACIFIC
    IMPACT OF RECESSION ON ASIA PACIFIC
    CHINA
    - Expanding consumer market to boost demand
    INDIA
    - Government initiatives in infrastructure development to drive market
    JAPAN
    - Automotive sector to drive market for reactive hot melt adhesives
    SOUTH KOREA
    - Automotive industry to be largest end user of reactive hot melt adhesives
    REST OF ASIA PACIFIC
  • 11.3 EUROPE
    IMPACT OF RECESSION ON EUROPE
    GERMANY
    - Presence of major manufacturers to drive market
    ITALY
    - Increasing automobile production and exports to drive market
    FRANCE
    - Growth of key end-use industries to boost market
    UK
    - Advanced technological infrastructure and increased R&D investments to support market growth
    RUSSIA
    - Currency devaluation to hamper market growth
    REST OF EUROPE
  • 11.4 NORTH AMERICA
    IMPACT OF RECESSION ON NORTH AMERICA
    US
    - Increasing demand from automotive sector to drive market
    CANADA
    - Automotive, furniture, and building & construction sectors to drive market
    MEXICO
    - Rapid growth of automotive industry to fuel demand
  • 11.5 MIDDLE EAST & AFRICA
    IMPACT OF RECESSION ON MIDDLE EAST & AFRICA
    GCC COUNTRIES
    - UAE
    - Saudi Arabia
    - Rest of GCC countries
    SOUTH AFRICA
    - Government initiatives and public infrastructure projects to boost market
    TURKEY
    - Strong construction sector to fuel demand
    REST OF MIDDLE EAST & AFRICA
  • 11.6 SOUTH AMERICA
    IMPACT OF RECESSION ON SOUTH AMERICA
    BRAZIL
    - Government investment and support for automotive sector to drive market
    ARGENTINA
    - Construction industry to support market growth
    REST OF SOUTH AMERICA
COMPETITIVE LANDSCAPE
244
  • 12.1 KEY PLAYERS STRATEGIES
    OVERVIEW OF STRATEGIES ADOPTED BY KEY MARKET PLAYERS (2018–2023)
  • 12.2 MARKET SHARE ANALYSIS
    HENKEL KG & CO. KGAA
    DOW CHEMICAL COMPANY
    3M
    H.B. FULLER COMPANY
    JOWAT SE
  • 12.3 REVENUE ANALYSIS
  • 12.4 MARKET RANKING ANALYSIS
  • 12.5 COMPANY EVALUATION MATRIX, 2022
    STARS
    EMERGING LEADERS
    PERVASIVE PLAYERS
    PARTICIPANTS
    COMPANY FOOTPRINT
  • 12.6 STARTUP/SME EVALUATION MATRIX, 2022
    PROGRESSIVE COMPANIES
    RESPONSIVE COMPANIES
    DYNAMIC COMPANIES
    STARTING BLOCKS
    COMPETITIVE BENCHMARKING
  • 12.7 COMPETITIVE SCENARIO AND TRENDS
    REACTIVE HOT MELT ADHESIVES MARKET: PRODUCT LAUNCHES, 2018–2023
    REACTIVE HOT MELT ADHESIVES MARKET: DEALS, 2018–2023
    REACTIVE HOT MELT ADHESIVES MARKET: OTHERS, 2018–2023
COMPANY PROFILES
264
  • 13.1 KEY PLAYERS
    HENKEL AG & CO. KGAA
    - Business overview
    - Products/Services/Solutions offered
    - Recent developments
    - MnM view
    H.B. FULLER COMPANY
    - Business overview
    - Products/Services/Solutions offered
    - Recent developments
    - MnM view
    3M
    - Business overview
    - Products/Services/Solutions offered
    - Recent developments
    - MnM view
    JOWAT SE
    - Business overview
    - Products/Services/Solutions offered
    - Recent developments
    - MnM view
    ARKEMA
    - Business overview
    - Products/Services/Solutions offered
    - Recent developments
    - MnM view
    THE DOW CHEMICAL COMPANY
    - Business overview
    - Products/Services/Solutions offered
    - Recent developments
    SIKA AG
    - Business overview
    - Products/Services/Solutions offered
    - Recent developments
    DIC CORPORATION
    - Business overview
    - Products/Services/Solutions offered
    NANPAO RESINS CHEMICAL GROUP
    - Business overview
    - Products/Services/Solutions offered
    DAUBERT CHEMICAL COMPANY
    - Business overview
    - Products/Services/Solutions offered
  • 13.2 OTHER PLAYERS
    KLEIBERIT SE & CO. KG
    - Products/Services/Solutions offered
    - Recent developments
    TEX YEAR INDUSTRIES INC.
    - Products/Services/Solutions offered
    - Recent developments
    CHEMENCE
    - Products/Services/Solutions offered
    - Recent developments
    CATTIE ADHESIVES
    - Products/Services/Solutions offered
    FRANKLIN INTERNATIONAL
    - Products/Services/Solutions offered
    - Recent developments
    THE REYNOLDS COMPANY
    - Products/Services/Solutions offered
    ADHESIVES DIRECT UK LIMITED
    - Products/Services/Solutions offered
    - Recent developments
    BUHNEN GMBH & CO. KG
    - Products/Services/Solutions offered
    - Recent developments
    CHERNG TAY TECHNOLOGY CO., LTD.
    - Products/Services/Solutions offered
    - Recent developments
    WORTHEN INDUSTRIES
    - Products/Services/Solutions offered
    - Recent developments
    COATING P. MATERIALS CO., LTD.
    - Products/Services/Solutions offered
    - Recent developments
    TIANYANG NEW MATERIALS (SHANGHAI) TECHNOLOGY CO., LTD.
    - Products/Services/Solutions offered
    TAIWAN PU CORPORATION
    - Products/Services/Solutions offered
    ADVATAC LTD
    - Products/Services/Solutions offered
    - Recent developments
    WENZHOU HUATE HOT MELT ADHESIVE CO., LTD.
    - Products/Services/Solutions offered
    - Recent developments
ADJACENT/RELATED MARKETS
319
  • 14.1 INTRODUCTION
  • 14.2 LIMITATIONS
  • 14.3 HOT MELT ADHESIVES MARKET
    MARKET DEFINITION
  • 14.4 MARKET OVERVIEW
  • 14.5 HOT MELT ADHESIVES MARKET, BY RESIN TYPE
    ETHYLENE-VINYL ACETATE (EVA)
    STYRENIC BLOCK COPOLYMER (SBC)
    METALLOCENE POLYOLEFIN (MPO)
    AMORPHOUS POLYALPHAOLEFIN (APAO)
    POLYOLEFINS
    POLYAMIDES
    POLYURETHANE (PUR)
    OTHERS
  • 14.6 HOT MELT ADHESIVES MARKET, BY APPLICATION
    PACKAGING SOLUTIONS
    NONWOVEN HYGIENE PRODUCTS
    FURNITURE & WOODWORK
    - Woodworking
    - Structural and non-structural wood products
    BOOKBINDING
    - Spine binding
    - Cover page and edge bonding
    OTHERS
  • 14.7 HOT MELT ADHESIVES MARKET, BY REGION
    ASIA PACIFIC
    NORTH AMERICA
    EUROPE
    SOUTH AMERICA
    MIDDLE EAST & AFRICA
APPENDIX
330
  • 15.1 DISCUSSION GUIDE
  • 15.2 KNOWLEDGESTORE: MARKETSANDMARKETS’ SUBSCRIPTION PORTAL
  • 15.3 CUSTOMIZATION OPTIONS
  • 15.4 RELATED REPORTS
  • 15.5 AUTHOR DETAILS
LIST OF TABLES
 
  • TABLE 1 REACTIVE HOT MELT ADHESIVES MARKET: RISK ASSESSMENT
  • TABLE 2 REACTIVE HOT MELT ADHESIVES MARKET SNAPSHOT (2023 VS. 2028)
  • TABLE 3 REACTIVE HOT MELT ADHESIVES MARKET: PORTER’S FIVE FORCES ANALYSIS
  • TABLE 4 GDP TRENDS AND FORECAST, BY COUNTRY (PERCENTAGE CHANGE)
  • TABLE 5 AUTOMOTIVE INDUSTRY PRODUCTION (2021–2022)
  • TABLE 6 LAUNCH OF ELECTRIC VEHICLE MODELS, 2025–2028
  • TABLE 7 REACTIVE HOT MELT ADHESIVES MARKET: ROLE IN ECOSYSTEM
  • TABLE 8 INFLUENCE OF STAKEHOLDERS IN BUYING PROCESS FOR TOP APPLICATIONS (%)
  • TABLE 9 KEY BUYING CRITERIA FOR REACTIVE HOT MELT ADHESIVES
  • TABLE 10 AVERAGE SELLING PRICES OF REACTIVE HOT MELT ADHESIVES, BY REGION, 2018-2022 (USD/KG)
  • TABLE 11 AVERAGE SELLING PRICE OF KEY PLAYERS, BY TOP THREE APPLICATIONS (USD/KG)
  • TABLE 12 NORTH AMERICA: REGULATORY BODIES, GOVERNMENT AGENCIES, AND OTHER ORGANIZATIONS
  • TABLE 13 EUROPE: REGULATORY BODIES, GOVERNMENT AGENCIES, AND OTHER ORGANIZATIONS
  • TABLE 14 ASIA PACIFIC: REGULATORY BODIES, GOVERNMENT AGENCIES, AND OTHER ORGANIZATIONS
  • TABLE 15 REACTIVE HOT MELT ADHESIVES MARKET: DETAILED LIST OF CONFERENCES & EVENTS
  • TABLE 16 REACTIVE HOT MELT ADHESIVES MARKET SIZE, BY RESIN TYPE, 2018–2022 (USD MILLION)
  • TABLE 17 REACTIVE HOT MELT ADHESIVES MARKET SIZE, BY RESIN TYPE, 2023–2028 (USD MILLION)
  • TABLE 18 REACTIVE HOT MELT ADHESIVES MARKET SIZE, BY RESIN TYPE, 2018–2022 (KILOTON)
  • TABLE 19 REACTIVE HOT MELT ADHESIVES MARKET SIZE, BY RESIN TYPE, 2023–2028 (KILOTON)
  • TABLE 20 POLYURETHANE REACTIVE HOT MELT ADHESIVES MARKET SIZE, BY REGION, 2018–2022 (USD MILLION)
  • TABLE 21 POLYURETHANE REACTIVE HOT MELT ADHESIVES MARKET SIZE, BY REGION, 2023–2028 (USD MILLION)
  • TABLE 22 POLYURETHANE REACTIVE HOT MELT ADHESIVES MARKET SIZE, BY REGION, 2018–2022 (KILOTON)
  • TABLE 23 POLYURETHANE REACTIVE HOT MELT ADHESIVES MARKET SIZE, BY REGION, 2023–2028 (KILOTON)
  • TABLE 24 POLYOLEFIN REACTIVE HOT MELT ADHESIVES MARKET SIZE, BY REGION, 2018–2022 (USD MILLION)
  • TABLE 25 POLYOLEFIN REACTIVE HOT MELT ADHESIVES MARKET SIZE, BY REGION, 2023–2028 (USD MILLION)
  • TABLE 26 POLYOLEFIN REACTIVE HOT MELT ADHESIVES MARKET SIZE, BY REGION, 2018–2022 (KILOTON)
  • TABLE 27 POLYOLEFIN REACTIVE HOT MELT ADHESIVES MARKET SIZE, BY REGION, 2023–2028 (KILOTON)
  • TABLE 28 OTHER RESINS REACTIVE HOT MELT ADHESIVES MARKET SIZE, BY REGION, 2018–2022 (USD MILLION)
  • TABLE 29 OTHER RESINS REACTIVE HOT MELT ADHESIVES MARKET SIZE, BY REGION, 2023–2028 (USD MILLION)
  • TABLE 30 OTHER RESINS REACTIVE HOT MELT ADHESIVES MARKET SIZE, BY REGION, 2018–2022 (KILOTON)
  • TABLE 31 OTHER RESINS REACTIVE HOT MELT ADHESIVES MARKET SIZE, BY REGION, 2023–2028 (KILOTON)
  • TABLE 32 REACTIVE HOT MELT ADHESIVES MARKET SIZE, BY SUBSTRATE, 2018–2022 (USD MILLION)
  • TABLE 33 REACTIVE HOT MELT ADHESIVES MARKET SIZE, BY SUBSTRATE, 2023–2028 (USD MILLION)
  • TABLE 34 REACTIVE HOT MELT ADHESIVES MARKET SIZE, BY SUBSTRATE, 2018–2022 (KILOTON)
  • TABLE 35 REACTIVE HOT MELT ADHESIVES MARKET SIZE, BY SUBSTRATE, 2023–2028 (KILOTON)
  • TABLE 36 PLASTIC: REACTIVE HOT MELT ADHESIVES MARKET SIZE, BY REGION, 2018–2022 (USD MILLION)
  • TABLE 37 PLASTIC: REACTIVE HOT MELT ADHESIVES MARKET SIZE, BY REGION, 2023–2028 (USD MILLION)
  • TABLE 38 PLASTIC: REACTIVE HOT MELT ADHESIVES MARKET SIZE, BY REGION, 2018–2022 (KILOTON)
  • TABLE 39 PLASTIC: REACTIVE HOT MELT ADHESIVES MARKET SIZE, BY REGION, 2023–2028 (KILOTON)
  • TABLE 40 WOOD: REACTIVE HOT MELT ADHESIVES MARKET SIZE, BY REGION, 2018–2022 (USD MILLION)
  • TABLE 41 WOOD: REACTIVE HOT MELT ADHESIVES MARKET SIZE, BY REGION, 2023–2028 (USD MILLION)
  • TABLE 42 WOOD: REACTIVE HOT MELT ADHESIVES MARKET SIZE, BY REGION, 2018–2022 (KILOTON)
  • TABLE 43 WOOD: REACTIVE HOT MELT ADHESIVES MARKET SIZE, BY REGION, 2023–2028 (KILOTON)
  • TABLE 44 OTHER SUBSTRATES: REACTIVE HOT MELT ADHESIVES MARKET SIZE, BY REGION, 2018–2022 (USD MILLION)
  • TABLE 45 OTHER SUBSTRATES: REACTIVE HOT MELT ADHESIVES MARKET SIZE, BY REGION, 2023–2028 (USD MILLION)
  • TABLE 46 OTHER SUBSTRATES: REACTIVE HOT MELT ADHESIVES MARKET SIZE, BY REGION, 2018–2022 (KILOTON)
  • TABLE 47 OTHER SUBSTRATES: REACTIVE HOT MELT ADHESIVES MARKET SIZE, BY REGION, 2023–2028 (KILOTON)
  • TABLE 48 REACTIVE HOT MELT ADHESIVES MARKET SIZE, BY APPLICATION, 2018–2022 (USD MILLION)
  • TABLE 49 REACTIVE HOT MELT ADHESIVES MARKET SIZE, BY APPLICATION, 2023–2028 (USD MILLION)
  • TABLE 50 REACTIVE HOT MELT ADHESIVES MARKET SIZE, BY APPLICATION, 2018–2022 (KILOTON)
  • TABLE 51 REACTIVE HOT MELT ADHESIVES MARKET SIZE, BY APPLICATION, 2023–2028 (KILOTON)
  • TABLE 52 REACTIVE HOT MELT ADHESIVES MARKET SIZE IN AUTOMOTIVE & TRANSPORTATION, BY REGION, 2018–2022 (USD MILLION)
  • TABLE 53 REACTIVE HOT MELT ADHESIVES MARKET SIZE IN AUTOMOTIVE & TRANSPORTATION, BY REGION, 2023–2028 (USD MILLION)
  • TABLE 54 REACTIVE HOT MELT ADHESIVES MARKET SIZE IN AUTOMOTIVE & TRANSPORTATION, BY REGION, 2018–2022 (KILOTON)
  • TABLE 55 REACTIVE HOT MELT ADHESIVES MARKET SIZE IN AUTOMOTIVE & TRANSPORTATION, BY REGION, 2023–2028 (KILOTON)
  • TABLE 56 REACTIVE HOT MELT ADHESIVES MARKET SIZE IN FURNITURE & UPHOLSTERY, BY REGION, 2018–2022 (USD MILLION)
  • TABLE 57 REACTIVE HOT MELT ADHESIVES MARKET SIZE IN FURNITURE & UPHOLSTERY, BY REGION, 2023–2028 (USD MILLION)
  • TABLE 58 REACTIVE HOT MELT ADHESIVES MARKET SIZE IN FURNITURE & UPHOLSTERY, BY REGION, 2018–2022 (KILOTON)
  • TABLE 59 REACTIVE HOT MELT ADHESIVES MARKET SIZE IN FURNITURE & UPHOLSTERY, BY REGION, 2023–2028 (KILOTON)
  • TABLE 60 REACTIVE HOT MELT ADHESIVES MARKET SIZE IN TEXTILE, BY REGION, 2018–2022 (USD MILLION)
  • TABLE 61 REACTIVE HOT MELT ADHESIVES MARKET SIZE IN TEXTILE, BY REGION, 2023–2028 (USD MILLION)
  • TABLE 62 REACTIVE HOT MELT ADHESIVES MARKET SIZE IN TEXTILE, BY REGION, 2018–2022 (KILOTON)
  • TABLE 63 REACTIVE HOT MELT ADHESIVES MARKET SIZE IN TEXTILE, BY REGION, 2023–2028 (KILOTON)
  • TABLE 64 REACTIVE HOT MELT ADHESIVES MARKET SIZE IN LAMINATION, BY REGION, 2018–2022 (USD MILLION)
  • TABLE 65 REACTIVE HOT MELT ADHESIVES MARKET SIZE IN LAMINATION, BY REGION, 2023–2028 (USD MILLION)
  • TABLE 66 REACTIVE HOT MELT ADHESIVES MARKET SIZE IN LAMINATION, BY REGION, 2018–2022 (KILOTON)
  • TABLE 67 REACTIVE HOT MELT ADHESIVES MARKET SIZE IN LAMINATION, BY REGION, 2023–2028 (KILOTON)
  • TABLE 68 REACTIVE HOT MELT ADHESIVES MARKET SIZE IN ASSEMBLY, BY REGION, 2018–2022 (USD MILLION)
  • TABLE 69 REACTIVE HOT MELT ADHESIVES MARKET SIZE IN ASSEMBLY, BY REGION, 2023–2028 (USD MILLION)
  • TABLE 70 REACTIVE HOT MELT ADHESIVES MARKET SIZE IN ASSEMBLY, BY REGION, 2018–2022 (KILOTON)
  • TABLE 71 REACTIVE HOT MELT ADHESIVES MARKET SIZE IN ASSEMBLY, BY REGION, 2023–2028 (KILOTON)
  • TABLE 72 REACTIVE HOT MELT ADHESIVES MARKET SIZE IN DOORS & WINDOWS, BY REGION, 2018–2022 (USD MILLION)
  • TABLE 73 REACTIVE HOT MELT ADHESIVES MARKET SIZE IN DOORS & WINDOWS, BY REGION, 2023–2028 (USD MILLION)
  • TABLE 74 REACTIVE HOT MELT ADHESIVES MARKET SIZE IN DOORS & WINDOWS, BY REGION, 2018–2022 (KILOTON)
  • TABLE 75 REACTIVE HOT MELT ADHESIVES MARKET SIZE IN DOORS & WINDOWS, BY REGION, 2023–2028 (KILOTON)
  • TABLE 76 REACTIVE HOT MELT ADHESIVES MARKET SIZE IN OTHER APPLICATIONS, BY REGION, 2018–2022 (USD MILLION)
  • TABLE 77 REACTIVE HOT MELT ADHESIVES MARKET SIZE IN OTHER APPLICATIONS, BY REGION, 2023–2028 (USD MILLION)
  • TABLE 78 REACTIVE HOT MELT ADHESIVES MARKET SIZE IN OTHER APPLICATIONS, BY REGION, 2018–2022 (KILOTON)
  • TABLE 79 REACTIVE HOT MELT ADHESIVES MARKET SIZE IN OTHER APPLICATIONS, BY REGION, 2023–2028 (KILOTON)
  • TABLE 80 REACTIVE HOT MELT ADHESIVES MARKET, BY REGION, 2018–2022 (USD MILLION)
  • TABLE 81 REACTIVE HOT MELT ADHESIVES MARKET, BY REGION, 2023–2028 (USD MILLION)
  • TABLE 82 REACTIVE HOT MELT ADHESIVES MARKET, BY REGION, 2018–2022 (KILOTON)
  • TABLE 83 REACTIVE HOT MELT ADHESIVES MARKET, BY REGION, 2023–2028 (KILOTON)
  • TABLE 84 ASIA PACIFIC: REACTIVE HOT MELT ADHESIVES MARKET, BY COUNTRY, 2018–2022 (USD MILLION)
  • TABLE 85 ASIA PACIFIC: REACTIVE HOT MELT ADHESIVES MARKET, BY COUNTRY, 2023–2028 (USD MILLION)
  • TABLE 86 ASIA PACIFIC: REACTIVE HOT MELT ADHESIVES MARKET, BY COUNTRY, 2018–2022 (KILOTON)
  • TABLE 87 ASIA PACIFIC: REACTIVE HOT MELT ADHESIVES MARKET, BY COUNTRY, 2023–2028 (KILOTON)
  • TABLE 88 ASIA PACIFIC: REACTIVE HOT MELT ADHESIVES MARKET, BY RESIN TYPE, 2018–2022 (USD MILLION)
  • TABLE 89 ASIA PACIFIC: REACTIVE HOT MELT ADHESIVES MARKET, BY RESIN TYPE, 2023–2028 (USD MILLION)
  • TABLE 90 ASIA PACIFIC: REACTIVE HOT MELT ADHESIVES MARKET, BY RESIN TYPE, 2018–2022 (KILOTON)
  • TABLE 91 ASIA PACIFIC: REACTIVE HOT MELT ADHESIVES MARKET, BY RESIN TYPE, 2023–2028 (KILOTON)
  • TABLE 92 ASIA PACIFIC: REACTIVE HOT MELT ADHESIVES MARKET, BY SUBSTRATE, 2018–2022 (USD MILLION)
  • TABLE 93 ASIA PACIFIC: REACTIVE HOT MELT ADHESIVES MARKET, BY SUBSTRATE, 2023–2028 (USD MILLION)
  • TABLE 94 ASIA PACIFIC: REACTIVE HOT MELT ADHESIVES MARKET, BY SUBSTRATE, 2018–2022 (KILOTON)
  • TABLE 95 ASIA PACIFIC: REACTIVE HOT MELT ADHESIVES MARKET, BY SUBSTRATE, 2023–2028 (KILOTON)
  • TABLE 96 ASIA PACIFIC: REACTIVE HOT MELT ADHESIVES MARKET, BY APPLICATION, 2018–2022 (USD MILLION)
  • TABLE 97 ASIA PACIFIC: REACTIVE HOT MELT ADHESIVES MARKET, BY APPLICATION, 2023–2028 (USD MILLION)
  • TABLE 98 ASIA PACIFIC: REACTIVE HOT MELT ADHESIVES MARKET, BY APPLICATION, 2018–2022 (KILOTON)
  • TABLE 99 ASIA PACIFIC: REACTIVE HOT MELT ADHESIVES MARKET, BY APPLICATION, 2023–2028 (KILOTON)
  • TABLE 100 CHINA: REACTIVE HOT MELT ADHESIVES MARKET, BY SUBSTRATE, 2018–2022 (USD MILLION)
  • TABLE 101 CHINA: REACTIVE HOT MELT ADHESIVES MARKET, BY SUBSTRATE, 2023–2028 (USD MILLION)
  • TABLE 102 CHINA: REACTIVE HOT MELT ADHESIVES MARKET, BY SUBSTRATE, 2018–2022 (KILOTON)
  • TABLE 103 CHINA: REACTIVE HOT MELT ADHESIVES MARKET, BY SUBSTRATE, 2023–2028 (KILOTON)
  • TABLE 104 CHINA: REACTIVE HOT MELT ADHESIVES MARKET, BY APPLICATION, 2018–2022 (USD MILLION)
  • TABLE 105 CHINA: REACTIVE HOT MELT ADHESIVES MARKET, BY APPLICATION, 2023–2028 (USD MILLION)
  • TABLE 106 CHINA: REACTIVE HOT MELT ADHESIVES MARKET, BY APPLICATION, 2018–2022 (KILOTON)
  • TABLE 107 CHINA: REACTIVE HOT MELT ADHESIVES MARKET, BY APPLICATION, 2023–2028 (KILOTON)
  • TABLE 108 INDIA: REACTIVE HOT MELT ADHESIVES MARKET, BY SUBSTRATE, 2018–2022 (USD MILLION)
  • TABLE 109 INDIA: REACTIVE HOT MELT ADHESIVES MARKET, BY SUBSTRATE, 2023–2028 (USD MILLION)
  • TABLE 110 INDIA: REACTIVE HOT MELT ADHESIVES MARKET, BY SUBSTRATE, 2018–2022 (KILOTON)
  • TABLE 111 INDIA: REACTIVE HOT MELT ADHESIVES MARKET, BY SUBSTRATE, 2023–2028 (KILOTON)
  • TABLE 112 INDIA: REACTIVE HOT MELT ADHESIVES MARKET, BY APPLICATION, 2018–2022 (USD MILLION)
  • TABLE 113 INDIA: REACTIVE HOT MELT ADHESIVES MARKET, BY APPLICATION, 2023–2028 (USD MILLION)
  • TABLE 114 INDIA: REACTIVE HOT MELT ADHESIVES MARKET, BY APPLICATION, 2018–2022 (KILOTON)
  • TABLE 115 INDIA: REACTIVE HOT MELT ADHESIVES MARKET, BY APPLICATION, 2023–2028 (KILOTON)
  • TABLE 116 JAPAN: REACTIVE HOT MELT ADHESIVES MARKET, BY SUBSTRATE, 2018–2022 (USD MILLION)
  • TABLE 117 JAPAN: REACTIVE HOT MELT ADHESIVES MARKET, BY SUBSTRATE, 2023–2028 (USD MILLION)
  • TABLE 118 JAPAN: REACTIVE HOT MELT ADHESIVES MARKET, BY SUBSTRATE, 2018–2022 (KILOTON)
  • TABLE 119 JAPAN: REACTIVE HOT MELT ADHESIVES MARKET, BY SUBSTRATE, 2023–2028 (KILOTON)
  • TABLE 120 JAPAN: REACTIVE HOT MELT ADHESIVES MARKET, BY APPLICATION, 2018–2022 (USD MILLION)
  • TABLE 121 JAPAN: REACTIVE HOT MELT ADHESIVES MARKET, BY APPLICATION, 2023–2028 (USD MILLION)
  • TABLE 122 JAPAN: REACTIVE HOT MELT ADHESIVES MARKET, BY APPLICATION, 2018–2022 (KILOTON)
  • TABLE 123 JAPAN: REACTIVE HOT MELT ADHESIVES MARKET, BY APPLICATION, 2023–2028 (KILOTON)
  • TABLE 124 SOUTH KOREA: REACTIVE HOT MELT ADHESIVES MARKET, BY SUBSTRATE, 2018–2022 (USD MILLION)
  • TABLE 125 SOUTH KOREA: REACTIVE HOT MELT ADHESIVES MARKET, BY SUBSTRATE, 2023–2028 (USD MILLION)
  • TABLE 126 SOUTH KOREA: REACTIVE HOT MELT ADHESIVES MARKET, BY SUBSTRATE, 2018–2022 (KILOTON)
  • TABLE 127 SOUTH KOREA: REACTIVE HOT MELT ADHESIVES MARKET, BY SUBSTRATE, 2023–2028 (KILOTON)
  • TABLE 128 SOUTH KOREA: REACTIVE HOT MELT ADHESIVES MARKET, BY APPLICATION, 2018–2022 (USD MILLION)
  • TABLE 129 SOUTH KOREA: REACTIVE HOT MELT ADHESIVES MARKET, BY APPLICATION, 2023–2028 (USD MILLION)
  • TABLE 130 SOUTH KOREA: REACTIVE HOT MELT ADHESIVES MARKET, BY APPLICATION, 2018–2022 (KILOTON)
  • TABLE 131 SOUTH KOREA: REACTIVE HOT MELT ADHESIVES MARKET, BY APPLICATION, 2023–2028 (KILOTON)
  • TABLE 132 REST OF ASIA PACIFIC: REACTIVE HOT MELT ADHESIVES MARKET, BY SUBSTRATE, 2018–2022 (USD MILLION)
  • TABLE 133 REST OF ASIA PACIFIC: REACTIVE HOT MELT ADHESIVES MARKET, BY SUBSTRATE, 2023–2028 (USD MILLION)
  • TABLE 134 REST OF ASIA PACIFIC: REACTIVE HOT MELT ADHESIVES MARKET, BY SUBSTRATE, 2018–2022 (KILOTON)
  • TABLE 135 REST OF ASIA PACIFIC: REACTIVE HOT MELT ADHESIVES MARKET, BY SUBSTRATE, 2023–2028 (KILOTON)
  • TABLE 136 REST OF ASIA PACIFIC: REACTIVE HOT MELT ADHESIVES MARKET, BY APPLICATION, 2018–2022 (USD MILLION)
  • TABLE 137 REST OF ASIA PACIFIC: REACTIVE HOT MELT ADHESIVES MARKET, BY APPLICATION, 2023–2028 (USD MILLION)
  • TABLE 138 REST OF ASIA PACIFIC: REACTIVE HOT MELT ADHESIVES MARKET, BY APPLICATION, 2018–2022 (KILOTON)
  • TABLE 139 REST OF ASIA PACIFIC: REACTIVE HOT MELT ADHESIVES MARKET, BY APPLICATION, 2023–2028 (KILOTON)
  • TABLE 140 EUROPE: REACTIVE HOT MELT ADHESIVES MARKET, BY COUNTRY, 2018–2022 (USD MILLION)
  • TABLE 141 EUROPE: REACTIVE HOT MELT ADHESIVES MARKET, BY COUNTRY, 2023–2028 (USD MILLION)
  • TABLE 142 EUROPE: REACTIVE HOT MELT ADHESIVES MARKET, BY COUNTRY, 2018–2022 (KILOTON)
  • TABLE 143 EUROPE: REACTIVE HOT MELT ADHESIVES MARKET, BY COUNTRY, 2023–2028 (KILOTON)
  • TABLE 144 EUROPE: REACTIVE HOT MELT ADHESIVES MARKET, BY RESIN TYPE, 2018–2022 (USD MILLION)
  • TABLE 145 EUROPE: REACTIVE HOT MELT ADHESIVES MARKET, BY RESIN TYPE, 2023–2028 (USD MILLION)
  • TABLE 146 EUROPE: REACTIVE HOT MELT ADHESIVES MARKET, BY RESIN TYPE, 2018–2022 (KILOTON)
  • TABLE 147 EUROPE: REACTIVE HOT MELT ADHESIVES MARKET, BY RESIN TYPE, 2023–2028 (KILOTON)
  • TABLE 148 EUROPE: REACTIVE HOT MELT ADHESIVES MARKET, BY SUBSTRATE, 2018–2022 (USD MILLION)
  • TABLE 149 EUROPE: REACTIVE HOT MELT ADHESIVES MARKET, BY SUBSTRATE, 2023–2028 (USD MILLION)
  • TABLE 150 EUROPE: REACTIVE HOT MELT ADHESIVES MARKET, BY SUBSTRATE, 2018–2022 (KILOTON)
  • TABLE 151 EUROPE: REACTIVE HOT MELT ADHESIVES MARKET, BY SUBSTRATE, 2023–2028 (KILOTON)
  • TABLE 152 EUROPE: REACTIVE HOT MELT ADHESIVES MARKET, BY APPLICATION, 2018–2022 (USD MILLION)
  • TABLE 153 EUROPE: REACTIVE HOT MELT ADHESIVES MARKET, BY APPLICATION, 2023–2028 (USD MILLION)
  • TABLE 154 EUROPE: REACTIVE HOT MELT ADHESIVES MARKET, BY APPLICATION, 2018–2022 (KILOTON)
  • TABLE 155 EUROPE: REACTIVE HOT MELT ADHESIVES MARKET, BY APPLICATION, 2023–2028 (KILOTON)
  • TABLE 156 GERMANY: REACTIVE HOT MELT ADHESIVES MARKET, BY SUBSTRATE, 2018–2022 (USD MILLION)
  • TABLE 157 GERMANY: REACTIVE HOT MELT ADHESIVES MARKET, BY SUBSTRATE, 2023–2028 (USD MILLION)
  • TABLE 158 GERMANY: REACTIVE HOT MELT ADHESIVES MARKET, BY SUBSTRATE, 2018–2022 (KILOTON)
  • TABLE 159 GERMANY: REACTIVE HOT MELT ADHESIVES MARKET, BY SUBSTRATE, 2023–2028 (KILOTON)
  • TABLE 160 GERMANY: REACTIVE HOT MELT ADHESIVES MARKET, BY APPLICATION, 2018–2022 (USD MILLION)
  • TABLE 161 GERMANY: REACTIVE HOT MELT ADHESIVES MARKET, BY APPLICATION, 2023–2028 (USD MILLION)
  • TABLE 162 GERMANY: REACTIVE HOT MELT ADHESIVES MARKET, BY APPLICATION, 2018–2022 (KILOTON)
  • TABLE 163 GERMANY: REACTIVE HOT MELT ADHESIVES MARKET, BY APPLICATION, 2023–2028 (KILOTON)
  • TABLE 164 ITALY: REACTIVE HOT MELT ADHESIVES MARKET, BY SUBSTRATE, 2018–2022 (USD MILLION)
  • TABLE 165 ITALY: REACTIVE HOT MELT ADHESIVES MARKET, BY SUBSTRATE, 2023–2028 (USD MILLION)
  • TABLE 166 ITALY: REACTIVE HOT MELT ADHESIVES MARKET, BY SUBSTRATE, 2018–2022 (KILOTON)
  • TABLE 167 ITALY: REACTIVE HOT MELT ADHESIVES MARKET, BY SUBSTRATE, 2023–2028 (KILOTON)
  • TABLE 168 ITALY: REACTIVE HOT MELT ADHESIVES MARKET, BY APPLICATION, 2018–2022 (USD MILLION)
  • TABLE 169 ITALY: REACTIVE HOT MELT ADHESIVES MARKET, BY APPLICATION, 2023–2028 (USD MILLION)
  • TABLE 170 ITALY: REACTIVE HOT MELT ADHESIVES MARKET, BY APPLICATION, 2018–2022 (KILOTON)
  • TABLE 171 ITALY: REACTIVE HOT MELT ADHESIVES MARKET, BY APPLICATION, 2023–2028 (KILOTON)
  • TABLE 172 FRANCE: REACTIVE HOT MELT ADHESIVES MARKET, BY SUBSTRATE, 2018–2022 (USD MILLION)
  • TABLE 173 FRANCE: REACTIVE HOT MELT ADHESIVES MARKET, BY SUBSTRATE, 2023–2028 (USD MILLION)
  • TABLE 174 FRANCE: REACTIVE HOT MELT ADHESIVES MARKET, BY SUBSTRATE, 2018–2022 (KILOTON)
  • TABLE 175 FRANCE: REACTIVE HOT MELT ADHESIVES MARKET, BY SUBSTRATE, 2023–2028 (KILOTON)
  • TABLE 176 FRANCE: REACTIVE HOT MELT ADHESIVES MARKET, BY APPLICATION, 2018–2022 (USD MILLION)
  • TABLE 177 FRANCE: REACTIVE HOT MELT ADHESIVES MARKET, BY APPLICATION, 2023–2028 (USD MILLION)
  • TABLE 178 FRANCE: REACTIVE HOT MELT ADHESIVES MARKET, BY APPLICATION, 2018–2022 (KILOTON)
  • TABLE 179 FRANCE: REACTIVE HOT MELT ADHESIVES MARKET, BY APPLICATION, 2023–2028 (KILOTON)
  • TABLE 180 UK: REACTIVE HOT MELT ADHESIVES MARKET, BY SUBSTRATE, 2018–2022 (USD MILLION)
  • TABLE 181 UK: REACTIVE HOT MELT ADHESIVES MARKET, BY SUBSTRATE, 2023–2028 (USD MILLION)
  • TABLE 182 UK: REACTIVE HOT MELT ADHESIVES MARKET, BY SUBSTRATE, 2018–2022 (KILOTON)
  • TABLE 183 UK: REACTIVE HOT MELT ADHESIVES MARKET, BY SUBSTRATE, 2023–2028 (KILOTON)
  • TABLE 184 UK: REACTIVE HOT MELT ADHESIVES MARKET, BY APPLICATION, 2018–2022 (USD MILLION)
  • TABLE 185 UK: REACTIVE HOT MELT ADHESIVES MARKET, BY APPLICATION, 2023–2028 (USD MILLION)
  • TABLE 186 UK: REACTIVE HOT MELT ADHESIVES MARKET, BY APPLICATION, 2018–2022 (KILOTON)
  • TABLE 187 UK: REACTIVE HOT MELT ADHESIVES MARKET, BY APPLICATION, 2023–2028 (KILOTON)
  • TABLE 188 RUSSIA: REACTIVE HOT MELT ADHESIVES MARKET, BY SUBSTRATE, 2018–2022 (USD MILLION)
  • TABLE 189 RUSSIA: REACTIVE HOT MELT ADHESIVES MARKET, BY SUBSTRATE, 2023–2028 (USD MILLION)
  • TABLE 190 RUSSIA: REACTIVE HOT MELT ADHESIVES MARKET, BY SUBSTRATE, 2018–2022 (KILOTON)
  • TABLE 191 RUSSIA: REACTIVE HOT MELT ADHESIVES MARKET, BY SUBSTRATE, 2023–2028 (KILOTON)
  • TABLE 192 RUSSIA: REACTIVE HOT MELT ADHESIVES MARKET, BY APPLICATION, 2018–2022 (USD MILLION)
  • TABLE 193 RUSSIA: REACTIVE HOT MELT ADHESIVES MARKET, BY APPLICATION, 2023–2028 (USD MILLION)
  • TABLE 194 RUSSIA: REACTIVE HOT MELT ADHESIVES MARKET, BY APPLICATION, 2018–2022 (KILOTON)
  • TABLE 195 RUSSIA: REACTIVE HOT MELT ADHESIVES MARKET, BY APPLICATION, 2023–2028 (KILOTON)
  • TABLE 196 REST OF EUROPE: REACTIVE HOT MELT ADHESIVES MARKET, BY SUBSTRATE, 2018–2022 (USD MILLION)
  • TABLE 197 REST OF EUROPE: REACTIVE HOT MELT ADHESIVES MARKET, BY SUBSTRATE, 2023–2028 (USD MILLION)
  • TABLE 198 REST OF EUROPE: REACTIVE HOT MELT ADHESIVES MARKET, BY SUBSTRATE, 2018–2022 (KILOTON)
  • TABLE 199 REST OF EUROPE: REACTIVE HOT MELT ADHESIVES MARKET, BY SUBSTRATE, 2023–2028 (KILOTON)
  • TABLE 200 REST OF EUROPE: REACTIVE HOT MELT ADHESIVES MARKET, BY APPLICATION, 2018–2022 (USD MILLION)
  • TABLE 201 REST OF EUROPE: REACTIVE HOT MELT ADHESIVES MARKET, BY APPLICATION, 2023–2028 (USD MILLION)
  • TABLE 202 REST OF EUROPE: REACTIVE HOT MELT ADHESIVES MARKET, BY APPLICATION, 2018–2022 (KILOTON)
  • TABLE 203 REST OF EUROPE: REACTIVE HOT MELT ADHESIVES MARKET, BY APPLICATION, 2023–2028 (KILOTON)
  • TABLE 204 NORTH AMERICA: REACTIVE HOT MELT ADHESIVES MARKET, BY COUNTRY, 2018–2022 (USD MILLION)
  • TABLE 205 NORTH AMERICA: REACTIVE HOT MELT ADHESIVES MARKET, BY COUNTRY, 2023–2028 (USD MILLION)
  • TABLE 206 NORTH AMERICA: REACTIVE HOT MELT ADHESIVES MARKET, BY COUNTRY, 2018–2022 (KILOTON)
  • TABLE 207 NORTH AMERICA: REACTIVE HOT MELT ADHESIVES MARKET, BY COUNTRY, 2023–2028 (KILOTON)
  • TABLE 208 NORTH AMERICA: REACTIVE HOT MELT ADHESIVES MARKET, BY RESIN TYPE, 2018–2022 (USD MILLION)
  • TABLE 209 NORTH AMERICA: REACTIVE HOT MELT ADHESIVES MARKET, BY RESIN TYPE, 2023–2028 (USD MILLION)
  • TABLE 210 NORTH AMERICA: REACTIVE HOT MELT ADHESIVES MARKET, BY RESIN TYPE, 2018–2022 (KILOTON)
  • TABLE 211 NORTH AMERICA: REACTIVE HOT MELT ADHESIVES MARKET, BY RESIN TYPE, 2023–2028 (KILOTON)
  • TABLE 212 NORTH AMERICA: REACTIVE HOT MELT ADHESIVES MARKET, BY SUBSTRATE, 2018–2022 (USD MILLION)
  • TABLE 213 NORTH AMERICA: REACTIVE HOT MELT ADHESIVES MARKET, BY SUBSTRATE, 2023–2028 (USD MILLION)
  • TABLE 214 NORTH AMERICA: REACTIVE HOT MELT ADHESIVES MARKET, BY SUBSTRATE, 2018–2022 (KILOTON)
  • TABLE 215 NORTH AMERICA: REACTIVE HOT MELT ADHESIVES MARKET, BY SUBSTRATE, 2023–2028 (KILOTON)
  • TABLE 216 NORTH AMERICA: REACTIVE HOT MELT ADHESIVES MARKET, BY APPLICATION, 2018–2022 (USD MILLION)
  • TABLE 217 NORTH AMERICA: REACTIVE HOT MELT ADHESIVES MARKET, BY APPLICATION, 2023–2028 (USD MILLION)
  • TABLE 218 NORTH AMERICA: REACTIVE HOT MELT ADHESIVES MARKET, BY APPLICATION, 2018–2022 (KILOTON)
  • TABLE 219 NORTH AMERICA: REACTIVE HOT MELT ADHESIVES MARKET, BY APPLICATION, 2023–2028 (KILOTON)
  • TABLE 220 US: REACTIVE HOT MELT ADHESIVES MARKET, BY SUBSTRATE, 2018–2022 (USD MILLION)
  • TABLE 221 US: REACTIVE HOT MELT ADHESIVES MARKET, BY SUBSTRATE, 2023–2028 (USD MILLION)
  • TABLE 222 US: REACTIVE HOT MELT ADHESIVES MARKET, BY SUBSTRATE, 2018–2022 (KILOTON)
  • TABLE 223 US: REACTIVE HOT MELT ADHESIVES MARKET, BY SUBSTRATE, 2023–2028 (KILOTON)
  • TABLE 224 US: REACTIVE HOT MELT ADHESIVES MARKET, BY APPLICATION, 2018–2022 (USD MILLION)
  • TABLE 225 US: REACTIVE HOT MELT ADHESIVES MARKET, BY APPLICATION, 2023–2028 (USD MILLION)
  • TABLE 226 US: REACTIVE HOT MELT ADHESIVES MARKET, BY APPLICATION, 2018–2022 (KILOTON)
  • TABLE 227 US: REACTIVE HOT MELT ADHESIVES MARKET, BY APPLICATION, 2023–2028 (KILOTON)
  • TABLE 228 CANADA: REACTIVE HOT MELT ADHESIVES MARKET, BY SUBSTRATE, 2018–2022 (USD MILLION)
  • TABLE 229 CANADA: REACTIVE HOT MELT ADHESIVES MARKET, BY SUBSTRATE, 2023–2028 (USD MILLION)
  • TABLE 230 CANADA: REACTIVE HOT MELT ADHESIVES MARKET, BY SUBSTRATE, 2018–2022 (KILOTON)
  • TABLE 231 CANADA: REACTIVE HOT MELT ADHESIVES MARKET, BY SUBSTRATE, 2023–2028 (KILOTON)
  • TABLE 232 CANADA: REACTIVE HOT MELT ADHESIVES MARKET, BY APPLICATION, 2018–2022 (USD MILLION)
  • TABLE 233 CANADA: REACTIVE HOT MELT ADHESIVES MARKET, BY APPLICATION, 2023–2028 (USD MILLION)
  • TABLE 234 CANADA: REACTIVE HOT MELT ADHESIVES MARKET, BY APPLICATION, 2018–2022 (KILOTON)
  • TABLE 235 CANADA: REACTIVE HOT MELT ADHESIVES MARKET, BY APPLICATION, 2023–2028 (KILOTON)
  • TABLE 236 MEXICO: REACTIVE HOT MELT ADHESIVES MARKET, BY SUBSTRATE, 2018–2022 (USD MILLION)
  • TABLE 237 MEXICO: REACTIVE HOT MELT ADHESIVES MARKET, BY SUBSTRATE, 2023–2028 (USD MILLION)
  • TABLE 238 MEXICO: REACTIVE HOT MELT ADHESIVES MARKET, BY SUBSTRATE, 2018–2022 (KILOTON)
  • TABLE 239 MEXICO: REACTIVE HOT MELT ADHESIVES MARKET, BY SUBSTRATE, 2023–2028 (KILOTON)
  • TABLE 240 MEXICO: REACTIVE HOT MELT ADHESIVES MARKET, BY APPLICATION, 2018–2022 (USD MILLION)
  • TABLE 241 MEXICO: REACTIVE HOT MELT ADHESIVES MARKET, BY APPLICATION, 2023–2028 (USD MILLION)
  • TABLE 242 MEXICO: REACTIVE HOT MELT ADHESIVES MARKET, BY APPLICATION, 2018–2022 (KILOTON)
  • TABLE 243 MEXICO: REACTIVE HOT MELT ADHESIVES MARKET, BY APPLICATION, 2023–2028 (KILOTON)
  • TABLE 244 MIDDLE EAST & AFRICA: REACTIVE HOT MELT ADHESIVES MARKET, BY COUNTRY, 2018–2022 (USD MILLION)
  • TABLE 245 MIDDLE EAST & AFRICA: REACTIVE HOT MELT ADHESIVES MARKET, BY COUNTRY, 2023–2028 (USD MILLION)
  • TABLE 246 MIDDLE EAST & AFRICA: REACTIVE HOT MELT ADHESIVES MARKET, BY COUNTRY, 2018–2022 (KILOTON)
  • TABLE 247 MIDDLE EAST & AFRICA: REACTIVE HOT MELT ADHESIVES MARKET, BY COUNTRY, 2023–2028 (KILOTON)
  • TABLE 248 MIDDLE EAST & AFRICA: REACTIVE HOT MELT ADHESIVES MARKET, BY RESIN TYPE, 2018–2022 (USD MILLION)
  • TABLE 249 MIDDLE EAST & AFRICA: REACTIVE HOT MELT ADHESIVES MARKET, BY RESIN TYPE, 2023–2028 (USD MILLION)
  • TABLE 250 MIDDLE EAST & AFRICA: REACTIVE HOT MELT ADHESIVES MARKET, BY RESIN TYPE, 2018–2022 (KILOTON)
  • TABLE 251 MIDDLE EAST & AFRICA: REACTIVE HOT MELT ADHESIVES MARKET, BY RESIN TYPE, 2023–2028 (KILOTON)
  • TABLE 252 MIDDLE EAST & AFRICA: REACTIVE HOT MELT ADHESIVES MARKET, BY SUBSTRATE, 2018–2022 (USD MILLION)
  • TABLE 253 MIDDLE EAST & AFRICA: REACTIVE HOT MELT ADHESIVES MARKET, BY SUBSTRATE, 2023–2028 (USD MILLION)
  • TABLE 254 MIDDLE EAST & AFRICA: REACTIVE HOT MELT ADHESIVES MARKET, BY SUBSTRATE, 2018–2022 (KILOTON)
  • TABLE 255 MIDDLE EAST & AFRICA: REACTIVE HOT MELT ADHESIVES MARKET, BY SUBSTRATE, 2023–2028 (KILOTON)
  • TABLE 256 MIDDLE EAST & AFRICA: REACTIVE HOT MELT ADHESIVES MARKET, BY APPLICATION, 2018–2022 (USD MILLION)
  • TABLE 257 MIDDLE EAST & AFRICA: REACTIVE HOT MELT ADHESIVES MARKET, BY APPLICATION, 2023–2028 (USD MILLION)
  • TABLE 258 MIDDLE EAST & AFRICA: REACTIVE HOT MELT ADHESIVES MARKET, BY APPLICATION, 2018–2022 (KILOTON)
  • TABLE 259 MIDDLE EAST & AFRICA: REACTIVE HOT MELT ADHESIVES MARKET, BY APPLICATION, 2023–2028 (KILOTON)
  • TABLE 260 UAE: REACTIVE HOT MELT ADHESIVES MARKET, BY SUBSTRATE, 2018–2022 (USD MILLION)
  • TABLE 261 UAE: REACTIVE HOT MELT ADHESIVES MARKET, BY SUBSTRATE, 2023–2028 (USD MILLION)
  • TABLE 262 UAE: REACTIVE HOT MELT ADHESIVES MARKET, BY SUBSTRATE, 2018–2022 (KILOTON)
  • TABLE 263 UAE: REACTIVE HOT MELT ADHESIVES MARKET, BY SUBSTRATE, 2023–2028 (KILOTON)
  • TABLE 264 UAE: REACTIVE HOT MELT ADHESIVES MARKET, BY APPLICATION, 2018–2022 (USD MILLION)
  • TABLE 265 UAE: REACTIVE HOT MELT ADHESIVES MARKET, BY APPLICATION, 2023–2028 (USD MILLION)
  • TABLE 266 UAE: REACTIVE HOT MELT ADHESIVES MARKET, BY APPLICATION, 2018–2022 (KILOTON)
  • TABLE 267 UAE: REACTIVE HOT MELT ADHESIVES MARKET, BY APPLICATION, 2023–2028 (KILOTON)
  • TABLE 268 SAUDI ARABIA: REACTIVE HOT MELT ADHESIVES MARKET, BY SUBSTRATE, 2018–2022 (USD MILLION)
  • TABLE 269 SAUDI ARABIA: REACTIVE HOT MELT ADHESIVES MARKET, BY SUBSTRATE, 2023–2028 (USD MILLION)
  • TABLE 270 SAUDI ARABIA: REACTIVE HOT MELT ADHESIVES MARKET, BY SUBSTRATE, 2018–2022 (KILOTON)
  • TABLE 271 SAUDI ARABIA: REACTIVE HOT MELT ADHESIVES MARKET, BY SUBSTRATE, 2023–2028 (KILOTON)
  • TABLE 272 SAUDI ARABIA: REACTIVE HOT MELT ADHESIVES MARKET, BY APPLICATION, 2018–2022 (USD MILLION)
  • TABLE 273 SAUDI ARABIA: REACTIVE HOT MELT ADHESIVES MARKET, BY APPLICATION, 2023–2028 (USD MILLION)
  • TABLE 274 SAUDI ARABIA: REACTIVE HOT MELT ADHESIVES MARKET, BY APPLICATION, 2018–2022 (KILOTON)
  • TABLE 275 SAUDI ARABIA: REACTIVE HOT MELT ADHESIVES MARKET, BY APPLICATION, 2023–2028 (KILOTON)
  • TABLE 276 REST OF GCC COUNTRIES: REACTIVE HOT MELT ADHESIVES MARKET, BY SUBSTRATE, 2018–2022 (USD MILLION)
  • TABLE 277 REST OF GCC COUNTRIES: REACTIVE HOT MELT ADHESIVES MARKET, BY SUBSTRATE, 2023–2028 (USD MILLION)
  • TABLE 278 REST OF GCC COUNTRIES: REACTIVE HOT MELT ADHESIVES MARKET, BY SUBSTRATE, 2018–2022 (KILOTON)
  • TABLE 279 REST OF GCC COUNTRIES: REACTIVE HOT MELT ADHESIVES MARKET, BY SUBSTRATE, 2023–2028 (KILOTON)
  • TABLE 280 REST OF GCC COUNTRIES: REACTIVE HOT MELT ADHESIVES MARKET, BY APPLICATION, 2018–2022 (USD MILLION)
  • TABLE 281 REST OF GCC COUNTRIES: REACTIVE HOT MELT ADHESIVES MARKET, BY APPLICATION, 2023–2028 (USD MILLION)
  • TABLE 282 REST OF GCC COUNTRIES: REACTIVE HOT MELT ADHESIVES MARKET, BY APPLICATION, 2018–2022 (KILOTON)
  • TABLE 283 REST OF GCC COUNTRIES: REACTIVE HOT MELT ADHESIVES MARKET, BY APPLICATION, 2023–2028 (KILOTON)
  • TABLE 284 SOUTH AFRICA: REACTIVE HOT MELT ADHESIVES MARKET, BY SUBSTRATE, 2018–2022 (USD MILLION)
  • TABLE 285 SOUTH AFRICA: REACTIVE HOT MELT ADHESIVES MARKET, BY SUBSTRATE, 2023–2028 (USD MILLION)
  • TABLE 286 SOUTH AFRICA: REACTIVE HOT MELT ADHESIVES MARKET, BY SUBSTRATE, 2018–2022 (KILOTON)
  • TABLE 287 SOUTH AFRICA: REACTIVE HOT MELT ADHESIVES MARKET, BY SUBSTRATE, 2023–2028 (KILOTON)
  • TABLE 288 SOUTH AFRICA: REACTIVE HOT MELT ADHESIVES MARKET, BY APPLICATION, 2018–2022 (USD MILLION)
  • TABLE 289 SOUTH AFRICA: REACTIVE HOT MELT ADHESIVES MARKET, BY APPLICATION, 2023–2028 (USD MILLION)
  • TABLE 290 SOUTH AFRICA: REACTIVE HOT MELT ADHESIVES MARKET, BY APPLICATION, 2018–2022 (KILOTON)
  • TABLE 291 SOUTH AFRICA: REACTIVE HOT MELT ADHESIVES MARKET, BY APPLICATION, 2023–2028 (KILOTON)
  • TABLE 292 TURKEY: REACTIVE HOT MELT ADHESIVES MARKET, BY SUBSTRATE, 2018–2022 (USD MILLION)
  • TABLE 293 TURKEY: REACTIVE HOT MELT ADHESIVES MARKET, BY SUBSTRATE, 2023–2028 (USD MILLION)
  • TABLE 294 TURKEY: REACTIVE HOT MELT ADHESIVES MARKET, BY SUBSTRATE, 2018–2022 (KILOTON)
  • TABLE 295 TURKEY: REACTIVE HOT MELT ADHESIVES MARKET, BY SUBSTRATE, 2023–2028 (KILOTON)
  • TABLE 296 TURKEY: REACTIVE HOT MELT ADHESIVES MARKET, BY APPLICATION, 2018–2022 (USD MILLION)
  • TABLE 297 TURKEY: REACTIVE HOT MELT ADHESIVES MARKET, BY APPLICATION, 2023–2028 (USD MILLION)
  • TABLE 298 TURKEY: REACTIVE HOT MELT ADHESIVES MARKET, BY APPLICATION, 2018–2022 (KILOTON)
  • TABLE 299 TURKEY: REACTIVE HOT MELT ADHESIVES MARKET, BY APPLICATION, 2023–2028 (KILOTON)
  • TABLE 300 REST OF MIDDLE EAST & AFRICA: REACTIVE HOT MELT ADHESIVES MARKET, BY SUBSTRATE, 2018–2022 (USD MILLION)
  • TABLE 301 REST OF MIDDLE EAST & AFRICA: REACTIVE HOT MELT ADHESIVES MARKET, BY SUBSTRATE, 2023–2028 (USD MILLION)
  • TABLE 302 REST OF MIDDLE EAST & AFRICA: REACTIVE HOT MELT ADHESIVES MARKET, BY SUBSTRATE, 2018–2022 (KILOTON)
  • TABLE 303 REST OF MIDDLE EAST & AFRICA: REACTIVE HOT MELT ADHESIVES MARKET, BY SUBSTRATE, 2023–2028 (KILOTON)
  • TABLE 304 REST OF MIDDLE EAST & AFRICA: REACTIVE HOT MELT ADHESIVES MARKET, BY APPLICATION, 2018–2022 (USD MILLION)
  • TABLE 305 REST OF MIDDLE EAST & AFRICA: REACTIVE HOT MELT ADHESIVES MARKET, BY APPLICATION, 2023–2028 (USD MILLION)
  • TABLE 306 REST OF MIDDLE EAST & AFRICA: REACTIVE HOT MELT ADHESIVES MARKET, BY APPLICATION, 2018–2022 (KILOTON)
  • TABLE 307 REST OF MIDDLE EAST & AFRICA: REACTIVE HOT MELT ADHESIVES MARKET, BY APPLICATION, 2023–2028 (KILOTON)
  • TABLE 308 SOUTH AMERICA: REACTIVE HOT MELT ADHESIVES MARKET, BY COUNTRY, 2018–2022 (USD MILLION)
  • TABLE 309 SOUTH AMERICA: REACTIVE HOT MELT ADHESIVES MARKET, BY COUNTRY, 2023–2028 (USD MILLION)
  • TABLE 310 SOUTH AMERICA: REACTIVE HOT MELT ADHESIVES MARKET, BY COUNTRY, 2018–2022 (KILOTON)
  • TABLE 311 SOUTH AMERICA: REACTIVE HOT MELT ADHESIVES MARKET, BY COUNTRY, 2023–2028 (KILOTON)
  • TABLE 312 SOUTH AMERICA: REACTIVE HOT MELT ADHESIVES MARKET, BY RESIN TYPE, 2018–2022 (USD MILLION)
  • TABLE 313 SOUTH AMERICA: REACTIVE HOT MELT ADHESIVES MARKET, BY RESIN TYPE, 2023–2028 (USD MILLION)
  • TABLE 314 SOUTH AMERICA: REACTIVE HOT MELT ADHESIVES MARKET, BY RESIN TYPE, 2018–2022 (KILOTON)
  • TABLE 315 SOUTH AMERICA: REACTIVE HOT MELT ADHESIVES MARKET, BY RESIN TYPE, 2023–2028 (KILOTON)
  • TABLE 316 SOUTH AMERICA: REACTIVE HOT MELT ADHESIVES MARKET, BY SUBSTRATE, 2018–2022 (USD MILLION)
  • TABLE 317 SOUTH AMERICA: REACTIVE HOT MELT ADHESIVES MARKET, BY SUBSTRATE, 2023–2028 (USD MILLION)
  • TABLE 318 SOUTH AMERICA: REACTIVE HOT MELT ADHESIVES MARKET, BY SUBSTRATE, 2018–2022 (KILOTON)
  • TABLE 319 SOUTH AMERICA: REACTIVE HOT MELT ADHESIVES MARKET, BY SUBSTRATE, 2023–2028 (KILOTON)
  • TABLE 320 SOUTH AMERICA: REACTIVE HOT MELT ADHESIVES MARKET, BY APPLICATION, 2018–2022 (USD MILLION)
  • TABLE 321 SOUTH AMERICA: REACTIVE HOT MELT ADHESIVES MARKET, BY APPLICATION, 2023–2028 (USD MILLION)
  • TABLE 322 SOUTH AMERICA: REACTIVE HOT MELT ADHESIVES MARKET, BY APPLICATION, 2018–2022 (KILOTON)
  • TABLE 323 SOUTH AMERICA: REACTIVE HOT MELT ADHESIVES MARKET, BY APPLICATION, 2023–2028 (KILOTON)
  • TABLE 324 BRAZIL: REACTIVE HOT MELT ADHESIVES MARKET, BY SUBSTRATE, 2018–2022 (USD MILLION)
  • TABLE 325 BRAZIL: REACTIVE HOT MELT ADHESIVES MARKET, BY SUBSTRATE, 2023–2028 (USD MILLION)
  • TABLE 326 BRAZIL: REACTIVE HOT MELT ADHESIVES MARKET, BY SUBSTRATE, 2018–2022 (KILOTON)
  • TABLE 327 BRAZIL: REACTIVE HOT MELT ADHESIVES MARKET, BY SUBSTRATE, 2023–2028 (KILOTON)
  • TABLE 328 BRAZIL: REACTIVE HOT MELT ADHESIVES MARKET, BY APPLICATION, 2018–2022 (USD MILLION)
  • TABLE 329 BRAZIL: REACTIVE HOT MELT ADHESIVES MARKET, BY APPLICATION, 2023–2028 (USD MILLION)
  • TABLE 330 BRAZIL: REACTIVE HOT MELT ADHESIVES MARKET, BY APPLICATION, 2018–2022 (KILOTON)
  • TABLE 331 BRAZIL: REACTIVE HOT MELT ADHESIVES MARKET, BY APPLICATION, 2023–2028 (KILOTON)
  • TABLE 332 ARGENTINA: REACTIVE HOT MELT ADHESIVES MARKET, BY SUBSTRATE, 2018–2022 (USD MILLION)
  • TABLE 333 ARGENTINA: REACTIVE HOT MELT ADHESIVES MARKET, BY SUBSTRATE, 2023–2028 (USD MILLION)
  • TABLE 334 ARGENTINA: REACTIVE HOT MELT ADHESIVES MARKET, BY SUBSTRATE, 2018–2022 (KILOTON)
  • TABLE 335 ARGENTINA: REACTIVE HOT MELT ADHESIVES MARKET, BY SUBSTRATE, 2023–2028 (KILOTON)
  • TABLE 336 ARGENTINA: REACTIVE HOT MELT ADHESIVES MARKET, BY APPLICATION, 2018–2022 (USD MILLION)
  • TABLE 337 ARGENTINA: REACTIVE HOT MELT ADHESIVES MARKET, BY APPLICATION, 2023–2028 (USD MILLION)
  • TABLE 338 ARGENTINA: REACTIVE HOT MELT ADHESIVES MARKET, BY APPLICATION, 2018–2022 (KILOTON)
  • TABLE 339 ARGENTINA: REACTIVE HOT MELT ADHESIVES MARKET, BY APPLICATION, 2023–2028 (KILOTON)
  • TABLE 340 REST OF SOUTH AMERICA: REACTIVE HOT MELT ADHESIVES MARKET, BY SUBSTRATE, 2018–2022 (USD MILLION)
  • TABLE 341 REST OF SOUTH AMERICA: REACTIVE HOT MELT ADHESIVES MARKET, BY SUBSTRATE, 2023–2028 (USD MILLION)
  • TABLE 342 REST OF SOUTH AMERICA: REACTIVE HOT MELT ADHESIVES MARKET, BY SUBSTRATE, 2018–2022 (KILOTON)
  • TABLE 343 REST OF SOUTH AMERICA: REACTIVE HOT MELT ADHESIVES MARKET, BY SUBSTRATE, 2023–2028 (KILOTON)
  • TABLE 344 REST OF SOUTH AMERICA: REACTIVE HOT MELT ADHESIVES MARKET, BY APPLICATION, 2018–2022 (USD MILLION)
  • TABLE 345 REST OF SOUTH AMERICA: REACTIVE HOT MELT ADHESIVES MARKET, BY APPLICATION, 2023–2028 (USD MILLION)
  • TABLE 346 REST OF SOUTH AMERICA: REACTIVE HOT MELT ADHESIVES MARKET, BY APPLICATION, 2018–2022 (KILOTON)
  • TABLE 347 REST OF SOUTH AMERICA: REACTIVE HOT MELT ADHESIVES MARKET, BY APPLICATION, 2023–2028 (KILOTON)
  • TABLE 348 REACTIVE HOT MELT ADHESIVES MARKET: DEGREE OF COMPETITION
  • TABLE 349 APPLICATION FOOTPRINT (25 COMPANIES)
  • TABLE 350 REGION FOOTPRINT (25 COMPANIES)
  • TABLE 351 COMPANY FOOTPRINT (25 COMPANIES)
  • TABLE 352 REACTIVE HOT MELT ADHESIVES MARKET: DETAILED LIST OF KEY STARTUPS/SMES
  • TABLE 353 REACTIVE HOT MELT ADHESIVES MARKET: COMPETITIVE BENCHMARKING OF KEY PLAYERS [STARTUPS/SMES]
  • TABLE 354 REACTIVE HOT MELT ADHESIVES MARKET: PRODUCT LAUNCHES, 2018–2023
  • TABLE 355 REACTIVE HOT MELT ADHESIVES MARKET: DEALS, 2018–2023
  • TABLE 356 REACTIVE HOT MELT ADHESIVES MARKET: OTHERS, 2018–2023
  • TABLE 357 HENKEL AG & CO. KGAA: COMPANY OVERVIEW
  • TABLE 358 HENKEL AG & CO. KGAA: PRODUCT LAUNCHES
  • TABLE 359 HENKEL AG & CO. KGAA: OTHER DEVELOPMENTS
  • TABLE 360 H.B. FULLER CO.: COMPANY OVERVIEW
  • TABLE 361 H.B. FULLER COMPANY: PRODUCT LAUNCHES
  • TABLE 362 H.B. FULLER COMPANY: DEALS
  • TABLE 363 H.B. FULLER COMPANY: OTHER DEVELOPMENTS
  • TABLE 364 3M: COMPANY OVERVIEW
  • TABLE 365 3M: DEALS
  • TABLE 366 JOWAT SE: COMPANY OVERVIEW
  • TABLE 367 JOWAT SE: PRODUCT LAUNCHES
  • TABLE 368 JOWAT SE: DEALS
  • TABLE 369 JOWAT SE: OTHER DEVELOPMENTS
  • TABLE 370 ARKEMA: COMPANY OVERVIEW
  • TABLE 371 ARKEMA: PRODUCT LAUNCHES
  • TABLE 372 ARKEMA: DEALS
  • TABLE 373 ARKEMA: OTHER DEVELOPMENTS
  • TABLE 374 THE DOW CHEMICAL COMPANY: COMPANY OVERVIEW
  • TABLE 375 THE DOW CHEMICAL COMPANY: OTHER DEVELOPMENTS
  • TABLE 376 SIKA AG: COMPANY OVERVIEW
  • TABLE 377 SIKA AG: DEALS
  • TABLE 378 SIKA AG: OTHER DEVELOPMENTS
  • TABLE 379 DIC CORPORATION: COMPANY OVERVIEW
  • TABLE 380 NANPAO RESINS CHEMICAL GROUP: COMPANY OVERVIEW
  • TABLE 381 DAUBERT CHEMICAL COMPANY: COMPANY OVERVIEW
  • TABLE 382 KLEIBERIT SE & CO. KG: COMPANY OVERVIEW
  • TABLE 383 TEX YEAR INDUSTRIES INC.: COMPANY OVERVIEW
  • TABLE 384 CHEMENCE: COMPANY OVERVIEW
  • TABLE 385 CATTIE ADHESIVES: COMPANY OVERVIEW
  • TABLE 386 FRANKLIN INTERNATIONAL: COMPANY OVERVIEW
  • TABLE 387 THE REYNOLDS COMPANY: COMPANY OVERVIEW
  • TABLE 388 ADHESIVES DIRECT UK LIMITED: COMPANY OVERVIEW
  • TABLE 389 BUHNEN GMBH & CO. KG: COMPANY OVERVIEW
  • TABLE 390 CHERNG TAY TECHNOLOGY CO., LTD.: COMPANY OVERVIEW
  • TABLE 391 WORTHEN INDUSTRIES: COMPANY OVERVIEW
  • TABLE 392 COATING P. MATERIALS CO., LTD.: COMPANY OVERVIEW
  • TABLE 393 TIANYANG NEW MATERIALS (SHANGHAI) TECHNOLOGY CO., LTD.: COMPANY OVERVIEW
  • TABLE 394 TAIWAN PU CORPORATION: COMPANY OVERVIEW
  • TABLE 395 ADVATAC LTD: COMPANY OVERVIEW
  • TABLE 396 WENZHOU HUATE HOT MELT ADHESIVE CO., LTD.: COMPANY OVERVIEW
  • TABLE 397 HMA MARKET, BY RESIN TYPE, 2017–2020 (USD MILLION)
  • TABLE 398 HMA MARKET, BY RESIN TYPE, 2021–2027 (USD MILLION)
  • TABLE 399 HMA MARKET, BY RESIN TYPE, 2017–2020 (KILOTON)
  • TABLE 400 HMA MARKET, BY RESIN TYPE, 2021–2027 (KILOTON)
  • TABLE 401 HMA MARKET, BY APPLICATION, 2017–2020 (USD MILLION)
  • TABLE 402 HMA MARKET, BY APPLICATION, 2021–2027 (USD MILLION)
  • TABLE 403 HMA MARKET, BY APPLICATION, 2017–2020 (KILOTON)
  • TABLE 404 HMA MARKET, BY APPLICATION, 2021–2027 (KILOTON)
  • TABLE 405 HMA MARKET, BY REGION, 2017–2020 (USD MILLION)
  • TABLE 406 HMA MARKET, BY REGION, 2021–2027 (USD MILLION)
  • TABLE 407 HMA MARKET, BY REGION, 2017–2020 (KILOTON)
  • TABLE 408 HMA MARKET, BY REGION, 2021–2027 (KILOTON)
LIST OF FIGURES
 
  • FIGURE 1 REACTIVE HOT MELT ADHESIVES MARKET SEGMENTATION
  • FIGURE 2 REACTIVE HOT MELT ADHESIVES MARKET: RESEARCH DESIGN
  • FIGURE 3 MARKET SIZE ESTIMATION: BOTTOM-UP APPROACH
  • FIGURE 4 MARKET SIZE ESTIMATION: TOP-DOWN APPROACH
  • FIGURE 5 REACTIVE HOT MELT ADHESIVES MARKET: DATA TRIANGULATION
  • FIGURE 6 POLYURETHANE RESIN-BASED REACTIVE HOT MELT ADHESIVES DOMINATED OVERALL MARKET IN 2022
  • FIGURE 7 AUTOMOTIVE & TRANSPORTATION APPLICATION ACCOUNTED FOR LARGEST MARKET SHARE IN 2022
  • FIGURE 8 PLASTIC SUBSTRATE SEGMENT LED OVERALL MARKET IN 2022
  • FIGURE 9 ASIA PACIFIC TO BE FASTEST-GROWING MARKET FOR REACTIVE HOT MELT ADHESIVES
  • FIGURE 10 REACTIVE HOT MELT ADHESIVES MARKET TO WITNESS MODERATE GROWTH BETWEEN 2023 AND 2028
  • FIGURE 11 POLYURETHANE TO BE DOMINANT SEGMENT BETWEEN 2023 AND 2028
  • FIGURE 12 CHINA DOMINATED MARKET IN ASIA PACIFIC
  • FIGURE 13 REACTIVE HOT MELT ADHESIVES MARKET TO WITNESS HIGHER GROWTH IN DEVELOPING COUNTRIES
  • FIGURE 14 AUTOMOTIVE & TRANSPORTATION TO REGISTER HIGHEST CAGR IN REACTIVE HOT MELT ADHESIVES MARKET
  • FIGURE 15 INDIA TO EMERGE AS A LUCRATIVE MARKET FOR REACTIVE HOT MELT ADHESIVES BETWEEN 2023 AND 2028
  • FIGURE 16 DRIVERS, RESTRAINTS, OPPORTUNITIES, AND CHALLENGES IN REACTIVE HOT MELT ADHESIVES MARKET
  • FIGURE 17 PORTER’S FIVE FORCES ANALYSIS: REACTIVE HOT MELT ADHESIVES MARKET
  • FIGURE 18 ESTIMATED VALUE OF GLOBAL FURNITURE MARKET, 2020–2027
  • FIGURE 19 GLOBAL SPENDING IN CONSTRUCTION INDUSTRY, 2014–2035
  • FIGURE 20 REACTIVE HOT MELT ADHESIVES MARKET: SUPPLY CHAIN ANALYSIS
  • FIGURE 21 REACTIVE HOT MELT ADHESIVES MARKET: ECOSYSTEM MAP
  • FIGURE 22 TRENDS IN END-USE INDUSTRIES IMPACTING BUSINESS OF REACTIVE HOT MELT ADHESIVE MANUFACTURERS
  • FIGURE 23 INFLUENCE OF STAKEHOLDERS IN BUYING PROCESS
  • FIGURE 24 KEY BUYING CRITERIA FOR REACTIVE HOT MELT ADHESIVES
  • FIGURE 25 AVERAGE SELLING PRICES OF REACTIVE HOT MELT ADHESIVES, BY REGION, 2018-2022
  • FIGURE 26 AVERAGE SELLING PRICE TREND, BY RESIN TYPE (2022)
  • FIGURE 27 AVERAGE SELLING PRICE TREND, BY SUBSTRATE (2022)
  • FIGURE 28 AVERAGE SELLING PRICE TREND, BY APPLICATION (2022)
  • FIGURE 29 AVERAGE SELLING PRICE COMPETITIVENESS IN REACTIVE HOT MELT ADHESIVES MARKET, BY MAJOR COUNTRIES (2022)
  • FIGURE 30 AVERAGE SELLING PRICE TREND OF KEY PLAYERS, BY APPLICATION (2022)
  • FIGURE 31 ADHESIVES EXPORT, BY KEY COUNTRY, 2018–2022 (USD THOUSAND)
  • FIGURE 32 ADHESIVES IMPORT, BY KEY COUNTRY, 2018–2022 (USD THOUSAND)
  • FIGURE 33 LIST OF MAJOR PATENTS FOR REACTIVE HOT MELT ADHESIVES
  • FIGURE 34 POLYURETHANE RESIN TO DOMINATE REACTIVE HOT MELT ADHESIVES MARKET BETWEEN 2023 AND 2028
  • FIGURE 35 PLASTIC SUBSTRATE TO LEAD REACTIVE HOT MELT ADHESIVES MARKET BETWEEN 2023 AND 2028
  • FIGURE 36 AUTOMOTIVE & TRANSPORTATION SEGMENT DOMINATED REACTIVE HOT MELT ADHESIVES MARKET IN 2022
  • FIGURE 37 ASIA PACIFIC EMERGING AS STRATEGIC MARKET FOR REACTIVE HOT MELT ADHESIVES
  • FIGURE 38 ASIA PACIFIC: REACTIVE HOT MELT ADHESIVES MARKET SNAPSHOT
  • FIGURE 39 EUROPE: REACTIVE HOT MELT ADHESIVES MARKET SNAPSHOT
  • FIGURE 40 NORTH AMERICA: REACTIVE HOT MELT ADHESIVES MARKET SNAPSHOT
  • FIGURE 41 SAUDI ARABIA TO LEAD REACTIVE HOT MELT ADHESIVES MARKET IN MIDDLE EAST & AFRICA DURING FORECAST PERIOD
  • FIGURE 42 BRAZIL TO DOMINATE REACTIVE HOT MELT ADHESIVES MARKET IN SOUTH AMERICA
  • FIGURE 43 MARKET SHARE ANALYSIS, 2022
  • FIGURE 44 REVENUE ANALYSIS OF TOP 5 PLAYERS (2018–2022)
  • FIGURE 45 MARKET RANKING ANALYSIS, 2022
  • FIGURE 46 GLOBAL REACTIVE HOT MELT ADHESIVES MARKET COMPANY EVALUATION MATRIX, 2022
  • FIGURE 47 PRODUCT FOOTPRINT (25 COMPANIES)
  • FIGURE 48 GLOBAL REACTIVE HOT MELT ADHESIVES MARKET STARTUP/SME EVALUATION MATRIX, 2022
  • FIGURE 49 HENKEL AG & CO. KGAA: COMPANY SNAPSHOT
  • FIGURE 50 H.B. FULLER COMPANY: COMPANY SNAPSHOT
  • FIGURE 51 3M: COMPANY SNAPSHOT
  • FIGURE 52 ARKEMA: COMPANY SNAPSHOT
  • FIGURE 53 THE DOW CHEMICAL COMPANY: COMPANY SNAPSHOT
  • FIGURE 54 SIKA AG: COMPANY SNAPSHOT
  • FIGURE 55 DIC CORPORATION: COMPANY SNAPSHOT
  • FIGURE 56 NANPAO RESINS CHEMICAL GROUP: COMPANY SNAPSHOT

This research study involves the use of extensive secondary sources, directories, and databases, such as Hoovers, Bloomberg L.P., Factiva, ICIS, and OneSource, to identify and collect information useful for this technical, market-oriented, and commercial study of the global reactive hot melt adhesives market. Primary sources are mainly industry experts from core and related industries, preferred suppliers, manufacturers, distributors, service providers, and organizations related to all segments of the value chain of this industry. In-depth interviews were conducted with various primary respondents, including key industry participants, subject matter experts (SMEs), C-level executives of key market players, and industry consultants, among other experts, to obtain and verify critical qualitative and quantitative information as well as assess growth prospects of the market.

Secondary Research

In the secondary research process, various secondary sources were referred to for identifying and collecting information for this study. These secondary sources include annual reports, press releases & investor presentations of companies, white papers, regulatory bodies, trade directories, certified publications, articles from recognized authors, gold and silver standard websites, and databases.

Secondary research has been used to obtain key information about the value chain of the industry, the total pool of key players, market classification & segmentation according to industry trends to the bottom-most level, and regional markets. It has also been used to obtain information about key developments from a market-oriented perspective.

Primary Research

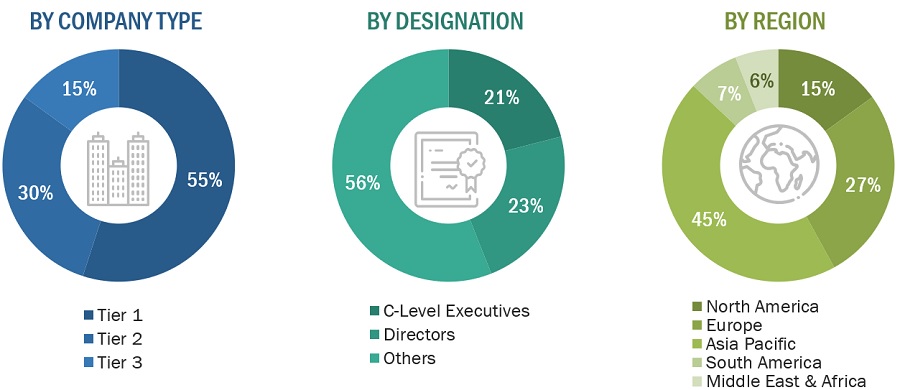
In the primary research process, various sources from both, the supply and demand sides were interviewed to obtain and verify qualitative and quantitative information for this report as well as analyze prospects. Primary sources from the supply side include industry experts such as CEOs, vice presidents, marketing directors, technology and innovation directors, and related executives from various leading companies and organizations operating in the reactive hot melt adhesives market. Primary sources from the demand side include experts and key persons from the application segment. Extensive primary research has been conducted after understanding and analyzing the current scenario of the reactive hot melt adhesivess market through secondary research. Several primary interviews were conducted with market experts from both, the demand and supply sides across five major regions: North America, Europe, Asia Pacific, Middle East & Africa, and South America.

Following is the breakdown of primary respondents:
Reactive Hot Melt Adhesives Market Size, and Share

To know about the assumptions considered for the study, download the pdf brochure

Market Size Estimation

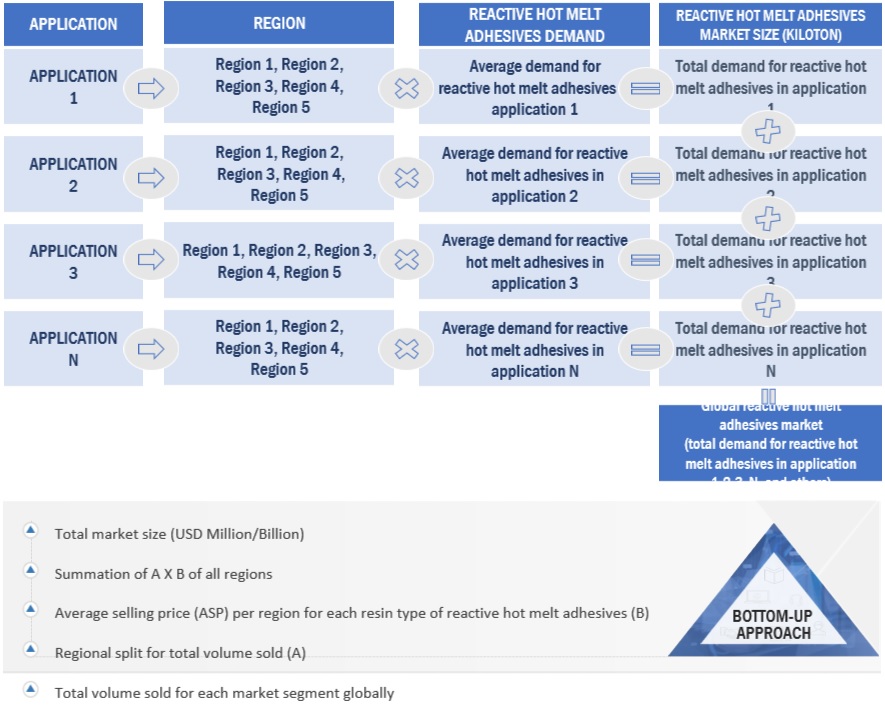
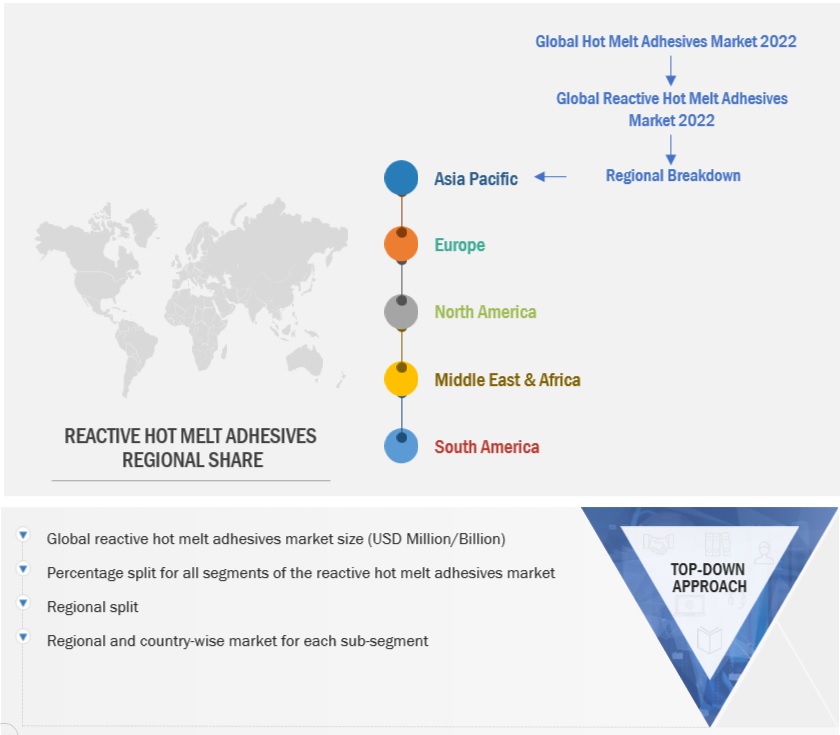
The top-down and bottom-up approaches have been used to estimate and validate the size of the reactive hot melt adhesives market on the basis of different end-use industries and types in each of the regions. The key players in the market have been identified through secondary research, and their market shares in the respective regions have been determined through primary and secondary research. All percentage shares, splits, and breakdowns have been determined using secondary sources and verified through primary sources. All possible parameters that can affect the market have been accounted for in this research study, viewed in extensive detail, verified through primary research, and analyzed to get the final quantitative and qualitative data.

Global Reactive Hot Melt Adhesives Market Size: Bottom Up Approach
Reactive Hot Melt Adhesives Market Size, and Share

To know about the assumptions considered for the study, Request for Free Sample Report

Global Reactive Hot Melt Adhesives Market Size: Top-down Approach
Reactive Hot Melt Adhesives Market Size, and Share

Data Triangulation

After arriving at the overall market size, the total market has been split into several segments. To complete the overall market engineering process and arrive at the exact statistics for all segments, the data triangulation and market breakdown procedures have been employed, wherever applicable. The data have been triangulated by studying various factors and trends from the demand and supply sides. Along with this, the market has been validated using both top-down and bottom-up approaches. Then, it has been verified through primary interviews. Hence, for every data segment, there are three sources, one from the top-down approach, second from the bottom-up approach, and third from expert interviews. Only when the values arrived at from the three points match, the data have been assumed correct.

Market Definition.

According to Adhesive and Sealant Council, reactive hot-melt adhesives are solid prepolymers terminated in reactive groups manufactured from mixtures of solid and liquid polyester/ether polyols with isocyanates, which are very low in free isocyanates. These solid prepolymers have a lower melting point than conventional hot-melt adhesives but show final strength and mechanical performance similar to a reactive system. Each of the raw materials can be appropriately adjusted to obtain required pot life, open time, and green strength.

Key Stakeholders

  • Reactive hot melt adhesive manufacturers
  • Raw material suppliers
  • Manufacturing technology providers
  • Industry associations
  • Stakeholders in the reactive hot melt industry
  • Traders, distributors, and suppliers of reactive hot melt adhesives
  • NGOs, government bodies, regional agencies, and research organizations

Report Objectives

  • To define, describe, and forecast the size of reactive hot melt adhesives market in terms of both value and volume
  • To provide detailed information about the key factors (drivers, restraints, opportunities, and challenges) influencing the growth of the market
  • To forecast the market size by resin type, type, substrate, and application
  • To forecast the market size with respect to five main regions: North America, Europe, Asia Pacific, the Middle East & Africa, and South America
  • To strategically analyze micromarkets1 with respect to individual growth trends, prospects, and their contribution to the overall market
  • To analyze opportunities in the market for stakeholders and provide a competitive landscape for market leaders
  • To analyze competitive developments in the market, such as new product development, acquisition, agreement, collaboration, partnership, expansion, and innovation
  • To strategically profile the key players and comprehensively analyze their market shares and core competencies2

Note: 1. Micromarkets are defined as the subsegments of the global reactive hot melt adhesives market included in the report.

2. Core competencies of companies are determined in terms of the key developments and strategies adopted by them to sustain in the market.

Available Customizations

MarketsandMarkets offers customizations according to the specific needs of the companies with the given market data.

The following customization options are available for the report:

Product Analysis

  • Product matrix, which gives a detailed comparison of the product portfolio of each company

Regional Analysis

  • Further breakdown of the reactive hot melt adhesives market, by country

Company Information

  • Detailed analysis and profiling of additional market players (up to five)
Custom Market Research Services

We will customize the research for you, in case the report listed above does not meet with your exact requirements. Our custom research will comprehensively cover the business information you require to help you arrive at strategic and profitable business decisions.

Request Customization
Report Code
CH 7741
Published ON
Nov, 2023
Choose License Type
BUY NOW
  • SHARE
X
Request Customization
Speak to Analyst
Speak to Analyst
OR FACE-TO-FACE MEETING
PERSONALIZE THIS RESEARCH
  • Triangulate with your Own Data
  • Get Data as per your Format and Definition
  • Gain a Deeper Dive on a Specific Application, Geography, Customer or Competitor
  • Any level of Personalization
REQUEST A FREE CUSTOMIZATION
LET US HELP YOU!
  • What are the Known and Unknown Adjacencies Impacting the Reactive Hot Melt Adhesives Market
  • What will your New Revenue Sources be?
  • Who will be your Top Customer; what will make them switch?
  • Defend your Market Share or Win Competitors
  • Get a Scorecard for Target Partners
CUSTOMIZED WORKSHOP REQUEST
knowledgestore logo

Want to explore hidden markets that can drive new revenue in Reactive Hot Melt Adhesives Market?

Find Hidden Markets
  • Call Us
  • +1-888-600-6441 (Corporate office hours)
  • +1-888-600-6441 (US/Can toll free)
  • +44-800-368-9399 (UK office hours)
CONNECT WITH US
ABOUT TRUST ONLINE
©2024 MarketsandMarkets Research Private Ltd. All rights reserved
DMCA.com Protection Status
Website Feedback