Predictive Maintenance Market

Predictive Maintenance Market Size, by Technology (Analytics, Data Management, AI, IoT Platform, Sensors), Technique (Vibration Analysis, Infrared Thermography, Oil analysis, Motor Circuit Analysis, Acoustic Monitoring) - Global Forecast to 2029

Report Code: TC 4154 Mar, 2024, by marketsandmarkets.com

[376 Pages Report] The global market for the predictive maintenance market is projected to grow from USD 10.6 billion in 2024 to USD 47.8 billion in 2029, at a CAGR of 35.1% during the forecast period. The predictive maintenance market is propelled by several factors, including the rising adoption of emerging technologies for obtaining valuable insights, the emergence of machine learning (ML) and artificial intelligence (AI), and the increasing demand to minimize maintenance costs, equipment failures, and downtime.

Predictive Maintenance Market

To know about the assumptions considered for the study, Request for Free Sample Report

Predictive Maintenance Market Opportunities

To know about the assumptions considered for the study, download the pdf brochure

Market Dynamics

Driver: Advent of ML and AI

Digitalization in the current day and age has exponentially transformed the landscape of predictive maintenance, thereby encouraging predictive maintenance vendors and service providers to adopt digitized systems for in-store activities. Organizations are increasingly focusing on the re-engineering of businesses with the help of the immense power of the internet and digital technology. The advent of AI and ML has enhanced organizations’ ability to gather information, analyze it, and perform quick actions with minimum human intervention. Organizations are also adopting AI systems to speed up investment decisions. According to an industry expert, the use of machine learning to detect machine and system faults early extends the service life of facility machinery by 30 percent on average. Organizations that use a predictive maintenance approach minimize not only the degree of damages but also the spread of problems. This is because a problem with a low-cost part might lead to damage to a critical component, shortening the asset lifecycle.

Restraint: Lack of skilled workforce

Skilled personnel are essential for managing the latest software systems used to deploy AI-based IoT technologies and capabilities. Therefore, it is imperative to train existing employees on how to operate these new and upgraded systems. Additionally, industries are actively adopting new technologies but are encountering challenges due to a shortage of highly skilled and proficient workers. With many global vendors initiating predictive maintenance projects, there is a growing demand for a skilled workforce. Companies must develop expertise in areas such as cybersecurity, networking, and applications. They also aim to leverage IoT data for predictive analysis, failure prevention, operational optimization, product innovation, and advanced analytics incorporating AI and ML technologies.

Opportunity: Real-time condition monitoring to assist in taking rapid actions

Enhanced asset management is increasingly essential across diverse industries. Providers equipped with AI and ML capabilities can gather and transform vast amounts of customer-related data into actionable insights, particularly as IoT generates significant data from interconnected devices. AI can also be integrated with IoT devices to optimize service delivery aspects like predictive maintenance and quality assessment, eliminating the need for manual intervention. AI-driven IoT solutions are already gaining traction in various sectors, a trend expected to continue as technology advances. Real-time data from sensors, actuators, and control parameters not only forecast potential asset failures but also enable companies to monitor operations in real-time and take immediate actions when necessary.

Challenge: The requirement of frequent maintenance and upgradation to keep the systems updated

Enterprises are increasingly embracing AI-based IoT solutions for predictive maintenance and to enhance the customer experience. In this market landscape, vendors must develop predictive maintenance systems with a focus on two critical factors: maintenance and updates. An AI-based IoT system requires regular updates and maintenance to align with evolving business needs and implement technological advancements. This includes upgrading the software to accommodate new components and integrating the new system with existing ones. However, as the number of systems grows, so does the maintenance cost. Managing and upgrading AI-based IoT systems poses a significant challenge for companies aiming to provide uninterrupted solutions to their clients.

Predictive Maintenance Market Ecosystem

The predictive maintenance ecosystem comprises hardware providers supplying sensors and monitoring devices, solution providers offering software for data analysis and predictive modelling, service providers delivering consulting, implementation, and managed services, data management, and analytics providers specializing in processing and deriving insights from maintenance data, and regulatory bodies setting standards and guidelines to ensure reliability and safety.

Top Companies in Predictive Maintenance Market

By Vertical, Energy & Utilities segment accounts for the largest market size during the forecast period.

The energy & utilities sector conventionally relies on time-based preventive maintenance to look after its assets, leading to static maintenance routines prone to errors and delays. However, AI or machine learning (ML)-driven predictive maintenance solutions usher in intelligence-based maintenance, enabling energy companies, including those in the oil and gas sector, to leverage historical and real-time data for accurate asset and infrastructure condition forecasting. Oil and gas production plants, with their highly hazardous nature, often necessitate complete shutdowns for planned and unplanned maintenance, and unidentified faults can lead to resource leakage, safety risks, and capital loss. To address these challenges, startups develop predictive maintenance platforms utilizing AI, ML, and predictive analytics to swiftly identify asset anomalies, allowing oil and gas plant operators to detect deviations in pumps, vessels, pipelines, tanks, and drills for better maintenance planning and reduced downtimes. This approach also reduces the need for continuous manual inspections of critical infrastructures, saving labor hours and improving productivity.

By Solution, Standalone segment is projected to grow at the highest CAGR during the forecast period.

Initially, predictive maintenance was integrated into IoT suites and platforms as a basic capability. However, given the escalating volume of operational data generated by organizations today, there's a growing demand for advanced predictive maintenance solutions. These advanced solutions empower organizations to transition from reactive to proactive maintenance processes. Standalone predictive maintenance solutions meet this rising need for advanced capabilities by employing vertical-focused and automated maintenance techniques. They offer flexibility and a variety of optional features, enabling enterprises to forecast equipment failures based on historical data from operational machines, leading to cost savings and reduced downtime. Although standalone software lacks customization capabilities, its affordability makes it popular among small and mid-sized enterprises. Standalone solution providers also offer support for integrating their predictive maintenance solutions into various leading IoT suites.

North America to account for the largest market size during the forecast period.

North America is expected to be the largest contributor to the adoption of AI technologies. The countries considered for the analysis of the North American predictive maintenance market are the US and Canada. Both countries have heavily invested in R&D activities, contributing to the growth of new technologies. Companies in various countries of this region, especially in the US, are leveraging AI, IoT, ML, and deep learning technologies in their business processes to gain a competitive edge in the market. The countries in this region have a well-established economy, enabling predictive maintenance vendors to invest in technological advancements and innovation. Additionally, the region is known as the center of innovation as IT giants are launching new offerings and aggressively collaborating with the predictive maintenance market. The government and public sector have also joined the race to become technologically advanced to cater to a larger customer base. North America is contributing significantly to the predictive maintenance market and is expected to grow at a good pace. Furthermore, the presence of global vendors, such as IBM, Microsoft, General Electric, and Fiix Software, plays a vital role in the adoption of predictive maintenance solutions in the market.

North American Predictive Maintenance Market Size, and Share

Key Market Players

The major predictive maintenance hardware, solution and service providers include IBM (US) , ABB (Switzerland), Schneider Electric (France), AWS (US), Google (US) , Microsoft (US), Hitachi (Japan), SAP (Germany), SAS Institute (US), Software AG (Germany), TIBCO Software (US), Altair (US), Oracle (US), Splunk (US), C3.ai (US), Emerson (US), GE (US), Honeywell (US), Siemens (Germany), PTC (US), Dingo (Australia), Uptake (US), Samotics (Netherlands), WaveScan (Singapore), Quadrical Ai (Canada), UpKeep (US), Limble (US), SenseGrow (US), Presage Insights (India), Falcon Labs (India). These companies have used both organic and inorganic growth strategies such as product launches, acquisitions, and partnerships to strengthen their position in the predictive maintenance market.

Want to explore hidden markets that can drive new revenue in Predictive Maintenance Market?

Scope of the Report

Report Metrics

Details

Market size available for years

2019–2029

Base year considered

2023

Forecast period

2024–2019

Forecast units

USD Billion

Segments Covered

Component (Hardware, Solution [Solution by Deployment mode {Cloud (Public, Private, Hybrid) & On-premises}] & Services), Technology (Analytics & Data Management, Artificial Intelligence, IoT Platform, Sensors & Other Devices), Technique (Vibration Analysis, Infrared Thermography, Acoustic Monitoring, Oil Analysis, Motor Circuit Analysis, Other Techniques) Organization size (Large Enterprises, SMEs), Vertical (Energy & Utilities, Manufacturing, Automotive & Transportation, Aerospace & Defense, Construction & Mining, Healthcare, Telecommunications) and Region.

Geographies covered

North America, Europe, Asia Pacific, Middle East & Africa, Latin America

Companies covered

IBM (US), ABB (Switzerland), Schneider Electric (France), AWS (US), Google (US), Microsoft (US), Hitachi (Japan), SAP (Germany), SAS Institute (US), Software AG (Germany), TIBCO Software (US), Altair (US), Oracle (US), Splunk (US), C3.ai (US), Emerson (US), GE (US), Honeywell (US), Siemens (Germany), PTC (US), Dingo (Australia), Uptake (US), Samotics (Netherlands), WaveScan (Singapore), Quadrical Ai (Canada), UpKeep (US), Limble (US), SenseGrow (US), Presage Insights (India), Falcon Labs (India).

This research report categorizes the predictive maintenance market based on component (hardware, solution [By deployment mode] & services), technology, technique, organization size, vertical and region.

Component:
  • Hardware
  • Solution
    • Integrated
    • Standalone
  • Solution By Deployment Mode
    • Cloud
    • On-premises
  • Services
    • Professional Services
      • System Integration
      • Support & Maintenance
      • Consulting
    • Managed Services
By Technology:
  • Analytics & Data Management
  • Artificial Intelligence (AI)
  • Internet Of Things (IoT) Platform
  • Sensors and Other Devices
By Technique:
  • Vibration Analysis
  • Infrared Thermography
  • Acoustic Monitoring
  • Oil Analysis
  • Motor Circuit Analysis
  • Other Techniques
By Organization Size:
  • Large Enterprises
  • SMEs
By Vertical:
  • Energy & Utilities (includes oil and gas)
  • Manufacturing
  • Automotive & Transportation
  • Aerospace & Defense
  • Construction & Mining
  • Healthcare
  • Telecommunications
  • Other Verticals (Retail, Agriculture, Logistics)
By Region:
  • North America
  • Europe
  • Asia Pacific
  • Middle East & Africa
  • Latin America

Recent Developments:

  • In January 2024, Siemens and AWS deepened their collaboration to simplify the development and scaling of generative artificial intelligence (AI) applications for businesses across various industries and sizes. This partnership enables domain experts in fields like engineering, manufacturing, logistics, insurance, or banking to leverage advanced generative AI technology to create and enhance applications efficiently.
  • In December 2023, ABB enhanced its ABB Ability Field Information Manager (FIM 3.0) to provide system engineers and maintenance teams with enhanced connectivity and expanded reach across the latest communication protocols.
  • In June 2023, Qatar Airways and Google Cloud partnered to create innovative data and artificial intelligence (AI) solutions tailored for the airline industry. This collaboration will concentrate on enhancing areas like predictive maintenance, passenger experience, and cargo operations, aiming to elevate efficiency and customer satisfaction within the airline sector.
  • In April 2023, TrendMiner launched an updated version of its predictive maintenance software, the Digital Twin Manager. This release includes enhanced support for cloud data sources from AWS and Microsoft, along with interactive search functionality, enabling users to make data-driven decisions more efficiently.
  • In January 2023, AVEVA, a global leader in industrial software, finalized its acquisition by Schneider Electric. AVEVA's strategic objective is to emerge as the top Software as a Service (SaaS) provider in software and industrial information, transitioning to a subscription-only business model.

Frequently Asked Questions (FAQ):

To speak to our analyst for a discussion on the above findings, click Speak to Analyst

Exclusive indicates content/data unique to MarketsandMarkets and not available with any competitors.

INTRODUCTION
38
RESEARCH METHODOLOGY
44
EXECUTIVE SUMMARY
59
PREMIUM INSIGHTS
65
MARKET OVERVIEW AND INDUSTRY TRENDS
67
  • 5.1 INTRODUCTION
  • 5.2 MARKET DYNAMICS
    DRIVERS
    - Increasing use of emerging technologies to gain valuable insights
    - Advent of ML and AI
    - Rising internet proliferation and growing use of connected and integrated technologies
    RESTRAINTS
    - Lack of skilled workforce
    - Data security concerns
    OPPORTUNITIES
    - Real-time condition monitoring to assist in taking prompt actions
    - Growing need to reduce maintenance cost, equipment failure, and downtime
    CHALLENGES
    - Frequent maintenance and upgradation requirements
    - Ownership and privacy of collected data
  • 5.3 PREDICTIVE MAINTENANCE MARKET: EVOLUTION
  • 5.4 SUPPLY CHAIN ANALYSIS
  • 5.5 ECOSYSTEM/MARKET MAP
    HARDWARE PROVIDERS
    SOLUTION PROVIDERS
    SERVICE PROVIDERS
    DATA MANAGEMENT & ANALYTICS PROVIDERS
    REGULATORY BODIES
  • 5.6 CASE STUDY ANALYSIS
    RIYADH AIRPORT MODERNIZED MAINTENANCE BY IMPLEMENTING MAXIMO AND IBM COGNOS ANALYTICS
    VPI ENHANCED EFFICIENCY OF ITS COMBINED CYCLE GAS TURBINE PLANT WITH IBM MAXIMO APPLICATION SUITE
    WESTERN DIGITAL BOOSTED MANUFACTURING EXCELLENCE WITH SAS ASSET PERFORMANCE ANALYTICS
    VANTAGE POWER ACCELERATED PREDICTIVE MAINTENANCE FOR CONNECTED VEHICLES WITH VPVISION
    SAM4 HEALTH PREVENTED COSTLY DOWNTIME WITH PREDICTIVE MAINTENANCE ALERTS
  • 5.7 TRADE ANALYSIS
    IMPORT SCENARIO OF SPECTROMETERS
    EXPORT SCENARIO OF SPECTROMETERS
  • 5.8 REGULATORY LANDSCAPE
    REGULATORY BODIES, GOVERNMENT AGENCIES, AND OTHER ORGANIZATIONS
    - North America
    - Europe
    - Asia Pacific
    - Middle East & Africa
    - Latin America
  • 5.9 PATENT ANALYSIS
    METHODOLOGY
    - Patents filed, by document type
    - Innovation and patent applications
  • 5.10 TECHNOLOGY ANALYSIS
    KEY TECHNOLOGIES
    - ML
    - Big data
    ADJACENT TECHNOLOGIES
    - Edge computing
    - Digital twin
    - Cloud computing
    COMPLEMENTARY TECHNOLOGIES
    - AR & VR
    - Blockchain
  • 5.11 PRICING ANALYSIS
    AVERAGE SELLING PRICE TRENDS OF KEY PLAYERS, BY TECHNOLOGY
    INDICATIVE PRICING ANALYSIS OF PREDICTIVE MAINTENANCE, BY COMPONENT
  • 5.12 INVESTMENT AND FUNDING SCENARIO
  • 5.13 PORTER’S FIVE FORCES’ ANALYSIS
    THREAT OF NEW ENTRANTS
    THREAT OF SUBSTITUTES
    BARGAINING POWER OF SUPPLIERS
    BARGAINING POWER OF BUYERS
    INTENSITY OF COMPETITIVE RIVALRY
  • 5.14 TRENDS/DISRUPTIONS IMPACTING CUSTOMERS’ BUSINESSES
  • 5.15 KEY CONFERENCES & EVENTS, 2024-2025
  • 5.16 KEY STAKEHOLDERS & BUYING CRITERIA
    KEY STAKEHOLDERS IN BUYING PROCESS
    BUYING CRITERIA
  • 5.17 TECHNOLOGY ROADMAP OF PREDICTIVE MAINTENANCE MARKET
  • 5.18 BUSINESS MODELS OF MARKET
    EQUIPMENT HEALTH MONITORING AND MAINTENANCE RECOMMENDATIONS AS A SERVICE
    OVERALL EQUIPMENT EFFICIENCY (OEE) RISK AS A SERVICE
    UPTIME AS A SERVICE
    WARRANTY AS A SERVICE
    SUPPLY CHAIN MANAGEMENT INFORMATION AS A SERVICE
PREDICTIVE MAINTENANCE MARKET, BY COMPONENT
110
  • 6.1 INTRODUCTION
    COMPONENT: MARKET DRIVERS
  • 6.2 HARDWARE
  • 6.3 SOLUTIONS
    INTEGRATED
    STANDALONE
  • 6.4 SOLUTIONS BY DEPLOYMENT MODE
    CLOUD
    - Reduced operational cost and higher scalability to enable growth in cloud-based deployments
    - Public
    - Private
    - Hybrid
    ON-PREMISES
    - Rising cost of support and maintenance impacting growth of on-premises solutions
  • 6.5 SERVICES
    PROFESSIONAL SERVICES
    - Demand for expert guidance and seamless integration to drive professional services
    - System Integration
    - Support & Maintenance
    - Consulting
    MANAGED SERVICES
    - Increasing need of IT Infrastructure support to drive growth of managed services
PREDICTIVE MAINTENANCE MARKET, BY TECHNOLOGY
132
  • 7.1 INTRODUCTION
    TECHNOLOGY: MARKET DRIVERS
  • 7.2 ANALYTICS & DATA MANAGEMENT
    INCREASED DEMAND FOR REAL-TIME INSIGHTS AND PROACTIVE MAINTENANCE STRATEGIES
  • 7.3 ARTIFICIAL INTELLIGENCE
    GROWING DEMAND FOR AI-DRIVEN PREDICTIVE MAINTENANCE FOR ENHANCED ASSET RELIABILITY
  • 7.4 IOT PLATFORM
    RAPID ADOPTION OF IOT PLATFORMS FOR REAL-TIME ASSET MONITORING TO DRIVE MARKET GROWTH
  • 7.5 SENSORS & OTHER DEVICES
    RISING DEMAND FOR CUSTOMER EXPERIENCE TO FUEL CLOUD ADOPTION IN PREDICTIVE MAINTENANCE
PREDICTIVE MAINTENANCE MARKET, BY TECHNIQUE
139
  • 8.1 INTRODUCTION
    TECHNIQUE: MARKET DRIVERS
  • 8.2 VIBRATION ANALYSIS
    GROWING DEMAND FOR EFFICIENT MACHINERY HEALTH MONITORING TO DRIVE VIBRATION ANALYSIS
    TEST COMPONENT ALIGNMENT
    DETECT IMBALANCES
    RESONANCE IDENTIFICATION
    GEAR FAILURE DETECTION
    OTHERS
  • 8.3 INFRARED THERMOGRAPHY
    RISING DEMAND FOR NON-INTRUSIVE PREDICTIVE MAINTENANCE TO DRIVE INFRARED THERMOGRAPHY
    INSPECT ELECTRICAL CONNECTIONS AND SYSTEMS
    ASSESS HEATING SYSTEMS
    FLUID ANALYSIS
    ANALYZE DISCHARGE PATTERNS
    ROOF MAINTENANCE
    OTHERS
  • 8.4 ACOUSTIC MONITORING
    ADOPTION OF ULTRASONIC ACOUSTIC ANALYSIS TO DRIVE PREDICTIVE MAINTENANCE EFFICIENCY
    PIPELINE MONITORING
    CONDENSER EVALUATION
    VACUUM SYSTEM MONITORING
    FAN HEALTH ASSESSMENT
    AIR COMPRESSOR MONITORING
    OTHERS
  • 8.5 OIL ANALYSIS
    OPTIMIZING EQUIPMENT LIFESPAN THROUGH PROACTIVE LUBRICATION MANAGEMENT STRATEGIES
    TURBINE MAINTENANCE
    HYDRAULIC SYSTEM MAINTENANCE
    ENGINE EVALUATION
    TRANSMISSION ASSESSMENT
    GEAR LUBRICANT LEVEL MONITORING
    OTHERS
  • 8.6 MOTOR CIRCUIT ANALYSIS
    NEED FOR EFFICIENT PREDICTIVE MAINTENANCE IN PUMPING SYSTEMS
    ASSESS ENGINE DEGRADATION
    SHAFT AND ROTOR ALIGNMENT
    INSULATION EVALUATION
    GEAR ASSESSMENT
    SCAN FOR SHORT CIRCUITS
    OTHERS
  • 8.7 OTHER TECHNIQUES
PREDICTIVE MAINTENANCE MARKET, BY ORGANIZATION SIZE
158
  • 9.1 INTRODUCTION
    ORGANIZATION SIZE: MARKET DRIVERS
  • 9.2 LARGE ENTERPRISES
    INTEGRATION OF AI AND IOT TECHNOLOGIES TO DRIVE ADOPTION OF PREDICTIVE MAINTENANCE AMONG LARGE ENTERPRISES
  • 9.3 SMALL AND MEDIUM-SIZED ENTERPRISES
    AFFORDABLE IOT AND CLOUD SOLUTIONS TO DRIVE SMES TO ADOPT PREDICTIVE MAINTENANCE
PREDICTIVE MAINTENANCE MARKET, BY VERTICAL
163
  • 10.1 INTRODUCTION
    VERTICAL: MARKET DRIVERS
  • 10.2 ENERGY & UTILITIES
    IOT DEVICES ENABLE REAL-TIME MONITORING, ENHANCING PREDICTIVE MAINTENANCE ACCURACY
  • 10.3 MANUFACTURING
    INDUSTRY 4.0 INTEGRATION TO DRIVE REAL-TIME MONITORING AND PREDICTIVE MAINTENANCE
  • 10.4 AUTOMOTIVE & TRANSPORTATION
    SHIFT TOWARD INDIVIDUAL MOBILITY TO BOOST PREDICTIVE MAINTENANCE INVESTMENTS IN AUTOMOTIVE
  • 10.5 AEROSPACE & DEFENSE
    MODERNIZATION INITIATIVES IN AIRPORTS AND DEFENSE SECTOR TO PROPEL MARKET GROWTH
  • 10.6 CONSTRUCTION & MINING
    SAFETY CONCERNS AND ASSET OPTIMIZATION TO FUEL GROWTH IN PREDICTIVE MAINTENANCE
  • 10.7 HEALTHCARE
    RISING DEMAND FOR UNINTERRUPTED HEALTHCARE SERVICES TO FUEL PREDICTIVE MAINTENANCE ADOPTION
  • 10.8 TELECOMMUNICATIONS
    COSTLY DOWNTIME RISKS TO FUEL ADOPTION OF IOT-DRIVEN PREDICTIVE MAINTENANCE
  • 10.9 OTHER VERTICALS
PREDICTIVE MAINTENANCE MARKET, BY REGION
176
  • 11.1 INTRODUCTION
  • 11.2 NORTH AMERICA
    NORTH AMERICA: MARKET DRIVERS
    NORTH AMERICA: RECESSION IMPACT
    US
    - Strong government support and availability of funds to fuel demand for predictive maintenance solutions
    CANADA
    - Adoption of advanced CMMS technologies and focus on advanced technologies to boost demand for predictive maintenance solutions
  • 11.3 EUROPE
    EUROPE: PREDICTIVE MAINTENANCE MARKET DRIVERS
    EUROPE: RECESSION IMPACT
    UK
    - Strong AI strategy, government funding, and stringent regulatory compliances to spur market growth
    GERMANY
    - Focus on AI research and development and implementation of Industry 4.0 to drive market
    FRANCE
    - France's AI research centers and industry investments to foster market growth
    SPAIN
    - Implementation of AESIA and rapid growth in AI technologies to propel market
    ITALY
    - Strategic programs and initiatives for implementing AI to drive demand for predictive maintenance solutions
    REST OF EUROPE
  • 11.4 ASIA PACIFIC
    ASIA PACIFIC: PREDICTIVE MAINTENANCE MARKET DRIVERS
    ASIA PACIFIC: RECESSION IMPACT
    CHINA
    - Government’s heavy financial and strategic support in research and development and investments from global players to accelerate market growth
    JAPAN
    - Adoption of maintenance performance monitoring solutions by Japan Airlines to foster market growth
    INDIA
    - Need to forecast, track in real time, and manage networks to enhance better customer experience in automotive sector to drive market
    SOUTH KOREA
    - Integration of IoT sensors and AI enhancing maintenance efficiency to boost demand for predictive maintenance
    AUSTRALIA & NEW ZEALAND
    - Need to optimize asset performance, reduce downtime, and lower maintenance costs to propel market
    REST OF ASIA PACIFIC
  • 11.5 MIDDLE EAST & AFRICA
    MIDDLE EAST & AFRICA: PREDICTIVE MAINTENANCE MARKET DRIVERS
    MIDDLE EAST & AFRICA: RECESSION IMPACT
    UAE
    - Government initiatives to achieve Smart Dubai program and active integration of AI to propel market
    SAUDI ARABIA
    - Need for advancing technology sector as part of Vision 2030 initiative and smart city programs to bolster market growth
    QATAR
    - Collaboration with tech giants to accelerate IoT-driven predictive maintenance solutions in Qatar
    TURKEY
    - Emphasis on defense strategies to leverage AI technologies to drive growth of AI-powered predictive maintenance solutions
    SOUTH AFRICA
    - Presence of major tech companies and concerns regarding impact of AI on economic growth to drive market
    REST OF MIDDLE EAST & AFRICA
  • 11.6 LATIN AMERICA
    LATIN AMERICA: PREDICTIVE MAINTENANCE MARKET DRIVERS
    LATIN AMERICA: RECESSION IMPACT
    BRAZIL
    - Rapid adoption of Industry 4.0 technologies to bolster market growth
    MEXICO
    - Growing need for enhanced connectivity in business processes to drive adoption of predictive maintenance solutions
    ARGENTINA
    - Thriving tech ecosystem and government support to fuel market
    REST OF LATIN AMERICA
COMPETITIVE LANDSCAPE
269
  • 12.1 OVERVIEW
  • 12.2 KEY PLAYER STRATEGIES
  • 12.3 REVENUE ANALYSIS
  • 12.4 MARKET SHARE ANALYSIS
    MARKET RANKING ANALYSIS
  • 12.5 BRAND/PRODUCT COMPARATIVE ANALYSIS
  • 12.6 COMPANY EVALUATION MATRIX: KEY PLAYERS, 2023
    STARS
    EMERGING LEADERS
    PERVASIVE PLAYERS
    PARTICIPANTS
    COMPANY FOOTPRINT: KEY PLAYERS, 2023
    - Company Footprint
    - Region Footprint
    - Component Footprint
    - Technology Footprint
    - Vertical Footprint
  • 12.7 COMPANY EVALUATION MATRIX: STARTUPS/SMES, 2023
    PROGRESSIVE COMPANIES
    RESPONSIVE COMPANIES
    DYNAMIC COMPANIES
    STARTING BLOCKS
    COMPETITIVE BENCHMARKING: STARTUPS/SMES, 2023
    - Detailed List of Key Startups/SMEs
    - Competitive Benchmarking of Key Startups/SMEs
  • 12.8 COMPETITIVE SCENARIO AND TRENDS
    PRODUCT LAUNCHES
    DEALS
  • 12.9 COMPANY VALUATION AND FINANCIAL METRICS OF KEY VENDORS
COMPANY PROFILES
288
  • 13.1 INTRODUCTION
  • 13.2 KEY PLAYERS
    IBM
    - Business overview
    - Products/Solutions/Services offered
    - Recent developments
    - MnM view
    ABB
    - Business overview
    - Products/Solutions/Services offered
    - Recent developments
    - MnM view
    SCHNEIDER ELECTRIC
    - Business overview
    - Products/Solutions/Services offered
    - Recent developments
    - MnM view
    AWS
    - Business overview
    - Products/Solutions/Services offered
    - Recent developments
    - MnM view
    GOOGLE
    - Business overview
    - Products/Solutions/Services offered
    - Recent developments
    - MnM view
    MICROSOFT
    - Business overview
    - Products/Solutions/Services offered
    - Recent developments
    - MnM view
    HITACHI
    - Business overview
    - Products/Solutions/Services offered
    - Recent developments
    SAP
    - Business overview
    - Products/Solutions/Services offered
    - Recent developments
    SAS INSTITUTE
    - Business overview
    - Products/Solutions/Services offered
    - Recent developments
    SOFTWARE AG
    - Business overview
    - Products/Solutions/Services offered
    - Recent developments
    TIBCO SOFTWARE
    - Business overview
    - Products/Solutions/Services offered
    - Recent developments
    ALTAIR
    - Business overview
    - Products/Solutions/Services offered
    - Recent developments
    ORACLE
    - Business overview
    - Products/Solutions/Services offered
    - Recent developments
    SPLUNK
    - Business overview
    - Products/Solutions/Services offered
    - Recent developments
    C3.AI
    EMERSON
    GE
    HONEYWELL
    SIEMENS
    PTC
  • 13.3 STARTUPS/SMES
    DINGO
    UPTAKE
    SAMOTICS
    WAVESCAN
    QUADRICAL AI
    UPKEEP
    LIMBLE
    SENSEGROW
    PRESAGE INSIGHTS
    FACLON LABS
ADJACENT AND RELATED MARKETS
350
  • 14.1 ADJACENT AND RELATED MARKETS
    INTRODUCTION
    ENTERPRISE ASSET MANAGEMENT MARKET— GLOBAL FORECAST TO 2028
    - Market definition
    - Market overview
    BIG DATA MARKET—GLOBAL FORECAST TO 2028
    - Market definition
    - Market overview
APPENDIX
366
  • 15.1 DISCUSSION GUIDE
  • 15.2 KNOWLEDGESTORE: MARKETSANDMARKETS’ SUBSCRIPTION PORTAL
  • 15.3 CUSTOMIZATION OPTIONS
  • 15.4 RELATED REPORTS
  • 15.5 AUTHOR DETAILS
LIST OF TABLES
 
  • TABLE 1 USD EXCHANGE RATE, 2019–2023
  • TABLE 2 LIST OF PRIMARY INTERVIEWS
  • TABLE 3 FACTOR ANALYSIS
  • TABLE 4 RECESSION IMPACT ON PREDICTIVE MAINTENANCE MARKET
  • TABLE 5 MARKET SIZE AND GROWTH RATE, 2019–2023 (USD MILLION, Y-O-Y)
  • TABLE 6 MARKET SIZE AND GROWTH RATE, 2024–2029 (USD MILLION, Y-O-Y)
  • TABLE 7 MARKET: ECOSYSTEM
  • TABLE 8 NORTH AMERICA: LIST OF REGULATORY BODIES, GOVERNMENT AGENCIES, AND OTHER ORGANIZATIONS
  • TABLE 9 EUROPE: LIST OF REGULATORY BODIES, GOVERNMENT AGENCIES, AND OTHER ORGANIZATIONS
  • TABLE 10 ASIA PACIFIC: LIST OF REGULATORY BODIES, GOVERNMENT AGENCIES, AND OTHER ORGANIZATIONS
  • TABLE 11 MIDDLE EAST & AFRICA: LIST OF REGULATORY BODIES, GOVERNMENT AGENCIES, AND OTHER ORGANIZATIONS
  • TABLE 12 LATIN AMERICA: LIST OF REGULATORY BODIES, GOVERNMENT AGENCIES, AND OTHER ORGANIZATIONS
  • TABLE 13 PATENTS FILED, 2013–2023
  • TABLE 14 TOP 20 PATENT OWNERS IN MARKET, 2013–2023
  • TABLE 15 LIST OF FEW PATENTS IN MARKET, 2021–2023
  • TABLE 16 AVERAGE SELLING PRICE TREND OF KEY PLAYERS, TOP THREE TECHNOLOGIES
  • TABLE 17 PREDICTIVE MAINTENANCE: INDICATIVE PRICING LEVELS OF PREDICTIVE MAINTENANCE, BY COMPONENT
  • TABLE 18 PORTER’S FIVE FORCES IMPACT ON MARKET
  • TABLE 19 MARKET: DETAILED LIST OF CONFERENCES & EVENTS, 2024–2025
  • TABLE 20 INFLUENCE OF STAKEHOLDERS ON BUYING PROCESS FOR TOP THREE VERTICALS
  • TABLE 21 KEY BUYING CRITERIA FOR TOP THREE VERTICALS
  • TABLE 22 SHORT-TERM ROADMAP (FOR NEXT 5 YEARS)
  • TABLE 23 LONG-TERM ROADMAP (BEYOND NEXT 5 YEARS)
  • TABLE 24 PREDICTIVE MAINTENANCE MARKET, BY COMPONENT, 2019–2023 (USD MILLION)
  • TABLE 25 MARKET, BY COMPONENT, 2024–2029 (USD MILLION)
  • TABLE 26 HARDWARE: MARKET, BY REGION, 2019–2023 (USD MILLION)
  • TABLE 27 HARDWARE: MARKET, BY REGION, 2024–2029 (USD MILLION)
  • TABLE 28 MARKET, BY SOLUTION, 2019–2023 (USD MILLION)
  • TABLE 29 MARKET, BY SOLUTION, 2024–2029 (USD MILLION)
  • TABLE 30 SOLUTION: MARKET, BY REGION, 2019–2023 (USD MILLION)
  • TABLE 31 SOLUTION: MARKET, BY REGION, 2024–2029 (USD MILLION)
  • TABLE 32 INTEGRATED: MARKET, BY REGION, 2019–2023 (USD MILLION)
  • TABLE 33 INTEGRATED: MARKET, BY REGION, 2024–2029 (USD MILLION)
  • TABLE 34 STANDALONE: MARKET, BY REGION, 2019–2023 (USD MILLION)
  • TABLE 35 STANDALONE: MARKET, BY REGION 2024–2029 (USD MILLION)
  • TABLE 36 PREDICTIVE MAINTENANCE SOLUTIONS MARKET, BY DEPLOYMENT MODE, 2019–2023 (USD MILLION)
  • TABLE 37 PREDICTIVE MAINTENANCE SOLUTIONS MARKET, BY DEPLOYMENT MODE, 2024–2029 (USD MILLION)
  • TABLE 38 PREDICTIVE MAINTENANCE SOLUTIONS MARKET, BY CLOUD, 2019–2023 (USD MILLION)
  • TABLE 39 PREDICTIVE MAINTENANCE SOLUTIONS MARKET, BY CLOUD, 2024–2029 (USD MILLION)
  • TABLE 40 CLOUD: PREDICTIVE MAINTENANCE MARKET, BY REGION, 2019–2023 (USD MILLION)
  • TABLE 41 CLOUD: MARKET, BY REGION, 2024–2029 (USD MILLION)
  • TABLE 42 PUBLIC: PREDICTIVE MAINTENANCE SOLUTIONS MARKET, BY REGION, 2019–2023 (USD MILLION)
  • TABLE 43 PUBLIC: PREDICTIVE MAINTENANCE SOLUTIONS MARKET, BY REGION, 2024–2029 (USD MILLION)
  • TABLE 44 PRIVATE: PREDICTIVE MAINTENANCE SOLUTIONS MARKET, BY REGION, 2019–2023 (USD MILLION)
  • TABLE 45 PRIVATE: PREDICTIVE MAINTENANCE SOLUTIONS MARKET, BY REGION, 2024–2029 (USD MILLION)
  • TABLE 46 HYBRID: PREDICTIVE MAINTENANCE SOLUTIONS MARKET, BY REGION, 2019–2023 (USD MILLION)
  • TABLE 47 HYBRID: PREDICTIVE MAINTENANCE SOLUTIONS MARKET, BY REGION, 2024–2029 (USD MILLION)
  • TABLE 48 ON-PREMISES: PREDICTIVE MAINTENANCE SOLUTIONS MARKET, BY REGION, 2019–2023 (USD MILLION)
  • TABLE 49 ON-PREMISES: PREDICTIVE MAINTENANCE SOLUTIONS MARKET, BY REGION, 2024–2029 (USD MILLION)
  • TABLE 50 MARKET, BY SERVICE, 2019–2023 (USD MILLION)
  • TABLE 51 MARKET, BY SERVICE, 2024–2029 (USD MILLION)
  • TABLE 52 SERVICES: MARKET, BY REGION, 2019–2023 (USD MILLION)
  • TABLE 53 SERVICES: MARKET, BY REGION, 2024–2029 (USD MILLION)
  • TABLE 54 MARKET, BY PROFESSIONAL SERVICE, 2019–2023 (USD MILLION)
  • TABLE 55 MARKET, BY PROFESSIONAL SERVICE, 2024–2029 (USD MILLION)
  • TABLE 56 PROFESSIONAL SERVICES: MARKET, BY REGION, 2019–2023 (USD MILLION)
  • TABLE 57 PROFESSIONAL SERVICES: MARKET, BY REGION, 2024–2029 (USD MILLION)
  • TABLE 58 SYSTEM INTEGRATION: MARKET, BY REGION, 2019–2023 (USD MILLION)
  • TABLE 59 SYSTEM INTEGRATION: MARKET, BY REGION, 2024–2029 (USD MILLION)
  • TABLE 60 SUPPORT & MAINTENANCE: MARKET, BY REGION, 2019–2023 (USD MILLION)
  • TABLE 61 SUPPORT & MAINTENANCE: MARKET, BY REGION, 2024–2029 (USD MILLION)
  • TABLE 62 CONSULTING: MARKET, BY REGION, 2019–2023 (USD MILLION)
  • TABLE 63 CONSULTING: MARKET, BY REGION, 2024–2029 (USD MILLION)
  • TABLE 64 MANAGED SERVICES: MARKET, BY REGION, 2019–2023 (USD MILLION)
  • TABLE 65 MANAGED SERVICES: MARKET, BY REGION, 2024–2029 (USD MILLION)
  • TABLE 66 MARKET, BY TECHNOLOGY, 2019–2023 (USD MILLION)
  • TABLE 67 MARKET, BY TECHNOLOGY, 2024–2029 (USD MILLION)
  • TABLE 68 ANALYTICS & DATA MANAGEMENT: PREDICTIVE MAINTENANCE MARKET, BY REGION, 2019–2023 (USD MILLION)
  • TABLE 69 ANALYTICS & DATA MANAGEMENT: MARKET, BY REGION, 2024–2029 (USD MILLION)
  • TABLE 70 ARTIFICIAL INTELLIGENCE: MARKET, BY REGION, 2019–2023 (USD MILLION)
  • TABLE 71 ARTIFICIAL INTELLIGENCE: MARKET, BY REGION, 2024–2029 (USD MILLION)
  • TABLE 72 IOT PLATFORM: MARKET, BY REGION, 2019–2023 (USD MILLION)
  • TABLE 73 IOT PLATFORM: MARKET, BY REGION, 2024–2029 (USD MILLION)
  • TABLE 74 SENSORS & OTHER DEVICES: MARKET, BY REGION, 2019–2023 (USD MILLION)
  • TABLE 75 SENSORS & OTHER DEVICES: MARKET, BY REGION, 2024–2029 (USD MILLION)
  • TABLE 76 MARKET, BY TECHNIQUE, 2019–2023 (USD MILLION)
  • TABLE 77 MARKET, BY TECHNIQUE, 2024–2029 (USD MILLION)
  • TABLE 78 VIBRATION ANALYSIS: MARKET, BY REGION, 2019–2023 (USD MILLION)
  • TABLE 79 VIBRATION ANALYSIS: MARKET, BY REGION, 2024–2029 (USD MILLION)
  • TABLE 80 INFRARED THERMOGRAPHY: MARKET, BY REGION, 2019–2023 (USD MILLION)
  • TABLE 81 INFRARED THERMOGRAPHY: MARKET, BY REGION, 2024–2029 (USD MILLION)
  • TABLE 82 ACOUSTIC MONITORING: MARKET, BY REGION, 2019–2023 (USD MILLION)
  • TABLE 83 ACOUSTIC MONITORING: MARKET, BY REGION, 2024–2029 (USD MILLION)
  • TABLE 84 OIL ANALYSIS: MARKET, BY REGION, 2019–2023 (USD MILLION)
  • TABLE 85 OIL ANALYSIS: PREDICTIVE MAINTENANCE MARKET, BY REGION, 2024–2029 (USD MILLION)
  • TABLE 86 MOTOR CIRCUIT ANALYSIS: MARKET, BY REGION, 2019–2023 (USD MILLION)
  • TABLE 87 MOTOR CIRCUIT ANALYSIS: MARKET, BY REGION, 2024–2029 (USD MILLION)
  • TABLE 88 OTHER TECHNIQUES: MARKET, BY REGION, 2019–2023 (USD MILLION)
  • TABLE 89 OTHER TECHNIQUES: MARKET, BY REGION, 2024–2029 (USD MILLION)
  • TABLE 90 MARKET, BY ORGANIZATION SIZE, 2019–2023 (USD MILLION)
  • TABLE 91 MARKET, BY ORGANIZATION SIZE, 2024–2029 (USD MILLION)
  • TABLE 92 LARGE ENTERPRISES: MARKET, BY REGION, 2019–2023 (USD MILLION)
  • TABLE 93 LARGE ENTERPRISES: MARKET, BY REGION, 2024–2029 (USD MILLION)
  • TABLE 94 SMES: MARKET, BY REGION, 2019–2023 (USD MILLION)
  • TABLE 95 SMES: MARKET, BY REGION, 2024–2029 (USD MILLION)
  • TABLE 96 MARKET, BY VERTICAL, 2019–2023 (USD MILLION)
  • TABLE 97 MARKET, BY VERTICAL, 2024–2029 (USD MILLION)
  • TABLE 98 ENERGY & UTILITIES: MARKET, BY REGION, 2019–2023 (USD MILLION)
  • TABLE 99 ENERGY & UTILITIES: MARKET, BY REGION, 2024–2029 (USD MILLION)
  • TABLE 100 MANUFACTURING: PREDICTIVE MAINTENANCE MARKET, BY REGION, 2019–2023 (USD MILLION)
  • TABLE 101 MANUFACTURING: MARKET, BY REGION, 2024–2029 (USD MILLION)
  • TABLE 102 AUTOMOTIVE & TRANSPORTATION: MARKET, BY REGION, 2019–2023 (USD MILLION)
  • TABLE 103 AUTOMOTIVE & TRANSPORTATION: MARKET, BY REGION, 2024–2029 (USD MILLION)
  • TABLE 104 AEROSPACE & DEFENSE: MARKET, BY REGION, 2019–2023 (USD MILLION)
  • TABLE 105 AEROSPACE & DEFENSE: MARKET, BY REGION, 2024–2029 (USD MILLION)
  • TABLE 106 CONSTRUCTION & MINING: MARKET, BY REGION, 2019–2023 (USD MILLION)
  • TABLE 107 CONSTRUCTION & MINING: MARKET, BY REGION, 2024–2029 (USD MILLION)
  • TABLE 108 HEALTHCARE: MARKET, BY REGION, 2019–2023 (USD MILLION)
  • TABLE 109 HEALTHCARE: MARKET, BY REGION, 2024–2029 (USD MILLION)
  • TABLE 110 TELECOMMUNICATIONS: MARKET, BY REGION, 2019–2023 (USD MILLION)
  • TABLE 111 TELECOMMUNICATIONS: MARKET, BY REGION, 2024–2029 (USD MILLION)
  • TABLE 112 OTHER VERTICALS: MARKET, BY REGION, 2019–2023 (USD MILLION)
  • TABLE 113 OTHER VERTICALS: MARKET, BY REGION, 2024–2029 (USD MILLION)
  • TABLE 114 MARKET, BY REGION, 2019–2023 (USD MILLION)
  • TABLE 115 MARKET, BY REGION, 2024–2029 (USD MILLION)
  • TABLE 116 NORTH AMERICA: PREDICTIVE MAINTENANCE MARKET, BY COUNTRY, 2019–2023 (USD MILLION)
  • TABLE 117 NORTH AMERICA: MARKET, BY COUNTRY, 2024–2029 (USD MILLION)
  • TABLE 118 NORTH AMERICA: MARKET, BY COMPONENT, 2019–2023 (USD MILLION)
  • TABLE 119 NORTH AMERICA: MARKET, BY COMPONENT, 2024–2029 (USD MILLION)
  • TABLE 120 NORTH AMERICA: MARKET, BY SOLUTION, 2019–2023 (USD MILLION)
  • TABLE 121 NORTH AMERICA: MARKET, BY SOLUTION, 2024–2029 (USD MILLION)
  • TABLE 122 NORTH AMERICA: PREDICTIVE MAINTENANCE SOLUTIONS MARKET, BY DEPLOYMENT MODE, 2019–2023 (USD MILLION)
  • TABLE 123 NORTH AMERICA: PREDICTIVE MAINTENANCE SOLUTIONS MARKET, BY DEPLOYMENT MODE, 2024–2029 (USD MILLION)
  • TABLE 124 NORTH AMERICA: PREDICTIVE MAINTENANCE SOLUTIONS MARKET, BY CLOUD, 2019–2023 (USD MILLION)
  • TABLE 125 NORTH AMERICA: PREDICTIVE MAINTENANCE SOLUTIONS MARKET, BY CLOUD, 2024–2029 (USD MILLION)
  • TABLE 126 NORTH AMERICA: MARKET, BY SERVICE, 2019–2023 (USD MILLION)
  • TABLE 127 NORTH AMERICA: MARKET, BY SERVICE, 2024–2029 (USD MILLION)
  • TABLE 128 NORTH AMERICA: MARKET, BY PROFESSIONAL SERVICE, 2019–2023 (USD MILLION)
  • TABLE 129 NORTH AMERICA: PREDICTIVE MAINTENANCE MARKET, BY PROFESSIONAL SERVICE, 2024–2029 (USD MILLION)
  • TABLE 130 NORTH AMERICA: MARKET, BY TECHNOLOGY, 2019–2023 (USD MILLION)
  • TABLE 131 NORTH AMERICA: MARKET, BY TECHNOLOGY, 2024–2029 (USD MILLION)
  • TABLE 132 NORTH AMERICA: MARKET, BY TECHNIQUE, 2019–2023 (USD MILLION)
  • TABLE 133 NORTH AMERICA: MARKET, BY TECHNIQUE, 2024–2029 (USD MILLION)
  • TABLE 134 NORTH AMERICA: MARKET, BY ORGANIZATION SIZE, 2019–2023 (USD MILLION)
  • TABLE 135 NORTH AMERICA: MARKET, BY ORGANIZATION SIZE, 2024–2029 (USD MILLION)
  • TABLE 136 NORTH AMERICA: MARKET, BY VERTICAL, 2019–2023 (USD MILLION)
  • TABLE 137 NORTH AMERICA: MARKET, BY VERTICAL, 2024–2029 (USD MILLION)
  • TABLE 138 US: PREDICTIVE MAINTENANCE MARKET, BY COMPONENT, 2019–2023 (USD MILLION)
  • TABLE 139 US: MARKET, BY COMPONENT, 2024–2029 (USD MILLION)
  • TABLE 140 US: PREDICTIVE MAINTENANCE SOLUTIONS MARKET, BY DEPLOYMENT MODE, 2019–2023 (USD MILLION)
  • TABLE 141 US: PREDICTIVE MAINTENANCE SOLUTIONS MARKET, BY DEPLOYMENT MODE, 2024–2029 (USD MILLION)
  • TABLE 142 US: MARKET, BY ORGANIZATION SIZE, 2019–2023 (USD MILLION)
  • TABLE 143 US: MARKET, BY ORGANIZATION SIZE, 2024–2029 (USD MILLION)
  • TABLE 144 CANADA: MARKET, BY COMPONENT, 2019–2023 (USD MILLION)
  • TABLE 145 CANADA: MARKET, BY COMPONENT, 2024–2029 (USD MILLION)
  • TABLE 146 CANADA: PREDICTIVE MAINTENANCE SOLUTIONS MARKET, BY DEPLOYMENT MODE, 2019–2023 (USD MILLION)
  • TABLE 147 CANADA: PREDICTIVE MAINTENANCE SOLUTIONS MARKET, BY DEPLOYMENT MODE, 2024–2029 (USD MILLION)
  • TABLE 148 CANADA: MARKET, BY ORGANIZATION SIZE, 2019–2023 (USD MILLION)
  • TABLE 149 CANADA: MARKET, BY ORGANIZATION SIZE, 2024–2029 (USD MILLION)
  • TABLE 150 EUROPE: PREDICTIVE MAINTENANCE MARKET, BY COUNTRY, 2019–2023 (USD MILLION)
  • TABLE 151 EUROPE: MARKET, BY COUNTRY, 2024–2029 (USD MILLION)
  • TABLE 152 EUROPE: MARKET, BY COMPONENT, 2019–2023 (USD MILLION)
  • TABLE 153 EUROPE: MARKET, BY COMPONENT, 2024–2029 (USD MILLION)
  • TABLE 154 EUROPE: MARKET, BY SOLUTION, 2019–2023 (USD MILLION)
  • TABLE 155 EUROPE: MARKET, BY SOLUTION, 2024–2029 (USD MILLION)
  • TABLE 156 EUROPE: PREDICTIVE MAINTENANCE SOLUTIONS MARKET, BY DEPLOYMENT MODE, 2019–2023 (USD MILLION)
  • TABLE 157 EUROPE: PREDICTIVE MAINTENANCE SOLUTIONS MARKET, BY DEPLOYMENT MODE, 2024–2029 (USD MILLION)
  • TABLE 158 EUROPE: PREDICTIVE MAINTENANCE SOLUTIONS MARKET, BY CLOUD, 2019–2023 (USD MILLION)
  • TABLE 159 EUROPE: PREDICTIVE MAINTENANCE SOLUTIONS MARKET, BY CLOUD, 2024–2029 (USD MILLION)
  • TABLE 160 EUROPE: PREDICTIVE MAINTENANCE MARKET, BY SERVICE, 2019–2023 (USD MILLION)
  • TABLE 161 EUROPE: MARKET, BY SERVICE, 2024–2029 (USD MILLION)
  • TABLE 162 EUROPE: MARKET, BY PROFESSIONAL SERVICE, 2019–2023 (USD MILLION)
  • TABLE 163 EUROPE: MARKET, BY PROFESSIONAL SERVICE, 2024–2029 (USD MILLION)
  • TABLE 164 EUROPE: MARKET, BY TECHNOLOGY, 2019–2023 (USD MILLION)
  • TABLE 165 EUROPE: MARKET, BY TECHNOLOGY, 2024–2029 (USD MILLION)
  • TABLE 166 EUROPE: MARKET, BY TECHNIQUE, 2019–2023 (USD MILLION)
  • TABLE 167 EUROPE: MARKET, BY TECHNIQUE, 2024–2029 (USD MILLION)
  • TABLE 168 EUROPE: MARKET, BY ORGANIZATION SIZE, 2019–2023 (USD MILLION)
  • TABLE 169 EUROPE: MARKET, BY ORGANIZATION SIZE, 2024–2029 (USD MILLION)
  • TABLE 170 EUROPE: MARKET, BY VERTICAL, 2019–2023 (USD MILLION)
  • TABLE 171 EUROPE: MARKET, BY VERTICAL, 2024–2029 (USD MILLION)
  • TABLE 172 UK: MARKET, BY COMPONENT, 2019–2023 (USD MILLION)
  • TABLE 173 UK: MARKET, BY COMPONENT, 2024–2029 (USD MILLION)
  • TABLE 174 UK: PREDICTIVE MAINTENANCE SOLUTIONS MARKET, BY DEPLOYMENT MODE, 2019–2023 (USD MILLION)
  • TABLE 175 UK: PREDICTIVE MAINTENANCE SOLUTIONS MARKET, BY DEPLOYMENT MODE, 2024–2029 (USD MILLION)
  • TABLE 176 UK: MARKET, BY ORGANIZATION SIZE, 2019–2023 (USD MILLION)
  • TABLE 177 UK: MARKET, BY ORGANIZATION SIZE, 2024–2029 (USD MILLION)
  • TABLE 178 GERMANY: PREDICTIVE MAINTENANCE MARKET, BY COMPONENT, 2019–2023 (USD MILLION)
  • TABLE 179 GERMANY: MARKET, BY COMPONENT, 2024–2029 (USD MILLION)
  • TABLE 180 GERMANY: PREDICTIVE MAINTENANCE SOLUTIONS MARKET, BY DEPLOYMENT MODE, 2019–2023 (USD MILLION)
  • TABLE 181 GERMANY: PREDICTIVE MAINTENANCE SOLUTIONS MARKET, BY DEPLOYMENT MODE, 2024–2029 (USD MILLION)
  • TABLE 182 GERMANY: MARKET, BY ORGANIZATION SIZE, 2019–2023 (USD MILLION)
  • TABLE 183 GERMANY: MARKET, BY ORGANIZATION SIZE, 2024–2029 (USD MILLION)
  • TABLE 184 FRANCE: MARKET, BY COMPONENT, 2019–2023 (USD MILLION)
  • TABLE 185 FRANCE: MARKET, BY COMPONENT, 2024–2029 (USD MILLION)
  • TABLE 186 FRANCE: PREDICTIVE MAINTENANCE SOLUTIONS MARKET, BY DEPLOYMENT MODE, 2019–2023 (USD MILLION)
  • TABLE 187 FRANCE: PREDICTIVE MAINTENANCE SOLUTIONS MARKET, BY DEPLOYMENT MODE, 2024–2029 (USD MILLION)
  • TABLE 188 FRANCE: MARKET, BY ORGANIZATION SIZE, 2019–2023 (USD MILLION)
  • TABLE 189 FRANCE: MARKET, BY ORGANIZATION SIZE, 2024–2029 (USD MILLION)
  • TABLE 190 SPAIN: PREDICTIVE MAINTENANCE MARKET, BY COMPONENT, 2019–2023 (USD MILLION)
  • TABLE 191 SPAIN: MARKET, BY COMPONENT, 2024–2029 (USD MILLION)
  • TABLE 192 SPAIN: PREDICTIVE MAINTENANCE SOLUTIONS MARKET, BY DEPLOYMENT MODE, 2019–2023 (USD MILLION)
  • TABLE 193 SPAIN: PREDICTIVE MAINTENANCE SOLUTIONS MARKET, BY DEPLOYMENT MODE, 2024–2029 (USD MILLION)
  • TABLE 194 SPAIN: MARKET, BY ORGANIZATION SIZE, 2019–2023 (USD MILLION)
  • TABLE 195 SPAIN: MARKET, BY ORGANIZATION SIZE, 2024–2029 (USD MILLION)
  • TABLE 196 ITALY: MARKET, BY COMPONENT, 2019–2023 (USD MILLION)
  • TABLE 197 ITALY: MARKET, BY COMPONENT, 2024–2029 (USD MILLION)
  • TABLE 198 ITALY: PREDICTIVE MAINTENANCE SOLUTIONS MARKET, BY DEPLOYMENT MODE, 2019–2023 (USD MILLION)
  • TABLE 199 ITALY: PREDICTIVE MAINTENANCE SOLUTIONS MARKET, BY DEPLOYMENT MODE, 2024–2029 (USD MILLION)
  • TABLE 200 ITALY: MARKET, BY ORGANIZATION SIZE, 2019–2023 (USD MILLION)
  • TABLE 201 ITALY: MARKET, BY ORGANIZATION SIZE, 2024–2029 (USD MILLION)
  • TABLE 202 REST OF EUROPE: MARKET, BY COMPONENT, 2019–2023 (USD MILLION)
  • TABLE 203 REST OF EUROPE: MARKET, BY COMPONENT, 2024–2029 (USD MILLION)
  • TABLE 204 REST OF EUROPE: PREDICTIVE MAINTENANCE SOLUTIONS MARKET, BY DEPLOYMENT MODE, 2019–2023 (USD MILLION)
  • TABLE 205 REST OF EUROPE: PREDICTIVE MAINTENANCE SOLUTIONS MARKET, BY DEPLOYMENT MODE, 2024–2029 (USD MILLION)
  • TABLE 206 REST OF EUROPE: MARKET, BY ORGANIZATION SIZE, 2019–2023 (USD MILLION)
  • TABLE 207 REST OF EUROPE: MARKET, BY ORGANIZATION SIZE, 2024–2029 (USD MILLION)
  • TABLE 208 ASIA PACIFIC: PREDICTIVE MAINTENANCE MARKET, BY COUNTRY, 2019–2023 (USD MILLION)
  • TABLE 209 ASIA PACIFIC: MARKET, BY COUNTRY, 2024–2029 (USD MILLION)
  • TABLE 210 ASIA PACIFIC: MARKET, BY COMPONENT, 2019–2023 (USD MILLION)
  • TABLE 211 ASIA PACIFIC: MARKET, BY COMPONENT, 2024–2029 (USD MILLION)
  • TABLE 212 ASIA PACIFIC: MARKET, BY SOLUTION, 2019–2023 (USD MILLION)
  • TABLE 213 ASIA PACIFIC: MARKET, BY SOLUTION, 2024–2029 (USD MILLION)
  • TABLE 214 ASIA PACIFIC: PREDICTIVE MAINTENANCE SOLUTIONS MARKET, BY DEPLOYMENT MODE, 2019–2023 (USD MILLION)
  • TABLE 215 ASIA PACIFIC: PREDICTIVE MAINTENANCE SOLUTIONS MARKET, BY DEPLOYMENT MODE, 2024–2029 (USD MILLION)
  • TABLE 216 ASIA PACIFIC: PREDICTIVE MAINTENANCE SOLUTIONS MARKET, BY CLOUD, 2019–2023 (USD MILLION)
  • TABLE 217 ASIA PACIFIC: PREDICTIVE MAINTENANCE SOLUTIONS MARKET, BY CLOUD, 2024–2029 (USD MILLION)
  • TABLE 218 ASIA PACIFIC: PREDICTIVE MAINTENANCE MARKET, BY SERVICE, 2019–2023 (USD MILLION)
  • TABLE 219 ASIA PACIFIC: MARKET, BY SERVICE, 2024–2029 (USD MILLION)
  • TABLE 220 ASIA PACIFIC: MARKET, BY PROFESSIONAL SERVICE, 2019–2023 (USD MILLION)
  • TABLE 221 ASIA PACIFIC: MARKET, BY PROFESSIONAL SERVICE, 2024–2029 (USD MILLION)
  • TABLE 222 ASIA PACIFIC: MARKET, BY TECHNOLOGY, 2019–2023 (USD MILLION)
  • TABLE 223 ASIA PACIFIC: MARKET, BY TECHNOLOGY, 2024–2029 (USD MILLION)
  • TABLE 224 ASIA PACIFIC: MARKET, BY TECHNIQUE, 2019–2023 (USD MILLION)
  • TABLE 225 ASIA PACIFIC: MARKET, BY TECHNIQUE, 2024–2029 (USD MILLION)
  • TABLE 226 ASIA PACIFIC: MARKET, BY ORGANIZATION SIZE, 2019–2023 (USD MILLION)
  • TABLE 227 ASIA PACIFIC: MARKET, BY ORGANIZATION SIZE, 2024–2029 (USD MILLION)
  • TABLE 228 ASIA PACIFIC: MARKET, BY VERTICAL, 2019–2023 (USD MILLION)
  • TABLE 229 ASIA PACIFIC: MARKET, BY VERTICAL, 2024–2029 (USD MILLION)
  • TABLE 230 CHINA: PREDICTIVE MAINTENANCE MARKET, BY COMPONENT, 2019–2023 (USD MILLION)
  • TABLE 231 CHINA: MARKET, BY COMPONENT, 2024–2029 (USD MILLION)
  • TABLE 232 CHINA: PREDICTIVE MAINTENANCE SOLUTIONS MARKET, BY DEPLOYMENT MODE, 2019–2023 (USD MILLION)
  • TABLE 233 CHINA: PREDICTIVE MAINTENANCE SOLUTIONS MARKET, BY DEPLOYMENT MODE, 2024–2029 (USD MILLION)
  • TABLE 234 CHINA: MARKET, BY ORGANIZATION SIZE, 2019–2023 (USD MILLION)
  • TABLE 235 CHINA: MARKET, BY ORGANIZATION SIZE, 2024–2029 (USD MILLION)
  • TABLE 236 JAPAN: MARKET, BY COMPONENT, 2019–2023 (USD MILLION)
  • TABLE 237 JAPAN: MARKET, BY COMPONENT, 2024–2029 (USD MILLION)
  • TABLE 238 JAPAN: PREDICTIVE MAINTENANCE SOLUTIONS MARKET, BY DEPLOYMENT MODE, 2019–2023 (USD MILLION)
  • TABLE 239 JAPAN: PREDICTIVE MAINTENANCE SOLUTIONS MARKET, BY DEPLOYMENT MODE, 2024–2029 (USD MILLION)
  • TABLE 240 JAPAN: MARKET, BY ORGANIZATION SIZE, 2019–2023 (USD MILLION)
  • TABLE 241 JAPAN: MARKET, BY ORGANIZATION SIZE, 2024–2029 (USD MILLION)
  • TABLE 242 INDIA: PREDICTIVE MAINTENANCE MARKET, BY COMPONENT, 2019–2023 (USD MILLION)
  • TABLE 243 INDIA: MARKET, BY COMPONENT, 2024–2029 (USD MILLION)
  • TABLE 244 INDIA: PREDICTIVE MAINTENANCE SOLUTIONS MARKET, BY DEPLOYMENT MODE, 2019–2023 (USD MILLION)
  • TABLE 245 INDIA: PREDICTIVE MAINTENANCE SOLUTIONS MARKET, BY DEPLOYMENT MODE, 2024–2029 (USD MILLION)
  • TABLE 246 INDIA: MARKET, BY ORGANIZATION SIZE, 2019–2023 (USD MILLION)
  • TABLE 247 INDIA: MARKET, BY ORGANIZATION SIZE, 2024–2029 (USD MILLION)
  • TABLE 248 SOUTH KOREA: MARKET, BY COMPONENT, 2019–2023 (USD MILLION)
  • TABLE 249 SOUTH KOREA: MARKET, BY COMPONENT, 2024–2029 (USD MILLION)
  • TABLE 250 SOUTH KOREA: PREDICTIVE MAINTENANCE SOLUTIONS MARKET, BY DEPLOYMENT MODE, 2019–2023 (USD MILLION)
  • TABLE 251 SOUTH KOREA: PREDICTIVE MAINTENANCE SOLUTIONS MARKET, BY DEPLOYMENT MODE, 2024–2029 (USD MILLION)
  • TABLE 252 SOUTH KOREA: MARKET, BY ORGANIZATION SIZE, 2019–2023 (USD MILLION)
  • TABLE 253 SOUTH KOREA: MARKET, BY ORGANIZATION SIZE, 2024–2029 (USD MILLION)
  • TABLE 254 AUSTRALIA & NEW ZEALAND: PREDICTIVE MAINTENANCE MARKET, BY COMPONENT, 2019–2023 (USD MILLION)
  • TABLE 255 AUSTRALIA & NEW ZEALAND: MARKET, BY COMPONENT, 2024–2029 (USD MILLION)
  • TABLE 256 AUSTRALIA & NEW ZEALAND: PREDICTIVE MAINTENANCE SOLUTIONS MARKET, BY DEPLOYMENT MODE, 2019–2023 (USD MILLION)
  • TABLE 257 AUSTRALIA & NEW ZEALAND: PREDICTIVE MAINTENANCE SOLUTIONS MARKET, BY DEPLOYMENT MODE, 2024–2029 (USD MILLION)
  • TABLE 258 AUSTRALIA & NEW ZEALAND: MARKET, BY ORGANIZATION SIZE, 2019–2023 (USD MILLION)
  • TABLE 259 AUSTRALIA & NEW ZEALAND: MARKET, BY ORGANIZATION SIZE, 2024–2029 (USD MILLION)
  • TABLE 260 REST OF ASIA PACIFIC: MARKET, BY COMPONENT, 2019–2023 (USD MILLION)
  • TABLE 261 REST OF ASIA PACIFIC: MARKET, BY COMPONENT, 2024–2029 (USD MILLION)
  • TABLE 262 REST OF ASIA PACIFIC: PREDICTIVE MAINTENANCE SOLUTIONS MARKET, BY DEPLOYMENT MODE, 2019–2023 (USD MILLION)
  • TABLE 263 REST OF ASIA PACIFIC: PREDICTIVE MAINTENANCE SOLUTIONS MARKET, BY DEPLOYMENT MODE, 2024–2029 (USD MILLION)
  • TABLE 264 REST OF ASIA PACIFIC: MARKET, BY ORGANIZATION SIZE, 2019–2023 (USD MILLION)
  • TABLE 265 REST OF ASIA PACIFIC: MARKET, BY ORGANIZATION SIZE, 2024–2029 (USD MILLION)
  • TABLE 266 MIDDLE EAST & AFRICA: PREDICTIVE MAINTENANCE MARKET, BY COUNTRY, 2019–2023 (USD MILLION)
  • TABLE 267 MIDDLE EAST & AFRICA: MARKET, BY COUNTRY, 2024–2029 (USD MILLION)
  • TABLE 268 MIDDLE EAST & AFRICA: MARKET, BY COMPONENT, 2019–2023 (USD MILLION)
  • TABLE 269 MIDDLE EAST & AFRICA: MARKET, BY COMPONENT, 2024–2029 (USD MILLION)
  • TABLE 270 MIDDLE EAST & AFRICA: MARKET, BY SOLUTION, 2019–2023 (USD MILLION)
  • TABLE 271 MIDDLE EAST & AFRICA: MARKET, BY SOLUTION, 2024–2029 (USD MILLION)
  • TABLE 272 MIDDLE EAST & AFRICA: PREDICTIVE MAINTENANCE SOLUTIONS MARKET, BY DEPLOYMENT MODE, 2019–2023 (USD MILLION)
  • TABLE 273 MIDDLE EAST & AFRICA: PREDICTIVE MAINTENANCE SOLUTIONS MARKET, BY DEPLOYMENT MODE, 2024–2029 (USD MILLION)
  • TABLE 274 MIDDLE EAST & AFRICA: PREDICTIVE MAINTENANCE SOLUTIONS MARKET, BY CLOUD, 2019–2023 (USD MILLION)
  • TABLE 275 MIDDLE EAST & AFRICA: PREDICTIVE MAINTENANCE SOLUTIONS MARKET, BY CLOUD, 2024–2029 (USD MILLION)
  • TABLE 276 MIDDLE EAST & AFRICA: MARKET, BY SERVICE, 2019–2023 (USD MILLION)
  • TABLE 277 MIDDLE EAST & AFRICA: PREDICTIVE MAINTENANCE MARKET, BY SERVICE, 2024–2029 (USD MILLION)
  • TABLE 278 MIDDLE EAST & AFRICA: MARKET, BY PROFESSIONAL SERVICE, 2019–2023 (USD MILLION)
  • TABLE 279 MIDDLE EAST & AFRICA: MARKET, BY PROFESSIONAL SERVICE, 2024–2029 (USD MILLION)
  • TABLE 280 MIDDLE EAST & AFRICA: MARKET, BY TECHNOLOGY, 2019–2023 (USD MILLION)
  • TABLE 281 MIDDLE EAST & AFRICA: MARKET, BY TECHNOLOGY, 2024–2029 (USD MILLION)
  • TABLE 282 MIDDLE EAST & AFRICA: MARKET, BY TECHNIQUE, 2019–2023 (USD MILLION)
  • TABLE 283 MIDDLE EAST & AFRICA: MARKET, BY TECHNIQUE, 2024–2029 (USD MILLION)
  • TABLE 284 MIDDLE EAST & AFRICA: MARKET, BY ORGANIZATION SIZE, 2019–2023 (USD MILLION)
  • TABLE 285 MIDDLE EAST & AFRICA: MARKET, BY ORGANIZATION SIZE, 2024–2029 (USD MILLION)
  • TABLE 286 MIDDLE EAST & AFRICA: MARKET, BY VERTICAL, 2019–2023 (USD MILLION)
  • TABLE 287 MIDDLE EAST & AFRICA: MARKET, BY VERTICAL, 2024–2029 (USD MILLION)
  • TABLE 288 UAE: PREDICTIVE MAINTENANCE MARKET, BY COMPONENT, 2019–2023 (USD MILLION)
  • TABLE 289 UAE: MARKET, BY COMPONENT, 2024–2029 (USD MILLION)
  • TABLE 290 UAE: PREDICTIVE MAINTENANCE SOLUTIONS MARKET, BY DEPLOYMENT MODE, 2019–2023 (USD MILLION)
  • TABLE 291 UAE: PREDICTIVE MAINTENANCE SOLUTIONS MARKET, BY DEPLOYMENT MODE, 2024–2029 (USD MILLION)
  • TABLE 292 UAE: MARKET, BY ORGANIZATION SIZE, 2019–2023 (USD MILLION)
  • TABLE 293 UAE: MARKET, BY ORGANIZATION SIZE, 2024–2029 (USD MILLION)
  • TABLE 294 SAUDI ARABIA: MARKET, BY COMPONENT, 2019–2023 (USD MILLION)
  • TABLE 295 SAUDI ARABIA: MARKET, BY COMPONENT, 2024–2029 (USD MILLION)
  • TABLE 296 SAUDI ARABIA: PREDICTIVE MAINTENANCE SOLUTIONS MARKET, BY DEPLOYMENT MODE, 2019–2023 (USD MILLION)
  • TABLE 297 SAUDI ARABIA: PREDICTIVE MAINTENANCE SOLUTIONS MARKET, BY DEPLOYMENT MODE, 2024–2029 (USD MILLION)
  • TABLE 298 SAUDI ARABIA: MARKET, BY ORGANIZATION SIZE, 2019–2023 (USD MILLION)
  • TABLE 299 SAUDI ARABIA: MARKET, BY ORGANIZATION SIZE, 2024–2029 (USD MILLION)
  • TABLE 300 QATAR: PREDICTIVE MAINTENANCE MARKET, BY COMPONENT, 2019–2023 (USD MILLION)
  • TABLE 301 QATAR: MARKET, BY COMPONENT, 2024–2029 (USD MILLION)
  • TABLE 302 QATAR: PREDICTIVE MAINTENANCE SOLUTIONS MARKET, BY DEPLOYMENT MODE, 2019–2023 (USD MILLION)
  • TABLE 303 QATAR: PREDICTIVE MAINTENANCE SOLUTIONS MARKET, BY DEPLOYMENT MODE, 2024–2029 (USD MILLION)
  • TABLE 304 QATAR: MARKET, BY ORGANIZATION SIZE, 2019–2023 (USD MILLION)
  • TABLE 305 QATAR: MARKET, BY ORGANIZATION SIZE, 2024–2029 (USD MILLION)
  • TABLE 306 TURKEY: MARKET, BY COMPONENT, 2019–2023 (USD MILLION)
  • TABLE 307 TURKEY: MARKET, BY COMPONENT, 2024–2029 (USD MILLION)
  • TABLE 308 TURKEY: PREDICTIVE MAINTENANCE SOLUTIONS MARKET, BY DEPLOYMENT MODE, 2019–2023 (USD MILLION)
  • TABLE 309 TURKEY: PREDICTIVE MAINTENANCE SOLUTIONS MARKET, BY DEPLOYMENT MODE, 2024–2029 (USD MILLION)
  • TABLE 310 TURKEY: MARKET, BY ORGANIZATION SIZE, 2019–2023 (USD MILLION)
  • TABLE 311 TURKEY: MARKET, BY ORGANIZATION SIZE, 2024–2029 (USD MILLION)
  • TABLE 312 SOUTH AFRICA: PREDICTIVE MAINTENANCE MARKET, BY COMPONENT, 2019–2023 (USD MILLION)
  • TABLE 313 SOUTH AFRICA: MARKET, BY COMPONENT, 2024–2029 (USD MILLION)
  • TABLE 314 SOUTH AFRICA: PREDICTIVE MAINTENANCE SOLUTIONS MARKET, BY DEPLOYMENT MODE, 2019–2023 (USD MILLION)
  • TABLE 315 SOUTH AFRICA: PREDICTIVE MAINTENANCE SOLUTIONS MARKET, BY DEPLOYMENT MODE, 2024–2029 (USD MILLION)
  • TABLE 316 SOUTH AFRICA: MARKET, BY ORGANIZATION SIZE, 2019–2023 (USD MILLION)
  • TABLE 317 SOUTH AFRICA: MARKET, BY ORGANIZATION SIZE, 2024–2029 (USD MILLION)
  • TABLE 318 REST OF MIDDLE EAST & AFRICA: MARKET, BY COMPONENT, 2019–2023 (USD MILLION)
  • TABLE 319 REST OF MIDDLE EAST & AFRICA: MARKET, BY COMPONENT, 2024–2029 (USD MILLION)
  • TABLE 320 REST OF MIDDLE EAST & AFRICA: PREDICTIVE MAINTENANCE SOLUTIONS MARKET, BY DEPLOYMENT MODE, 2019–2023 (USD MILLION)
  • TABLE 321 REST OF MIDDLE EAST & AFRICA: PREDICTIVE MAINTENANCE SOLUTIONS MARKET, BY DEPLOYMENT MODE, 2024–2029 (USD MILLION)
  • TABLE 322 REST OF MIDDLE EAST & AFRICA: MARKET, BY ORGANIZATION SIZE, 2019–2023 (USD MILLION)
  • TABLE 323 REST OF MIDDLE EAST & AFRICA: MARKET, BY ORGANIZATION SIZE, 2024–2029 (USD MILLION)
  • TABLE 324 LATIN AMERICA: PREDICTIVE MAINTENANCE MARKET, BY COUNTRY, 2019–2023 (USD MILLION)
  • TABLE 325 LATIN AMERICA: MARKET, BY COUNTRY, 2024–2029 (USD MILLION)
  • TABLE 326 LATIN AMERICA: MARKET, BY COMPONENT, 2019–2023 (USD MILLION)
  • TABLE 327 LATIN AMERICA: MARKET, BY COMPONENT, 2024–2029 (USD MILLION)
  • TABLE 328 LATIN AMERICA: MARKET, BY SOLUTION, 2019–2023 (USD MILLION)
  • TABLE 329 LATIN AMERICA: MARKET, BY SOLUTION, 2024–2029 (USD MILLION)
  • TABLE 330 LATIN AMERICA: PREDICTIVE MAINTENANCE SOLUTIONS MARKET, BY DEPLOYMENT MODE, 2019–2023 (USD MILLION)
  • TABLE 331 LATIN AMERICA: PREDICTIVE MAINTENANCE SOLUTIONS MARKET, BY DEPLOYMENT MODE, 2024–2029 (USD MILLION)
  • TABLE 332 LATIN AMERICA: PREDICTIVE MAINTENANCE SOLUTIONS MARKET, BY CLOUD, 2019–2023 (USD MILLION)
  • TABLE 333 LATIN AMERICA: PREDICTIVE MAINTENANCE SOLUTIONS MARKET, BY CLOUD, 2024–2029 (USD MILLION)
  • TABLE 334 LATIN AMERICA: MARKET, BY SERVICE, 2019–2023 (USD MILLION)
  • TABLE 335 LATIN AMERICA: MARKET, BY SERVICE, 2024–2029 (USD MILLION)
  • TABLE 336 LATIN AMERICA: PREDICTIVE MAINTENANCE MARKET, BY PROFESSIONAL SERVICE, 2019–2023 (USD MILLION)
  • TABLE 337 LATIN AMERICA: MARKET, BY PROFESSIONAL SERVICE, 2024–2029 (USD MILLION)
  • TABLE 338 LATIN AMERICA: MARKET, BY TECHNOLOGY, 2019–2023 (USD MILLION)
  • TABLE 339 LATIN AMERICA: MARKET, BY TECHNOLOGY, 2024–2029 (USD MILLION)
  • TABLE 340 LATIN AMERICA: MARKET, BY TECHNIQUE, 2019–2023 (USD MILLION)
  • TABLE 341 LATIN AMERICA: MARKET, BY TECHNIQUE, 2024–2029 (USD MILLION)
  • TABLE 342 LATIN AMERICA: MARKET, BY ORGANIZATION SIZE, 2019–2023 (USD MILLION)
  • TABLE 343 LATIN AMERICA: MARKET, BY ORGANIZATION SIZE, 2024–2029 (USD MILLION)
  • TABLE 344 LATIN AMERICA: MARKET, BY VERTICAL, 2019–2023 (USD MILLION)
  • TABLE 345 LATIN AMERICA: MARKET, BY VERTICAL, 2024–2029 (USD MILLION)
  • TABLE 346 BRAZIL: MARKET, BY COMPONENT, 2019–2023 (USD MILLION)
  • TABLE 347 BRAZIL: MARKET, BY COMPONENT, 2024–2029 (USD MILLION)
  • TABLE 348 BRAZIL: PREDICTIVE MAINTENANCE SOLUTIONS MARKET, BY DEPLOYMENT MODE, 2019–2023 (USD MILLION)
  • TABLE 349 BRAZIL: PREDICTIVE MAINTENANCE SOLUTIONS MARKET, BY DEPLOYMENT MODE, 2024–2029 (USD MILLION)
  • TABLE 350 BRAZIL: MARKET, BY ORGANIZATION SIZE, 2019–2023 (USD MILLION)
  • TABLE 351 BRAZIL: MARKET, BY ORGANIZATION SIZE, 2024–2029 (USD MILLION)
  • TABLE 352 MEXICO: PREDICTIVE MAINTENANCE MARKET, BY COMPONENT, 2019–2023 (USD MILLION)
  • TABLE 353 MEXICO: MARKET, BY COMPONENT, 2024–2029 (USD MILLION)
  • TABLE 354 MEXICO: PREDICTIVE MAINTENANCE SOLUTIONS MARKET, BY DEPLOYMENT MODE, 2019–2023 (USD MILLION)
  • TABLE 355 MEXICO: PREDICTIVE MAINTENANCE SOLUTIONS MARKET, BY DEPLOYMENT MODE, 2024–2029 (USD MILLION)
  • TABLE 356 MEXICO: MARKET, BY ORGANIZATION SIZE, 2019–2023 (USD MILLION)
  • TABLE 357 MEXICO: MARKET, BY ORGANIZATION SIZE, 2024–2029 (USD MILLION)
  • TABLE 358 ARGENTINA: MARKET, BY COMPONENT, 2019–2023 (USD MILLION)
  • TABLE 359 ARGENTINA: MARKET, BY COMPONENT, 2024–2029 (USD MILLION)
  • TABLE 360 ARGENTINA: PREDICTIVE MAINTENANCE SOLUTIONS MARKET, BY DEPLOYMENT MODE, 2019–2023 (USD MILLION)
  • TABLE 361 ARGENTINA: PREDICTIVE MAINTENANCE SOLUTIONS MARKET, BY DEPLOYMENT MODE, 2024–2029 (USD MILLION)
  • TABLE 362 ARGENTINA: MARKET, BY ORGANIZATION SIZE, 2019–2023 (USD MILLION)
  • TABLE 363 ARGENTINA: MARKET, BY ORGANIZATION SIZE, 2024–2029 (USD MILLION)
  • TABLE 364 REST OF LATIN AMERICA: PREDICTIVE MAINTENANCE MARKET, BY COMPONENT, 2019–2023 (USD MILLION)
  • TABLE 365 REST OF LATIN AMERICA: MARKET, BY COMPONENT, 2024–2029 (USD MILLION)
  • TABLE 366 REST OF LATIN AMERICA: PREDICTIVE MAINTENANCE SOLUTIONS MARKET, BY DEPLOYMENT MODE, 2019–2023 (USD MILLION)
  • TABLE 367 REST OF LATIN AMERICA: PREDICTIVE MAINTENANCE SOLUTIONS MARKET, BY DEPLOYMENT MODE, 2024–2029 (USD MILLION)
  • TABLE 368 REST OF LATIN AMERICA: MARKET, BY ORGANIZATION SIZE, 2019–2023 (USD MILLION)
  • TABLE 369 REST OF LATIN AMERICA: MARKET, BY ORGANIZATION SIZE, 2024–2029 (USD MILLION)
  • TABLE 370 OVERVIEW OF STRATEGIES ADOPTED BY KEY PREDICTIVE MAINTENANCE VENDORS
  • TABLE 371 MARKET: DEGREE OF COMPETITION
  • TABLE 372 COMPANY REGION FOOTPRINT
  • TABLE 373 COMPANY COMPONENT FOOTPRINT
  • TABLE 374 COMPANY TECHNOLOGY FOOTPRINT
  • TABLE 375 COMPANY VERTICAL FOOTPRINT
  • TABLE 376 MARKET: DETAILED LIST OF KEY STARTUPS/SMES
  • TABLE 377 MARKET: COMPETITIVE BENCHMARKING OF KEY STARTUPS/SMES
  • TABLE 378 MARKET: PRODUCT LAUNCHES, JANUARY 2021–FEBRUARY 2024
  • TABLE 379 PREDICTIVE MAINTENANCE MARKET: DEALS, JANUARY 2021–FEBRUARY 2024
  • TABLE 380 IBM: BUSINESS OVERVIEW
  • TABLE 381 IBM: PRODUCTS/SOLUTIONS/SERVICES OFFERED
  • TABLE 382 IBM: DEALS
  • TABLE 383 ABB: BUSINESS OVERVIEW
  • TABLE 384 ABB: PRODUCTS/SOLUTIONS/SERVICES OFFERED
  • TABLE 385 ABB: PRODUCT LAUNCHES & ENHANCEMENTS
  • TABLE 386 ABB: DEALS
  • TABLE 387 SCHNEIDER ELECTRIC: BUSINESS OVERVIEW
  • TABLE 388 SCHNEIDER ELECTRIC: PRODUCTS/SOLUTIONS/SERVICES OFFERED
  • TABLE 389 SCHNEIDER ELECTRIC: PRODUCT LAUNCHES & ENHANCEMENTS
  • TABLE 390 SCHNEIDER ELECTRIC: DEALS
  • TABLE 391 AWS: BUSINESS OVERVIEW
  • TABLE 392 AWS: PRODUCTS/SOLUTIONS/SERVICES OFFERED
  • TABLE 393 AWS: PRODUCT LAUNCHES
  • TABLE 394 AWS: DEALS
  • TABLE 395 GOOGLE: BUSINESS OVERVIEW
  • TABLE 396 GOOGLE: PRODUCTS/SOLUTIONS/SERVICES OFFERED
  • TABLE 397 GOOGLE: PRODUCT LAUNCHES
  • TABLE 398 GOOGLE: DEALS
  • TABLE 399 MICROSOFT: BUSINESS OVERVIEW
  • TABLE 400 MICROSOFT: PRODUCTS/SOLUTIONS/SERVICES OFFERED
  • TABLE 401 MICROSOFT: DEALS
  • TABLE 402 HITACHI: BUSINESS OVERVIEW
  • TABLE 403 HITACHI: PRODUCTS/SOLUTIONS/SERVICES OFFERED
  • TABLE 404 HITACHI: PRODUCT LAUNCHES & ENHANCEMENTS
  • TABLE 405 HITACHI: DEALS
  • TABLE 406 SAP: BUSINESS OVERVIEW
  • TABLE 407 SAP: PRODUCTS/SOLUTIONS/SERVICES OFFERED
  • TABLE 408 SAP: PRODUCT LAUNCHES & ENHANCEMENTS
  • TABLE 409 SAP: DEALS
  • TABLE 410 SAS INSTITUTE: BUSINESS OVERVIEW
  • TABLE 411 SAS INSTITUTE: PRODUCTS/SOLUTIONS/SERVICES OFFERED
  • TABLE 412 SAS INSTITUTE: PRODUCT LAUNCHES & ENHANCEMENTS
  • TABLE 413 SAS INSTITUTE: DEALS
  • TABLE 414 SOFTWARE AG: BUSINESS OVERVIEW
  • TABLE 415 SOFTWARE AG: PRODUCTS/SOLUTIONS/SERVICES OFFERED
  • TABLE 416 SOFTWARE AG: PRODUCT LAUNCHES & ENHANCEMENTS
  • TABLE 417 SOFTWARE AG: DEALS
  • TABLE 418 TIBCO SOFTWARE: BUSINESS OVERVIEW
  • TABLE 419 TIBCO SOFTWARE: PRODUCTS/SOLUTIONS/SERVICES OFFERED
  • TABLE 420 TIBCO SOFTWARE: PRODUCT LAUNCHES & ENHANCEMENTS
  • TABLE 421 TIBCO SOFTWARE: DEALS
  • TABLE 422 ALTAIR: BUSINESS OVERVIEW
  • TABLE 423 ALTAIR: PRODUCTS/SOLUTIONS/SERVICES OFFERED
  • TABLE 424 ALTAIR: PRODUCT LAUNCHES & ENHANCEMENTS
  • TABLE 425 ALTAIR: DEALS
  • TABLE 426 ORACLE: BUSINESS OVERVIEW
  • TABLE 427 ORACLE: PRODUCTS/SOLUTIONS/SERVICES OFFERED
  • TABLE 428 ORACLE: DEALS
  • TABLE 429 SPLUNK: BUSINESS OVERVIEW
  • TABLE 430 SPLUNK: PRODUCTS/SOLUTIONS/SERVICES OFFERED
  • TABLE 431 SPLUNK: DEALS
  • TABLE 432 ENTERPRISE ASSET MANAGEMENT MARKET SIZE AND GROWTH, 2018–2022 (USD MILLION, Y-O-Y%)
  • TABLE 433 ENTERPRISE ASSET MANAGEMENT MARKET SIZE AND GROWTH, 2023–2028 (USD MILLION, Y-O-Y%)
  • TABLE 434 ENTERPRISE ASSET MANAGEMENT MARKET, BY OFFERING, 2018–2022 (USD MILLION)
  • TABLE 435 ENTERPRISE ASSET MANAGEMENT MARKET, BY OFFERING, 2023–2028 (USD MILLION)
  • TABLE 436 ENTERPRISE ASSET MANAGEMENT MARKET, BY APPLICATION, 2018–2022 (USD MILLION)
  • TABLE 437 ENTERPRISE ASSET MANAGEMENT MARKET, BY APPLICATION, 2023–2028 (USD MILLION)
  • TABLE 438 ENTERPRISE ASSET MANAGEMENT MARKET, BY DEPLOYMENT MODEL, 2018–2022 (USD MILLION)
  • TABLE 439 ENTERPRISE ASSET MANAGEMENT MARKET, BY DEPLOYMENT MODEL, 2023–2028 (USD MILLION)
  • TABLE 440 ENTERPRISE ASSET MANAGEMENT MARKET, BY ORGANIZATION SIZE, 2018–2022 (USD MILLION)
  • TABLE 441 ENTERPRISE ASSET MANAGEMENT MARKET, BY ORGANIZATION SIZE, 2023–2028 (USD MILLION)
  • TABLE 442 ENTERPRISE ASSET MANAGEMENT MARKET, BY VERTICAL, 2018–2022 (USD MILLION)
  • TABLE 443 ENTERPRISE ASSET MANAGEMENT MARKET, BY VERTICAL, 2023–2028 (USD MILLION)
  • TABLE 444 ENTERPRISE ASSET MANAGEMENT MARKET, BY REGION, 2018–2022 (USD MILLION)
  • TABLE 445 ENTERPRISE ASSET MANAGEMENT MARKET, BY REGION, 2023–2028 (USD MILLION)
  • TABLE 446 GLOBAL BIG DATA MARKET SIZE AND GROWTH RATE, 2018–2022 (USD MILLION, Y-O-Y)
  • TABLE 447 GLOBAL BIG DATA MARKET SIZE AND GROWTH RATE, 2023–2028 (USD MILLION, Y-O-Y)
  • TABLE 448 BIG DATA MARKET, BY OFFERING, 2018–2022 (USD MILLION)
  • TABLE 449 BIG DATA MARKET, BY OFFERING, 2023–2028 (USD MILLION)
  • TABLE 450 BIG DATA MARKET, BY BUSINESS FUNCTION, 2018–2022 (USD MILLION)
  • TABLE 451 BIG DATA MARKET, BY BUSINESS FUNCTION, 2023–2028 (USD MILLION)
  • TABLE 452 BIG DATA MARKET, BY DATA TYPE, 2018–2022 (USD MILLION)
  • TABLE 453 BIG DATA MARKET, BY DATA TYPE, 2023–2028 (USD MILLION)
  • TABLE 454 BIG DATA MARKET, BY VERTICAL, 2018–2022 (USD MILLION)
  • TABLE 455 BIG DATA MARKET, BY VERTICAL, 2023–2028 (USD MILLION)
  • TABLE 456 BIG DATA MARKET, BY REGION, 2018–2022 (USD MILLION)
  • TABLE 457 BIG DATA MARKET, BY REGION, 2023–2028 (USD MILLION)
LIST OF FIGURES
 
  • FIGURE 1 PREDICTIVE MAINTENANCE MARKET: RESEARCH DESIGN
  • FIGURE 2 MARKET: DATA TRIANGULATION
  • FIGURE 3 TOP-DOWN AND BOTTOM-UP APPROACHES
  • FIGURE 4 APPROACH 1 (SUPPLY SIDE): REVENUE OF HARDWARE/SOLUTIONS/ SERVICES OF MARKET
  • FIGURE 5 APPROACH 2, BOTTOM-UP (SUPPLY SIDE): COLLECTIVE REVENUE OF ALL MARKET HARDWARE/SOLUTIONS/SERVICES
  • FIGURE 6 APPROACH 3, BOTTOM-UP (SUPPLY SIDE): COLLECTIVE REVENUE FROM ALL MARKET HARDWARE/SOLUTIONS/SERVICES
  • FIGURE 7 APPROACH 4, BOTTOM-UP (DEMAND SIDE): SHARE OF MARKET THROUGH OVERALL MARKET SPENDING
  • FIGURE 8 SOLUTIONS SEGMENT TO ACCOUNT FOR LARGEST MARKET SIZE IN 2024
  • FIGURE 9 INTEGRATED SEGMENT TO HOLD LARGEST MARKET SHARE IN 2024
  • FIGURE 10 ON-PREMISES SEGMENT TO HOLD LARGEST MARKET SHARE IN 2024
  • FIGURE 11 PUBLIC SEGMENT TO ACCOUNT FOR LARGEST MARKET SIZE IN 2024
  • FIGURE 12 PROFESSIONAL SERVICES TO ACCOUNT FOR LARGER SHARE IN 2024
  • FIGURE 13 SYSTEM INTEGRATION TO ACCOUNT FOR LARGEST MARKET SIZE IN 2024
  • FIGURE 14 ANALYTICS & DATA MANAGEMENT TECHNOLOGY TO HOLD LARGEST MARKET SIZE IN 2024
  • FIGURE 15 VIBRATION ANALYSIS TO ACCOUNT FOR LARGEST MARKET SIZE IN 2024
  • FIGURE 16 LARGE ENTERPRISES TO ACCOUNT FOR LARGER SHARE IN 2024
  • FIGURE 17 ENERGY & UTILITIES TO GROW AT HIGHEST CAGR DURING FORECAST PERIOD
  • FIGURE 18 ASIA PACIFIC TO GROW AT HIGHEST CAGR IN MARKET
  • FIGURE 19 ADOPTION OF INDUSTRY 4.0 AND DIGITAL TRANSFORMATION INITIATIVES ACROSS INDUSTRIES TO DRIVE MARKET
  • FIGURE 20 SERVICES TO GROW AT HIGHEST CAGR DURING FORECAST PERIOD
  • FIGURE 21 SOLUTIONS AND ENERGY & UTILITIES TO ACCOUNT FOR LARGEST SHARES OF NORTH AMERICAN MARKET IN 2024
  • FIGURE 22 NORTH AMERICA TO ACCOUNT FOR LARGEST SHARE IN 2024
  • FIGURE 23 PREDICTIVE MAINTENANCE MARKET: DRIVERS, RESTRAINTS, OPPORTUNITIES, AND CHALLENGES
  • FIGURE 24 MARKET EVOLUTION
  • FIGURE 25 MARKET: SUPPLY CHAIN ANALYSIS
  • FIGURE 26 KEY PLAYERS IN MARKET ECOSYSTEM
  • FIGURE 27 IMPORT DATA OF SPECTROMETERS, BY KEY COUNTRY, 2015–2022 (USD BILLION)
  • FIGURE 28 EXPORT DATA OF SPECTROMETERS, BY KEY COUNTRY, 2015–2022 (USD BILLION)
  • FIGURE 29 NUMBER OF PATENTS GRANTED IN LAST 10 YEARS, 2013–2023
  • FIGURE 30 TOP 10 APPLICANTS IN MARKET, 2013–2023
  • FIGURE 31 REGIONAL ANALYSIS OF PATENTS GRANTED FOR MARKET, 2013–2023
  • FIGURE 32 MARKET: TECHNOLOGY ANALYSIS
  • FIGURE 33 AVERAGE SELLING PRICE TREND OF KEY PLAYERS: TOP THREE TECHNOLOGIES
  • FIGURE 34 PREDICTIVE MAINTENANCE MARKET: INVESTMENT LANDSCAPE
  • FIGURE 35 PORTER’S FIVE FORCES’ ANALYSIS: MARKET
  • FIGURE 36 TRENDS/DISRUPTIONS IMPACTING CUSTOMERS’ BUSINESSES
  • FIGURE 37 INFLUENCE OF STAKEHOLDERS ON BUYING PROCESS FOR TOP THREE VERTICALS
  • FIGURE 38 KEY BUYING CRITERIA FOR TOP THREE VERTICALS
  • FIGURE 39 SERVICES SEGMENT TO GROW AT HIGHEST CAGR DURING FORECAST PERIOD
  • FIGURE 40 STANDALONE SEGMENT TO GROW AT HIGHER CAGR DURING FORECAST PERIOD
  • FIGURE 41 CLOUD SEGMENT TO GROW AT HIGHER CAGR DURING FORECAST PERIOD
  • FIGURE 42 HYBRID CLOUD TO GROW AT HIGHEST CAGR DURING FORECAST PERIOD
  • FIGURE 43 MANAGED SERVICES SEGMENT TO GROW AT HIGHER CAGR DURING FORECAST PERIOD
  • FIGURE 44 SUPPORT & MAINTENANCE SEGMENT TO GROW AT HIGHEST CAGR DURING FORECAST PERIOD
  • FIGURE 45 ARTIFICIAL INTELLIGENCE SEGMENT TO GROW AT HIGHEST CAGR DURING FORECAST PERIOD
  • FIGURE 46 MOTOR CIRCUIT ANALYSIS SEGMENT TO GROW AT HIGHEST CAGR DURING FORECAST PERIOD
  • FIGURE 47 SMES SEGMENT TO GROW AT HIGHER CAGR DURING FORECAST PERIOD
  • FIGURE 48 ENERGY & UTILITIES TO HOLD LARGEST MARKET DURING FORECAST PERIOD
  • FIGURE 49 INDIA TO WITNESS HIGHEST CAGR DURING FORECAST PERIOD
  • FIGURE 50 ASIA PACIFIC TO ACCOUNT FOR HIGHEST CAGR DURING FORECAST PERIOD
  • FIGURE 51 NORTH AMERICA: MARKET SNAPSHOT
  • FIGURE 52 ASIA PACIFIC: MARKET SNAPSHOT
  • FIGURE 53 REVENUE ANALYSIS OF KEY PLAYERS (2019–2023)
  • FIGURE 54 MARKET SHARE ANALYSIS FOR KEY PLAYERS, 2023
  • FIGURE 55 BRAND/PRODUCT COMPARATIVE ANALYSIS
  • FIGURE 56 MARKET: COMPANY EVALUATION MATRIX (KEY PLAYERS), 2023
  • FIGURE 57 MARKET: COMPANY FOOTPRINT (20 COMPANIES)
  • FIGURE 58 PREDICTIVE MAINTENANCE MARKET: COMPANY EVALUATION MATRIX (STARTUPS/SMES), 2023
  • FIGURE 59 COMPANY VALUATION AND FINANCIAL METRICS OF KEY VENDORS
  • FIGURE 60 YEAR-TO-DATE (YTD) PRICE TOTAL RETURN AND 5-YEAR STOCK BETA OF KEY VENDORS
  • FIGURE 61 IBM: COMPANY SNAPSHOT
  • FIGURE 62 ABB: COMPANY SNAPSHOT
  • FIGURE 63 SCHNEIDER ELECTRIC: COMPANY SNAPSHOT
  • FIGURE 64 AWS: COMPANY SNAPSHOT
  • FIGURE 65 GOOGLE: COMPANY SNAPSHOT
  • FIGURE 66 MICROSOFT: COMPANY SNAPSHOT
  • FIGURE 67 HITACHI: COMPANY SNAPSHOT
  • FIGURE 68 SAP: COMPANY SNAPSHOT
  • FIGURE 69 SOFTWARE AG: COMPANY SNAPSHOT
  • FIGURE 70 ALTAIR: COMPANY SNAPSHOT
  • FIGURE 71 ORACLE: COMPANY SNAPSHOT


The research study for the predictive maintenance market involved extensive secondary sources, directories, International Journal of Innovation and Technology Management and paid databases. Primary sources were mainly industry experts from the core and related industries, preferred market providers, third-party service providers, consulting service providers, end users, and other commercial enterprises. In-depth interviews were conducted with various primary respondents, including key industry participants and subject matter experts, to obtain and verify critical qualitative and quantitative information, and assess the market’s prospects.

Secondary Research

The market size of companies offering predictive maintenance hardware, solutions and services was arrived at based on secondary data available through paid and unpaid sources. It was also arrived at by analyzing the product portfolios of major companies and rating the companies based on their performance and quality.

The market size of companies offering predictive maintenance market hardware, solutions and services was arrived at based on secondary data available through paid and unpaid sources. It was also arrived at by analyzing the product portfolios of major companies and rating the companies based on their performance and quality. In the secondary research process, various sources were referred to, for identifying and collecting information for this study. Secondary sources included annual reports, press releases, and investor presentations of companies; white papers, journals, and certified publications; and articles from recognized authors, directories, and databases. The data was also collected from other secondary sources, such as journals, government websites, blogs, and vendors websites. Additionally, predictive maintenance market spending of various countries was extracted from the respective sources. Secondary research was mainly used to obtain key information related to the industry’s value chain and supply chain to identify key players based on hardware, solutions, services, market classification, and segmentation according to offerings of major players, industry trends related to component, technology, technique, organization size, verticals, and regions, and key developments from both market- and technology-oriented perspectives.

Primary Research

In the primary research process, various primary sources from both supply and demand sides were interviewed to obtain qualitative and quantitative information on the market. The primary sources from the supply side included various industry experts, including Chief Experience Officers (CXOs); Vice Presidents (VPs); directors from business development, marketing, and predictive maintenance market expertise; related key executives from predictive maintenance market solution vendors, System Integrators (SIs), professional service providers, and industry associations; and key opinion leaders.

Primary interviews were conducted to gather insights, such as market statistics, revenue data collected from solutions and services, market breakups, market size estimations, market forecasts, and data triangulation. Primary research also helped in understanding various trends related to technologies, applications, deployments, and regions. Stakeholders from the demand side, such as Chief Information Officers (CIOs), Chief Technology Officers (CTOs), Chief Strategy Officers (CSOs), and end users using predictive maintenance market solutions, were interviewed to understand the buyer’s perspective on suppliers, products, service providers, and their current usage of predictive maintenance market hardware, solutions and services, which would impact the overall predictive maintenance market.

The following is the breakup of primary profiles:
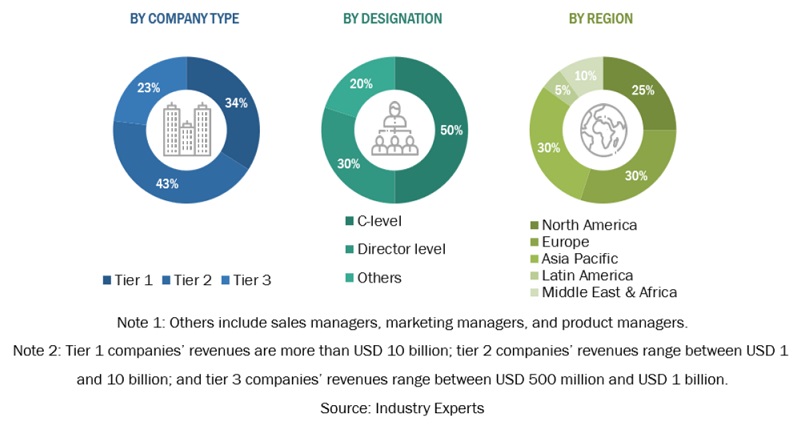
Predictive Maintenance  Market Size, and Share

To know about the assumptions considered for the study, download the pdf brochure

Market Size Estimation

Multiple approaches were adopted for estimating and forecasting the predictive maintenance market. The first approach involves estimating the market size by summation of companies’ revenue generated through the sale of solutions and services.

Market Size Estimation Methodology- Top-down approach

In the top-down approach, an exhaustive list of all the vendors offering hardware, solutions and services in the predictive maintenance market was prepared. The revenue contribution of the market vendors was estimated through annual reports, press releases, funding, investor presentations, paid databases, and primary interviews. Each vendor’s offerings were evaluated based on the breadth of hardware, solutions, solution by deployment mode, and services, technology, technique, organization size, vertical and regions. The aggregate of all the companies’ revenue was extrapolated to reach the overall market size. Each subsegment was studied and analyzed for its global market size and regional penetration. The markets were triangulated through both primary and secondary research. The primary procedure included extensive interviews for key insights from industry leaders, such as CIOs, CEOs, VPs, directors, and marketing executives. The market numbers were further triangulated with the existing MarketsandMarkets repository for validation.

Market Size Estimation Methodology-Bottom-up approach

In the bottom-up approach, the adoption rate of predictive maintenance hardware, solutions and services among different end users in key countries with respect to their regions contributing the most to the market share was identified. For cross-validation, the adoption of predictive maintenance hardware, solutions and services among industries, along with different use cases with respect to their regions, was identified and extrapolated. Weightage was given to use cases identified in different regions for the market size calculation.

Based on the market numbers, the regional split was determined by primary and secondary sources. The procedure included the analysis of the predictive maintenance market’s regional penetration. Based on secondary research, the regional spending on Information and Communications Technology (ICT), socio-economic analysis of each country, strategic vendor analysis of major predictive maintenance hardware, solution, service providers, and organic and inorganic business development activities of regional and global players were estimated. With the data triangulation procedure and data validation through primaries, the exact values of the overall predictive maintenance market size and segments’ size were determined and confirmed using the study.

Top-down and Bottom-up approaches
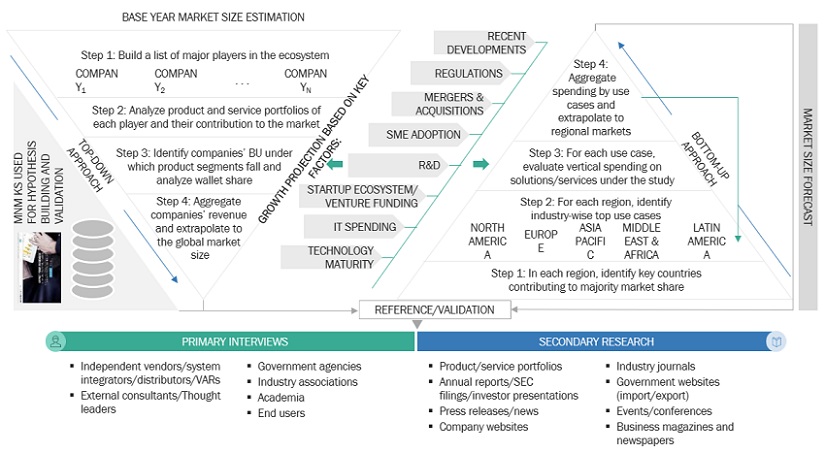
Predictive Maintenance  Market Top Down and Bottom Up Approach

To know about the assumptions considered for the study, Request for Free Sample Report

Data Triangulation

After arriving at the overall market size using the market size estimation processes as explained above, the market was split into several segments and subsegments. To complete the overall market engineering process and arrive at the exact statistics of each market segment and subsegment, data triangulation and market breakup procedures were employed, wherever applicable. The overall market size was then used in the top-down procedure to estimate the size of other individual markets via percentage splits of the market segmentation.

Market Definition

According to TIBCO Spotfire, Predictive maintenance, also referred to as condition-based maintenance, involves performance monitoring and equipment condition monitoring during regular operations to reduce the chances of a breakdown. Manufacturers began using predictive maintenance in the nineties.

According to Splunk, Predictive maintenance is a maintenance strategy that uses machine learning algorithms trained with Industrial Internet of Things (IIoT) data to make predictions about future outcomes, such as determining the likelihood of equipment and machinery breaking down.

Stakeholders

  • Predictive maintenance service providers
  • Predictive maintenance vendors
  • System integrators
  • Value-added resellers
  • IoT platform providers
  • AI solution developers
  • Information Technology (IT) service providers

Report Objectives

  • To describe and forecast the predictive maintenance market, in terms of value,
  • by component, technology, technique, organization size, and vertical
  • To describe and forecast the market, in terms of value,
  • by region—North America, Europe, Asia Pacific, Middle East & Africa and Latin America
  • To provide detailed information regarding major factors influencing the market growth (drivers, restraints, opportunities, and challenges)
  • To strategically analyze micromarkets1 with respect to individual growth trends, prospects, and contribution to the overall market
  • To profile key players and comprehensively analyze their market positions in terms of ranking and core competencies2, along with detailing the competitive landscape for market leaders
  • To analyze competitive developments such as joint ventures, mergers and acquisitions, product developments, and ongoing research and development (R&D) in the predictive maintenance market
  • To provide the illustrative segmentation, analysis, and projection of the main regional markets

Available Customizations

With the given market data, MarketsandMarkets offers customizations as per the company’s specific needs. The following customization options are available for the report:

Product Analysis

  • The product matrix provides a detailed comparison of the product portfolio of each company.

Geographic Analysis as per feasibility

  • Further breakup of the North American predictive maintenance Market
  • Further breakup of the European Market
  • Further breakup of the Asia Pacific Market
  • Further breakup of the Middle East & Africa Market
  • Further breakup of the Latin American Market

Company Information

  • Detailed analysis and profiling of additional market players (up to five)
Custom Market Research Services

We will customize the research for you, in case the report listed above does not meet with your exact requirements. Our custom research will comprehensively cover the business information you require to help you arrive at strategic and profitable business decisions.

Request Customization

Instant Answers with GPT - Ask Now!

Ask real questions. Get complete answers !
Report Code
TC 4154
Published ON
Mar, 2024
Choose License Type
BUY NOW
  • SHARE
X
Request Customization
Speak to Analyst
Speak to Analyst
OR FACE-TO-FACE MEETING
PERSONALIZE THIS RESEARCH
  • Triangulate with your Own Data
  • Get Data as per your Format and Definition
  • Gain a Deeper Dive on a Specific Application, Geography, Customer or Competitor
  • Any level of Personalization
REQUEST A FREE CUSTOMIZATION
LET US HELP YOU!
  • What are the Known and Unknown Adjacencies Impacting the Predictive Maintenance Market
  • What will your New Revenue Sources be?
  • Who will be your Top Customer; what will make them switch?
  • Defend your Market Share or Win Competitors
  • Get a Scorecard for Target Partners
CUSTOMIZED WORKSHOP REQUEST
knowledgestore logo

Want to explore hidden markets that can drive new revenue in Predictive Maintenance Market?

Find Hidden Markets
  • Call Us
  • +1-888-600-6441 (Corporate office hours)
  • +1-888-600-6441 (US/Can toll free)
  • +44-800-368-9399 (UK office hours)
CONNECT WITH US
ABOUT TRUST ONLINE
©2024 MarketsandMarkets Research Private Ltd. All rights reserved
DMCA.com Protection Status
Website Feedback