Operating Room Management Market

Operating Room Management Market Size, Share & Trends by Type (OR Scheduling, Supply, Performance, Anesthesia, Data, Communication, Patient), Workflow (Pre, Intra & Post Operative), Component (Software, Service), End User (Hospital, ASC), & Region - Global Forecast to 2029

Report Code: HIT 2862 Jul, 2024, by marketsandmarkets.com

Operating Room Management Market Size, Share & Trends

The size of global operating room management market in terms of revenue was estimated to be worth $4.2 billion in 2024 and is poised to reach $7.5 billion by 2029, growing at a CAGR of 12.5% from 2024 to 2029. The comprehensive research encompasses an exhaustive examination of industry trends, meticulous pricing analysis, patent scrutiny, insights derived from conferences and webinars, identification of key stakeholders, and a nuanced understanding of market purchasing dynamics.

Growth of the market is mainly driven by increasing emphasis on cost control and efficiency improvement in hospitals, growing adoption of EHRs and other HCIT solutions, and favorable government support and initiatives for healthcare. Moreover, need for interoperability and standardization, growing number of ambulatory surgical centers and rising adoption of operating room management solutions in developing countries are further driving the operating room management market growth.

Operating Room Management Market Trends

Operating Room Management Market

To know about the assumptions considered for the study, Request for Free Sample Report

Operating Room Management Market

Global Operating Room Management Market Dynamics

DRIVER: Increasing emphasis on cost control and efficiency improvement in hospitals

The rising demand for quality health services, increasing geriatric population, and growing incidence of chronic disorders are some of the reasons for accelerated overall cost of healthcare delivery. Additionally, high dependency on outdated and traditional methods including paper-based patient records which results in medical errors and increase in overall administration cost.

With the rise in healthcare costs, there is an increased strain on governments, consumers, and insurance providers. Hospitals are trying to find out ways to provide efficient services in a controlled expense. With the shift towards value-based care, healthcare facilities are focusing on providing cost effective treatment. The utilization of ORM Solutions help healthcare organizations address these issues and enables them to save costs by reducing surgical time and improving the quality of care delivered to patients. As a result, the growing emphasis on cost control and efficiency improvements in hospitals is expected to support the growth of this market in the coming years.

Restraints: High pricing and maintenance costs of ORM software

The cost of various operating room management solutions is considerably high, making it difficult for small and medium-sized healthcare organizations to implement them. One of the major obstacles impeding ORM market expansion is the high cost of maintenance and price of operating room management software. The requirement of continuous upgrades, customization and maintenance of ORM software create a great financial burden on healthcare professionals. Smaller healthcare facilities often have low budgets and may not be able to tolerate such huge expenses on ORM solutions. As integrating such advanced systems in existing hospital IT systems can be difficult for the staff and it may additionally require staff training to ensure seamless integration and improved surgical workflows.

OPPORTUNITY: Technological Advancements in hospitals

The increase in the technological advancements has led to growth opportunities in the operating room management market, as healthcare providers seek scalable and efficient solutions to cope with the growing volumes of medical procedures. Moreover, technological advancements offer healthcare organizations a comprehensive approach to address the complexities of surgical management as well as a centralized repository for storing patient data enabling seamless interoperability avoiding misconceptions and misguidance during the surgical procedures. Moreover, the growing adoption of AI and analytics integration within operating room software presents growing opportunities for enhanced automated analysis, clinical decision support, and predictive analytics. Technological advancement significantly improves surgical efficiencies for advanced and complex surgical procedures. Moreover, integration of ORM software with robotic surgeries can also create huge growth opportunities in the field.

CHALLENGE: Dearth of skilled surgeons in integrated operating rooms

Several countries across the world are witnessing the challenge of limited availability of trained or skilled healthcare professionals in operating rooms. Depending on type of surgery, there is a need for an expert in the same field to effectively handle ORM software so as to conduct efficient and successful surgery with reduced time and errors. Additionally, countries with growing economies are also experiencing limited availability of such skilled experts to handle ORM software. This negatively impacts the operating room management market by lowering the usability of ORM software. Thus, limited availability of well trained and skilled physicians, surgeons, nurses and other healthcare professionals is projected to limit the operating room management market growth in the upcoming years.

Operating room management Market Ecosystem

The operating room management market comprises firms that are responsible for delivering ORM solutions to end users through different deployment models. These vendors navigate regulatory frameworks set by government bodies like the FDA, and Office of the National Coordinator for Health Information Technology (ONC) ensuring compliance with standards and guidelines related to data security, interoperability, and patient privacy. Moreover, government bodies such as the Department of Health and Human Services (HHS) and the National Health Service (NHS) influence market dynamics through policy decisions, funding initiatives, and regulatory oversight. As these ORM solution provider enterprises continues to grow and expand by reducing the cost and improving the workload performance in ORM solutions, the demand continues to significantly bolster. Solution and service providers focus on delivering value added solutions to their customers. Several hospitals across the globe are availing ORM solutions to enhance the workflow of operating rooms and reduce the time taken to perform such activities by their medical staff. Meanwhile, end-users, comprising healthcare providers such as hospitals, ASCs, and specialty clinics, drive demand for ORM solutions to streamline workflow efficiency, improve surgical outcomes, and enhance surgical delivery. This interconnected ecosystem relies on collaboration, innovation, and adherence to regulatory requirements to ensure the seamless integration and effective utilization of ORM solutions within the healthcare landscape.

Operating Room Management Market Ecosystem

Source: Secondary Literature, Interviews with Experts, and MarketsandMarkets Analysis

The global operating room management market is segmented by type, component, delivery mode, workflow, end user, and region

By type, scheduling and workflow management solutions segment accounted for the largest share of the operating room management industry in 2023.

By type, operating room management market is segmented into scheduling and workflow management solutions, data management and communication solutions, anesthesia information management solutions, supply management solutions, performance management solutions and other types of solutions. Scheduling and workflow management solutions accounted for the largest market share in 2023. Operating room scheduling solutions provide clinicians and administrators with all the available information on each planned, ongoing, or completed surgical procedures in operating rooms. These solutions also provide information on the availability of ORs for surgeries and support the decision-making and management of all surgical procedures. They also include features for OR planning and scheduling, material management, pre-admission consultations, and documentation of operating times (pre-, intra-, and post-operative).

The cloud based delivery model is the fastest growing segment in the operating room management industry.

Based on delivery mode, the operating room management market is segmented into on-premises, and cloud/ web-based based model. The cloud-based operating room management market is poised to witness significant growth in the forecast period. These solutions eliminate the need for extensive on-premise infrastructure investments, allowing healthcare providers to scale their storage capacity and computing resources based on demand. In addition, the cloud service providers implement robust security measures, including encryption, access controls, and regular security audits, to safeguard patient information and ensure compliance with industry regulations. In recent years, many healthcare organizations have shifted from on-premise models to cloud-based models for core applications. The minimal requirement of hardware and software for using web- and cloud-based solutions helps cut down upfront installation costs, which is a major factor increasing the adoption of ORM solutions.

Ambulatory surgical centers are expected to be the fastest growing end users in the Operating room management industry in 2023.

Based on end-users, the operating room management market is segmented into hospitals, ambulatory surgical centers, ambulatory surgical centers, specialty clinics and other end-users. The ambulatory surgical centers are projected to be the fastest growing end-user segment of the operating room management market as ambulatory surgical centers (ASCs) carry out procedures for cases where post-surgery overnight stays are not mandatory. In the recent years there has been an increase in the number of surgical procedures performed in ambulatory surgical centers. Further, the total procedure costs associated with ambulatory surgical centers are lesser than that of in hospitals. Hence the cost effectiveness of surgical procedures in ASCs is one the reasons for the highest growth of ASCs.

North America accounts the largest share of operating room management industry in 2023.

Based on the region, the operating room management market is segmented into North America, Europe, Asia Pacific, Latin America, and Middle East and Africa. In 2023 North America accounted for the largest share of the operating room management market due to its strong emphasis on digital transformation and interoperability, highly developed healthcare infrastructure, robust ecosystem of ORM vendors, and growing demand for surgical procedures. In addition, the growth of this market is primarily driven by significant growth in hospital expenditure, initiatives undertaken by the US Federal Government towards improving patient care and patient safety, high adoption of healthcare IT technologies, the need to reduce healthcare costs, and the growing need for the optimization of healthcare infrastructure and the large number of surgeries conducted in this region.

Operating Room Management Market by Region

To know about the assumptions considered for the study, download the pdf brochure

Prominent players operating in operating room management market are Oracle (Cerner Corporation) (US), Epic Systems Corporation (US), Medical Information Technology (Meditech) (US), GE Healthcare(US), Surgical Information Systems (US), Becton, Dickinson And Company (US), Eclinicalworks (US), Picis Clinical Solutions Inc (US), Brainlab AG (Germany), Getinge AB (Sweden), Veradigm (Allscripts Healthcare, Llc) (US), Steris Corporation (US), Medovate Technologies, Inc. (US),  Cardinal Health (US), Barco Electronic Systems Pvt Ltd (Belgium), Richard Wolf GmbH (Germany), Karl Storz (Germany), Caresyntax (US), Medicad (Switzerland), United Health Group (US), Qventus (US), Alert Life Sciences Computing S.A. (Europe), Tedisel Medical (Spain), Censis Technologies (US), and Owens & Minor (US).

Scope of the Operating Room Management Industry

Report Metric

Details

Market Revenue in 2024

$4.2 billion

Projected Revenue by 2029

$7.5 billion

Revenue Rate

Poised to Grow at a CAGR of 12.5%

Market Driver

Increasing emphasis on cost control and efficiency improvement in hospitals

Market Opportunity

Technological Advancements in hospitals

The study categorizes the operating room management market to forecast revenue and analyze trends in each of the following submarkets:

By Type
  • Scheduling & Workflow Management Solutions
  • Data Management and Communication Solutions
  • Supply Management Solutions
  • Anesthesia Information Management Solutions
  • Performance Management Solutions
  • Other Types
By Component
  • Software
    • Standalone Software
    • Integrated Software
  • Services
    • Implementation Services
    • Maintenance & Support Services
    • Other Services
By Delivery Mode
  • On-Premise Model
  • Cloud-based/ Web-based Model
By Workflow
  • Preoperative
  • Intraoperative
  • Postoperative
By End User
  • Hospitals
  • Ambulatory Surgical Centers
  • Specialty Clinics
  • Other End Users
By Region
  • North America
    • US
    • Canada
  • Europe
    • Germany
    • UK
    • France
    • Italy
    • Spain
    • RoE
  • Asia Pacific
    • Japan
    • China
    • India
    • RoAPAC
  • Latin America
    • Brazil
    • Mexico
    • Rest of Latin America
  • Middle East and Africa
    • GCC Countries
    • Rest of Middle East and Africa

Recent Developments of Operating Room Management Industry:

  • In February 2024, Veradigm acquired ScienceIO to leverage their AI for better data analysis, enhance customer experience across healthcare sectors, and solidify their position in healthcare data intelligence, ultimately aiming to improve patient outcomes.
  • In April 2023, Medical Information Technology signed agreement with Canada Health Infoway. With the help of this PrescribeIT agreement, Canadian prescribers can electronically send a prescription to the patient's preferred pharmacy straight from the Expanse EHR.
  • In December 2022, Epic Systems Corporation launched the Connection Hub that simplifies interoperability for third-party applications. This platform empowers vendors to showcase their Epic-compatible solutions and self-report successful data exchange capabilities.  Epic customers can leverage the Hub to discover and evaluate relevant applications, fostering a more robust and integrated healthcare ecosystem.

Frequently Asked Questions (FAQ):

To speak to our analyst for a discussion on the above findings, click Speak to Analyst

TABLE OF CONTENTS
 
1 INTRODUCTION
2 RESEARCH METHODOLOGY
3 EXECUTIVE SUMMARY
 
4 PREMIUM INSIGHTS (Page No. - 54)
    4.1 OPERATING ROOM MANAGEMENT MARKET OVERVIEW 
    4.2 NORTH AMERICA: OPERATING ROOM MANAGEMENT MARKET,  BY COMPONENT & COUNTRY (2023) 
    4.3 OPERATING ROOM MANAGEMENT MARKET: REGIONAL MIX 
    4.4 OPERATING ROOM MANAGEMENT MARKET: GEOGRAPHIC SNAPSHOT 
    4.5 OPERATING ROOM MANAGEMENT MARKET: DEVELOPED MARKETS VS. EMERGING ECONOMIES 
 
5 MARKET OVERVIEW (Page No. - 58)
    5.1 INTRODUCTION 
    5.2 MARKET DYNAMICS 
           5.2.1 DRIVERS
                    5.2.1.1 Increasing emphasis on cost control and efficiency improvement in hospitals
                    5.2.1.2 Growing adoption of EHRs and other HCIT solutions
                    5.2.1.3 Favorable government support and initiatives for healthcare
                    5.2.1.4 Redevelopment projects and availability of funding to promote OR infrastructure
           5.2.2 RESTRAINTS
                    5.2.2.1 High pricing and maintenance costs of ORM software
                    5.2.2.2 Interoperability issues
           5.2.3 OPPORTUNITIES
                    5.2.3.1 Emerging markets and growing medical tourism
                    5.2.3.2 Technological advancements in hospitals
           5.2.4 CHALLENGES
                    5.2.4.1 Dearth of skilled surgeons in integrated operating rooms
                    5.2.4.2 Consolidation of healthcare providers
    5.3 INDUSTRY TRENDS 
           5.3.1 TECHNOLOGY INTEGRATION
           5.3.2 AI-POWERED PREDICTIVE ANALYTICS
           5.3.3 INTEGRATION WITH EHRS
           5.3.4 DEMAND FOR SOFTWARE IMPLEMENTATION SERVICES
           5.3.5 SCHEDULING AND WORKFLOW OPTIMIZATION
    5.4 TRENDS/DISRUPTIONS IMPACTING CUSTOMERS’ BUSINESSES 
    5.5 VALUE CHAIN ANALYSIS 
    5.6 ECOSYSTEM ANALYSIS 
    5.7 TECHNOLOGY ANALYSIS 
           5.7.1 KEY TECHNOLOGIES
                    5.7.1.1 Robotic surgery systems
                    5.7.1.2 AI and ML
                    5.7.1.3 AR and VR
                    5.7.1.4 Real-time monitoring and data integration
           5.7.2 COMPLEMENTARY TECHNOLOGIES
                    5.7.2.1 Enhanced sterilization techniques
                    5.7.2.2 Telemedicine and remote collaboration
                    5.7.2.3 Automated workflow solutions
           5.7.3 ADJACENT TECHNOLOGIES
                    5.7.3.1 Advanced imaging technologies
                    5.7.3.2 Patient engagement platforms
                    5.7.3.3 EHR enhancements
                    5.7.3.4 Data analytics and business intelligence tools
    5.8 PORTER’S FIVE FORCES ANALYSIS 
           5.8.1 INTENSITY OF COMPETITIVE RIVALRY
           5.8.2 BARGAINING POWER OF SUPPLIERS
           5.8.3 BARGAINING POWER OF BUYERS
           5.8.4 THREAT OF SUBSTITUTES
           5.8.5 THREAT OF NEW ENTRANTS
    5.9 KEY STAKEHOLDERS & BUYING CRITERIA 
           5.9.1 KEY STAKEHOLDERS IN BUYING PROCESS
           5.9.2 BUYING CRITERIA
    5.10 PRICING ANALYSIS 
           5.10.1 AVERAGE SELLING PRICE TREND, BY REGION
                    5.10.1.1 North America
                    5.10.1.2 Europe
                    5.10.1.3 Asia Pacific
                    5.10.1.4 Latin America
                    5.10.1.5 Middle East & Africa
           5.10.2 INDICATIVE PRICING ANALYSIS
    5.11 REGULATORY LANDSCAPE 
           5.11.1 REGULATORY SCENARIO
                    5.11.1.1 North America
                               5.11.1.1.1 US
                               5.11.1.1.2 Canada
                    5.11.1.2 Europe
                    5.11.1.3 Asia Pacific
                               5.11.1.3.1 China
                               5.11.1.3.2 Japan
                               5.11.1.3.3 India
                    5.11.1.4 Middle East & Africa
                    5.11.1.5 Latin America
           5.11.2 REGULATORY BODIES, GOVERNMENT AGENCIES, AND OTHER ORGANIZATIONS
    5.12 KEY CONFERENCES & EVENTS IN 2024–2025 
    5.13 CASE STUDY ANALYSIS 
           5.13.1 STANDARDIZING HEALTHCARE DELIVERY WITH MEDITECH EXPANSE
                    5.13.1.1 Case study 1: Need to standardize healthcare delivery processes across varied hospital sizes and specialties
           5.13.2 ENHANCING URGENT CARE OPERATIONS WITH ECLINICALWORKS
                    5.13.2.1 Case study 2: Rising need to streamline patient care processes and improve operational efficiency
           5.13.3 ST. JUDE MEDICAL CENTER INCREASES OR EFFICIENCY WITH PICIS CLINICAL SOLUTIONS
                    5.13.3.1 Case study 3: Need to improve operating room efficiency
    5.14 PATENT ANALYSIS 
           5.14.1 PATENT PUBLICATION TRENDS FOR OPERATING ROOM MANAGEMENT
           5.14.2 INSIGHTS: JURISDICTION AND TOP APPLICANT ANALYSIS
    5.15 END-USER ANALYSIS 
           5.15.1 UNMET NEEDS
           5.15.2 END-USER EXPECTATIONS
    5.16 INVESTMENT & FUNDING SCENARIO 
    5.17 REVENUE MODEL ANALYSIS 
    5.18 IMPACT OF GENERATIVE AI ON OPERATING ROOM MANAGEMENT MARKET 
           5.18.1 TOP USE CASES & MARKET POTENTIAL
                    5.18.1.1 Key use cases
           5.18.2 CASE STUDIES OF GENERATIVE AI IMPLEMENTATION
                    5.18.2.1 Case study 1: Mount Sinai Health System uses AI for untapped surgical data
                    5.18.2.2 Case study 2: Use of AI in Torin OR Management Software
                    5.18.2.3 Case study 3: Northwell Health's integration of generative AI
                               5.18.2.3.1 Operating Room Integration market
                               5.18.2.3.2 Electronic Health Records (EHR) Market
                               5.18.2.3.3 Hospital EMR Systems Market
                               5.18.2.3.4 Clinical Workflow Solutions Market
                               5.18.2.3.5 Clinical Decision Support Systems (CDSS) Market
           5.18.3 USER READINESS AND IMPACT ASSESSMENT
                    5.18.3.1 User readiness
                               5.18.3.1.1 Large-sized healthcare facilities
                               5.18.3.1.2 Medium-sized healthcare facilities
                               5.18.3.1.3 Small-sized healthcare facilities
                    5.18.3.2 Impact assessment
                               5.18.3.2.1 User A: Hospitals
                                             5.18.3.2.1.1 Implementation
                                             5.18.3.2.1.2 Impact
                               5.18.3.2.2 User B: Ambulatory surgical centers (ASCs)
                                             5.18.3.2.2.1 Implementation
                                             5.18.3.2.2.2 Impact
 
6 OPERATING ROOM MANAGEMENT MARKET, BY TYPE (Page No. - 99)
    6.1 INTRODUCTION 
    6.2 SCHEDULING & WORKFLOW MANAGEMENT 
           6.2.1 SCHEDULING & WORKFLOW MANAGEMENT TO HOLD LARGEST MARKET SHARE
    6.3 DATA MANAGEMENT & COMMUNICATION 
           6.3.1 EASY DATA ACCESS AND STREAMLINED DATA GENERATION & COLLECTION TO DRIVE ADOPTION
    6.4 ANESTHESIA INFORMATION MANAGEMENT 
           6.4.1 INCREASING ADOPTION FOR CLINICAL DECISION-MAKING TO SUPPORT MARKET GROWTH
    6.5 SUPPLY MANAGEMENT SOLUTIONS 
           6.5.1 FOCUS ON REDUCING HIGH EXPENDITURE INCURRED ON OR SUPPLIES TO SUPPORT ADOPTION
    6.6 PERFORMANCE MANAGEMENT SOLUTIONS 
           6.6.1 EFFICIENCY AND PRODUCTIVITY BENEFITS TO DRIVE MARKET
    6.7 OTHER SOLUTIONS 
 
7 OPERATING ROOM MANAGEMENT MARKET, BY COMPONENT (Page No. - 108)
    7.1 INTRODUCTION 
    7.2 SOFTWARE 
           7.2.1 STANDALONE SOFTWARE
                    7.2.1.1 Cost-efficiency benefits to drive demand for standalone software
           7.2.2 INTEGRATED SOFTWARE
                    7.2.2.1 Rising preference for integrated solutions to drive market
    7.3 SERVICES 
           7.3.1 IMPLEMENTATION SERVICES
                    7.3.1.1 Rising adoption of complex integrated OR solutions to propel demand for implementation services
           7.3.2 MAINTENANCE & SUPPORT SERVICES
                    7.3.2.1 Growing need for technical assistance in ORM to accelerate market growth
           7.3.3 OTHER SERVICES
 
8 OPERATING ROOM MANAGEMENT MARKET, BY DELIVERY MODE (Page No. - 119)
    8.1 INTRODUCTION 
    8.2 ON-PREMISES 
           8.2.1 ENHANCED CONTROL AND COST BENEFITS TO SUPPORT MARKET GROWTH
    8.3 CLOUD/WEB-BASED 
           8.3.1 RISING PREFERENCE FOR CLOUD-BASED SOLUTIONS TO DRIVE MARKET
 
9 OPERATING ROOM MANAGEMENT MARKET, BY WORKFLOW (Page No. - 124)
    9.1 INTRODUCTION 
    9.2 PREOPERATIVE 
           9.2.1 RISING DEMAND FOR INTEGRATED SOLUTIONS IN PREOPERATIVE APPLICATIONS TO DRIVE MARKET
    9.3 INTRAOPERATIVE 
           9.3.1 SHIFT TOWARD DIGITAL TRANSFORMATION TO PROPEL MARKET GROWTH
    9.4 POSTOPERATIVE 
           9.4.1 INCREASING INTEGRATION OF ADVANCED TECHNOLOGIES TO SUPPORT DEMAND FOR POSTOPERATIVE MANAGEMENT
 
10 OPERATING ROOM MANAGEMENT MARKET, BY END USER (Page No. - 129)
     10.1 INTRODUCTION 
     10.2 HOSPITALS 
             10.2.1 HOSPITALS TO DOMINATE END-USER MARKET
     10.3 AMBULATORY SURGERY CENTERS 
             10.3.1 COST-EFFECTIVENESS OF AMBULATORY CARE TO DRIVE PATIENT PREFERENCE AND MARKET GROWTH
     10.4 SPECIALTY CLINICS 
             10.4.1 ADVANCEMENTS IN DIGITAL HEALTH TO DRIVE MARKET
 
11 OPERATING ROOM MANAGEMENT MARKET, BY REGION (Page No. - 134)
     11.1 INTRODUCTION 
     11.2 NORTH AMERICA 
             11.2.1 US
                        11.2.1.1 US to dominate North American operating room management market
             11.2.2 CANADA
                        11.2.2.1 Adoption of advanced HCIT solutions and need for streamlined healthcare workflow processes to drive market
     11.3 EUROPE 
             11.3.1 GERMANY
                        11.3.1.1 Rising healthcare expenditure and increasing need for long-term care to support market growth
             11.3.2 UK
                        11.3.2.1 High patient volume and favorable government initiatives to boost market growth
             11.3.3 FRANCE
                        11.3.3.1 Favorable health insurance system and high reimbursement rates to drive adoption of operating room management solutions
             11.3.4 ITALY
                        11.3.4.1 High demand for surgical treatments and medical technology development to fuel market growth
             11.3.5 SPAIN
                        11.3.5.1 Development of national healthcare system to drive market
             11.3.6 REST OF EUROPE
     11.4 ASIA PACIFIC 
             11.4.1 JAPAN
                        11.4.1.1 Increasing adoption of HCIT solutions and growing healthcare expenditure to boost market growth
             11.4.2 CHINA
                        11.4.2.1 Large patient population and improved healthcare infrastructure to fuel market growth
             11.4.3 INDIA
                        11.4.3.1 Rising adoption of connected healthcare systems and increasing medical tourism to propel market growth
             11.4.4 REST OF ASIA PACIFIC
     11.5 LATIN AMERICA 
             11.5.1 BRAZIL
                        11.5.1.1 Developments in healthcare infrastructure and need for streamlined surgical workflows to aid market growth
             11.5.2 MEXICO
                        11.5.2.1 Rising government expenditure for healthcare digitization to support market growth
             11.5.3 REST OF LATIN AMERICA
     11.6 MIDDLE EAST & AFRICA 
             11.6.1 GCC COUNTRIES
                        11.6.1.1 High per capita health expenditure and increased medical inflation to augment market growth
             11.6.2 REST OF MIDDLE EAST & AFRICA
 
12 COMPETITIVE LANDSCAPE (Page No. - 206)
     12.1 OVERVIEW 
     12.2 STRATEGIES ADOPTED BY KEY PLAYERS/RIGHT TO WIN 
     12.3 REVENUE SHARE ANALYSIS 
     12.4 MARKET SHARE ANALYSIS 
     12.5 BRAND/SOFTWARE COMPARATIVE ANALYSIS 
     12.6 COMPANY EVALUATION AND FINANCIAL METRICS 
     12.7 COMPANY EVALUATION MATRIX: KEY PLAYERS, 2023 
             12.7.1 STARS
             12.7.2 EMERGING LEADERS
             12.7.3 PERVASIVE PLAYERS
             12.7.4 PARTICIPANTS
             12.7.5 COMPANY FOOTPRINT: KEY PLAYERS, 2023
                        12.7.5.1 Company footprint
                        12.7.5.2 Type footprint
                        12.7.5.3 Software footprint
                        12.7.5.4 Service footprint
                        12.7.5.5 Delivery mode footprint
                        12.7.5.6 Region footprint
     12.8 COMPANY EVALUATION MATRIX: STARTUPS/SMES, 2023 
             12.8.1 PROGRESSIVE COMPANIES
             12.8.2 RESPONSIVE COMPANIES
             12.8.3 DYNAMIC COMPANIES
             12.8.4 STARTING BLOCKS
             12.8.5 COMPETITIVE BENCHMARKING
     12.9 COMPETITIVE SCENARIO 
             12.9.1 PRODUCT APPROVALS & ENHANCEMENTS
             12.9.2 DEALS
             12.9.3 OTHER DEVELOPMENTS
 
13 COMPANY PROFILES (Page No. - 226)
     13.1 KEY PLAYERS 
             13.1.1 ORACLE
                        13.1.1.1 Business overview
                        13.1.1.2 Products offered
                        13.1.1.3 Recent developments
                                     13.1.1.3.1 Deals
                        13.1.1.4 MnM view
                                     13.1.1.4.1 Right to win
                                     13.1.1.4.2 Strategic choices
                                     13.1.1.4.3 Weaknesses and competitive threats
             13.1.2 GETINGE AB
                        13.1.2.1 Business overview
                        13.1.2.2 Products offered
                        13.1.2.3 Recent developments
                                     13.1.2.3.1 Product launches/approvals/enhancements
                                     13.1.2.3.2 Deals
                                     13.1.2.3.3 Expansions
                        13.1.2.4 MnM view
                                     13.1.2.4.1 Right to win
                                     13.1.2.4.2 Strategic choices
                                     13.1.2.4.3 Weaknesses and competitive threats
             13.1.3 GE HEALTHCARE
                        13.1.3.1 Business overview
                        13.1.3.2 Products offered
                        13.1.3.3 Recent developments
                                     13.1.3.3.1 Product launches/approvals/enhancements
                                     13.1.3.3.2 Deals
                                     13.1.3.3.3 Expansions
                        13.1.3.4 MnM view
                                     13.1.3.4.1 Right to win
                                     13.1.3.4.2 Strategic choices
                                     13.1.3.4.3 Weaknesses and competitive threats
             13.1.4 MEDICAL INFORMATION TECHNOLOGY, INC.
                        13.1.4.1 Business overview
                        13.1.4.2 Products offered
                        13.1.4.3 Recent developments
                                     13.1.4.3.1 Deals
                        13.1.4.4 MnM view
                                     13.1.4.4.1 Right to win
                                     13.1.4.4.2 Strategic choices
                                     13.1.4.4.3 Weaknesses and competitive threats
             13.1.5 EPIC SYSTEMS CORPORATION
                        13.1.5.1 Business overview
                        13.1.5.2 Products offered
                        13.1.5.3 Recent developments
                                     13.1.5.3.1 Deals
                        13.1.5.4 MnM view
                                     13.1.5.4.1 Right to win
                                     13.1.5.4.2 Strategic choices
                                     13.1.5.4.3 Weaknesses and competitive threats
             13.1.6 SURGICAL INFORMATION SYSTEMS
                        13.1.6.1 BUSINESS Overview
                        13.1.6.2 Products offered
                        13.1.6.3 Recent developments
                                     13.1.6.3.1 Expansions
                                     13.1.6.3.2 Other developments
             13.1.7 PICIS CLINICAL SOLUTIONS, INC.
                        13.1.7.1 Business overview
                        13.1.7.2 Products offered
                        13.1.7.3 Recent developments
                                     13.1.7.3.1 Deals
             13.1.8 VERADIGM LLC
                        13.1.8.1 Business overview
                        13.1.8.2 Products offered
                        13.1.8.3 Recent developments
                                     13.1.8.3.1 Deals
             13.1.9 BECTON, DICKINSON AND COMPANY
                        13.1.9.1 Business overview
                        13.1.9.2 Products offered
                        13.1.9.3 Recent developments
                                     13.1.9.3.1 Deals
             13.1.10 STERIS CORPORATION
                        13.1.10.1 Business overview
                        13.1.10.2 Products offered
             13.1.11 UNITEDHEALTH GROUP
                        13.1.11.1 Business overview
                        13.1.11.2 Products offered
                        13.1.11.3 Recent developments
                                     13.1.11.3.1 Deals
             13.1.12 BRAINLAB AG
                        13.1.12.1 Business overview
                        13.1.12.2 Products offered
                        13.1.12.3 Recent developments
                                     13.1.12.3.1 Deals
             13.1.13 RICHARD WOLF GMBH
                        13.1.13.1 Business overview
                        13.1.13.2 Products offered
                        13.1.13.3 Recent developments
                                     13.1.13.3.1 Deals
                                     13.1.13.3.2 Expansions
             13.1.14 KARL STORZ SE & CO. KG
                        13.1.14.1 Business overview
                        13.1.14.2 Products offered
                        13.1.14.3 Recent developments
                                     13.1.14.3.1 Product launches/approvals/enhancements
                                     13.1.14.3.2 Deals
             13.1.15 CENSIS TECHNOLOGIES INC.
                        13.1.15.1 Business overview
                        13.1.15.2 Products offered
             13.1.16 BARCO
                        13.1.16.1 Business overview
                        13.1.16.2 Products offered
                        13.1.16.3 Recent developments
                                     13.1.16.3.1 Deals
             13.1.17 CARDINAL HEALTH
                        13.1.17.1 Business overview
                        13.1.17.2 Products offered
                        13.1.17.3 Recent developments
                                     13.1.17.3.1 Deals
     13.2 OTHER PLAYERS 
             13.2.1 ECLINICALWORKS
             13.2.2 CASECTRL
             13.2.3 CARESYNTAX
             13.2.4 MEDICAD
             13.2.5 QVENTUS
             13.2.6 ALERT LIFE SCIENCES COMPUTING, S.A
             13.2.7 TEDISEL MEDICAL
             13.2.8 OWENS & MINOR
 
14 APPENDIX (Page No. - 279)
     14.1 KNOWLEDGESTORE: MARKETSANDMARKETS’ SUBSCRIPTION PORTAL 
     14.2 CUSTOMIZATION OPTIONS 
     14.3 RELATED REPORTS 
     14.4 AUTHOR DETAILS 
 
 
LIST OF TABLES (283 TABLES)
 
TABLE 1 FACTOR ANALYSIS
TABLE 2 RISK ASSESSMENT ANALYSIS
TABLE 3 OPERATING ROOM MANAGEMENT MARKET: ECOSYSTEM ANALYSIS
TABLE 4 OPERATING ROOM MANAGEMENT MARKET: PORTER’S FIVE FORCES ANALYSIS
TABLE 5 INFLUENCE OF STAKEHOLDERS ON BUYING PROCESS (%) FOR TOP 3 END USERS
TABLE 6 KEY BUYING CRITERIA FOR TOP 3 END USERS
TABLE 7 NORTH AMERICA: REGULATORY BODIES, GOVERNMENT AGENCIES,  AND OTHER ORGANIZATIONS
TABLE 8 EUROPE: REGULATORY BODIES, GOVERNMENT AGENCIES,  AND OTHER ORGANIZATIONS
TABLE 9 ASIA PACIFIC: REGULATORY BODIES, GOVERNMENT AGENCIES,  AND OTHER ORGANIZATIONS
TABLE 10 LATIN AMERICA: REGULATORY BODIES, GOVERNMENT AGENCIES,  AND OTHER ORGANIZATIONS
TABLE 11 MIDDLE EAST & AFRICA: REGULATORY BODIES, GOVERNMENT AGENCIES,  AND OTHER ORGANIZATIONS
TABLE 12 OPERATING ROOM MANAGEMENT MARKET: DETAILED LIST OF  CONFERENCES & EVENTS
TABLE 13 OPERATING ROOM MANAGEMENT SYSTEMS MARKET: LIST OF MAJOR PATENTS
TABLE 14 UNMET NEEDS IN OPERATING ROOM MANAGEMENT MARKET
TABLE 15 END-USER EXPECTATIONS IN OPERATING ROOM MANAGEMENT MARKET
TABLE 16 OPERATING ROOM MANAGEMENT MARKET, BY TYPE, 2022–2029 (USD MILLION)
TABLE 17 SCHEDULING & WORKFLOW MANAGEMENT SOLUTIONS MARKET, BY COUNTRY, 2022–2029 (USD MILLION)
TABLE 18 DATA MANAGEMENT & COMMUNICATION SOLUTIONS MARKET, BY COUNTRY, 2022–2029
TABLE 19 ANESTHESIA INFORMATION MANAGEMENT SOLUTIONS MARKET, BY COUNTRY, 2022–2029 (USD MILLION)
TABLE 20 SUPPLY MANAGEMENT SOLUTIONS MARKET, BY COUNTRY,  2022–2029 (USD MILLION)
TABLE 21 PERFORMANCE MANAGEMENT SOLUTIONS MARKET, BY COUNTRY,  2022–2029 (USD MILLION)
TABLE 22 OTHER OPERATING ROOM MANAGEMENT SOLUTIONS MARKET, BY COUNTRY, 2022–2029 (USD MILLION)
TABLE 23 OPERATING ROOM MANAGEMENT MARKET, BY COMPONENT,  2022–2029 (USD MILLION)
TABLE 24 OPERATING ROOM MANAGEMENT MARKET, BY COUNTRY,  2022–2029 (USD MILLION)
TABLE 25 OPERATING ROOM MANAGEMENT SOFTWARE SOLUTIONS OFFERED  BY KEY MARKET PLAYERS
TABLE 26 OPERATING ROOM MANAGEMENT SOFTWARE MARKET, BY TYPE,  2022–2029 (USD MILLION)
TABLE 27 OPERATING ROOM MANAGEMENT SOFTWARE MARKET, BY COUNTRY,  2022–2029 (USD MILLION)
TABLE 28 STANDALONE SOFTWARE MARKET, BY COUNTRY, 2022–2029 (USD MILLION)
TABLE 29 INTEGRATED SOFTWARE MARKET, BY COUNTRY, 2022–2029 (USD MILLION)
TABLE 30 OPERATING ROOM MANAGEMENT SERVICES MARKET, BY TYPE,  2022–2029 (USD MILLION)
TABLE 31 OPERATING ROOM MANAGEMENT SERVICES MARKET, BY COUNTRY,  2022–2029 (USD MILLION)
TABLE 32 IMPLEMENTATION SERVICES MARKET, BY COUNTRY, 2022–2029 (USD MILLION)
TABLE 33 MAINTENANCE & SUPPORT SERVICES MARKET, BY COUNTRY,  2022–2029 (USD MILLION)
TABLE 34 OTHER OPERATING ROOM MANAGEMENT SERVICES MARKET, BY COUNTRY, 2022–2029 (USD MILLION)
TABLE 35 OPERATING ROOM MANAGEMENT MARKET, BY DELIVERY MODE,  2022–2029 (USD MILLION)
TABLE 36 ON-PREMISES DELIVERY: PROS AND CONS
TABLE 37 ON-PREMISES OPERATING ROOM MANAGEMENT SOLUTIONS MARKET,  BY COUNTRY, 2022–2029 (USD MILLION)
TABLE 38 CLOUD-BASED DELIVERY MODE: PROS AND CONS
TABLE 39 CLOUD/WEB-BASED OPERATING ROOM MANAGEMENT SOLUTIONS MARKET,  BY COUNTRY, 2022–2029 (USD MILLION)
TABLE 40 OPERATING ROOM MANAGEMENT: IMPACT ACROSS WORKFLOWS
TABLE 41 OPERATING ROOM MANAGEMENT MARKET, BY WORKFLOW,  2022–2029 (USD MILLION)
TABLE 42 PREOPERATIVE MANAGEMENT SOLUTIONS MARKET, BY COUNTRY,  2022–2029 (USD MILLION)
TABLE 43 INTRAOPERATIVE MANAGEMENT SOLUTIONS MARKET, BY COUNTRY,  2022–2029 (USD MILLION)
TABLE 44 POSTOPERATIVE MANAGEMENT SOLUTIONS MARKET, BY COUNTRY,  2022–2029 (USD MILLION)
TABLE 45 OPERATING ROOM MANAGEMENT MARKET, BY END USER,  2022–2029 (USD MILLION)
TABLE 46 OPERATING ROOM MANAGEMENT MARKET FOR HOSPITALS, BY COUNTRY,  2022–2029 (USD MILLION)
TABLE 47 OPERATING ROOM MANAGEMENT MARKET FOR AMBULATORY SURGICAL CENTERS, BY COUNTRY, 2022–2029 (USD MILLION)
TABLE 48 OPERATING ROOM MANAGEMENT MARKET FOR SPECIALTY CLINICS, BY COUNTRY, 2022–2029 (USD MILLION)
TABLE 49 OPERATING ROOM MANAGEMENT MARKET, BY REGION,  2022–2029 (USD MILLION)
TABLE 50 NORTH AMERICA: OPERATING ROOM MANAGEMENT MARKET, BY COUNTRY, 2022–2029 (USD MILLION)
TABLE 51 NORTH AMERICA: OPERATING ROOM MANAGEMENT MARKET, BY TYPE,  2022–2029 (USD MILLION)
TABLE 52 NORTH AMERICA: OPERATING ROOM MANAGEMENT MARKET, BY COMPONENT, 2022–2029 (USD MILLION)
TABLE 53 NORTH AMERICA: OPERATING ROOM MANAGEMENT SOFTWARE MARKET, BY TYPE, 2022–2029 (USD MILLION)
TABLE 54 NORTH AMERICA: OPERATING ROOM MANAGEMENT SERVICES MARKET, BY TYPE, 2022–2029 (USD MILLION)
TABLE 55 NORTH AMERICA: OPERATING ROOM MANAGEMENT MARKET, BY DELIVERY MODE, 2022–2029 (USD MILLION)
TABLE 56 NORTH AMERICA: OPERATING ROOM MANAGEMENT MARKET, BY WORKFLOW, 2022–2029 (USD MILLION)
TABLE 57 NORTH AMERICA: OPERATING ROOM MANAGEMENT MARKET, BY END USER, 2022–2029 (USD MILLION)
TABLE 58 US: OPERATING ROOM MANAGEMENT MARKET, BY TYPE,  2022–2029 (USD MILLION)
TABLE 59 US: OPERATING ROOM MANAGEMENT MARKET, BY COMPONENT,  2022–2029 (USD MILLION)
TABLE 60 US: OPERATING ROOM MANAGEMENT SOFTWARE MARKET, BY TYPE,  2022–2029 (USD MILLION)
TABLE 61 US: OPERATING ROOM MANAGEMENT SERVICES MARKET, BY TYPE,  2022–2029 (USD MILLION)
TABLE 62 US: OPERATING ROOM MANAGEMENT MARKET, BY DELIVERY MODE,  2022–2029 (USD MILLION)
TABLE 63 US: OPERATING ROOM MANAGEMENT MARKET, BY WORKFLOW,  2022–2029 (USD MILLION)
TABLE 64 US: OPERATING ROOM MANAGEMENT MARKET, BY END USER,  2022–2029 (USD MILLION)
TABLE 65 CANADA: OPERATING ROOM MANAGEMENT MARKET, BY TYPE,  2022–2029 (USD MILLION)
TABLE 66 CANADA: OPERATING ROOM MANAGEMENT MARKET, BY COMPONENT,  2022–2029 (USD MILLION)
TABLE 67 CANADA: OPERATING ROOM MANAGEMENT SOFTWARE MARKET, BY TYPE,  2022–2029 (USD MILLION)
TABLE 68 CANADA: OPERATING ROOM MANAGEMENT SERVICES MARKET, BY TYPE,  2022–2029 (USD MILLION)
TABLE 69 CANADA: OPERATING ROOM MANAGEMENT MARKET, BY DELIVERY MODE,  2022–2029 (USD MILLION)
TABLE 70 CANADA: OPERATING ROOM MANAGEMENT MARKET, BY WORKFLOW,  2022–2029 (USD MILLION)
TABLE 71 CANADA: OPERATING ROOM MANAGEMENT MARKET, BY END USER,  2022–2029 (USD MILLION)
TABLE 72 EUROPE: OPERATING ROOM MANAGEMENT MARKET, BY COUNTRY,  2022–2029 (USD MILLION)
TABLE 73 EUROPE: OPERATING ROOM MANAGEMENT MARKET, BY TYPE,  2022–2029 (USD MILLION)
TABLE 74 EUROPE: OPERATING ROOM MANAGEMENT MARKET, BY COMPONENT,  2022–2029 (USD MILLION)
TABLE 75 EUROPE: OPERATING ROOM MANAGEMENT SOFTWARE MARKET, BY TYPE,  2022–2029 (USD MILLION)
TABLE 76 EUROPE: OPERATING ROOM MANAGEMENT SERVICES MARKET, BY TYPE,  2022–2029 (USD MILLION)
TABLE 77 EUROPE: OPERATING ROOM MANAGEMENT MARKET, BY DELIVERY MODE,  2022–2029 (USD MILLION)
TABLE 78 EUROPE: OPERATING ROOM MANAGEMENT MARKET, BY WORKFLOW,  2022–2029 (USD MILLION)
TABLE 79 EUROPE: OPERATING ROOM MANAGEMENT MARKET, BY END USER,  2022–2029 (USD MILLION)
TABLE 80 GERMANY: OPERATING ROOM MANAGEMENT MARKET, BY TYPE,  2022–2029 (USD MILLION)
TABLE 81 GERMANY: OPERATING ROOM MANAGEMENT MARKET, BY COMPONENT,  2022–2029 (USD MILLION)
TABLE 82 GERMANY: OPERATING ROOM MANAGEMENT SOFTWARE MARKET, BY TYPE, 2022–2029 (USD MILLION)
TABLE 83 GERMANY: OPERATING ROOM MANAGEMENT SERVICES MARKET, BY TYPE,  2022–2029 (USD MILLION)
TABLE 84 GERMANY: OPERATING ROOM MANAGEMENT MARKET, BY DELIVERY MODE, 2022–2029 (USD MILLION)
TABLE 85 GERMANY: OPERATING ROOM MANAGEMENT MARKET, BY WORKFLOW,  2022–2029 (USD MILLION)
TABLE 86 GERMANY: OPERATING ROOM MANAGEMENT MARKET, BY END USER,  2022–2029 (USD MILLION)
TABLE 87 UK: OPERATING ROOM MANAGEMENT MARKET, BY TYPE,  2022–2029 (USD MILLION)
TABLE 88 UK: OPERATING ROOM MANAGEMENT MARKET, BY COMPONENT,  2022–2029 (USD MILLION)
TABLE 89 UK: OPERATING ROOM MANAGEMENT SOFTWARE MARKET, BY TYPE,  2022–2029 (USD MILLION)
TABLE 90 UK: OPERATING ROOM MANAGEMENT SERVICES MARKET, BY TYPE,  2022–2029 (USD MILLION)
TABLE 91 UK: OPERATING ROOM MANAGEMENT MARKET, BY DELIVERY MODE,  2022–2029 (USD MILLION)
TABLE 92 UK: OPERATING ROOM MANAGEMENT MARKET, BY WORKFLOW,  2022–2029 (USD MILLION)
TABLE 93 UK: OPERATING ROOM MANAGEMENT MARKET, BY END USER,  2022–2029 (USD MILLION)
TABLE 94 FRANCE: OPERATING ROOM MANAGEMENT MARKET, BY TYPE,  2022–2029 (USD MILLION)
TABLE 95 FRANCE: OPERATING ROOM MANAGEMENT MARKET, BY COMPONENT,  2022–2029 (USD MILLION)
TABLE 96 FRANCE: OPERATING ROOM MANAGEMENT SOFTWARE MARKET, BY TYPE,  2022–2029 (USD MILLION)
TABLE 97 FRANCE: OPERATING ROOM MANAGEMENT SERVICES MARKET, BY TYPE,  2022–2029 (USD MILLION)
TABLE 98 FRANCE: OPERATING ROOM MANAGEMENT MARKET, BY DELIVERY MODE,  2022–2029 (USD MILLION)
TABLE 99 FRANCE: OPERATING ROOM MANAGEMENT MARKET, BY WORKFLOW,  2022–2029 (USD MILLION)
TABLE 100 FRANCE: OPERATING ROOM MANAGEMENT MARKET, BY END USER,  2022–2029 (USD MILLION)
TABLE 101 ITALY: OPERATING ROOM MANAGEMENT MARKET, BY TYPE,  2022–2029 (USD MILLION)
TABLE 102 ITALY: OPERATING ROOM MANAGEMENT MARKET, BY COMPONENT,  2022–2029 (USD MILLION)
TABLE 103 ITALY: OPERATING ROOM MANAGEMENT SOFTWARE MARKET, BY TYPE,  2022–2029 (USD MILLION)
TABLE 104 ITALY: OPERATING ROOM MANAGEMENT SERVICES MARKET, BY TYPE,  2022–2029 (USD MILLION)
TABLE 105 ITALY: OPERATING ROOM MANAGEMENT MARKET, BY DELIVERY MODE,  2022–2029 (USD MILLION)
TABLE 106 ITALY: OPERATING ROOM MANAGEMENT MARKET, BY WORKFLOW,  2022–2029 (USD MILLION)
TABLE 107 ITALY: OPERATING ROOM MANAGEMENT MARKET, BY END USER,  2022–2029 (USD MILLION)
TABLE 108 SPAIN: OPERATING ROOM MANAGEMENT MARKET, BY TYPE,  2022–2029 (USD MILLION)
TABLE 109 SPAIN: OPERATING ROOM MANAGEMENT MARKET, BY COMPONENT,  2022–2029 (USD MILLION)
TABLE 110 SPAIN: OPERATING ROOM MANAGEMENT SOFTWARE MARKET, BY TYPE,  2022–2029 (USD MILLION)
TABLE 111 SPAIN: OPERATING ROOM MANAGEMENT SERVICES MARKET, BY TYPE,  2022–2029 (USD MILLION)
TABLE 112 SPAIN: OPERATING ROOM MANAGEMENT MARKET, BY DELIVERY MODE,  2022–2029 (USD MILLION)
TABLE 113 SPAIN: OPERATING ROOM MANAGEMENT MARKET, BY WORKFLOW,  2022–2029 (USD MILLION)
TABLE 114 SPAIN: OPERATING ROOM MANAGEMENT MARKET, BY END USER,  2022–2029 (USD MILLION)
TABLE 115 REST OF EUROPE: OPERATING ROOM MANAGEMENT MARKET, BY TYPE,  2022–2029 (USD MILLION)
TABLE 116 REST OF EUROPE: OPERATING ROOM MANAGEMENT MARKET, BY COMPONENT, 2022–2029 (USD MILLION)
TABLE 117 REST OF EUROPE: OPERATING ROOM MANAGEMENT SOFTWARE MARKET,  BY TYPE, 2022–2029 (USD MILLION)
TABLE 118 REST OF EUROPE: OPERATING ROOM MANAGEMENT SERVICES MARKET,  BY TYPE, 2022–2029 (USD MILLION)
TABLE 119 REST OF EUROPE: OPERATING ROOM MANAGEMENT MARKET,  BY DELIVERY MODE, 2022–2029 (USD MILLION)
TABLE 120 REST OF EUROPE: OPERATING ROOM MANAGEMENT MARKET, BY WORKFLOW, 2022–2029 (USD MILLION)
TABLE 121 REST OF EUROPE: OPERATING ROOM MANAGEMENT MARKET, BY END USER, 2022–2029 (USD MILLION)
TABLE 122 ASIA PACIFIC: OPERATING ROOM MANAGEMENT MARKET, BY COUNTRY,  2022–2029 (USD MILLION)
TABLE 123 ASIA PACIFIC: OPERATING ROOM MANAGEMENT MARKET, BY TYPE,  2022–2029 (USD MILLION)
TABLE 124 ASIA PACIFIC: OPERATING ROOM MANAGEMENT MARKET, BY COMPONENT,  2022–2029 (USD MILLION)
TABLE 125 ASIA PACIFIC: OPERATING ROOM MANAGEMENT SOFTWARE MARKET, BY TYPE, 2022–2029 (USD MILLION)
TABLE 126 ASIA PACIFIC: OPERATING ROOM MANAGEMENT SERVICES MARKET, BY TYPE, 2022–2029 (USD MILLION)
TABLE 127 ASIA PACIFIC: OPERATING ROOM MANAGEMENT MARKET, BY DELIVERY MODE, 2022–2029 (USD MILLION)
TABLE 128 ASIA PACIFIC: OPERATING ROOM MANAGEMENT MARKET, BY WORKFLOW,  2022–2029 (USD MILLION)
TABLE 129 ASIA PACIFIC: OPERATING ROOM MANAGEMENT MARKET, BY END USER,  2022–2029 (USD MILLION)
TABLE 130 JAPAN: OPERATING ROOM MANAGEMENT MARKET, BY TYPE,  2022–2029 (USD MILLION)
TABLE 131 JAPAN: OPERATING ROOM MANAGEMENT MARKET, BY COMPONENT,  2022–2029 (USD MILLION)
TABLE 132 JAPAN: OPERATING ROOM MANAGEMENT SOFTWARE MARKET, BY TYPE,  2022–2029 (USD MILLION)
TABLE 133 JAPAN: OPERATING ROOM MANAGEMENT SERVICES MARKET, BY TYPE,  2022–2029 (USD MILLION)
TABLE 134 JAPAN: OPERATING ROOM MANAGEMENT MARKET, BY DELIVERY MODE,  2022–2029 (USD MILLION)
TABLE 135 JAPAN: OPERATING ROOM MANAGEMENT MARKET, BY WORKFLOW,  2022–2029 (USD MILLION)
TABLE 136 JAPAN: OPERATING ROOM MANAGEMENT MARKET, BY END USER,  2022–2029 (USD MILLION)
TABLE 137 CHINA: OPERATING ROOM MANAGEMENT MARKET, BY TYPE,  2022–2029 (USD MILLION)
TABLE 138 CHINA: OPERATING ROOM MANAGEMENT MARKET, BY COMPONENT,  2022–2029 (USD MILLION)
TABLE 139 CHINA: OPERATING ROOM MANAGEMENT SOFTWARE MARKET, BY TYPE,  2022–2029 (USD MILLION)
TABLE 140 CHINA: OPERATING ROOM MANAGEMENT SERVICES MARKET, BY TYPE,  2022–2029 (USD MILLION)
TABLE 141 CHINA: OPERATING ROOM MANAGEMENT MARKET, BY DELIVERY MODE,  2022–2029 (USD MILLION)
TABLE 142 CHINA: OPERATING ROOM MANAGEMENT MARKET, BY WORKFLOW,  2022–2029 (USD MILLION)
TABLE 143 CHINA: OPERATING ROOM MANAGEMENT MARKET, BY END USER,  2022–2029 (USD MILLION)
TABLE 144 INDIA: OPERATING ROOM MANAGEMENT MARKET, BY TYPE,  2022–2029 (USD MILLION)
TABLE 145 INDIA: OPERATING ROOM MANAGEMENT MARKET, BY COMPONENT,  2022–2029 (USD MILLION)
TABLE 146 INDIA: OPERATING ROOM MANAGEMENT SOFTWARE MARKET, BY TYPE,  2022–2029 (USD MILLION)
TABLE 147 INDIA: OPERATING ROOM MANAGEMENT SERVICES MARKET, BY TYPE,  2022–2029 (USD MILLION)
TABLE 148 INDIA: OPERATING ROOM MANAGEMENT MARKET, BY DELIVERY MODE,  2022–2029 (USD MILLION)
TABLE 149 INDIA: OPERATING ROOM MANAGEMENT MARKET, BY WORKFLOW,  2022–2029 (USD MILLION)
TABLE 150 INDIA: OPERATING ROOM MANAGEMENT MARKET, BY END USER,  2022–2029 (USD MILLION)
TABLE 151 REST OF ASIA PACIFIC: OPERATING ROOM MANAGEMENT MARKET,  BY TYPE, 2022–2029 (USD MILLION)
TABLE 152 REST OF ASIA PACIFIC: OPERATING ROOM MANAGEMENT MARKET,  BY COMPONENT, 2022–2029 (USD MILLION)
TABLE 153 REST OF ASIA PACIFIC: OPERATING ROOM MANAGEMENT SOFTWARE MARKET,  BY TYPE, 2022–2029 (USD MILLION)
TABLE 154 REST OF ASIA PACIFIC: OPERATING ROOM MANAGEMENT SERVICES MARKET,  BY TYPE, 2022–2029 (USD MILLION)
TABLE 155 REST OF ASIA PACIFIC: OPERATING ROOM MANAGEMENT MARKET, BY DELIVERY MODE, 2022–2029 (USD MILLION)
TABLE 156 REST OF ASIA PACIFIC: OPERATING ROOM MANAGEMENT MARKET,  BY WORKFLOW, 2022–2029 (USD MILLION)
TABLE 157 REST OF ASIA PACIFIC: OPERATING ROOM MANAGEMENT MARKET, BY END USER, 2022–2029 (USD MILLION)
TABLE 158 LATIN AMERICA: OPERATING ROOM MANAGEMENT MARKET, BY COUNTRY,  2022–2029 (USD MILLION)
TABLE 159 LATIN AMERICA: OPERATING ROOM MANAGEMENT MARKET, BY TYPE,  2022–2029 (USD MILLION)
TABLE 160 LATIN AMERICA: OPERATING ROOM MANAGEMENT MARKET, BY COMPONENT, 2022–2029 (USD MILLION)
TABLE 161 LATIN AMERICA: OPERATING ROOM MANAGEMENT SOFTWARE MARKET, BY TYPE, 2022–2029 (USD MILLION)
TABLE 162 LATIN AMERICA: OPERATING ROOM MANAGEMENT SERVICES MARKET, BY TYPE, 2022–2029 (USD MILLION)
TABLE 163 LATIN AMERICA: OPERATING ROOM MANAGEMENT MARKET, BY DELIVERY MODE, 2022–2029 (USD MILLION)
TABLE 164 LATIN AMERICA: OPERATING ROOM MANAGEMENT MARKET, BY WORKFLOW, 2022–2029 (USD MILLION)
TABLE 165 LATIN AMERICA: OPERATING ROOM MANAGEMENT MARKET, BY END USER,  2022–2029 (USD MILLION)
TABLE 166 BRAZIL: OPERATING ROOM MANAGEMENT MARKET, BY TYPE,  2022–2029 (USD MILLION)
TABLE 167 BRAZIL: OPERATING ROOM MANAGEMENT MARKET, BY COMPONENT,  2022–2029 (USD MILLION)
TABLE 168 BRAZIL: OPERATING ROOM MANAGEMENT SOFTWARE MARKET, BY TYPE,  2022–2029 (USD MILLION)
TABLE 169 BRAZIL: OPERATING ROOM MANAGEMENT SERVICES MARKET, BY TYPE,  2022–2029 (USD MILLION)
TABLE 170 BRAZIL: OPERATING ROOM MANAGEMENT MARKET, BY DELIVERY MODE,  2022–2029 (USD MILLION)
TABLE 171 BRAZIL: OPERATING ROOM MANAGEMENT MARKET, BY WORKFLOW,  2022–2029 (USD MILLION)
TABLE 172 BRAZIL: OPERATING ROOM MANAGEMENT MARKET, BY END USER,  2022–2029 (USD MILLION)
TABLE 173 MEXICO: OPERATING ROOM MANAGEMENT MARKET, BY TYPE,  2022–2029 (USD MILLION)
TABLE 174 MEXICO: OPERATING ROOM MANAGEMENT MARKET, BY COMPONENT,  2022–2029 (USD MILLION)
TABLE 175 MEXICO: OPERATING ROOM MANAGEMENT SOFTWARE MARKET, BY TYPE,  2022–2029 (USD MILLION)
TABLE 176 MEXICO: OPERATING ROOM MANAGEMENT SERVICES MARKET, BY TYPE,  2022–2029 (USD MILLION)
TABLE 177 MEXICO: OPERATING ROOM MANAGEMENT MARKET, BY DELIVERY MODE,  2022–2029 (USD MILLION)
TABLE 178 MEXICO: OPERATING ROOM MANAGEMENT MARKET, BY WORKFLOW,  2022–2029 (USD MILLION)
TABLE 179 MEXICO: OPERATING ROOM MANAGEMENT MARKET, BY END USER,  2022–2029 (USD MILLION)
TABLE 180 REST OF LATIN AMERICA: OPERATING ROOM MANAGEMENT MARKET,  BY TYPE, 2022–2029 (USD MILLION)
TABLE 181 REST OF LATIN AMERICA: OPERATING ROOM MANAGEMENT MARKET,  BY COMPONENT, 2022–2029 (USD MILLION)
TABLE 182 REST OF LATIN AMERICA: OPERATING ROOM MANAGEMENT SOFTWARE MARKET, BY TYPE, 2022–2029 (USD MILLION)
TABLE 183 REST OF LATIN AMERICA: OPERATING ROOM MANAGEMENT SERVICES MARKET, BY TYPE, 2022–2029 (USD MILLION)
TABLE 184 REST OF LATIN AMERICA: OPERATING ROOM MANAGEMENT MARKET,  BY DELIVERY MODE, 2022–2029 (USD MILLION)
TABLE 185 REST OF LATIN AMERICA: OPERATING ROOM MANAGEMENT MARKET,  BY WORKFLOW, 2022–2029 (USD MILLION)
TABLE 186 REST OF LATIN AMERICA: OPERATING ROOM MANAGEMENT MARKET,  BY END USER, 2022–2029 (USD MILLION)
TABLE 187 MIDDLE EAST & AFRICA: OPERATING ROOM MANAGEMENT MARKET,  BY REGION, 2022–2029 (USD MILLION)
TABLE 188 MIDDLE EAST & AFRICA: OPERATING ROOM MANAGEMENT MARKET,  BY TYPE, 2022–2029 (USD MILLION)
TABLE 189 MIDDLE EAST & AFRICA: OPERATING ROOM MANAGEMENT MARKET,  BY COMPONENT, 2022–2029 (USD MILLION)
TABLE 190 MIDDLE EAST & AFRICA: OPERATING ROOM MANAGEMENT SOFTWARE MARKET, BY TYPE, 2022–2029 (USD MILLION)
TABLE 191 MIDDLE EAST & AFRICA: OPERATING ROOM MANAGEMENT SERVICES MARKET,  BY TYPE, 2022–2029 (USD MILLION)
TABLE 192 MIDDLE EAST & AFRICA: OPERATING ROOM MANAGEMENT MARKET,  BY DELIVERY MODE, 2022–2029 (USD MILLION)
TABLE 193 MIDDLE EAST & AFRICA: OPERATING ROOM MANAGEMENT MARKET,  BY WORKFLOW, 2022–2029 (USD MILLION)
TABLE 194 MIDDLE EAST & AFRICA: OPERATING ROOM MANAGEMENT MARKET,  BY END USER, 2022–2029 (USD MILLION)
TABLE 195 GCC COUNTRIES: OPERATING ROOM MANAGEMENT MARKET, BY TYPE,  2022–2029 (USD MILLION)
TABLE 196 GCC COUNTRIES: OPERATING ROOM MANAGEMENT MARKET, BY COMPONENT, 2022–2029 (USD MILLION)
TABLE 197 GCC COUNTRIES: OPERATING ROOM MANAGEMENT SOFTWARE MARKET, BY TYPE, 2022–2029 (USD MILLION)
TABLE 198 GCC COUNTRIES: OPERATING ROOM MANAGEMENT SERVICES MARKET, BY TYPE, 2022–2029 (USD MILLION)
TABLE 199 GCC COUNTRIES: OPERATING ROOM MANAGEMENT MARKET, BY DELIVERY MODE, 2022–2029 (USD MILLION)
TABLE 200 GCC COUNTRIES: OPERATING ROOM MANAGEMENT MARKET, BY WORKFLOW, 2022–2029 (USD MILLION)
TABLE 201 GCC COUNTRIES: OPERATING ROOM MANAGEMENT MARKET, BY END USER, 2022–2029 (USD MILLION)
TABLE 202 REST OF MIDDLE EAST & AFRICA: OPERATING ROOM MANAGEMENT MARKET,  BY TYPE, 2022–2029 (USD MILLION)
TABLE 203 REST OF MIDDLE EAST & AFRICA: OPERATING ROOM MANAGEMENT MARKET,  BY COMPONENT, 2022–2029 (USD MILLION)
TABLE 204 REST OF MIDDLE EAST & AFRICA: OPERATING ROOM MANAGEMENT SOFTWARE MARKET, BY TYPE, 2022–2029 (USD MILLION)
TABLE 205 REST OF MIDDLE EAST & AFRICA: OPERATING ROOM MANAGEMENT SERVICES MARKET, BY TYPE, 2022–2029 (USD MILLION)
TABLE 206 REST OF MIDDLE EAST & AFRICA: OPERATING ROOM MANAGEMENT MARKET,  BY DELIVERY MODE, 2022–2029 (USD MILLION)
TABLE 207 REST OF MIDDLE EAST & AFRICA: OPERATING ROOM MANAGEMENT MARKET,  BY WORKFLOW, 2022–2029 (USD MILLION)
TABLE 208 REST OF MIDDLE EAST & AFRICA: OPERATING ROOM MANAGEMENT MARKET,  BY END USER, 2022–2029 (USD MILLION)
TABLE 209 OPERATING ROOM MANAGEMENT MARKET: DEGREE OF COMPETITION
TABLE 210 OPERATING ROOM MANAGEMENT MARKET: TYPE FOOTPRINT
TABLE 211 OPERATING ROOM MANAGEMENT MARKET: SOFTWARE FOOTPRINT
TABLE 212 OPERATING ROOM MANAGEMENT MARKET: SERVICE FOOTPRINT
TABLE 213 OPERATING ROOM MANAGEMENT MARKET: DELIVERY MODE FOOTPRINT
TABLE 214 OPERATING ROOM MANAGEMENT MARKET: REGION FOOTPRINT
TABLE 215 OPERATING ROOM MANAGEMENT MARKET: DETAILED LIST OF KEY STARTUPS/SMES
TABLE 216 OPERATING ROOM MANAGEMENT MARKET: COMPETITIVE BENCHMARKING  OF STARTUPS/SMES
TABLE 217 OPERATING ROOM MANAGEMENT MARKET: PRODUCT APPROVALS & ENHANCEMENTS, JANUARY 2021–JUNE 2024
TABLE 218 OPERATING ROOM MANAGEMENT MARKET: DEALS, JANUARY 2021–JUNE 2024
TABLE 219 OPERATING ROOM MANAGEMENT MARKET: OTHER DEVELOPMENTS,  JANUARY 2021–JUNE 2024
TABLE 220 ORACLE: COMPANY OVERVIEW
TABLE 221 ORACLE: PRODUCTS OFFERED
TABLE 222 ORACLE: DEALS, JANUARY 2021–JUNE 2024
TABLE 223 GETINGE AB: COMPANY OVERVIEW
TABLE 224 GETINGE AB: PRODUCTS OFFERED
TABLE 225 GETINGE AB: PRODUCT LAUNCHES/APPROVALS/ENHANCEMENTS,  JANUARY 2021–JUNE 2024
TABLE 226 GETINGE AB: DEALS, JANUARY 2021–JUNE 2024
TABLE 227 GETINGE AB: EXPANSIONS, JANUARY 2021–JUNE 2024
TABLE 228 GE HEALTHCARE: COMPANY OVERVIEW
TABLE 229 GE HEALTHCARE: PRODUCTS OFFERED
TABLE 230 GE HEALTHCARE: PRODUCT LAUNCHES/APPROVALS/ENHANCEMENTS,  JANUARY 2021–JUNE 2024
TABLE 231 GE HEALTHCARE: DEALS, JANUARY 2021–JUNE 2024
TABLE 232 GE HEALTHCARE: EXPANSIONS, JANUARY 2021–JUNE 2024
TABLE 233 MEDICAL INFORMATION TECHNOLOGY, INC.: COMPANY OVERVIEW
TABLE 234 MEDICAL INFORMATION TECHNOLOGY, INC.: PRODUCTS OFFERED
TABLE 235 MEDICAL INFORMATION TECHNOLOGY, INC.: JANUARY 2021–JUNE 2024
TABLE 236 EPIC SYSTEMS CORPORATION: COMPANY OVERVIEW
TABLE 237 EPIC SYSTEMS CORPORATION: PRODUCTS OFFERED
TABLE 238 EPIC SYSTEMS CORPORATION: DEALS, JANUARY 2021 – MAY 2024
TABLE 239 SURGICAL INFORMATION SYSTEMS: COMPANY OVERVIEW
TABLE 240 SURGICAL INFORMATION SYSTEMS: PRODUCTS OFFERED
TABLE 241 SURGICAL INFORMATION SYSTEMS: EXPANSIONS, JANUARY 2021–JUNE 2024
TABLE 242 SURGICAL INFORMATION SYSTEMS: OTHER DEVELOPMENTS,  JANUARY 2021–JUNE 2024
TABLE 243 PICIS CLINICAL SOLUTIONS, INC.: COMPANY OVERVIEW
TABLE 244 PICIS CLINICAL SOLUTIONS, INC.: PRODUCTS OFFERED
TABLE 245 PICIS CLINICAL SOLUTIONS, INC.: DEALS, JANUARY 2021–JUNE 2024
TABLE 246 VERADIGM LLC: COMPANY OVERVIEW
TABLE 247 VERADIGM LLC: PRODUCTS OFFERED
TABLE 248 VERADIGM LLC: DEALS, JANUARY 2021–JUNE 2024
TABLE 249 BECTON, DICKINSON AND COMPANY: COMPANY OVERVIEW
TABLE 250 BECTON, DICKINSON AND COMPANY: PRODUCTS OFFERED
TABLE 251 BECTON, DICKINSON AND COMPANY: DEALS, JANUARY 2021–JUNE 2024
TABLE 252 STERIS CORPORATION: COMPANY OVERVIEW
TABLE 253 STERIS CORPORATION: PRODUCTS OFFERED
TABLE 254 UNITEDHEALTH GROUP: COMPANY OVERVIEW
TABLE 255 UNITEDHEALTH GROUP: PRODUCTS OFFERED
TABLE 256 UNITEDHEALTH GROUP: DEALS, JANUARY 2021–JUNE 2024
TABLE 257 BRAINLAB AG: COMPANY OVERVIEW
TABLE 258 BRAINLAB AG: PRODUCTS OFFERED
TABLE 259 BRAINLAB AG: DEALS, JANUARY 2021–JUNE 2024
TABLE 260 RICHARD WOLF GMBH: COMPANY OVERVIEW
TABLE 261 RICHARD WOLF GMBH: PRODUCTS OFFERED
TABLE 262 RICHARD WOLF GMBH: DEALS, JANUARY 2021–JUNE 2024
TABLE 263 RICHARD WOLF GMBH: EXPANSIONS, JANUARY 2021–JUNE 2024
TABLE 264 KARL STORZ SE & CO. KG: COMPANY OVERVIEW
TABLE 265 KARL STORZ SE & CO. KG: PRODUCTS OFFERED
TABLE 266 KARL STORZ SE & CO. KG: PRODUCT LAUNCHES/APPROVALS/ENHANCEMENTS, JANUARY 2021–JUNE 2024
TABLE 267 KARL STORZ SE & CO. KG: DEALS, JANUARY 2021–JUNE 2024
TABLE 268 CENCIS TECHNOLOGIES INC.: COMPANY OVERVIEW
TABLE 269 CENSIS TECHNOLOGIES INC.: PRODUCTS OFFERED
TABLE 270 BARCO: COMPANY OVERVIEW
TABLE 271 BARCO: PRODUCTS OFFERED
TABLE 272 BRACO: DEALS, JANUARY 2021–JUNE 2024
TABLE 273 CARDINAL HEALTH: COMPANY OVERVIEW
TABLE 274 CARDINAL HEALTH: PRODUCTS OFFERED
TABLE 275 CARDINAL HEALTH: DEALS, JANUARY 2021–JUNE 2024
TABLE 276 ECLINICALWORKS: COMPANY OVERVIEW
TABLE 277 CASECTRL: COMPANY OVERVIEW
TABLE 278 CARESYNTAX: COMPANY OVERVIEW
TABLE 279 MEDICAD: COMPANY OVERVIEW
TABLE 280 QVENTUS: COMPANY OVERVIEW
TABLE 281 ALERT LIFE SCIENCES COMPUTING, S.A: COMPANY OVERVIEW
TABLE 282 TEDISEL MEDICAL: COMPANY OVERVIEW
TABLE 283 OWENS & MINOR: COMPANY OVERVIEW
 
 
LIST OF FIGURES (55 FIGURES)
 
FIGURE 1 RESEARCH DESIGN
FIGURE 2 PRIMARY SOURCES
FIGURE 3 BREAKDOWN OF PRIMARY INTERVIEWS: BY DEMAND SIDE, SUPPLY SIDE, DESIGNATION, AND REGION
FIGURE 4 RESEARCH METHODOLOGY DESIGN: HYPOTHESIS BUILDING
FIGURE 5 SUPPLY-SIDE MARKET ESTIMATION: REVENUE SHARE ANALYSIS
FIGURE 6 OPERATING ROOM MANAGEMENT MARKET: BOTTOM-UP APPROACH
FIGURE 7 OPERATING ROOM MANAGEMENT MARKET: TOP-DOWN APPROACH
FIGURE 8 CAGR PROJECTIONS FROM ANALYSIS OF DRIVERS, RESTRAINTS, OPPORTUNITIES, AND CHALLENGES (2024–2029)
FIGURE 9 CAGR PROJECTIONS: SUPPLY-SIDE ANALYSIS
FIGURE 10 DATA TRIANGULATION METHODOLOGY
FIGURE 11 OPERATING ROOM MANAGEMENT MARKET, BY TYPE,  2024 VS. 2029 (USD MILLION)
FIGURE 12 OPERATING ROOM MANAGEMENT MARKET, BY COMPONENT,  2024 VS. 2029 (USD MILLION)
FIGURE 13 OPERATING ROOM MANAGEMENT SERVICES MARKET, BY TYPE,  2024 VS. 2029 (USD MILLION)
FIGURE 14 OPERATING ROOM MANAGEMENT MARKET, BY DELIVERY MODE,  2024 VS. 2029 (USD MILLION)
FIGURE 15 OPERATING ROOM MANAGEMENT MARKET, BY END USER,  2024 VS. 2029 (USD MILLION)
FIGURE 16 GEOGRAPHIC SNAPSHOT OF OPERATING ROOM MANAGEMENT MARKET
FIGURE 17 RISING NEED FOR COST CURTAILMENT IN OPERATING ROOMS TO  DRIVE MARKET GROWTH
FIGURE 18 SERVICES SEGMENT TO REGISTER HIGHEST CAGR DURING FORECAST PERIOD
FIGURE 19 ASIA PACIFIC MARKET TO GROW AT HIGHEST CAGR DURING FORECAST PERIOD
FIGURE 20 INDIA TO WITNESS HIGHEST GROWTH RATE IN OPERATING ROOM MANAGEMENT MARKET DURING FORECAST PERIOD
FIGURE 21 EMERGING ECONOMIES TO REGISTER HIGHER GROWTH RATES DURING FORECAST PERIOD
FIGURE 22 OPERATING ROOM MANAGEMENT MARKET: DRIVERS, RESTRAINTS, OPPORTUNITIES, AND CHALLENGES
FIGURE 23 US: OFFICE-BASED PHYSICIAN AND HOSPITAL EHR ADOPTION (2008–2021)
FIGURE 24 TRENDS/DISRUPTIONS IMPACTING CUSTOMERS’ BUSINESSES IN  OPERATING ROOM MANAGEMENT MARKET
FIGURE 25 OPERATING ROOM MANAGEMENT MARKET: VALUE CHAIN ANALYSIS
FIGURE 26 OPERATING ROOM MANAGEMENT MARKET: ECOSYSTEM ANALYSIS
FIGURE 27 OPERATING ROOM MANAGEMENT MARKET: PORTER’S FIVE FORCES ANALYSIS
FIGURE 28 KEY STAKEHOLDERS IN BUYING PROCESS FOR TOP 3 END USERS
FIGURE 29 KEY BUYING CRITERIA FOR TOP 3 END USERS
FIGURE 30 PATENT PUBLICATION TRENDS (JANUARY 2012–DECEMBER 2023)
FIGURE 31 TOP APPLICANT COUNTRIES/REGIONS FOR OPERATING ROOM MANAGEMENT PATENT DOCUMENTS
FIGURE 32 TOP APPLICANTS AND OWNERS (COMPANIES/INSTITUTES) FOR  OPERATING ROOM MANAGEMENT (JANUARY 2012–DECEMBER 2023)
FIGURE 33 FUNDING FOR PLAYERS IN OPERATING ROOM MANAGEMENT SYSTEMS MARKET
FIGURE 34 MARKET POTENTIAL OF GENERATIVE AI IN ENHANCING OPERATING ROOM MANAGEMENT ACROSS INDUSTRIES
FIGURE 35 IMPACT OF GEN AI ON INTERCONNECTED AND ADJACENT ECOSYSTEMS
FIGURE 36 IMPACT ASSESSMENT OF ORM SOLUTIONS ON END USERS
FIGURE 37 NORTH AMERICA: OPERATING ROOM MANAGEMENT MARKET SNAPSHOT
FIGURE 38 ASIA PACIFIC: OPERATING ROOM MANAGEMENT MARKET SNAPSHOT
FIGURE 39 OVERVIEW OF STRATEGIES ADOPTED BY PLAYERS IN OPERATING ROOM MANAGEMENT MARKET
FIGURE 40 REVENUE ANALYSIS OF KEY PLAYERS IN OPERATING ROOM MANAGEMENT MARKET, 2019–2023
FIGURE 41 OPERATING ROOM MANAGEMENT MARKET SHARE ANALYSIS, 2023
FIGURE 42 BRAND/SOFTWARE COMPARATIVE ANALYSIS
FIGURE 43 EV/EBITDA OF KEY VENDORS
FIGURE 44 YEAR-TO-DATE (YTD) PRICE TOTAL RETURN AND 5-YEAR STOCK  BETA OF KEY VENDORS
FIGURE 45 OPERATING ROOM MANAGEMENT MARKET: COMPANY EVALUATION MATRIX  (KEY PLAYERS), 2023
FIGURE 46 OPERATING ROOM MANAGEMENT MARKET: COMPANY FOOTPRINT
FIGURE 47 OPERATING ROOM MANAGEMENT MARKET: COMPANY EVALUATION MATRIX: (STARTUPS/SME), 2023
FIGURE 48 ORACLE: COMPANY SNAPSHOT (2023)
FIGURE 49 GETINGE AB: COMPANY SNAPSHOT (2023)
FIGURE 50 GE HEALTHCARE: COMPANY SNAPSHOT (2023)
FIGURE 51 BECTON, DICKINSON AND COMPANY: COMPANY SNAPSHOT (2023)
FIGURE 52 STERIS CORPORATION: COMPANY SNAPSHOT (2023)
FIGURE 53 UNITEDHEALTH GROUP: COMPANY SNAPSHOT (2023)
FIGURE 54 BARCO: COMPANY SNAPSHOT (2023)
FIGURE 55 CARDINAL HEALTH: COMPANY SNAPSHOT (2023)

The study involved five major activities to estimate the current size of the operating room management market. Exhaustive secondary research was done to collect information on the market and its different subsegments. The next step was to validate these findings, assumptions, and sizing with industry experts across the value chain through primary research. Both top-down and bottom-up approaches were employed to estimate the complete market size. Thereafter, market breakdown and data triangulation procedures were used to estimate the market size of the segments and subsegments.

Secondary Research

In the secondary research process, various secondary sources such as annual reports, press releases & investor presentations of companies, white papers, certified publications, articles by recognized authors, gold-standard & silver-standard websites, regulatory bodies, and databases (such as D&B Hoovers, Bloomberg Business, and Factiva) were referred to in order to identify and collect information for the study of operating room management market. It was also used to obtain important information about the top players, market classification, and segmentation according to industry trends to the bottom-most level, geographic markets, and key developments related to the market. A database of the key industry leaders was also prepared using secondary research.

Primary Research

Extensive primary research was conducted after acquiring basic knowledge about the global operating room management market scenario through secondary research. Several primary interviews were conducted with market experts from both the demand side (Hospital directors, Hospital Vice Presidents, Department heads, IT heads, operating room managers, OR system administrators, surgical services directors and Critical care specialists among others ) and supply side (such as C-level and D-level executives, technology experts, product managers, marketing and sales managers, among others) across five major regions—North America, Europe, the Asia Pacific, Latin America, Middle East, and Africa. This primary data was collected through questionnaires, e-mails, online surveys, personal interviews, and telephonic interviews.

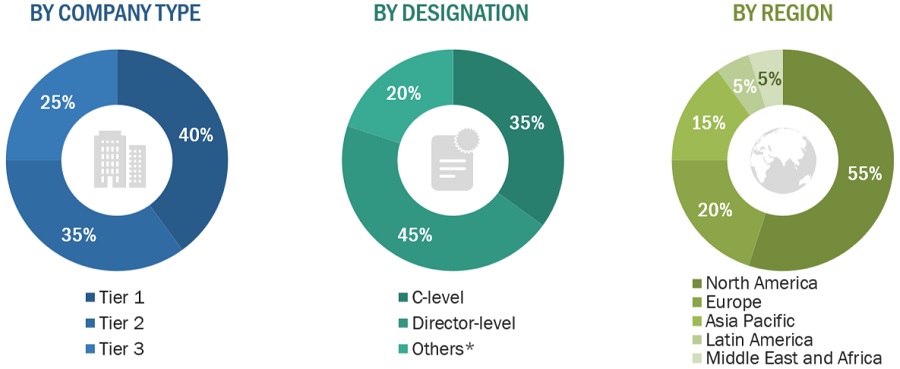
The following is a breakdown of the primary respondents:

Breakdown of Primary Participants:
Operating Room Management Market Size, and Share

Note 1: Others include sales managers, marketing managers, and product managers.

Note 2: Tiers of companies are defined on the basis of their total revenues in 2023. Tier 1 = >USD 1 billion, Tier 2 = USD 500 million to USD 1 billion, and Tier 3 = <USD 500 million.

To know about the assumptions considered for the study, download the pdf brochure

Market Size Estimation

Both top-down and bottom-up approaches were used to estimate and validate the total size of the Operating room management market. These methods were also used extensively to estimate the size of various subsegments in the market. The research methodology used to estimate the market size includes the following:

  • The key players in the industry and markets have been identified through extensive secondary research.
  • The industry’s supply chain and market size, in terms of value, have been determined through primary and secondary research processes.
  • All percentage shares, splits, and breakdowns have been determined using secondary sources and verified through primary sources.

Global Operating Room Management Market Size: Bottom-Up Approach

Operating Room Management Market Size, and Share

To know about the assumptions considered for the study, Request for Free Sample Report

Global Operating Room Management Market Size: Top-Down Approach

Operating Room Management Market Size, and Share

Data Triangulation

After arriving at the overall market size—using the market size estimation processes—the market was split into several segments and subsegments. To complete the overall market engineering process and arrive at the exact statistics of each market segment and sub-segment, the data triangulation and market breakdown procedures were employed, wherever applicable. The data was triangulated by studying various factors and trends from both the demand and supply sides in the operating room management market.

Market Definition:

Operating room management comprises different software solutions that enable the smooth running of an operating room. These solutions boost the efficiency and effectiveness of operating rooms by optimizing workflow management, resource allocation, patient safety, and communication among surgical teams. These majorly include scheduling and workflow management, data management and communication, supply management, and performance management solutions among others.

Key Stakeholders:

  • Operating Room Software and Service Providers
  • Government Agencies
  • Healthcare Startups, Consultants, and Regulators
  • Healthcare Providers
  • Clinical/Physician Centers
  • Surgeons, Physicians, Operating Room Staff
  • Health IT service Providers
  • Healthcare Associations/Institutes
  • Hospitals (Public and Private)
  • Ambulatory Care Centers
  • Academic Medical Institutes
  • Venture Capitalists
  • Distributors and Resellers
  • Maintenance and Support Service Providers
  • Integration Service Providers
  • Data Security and Privacy Experts

Report Objectives

  • To define, describe, and forecast the global operating room management market based on type, component, delivery mode, workflow, end user, and region.
  • To provide detailed information regarding the major factors (such as drivers, restraints, opportunities, and challenges) influencing the market growth
  • To strategically analyze micro-markets with respect to individual growth trends, prospects, and contributions to the overall Operating room management market
  • To analyze opportunities in the market for stakeholders and provide details of the competitive landscape for market leaders.
  • To strategically analyze the market structure profile the key players of the Operating room management market and comprehensively analyze their core competencies.
  • To forecast the size of the market segments with respect to five regions, namely, North America, Europe, Asia Pacific, Latin America, and the Middle East & Africa.
  • To track and analyze competitive developments such as product launches and enhancements and investments, partnerships, collaborations, acquisitions, expansions, agreements, sales contracts, and alliances in the Operating room management market during the forecast period.

Available Customizations:

With the given market data, MarketsandMarkets offers customizations as per the company’s specific needs. The following customization options are available for the report:

  • Product Analysis: Product matrix, which gives a detailed comparison of the product portfolios of each company.
  • Geographic Analysis:  Further breakdown of the Latin American operating room management into specific countries and, the Middle East, and Africa operating room management into specific countries and further breakdown of the European operating room management into specific countries
Custom Market Research Services

We will customize the research for you, in case the report listed above does not meet with your exact requirements. Our custom research will comprehensively cover the business information you require to help you arrive at strategic and profitable business decisions.

Request Customization

Instant Answers with GPT - Ask Now!

Ask real questions. Get complete answers !
Report Code
HIT 2862
Published ON
Jul, 2024
Choose License Type
BUY NOW
  • SHARE
X
Request Customization
Speak to Analyst
Speak to Analyst
OR FACE-TO-FACE MEETING
PERSONALIZE THIS RESEARCH
  • Triangulate with your Own Data
  • Get Data as per your Format and Definition
  • Gain a Deeper Dive on a Specific Application, Geography, Customer or Competitor
  • Any level of Personalization
REQUEST A FREE CUSTOMIZATION
LET US HELP YOU!
  • What are the Known and Unknown Adjacencies Impacting the Operating Room Management Market
  • What will your New Revenue Sources be?
  • Who will be your Top Customer; what will make them switch?
  • Defend your Market Share or Win Competitors
  • Get a Scorecard for Target Partners
CUSTOMIZED WORKSHOP REQUEST
  • Call Us
  • +1-888-600-6441 (Corporate office hours)
  • +1-888-600-6441 (US/Can toll free)
  • +44-800-368-9399 (UK office hours)
CONNECT WITH US
ABOUT TRUST ONLINE
©2024 MarketsandMarkets Research Private Ltd. All rights reserved
DMCA.com Protection Status
Website Feedback