Motor Monitoring Market: Growth, Size, Share, and Trends

Motor Monitoring Market by Offering, Deployment, Monitoring Process, End-use (Metals and Minings, Oil and Gas, Power Generation, Water and Wastewater, Food and Beverages, Chemicals, Automotive, Aerospace and Defense) and Region - Global Forecast to 2028

Report Code: EP 7815 Nov, 2023, by marketsandmarkets.com

[340 Pages Report] The motor monitoring market is expected to grow from an estimated USD 2.3 billion in 2023 to USD 3.5 billion by 2028, at a CAGR of 8.7% during the forecast period. The motor monitoring market is growing due to the increasing adoption of predictive maintenance strategies driven by advancements in IoT and data analytics. The integration of advanced sensor technologies, the implementation of Industry 4.0 principles, and the focus on regulatory compliance further contribute to the market's expansion.

Motor Monitoring Market

To know about the assumptions considered for the study, Request for Free Sample Report

Motor Monitoring Market Opportunities

To know about the assumptions considered for the study, download the pdf brochure

Motor Monitoring Market Dynamics

Driver: Increasing adoption of industry 4.0 principles in the manufacturing sector

The adoption of industry 4.0 principles refers to the integration of manufacturing processes with IT, thus making processes smart. The proliferation of industrial automation and Industry 4.0 has propelled the utilization of several pieces of equipment that do not need human interference. However, there are several mechanical and electrical errors that can impact the productivity of machines at factories. Most of these defects originate from the motors installed in machinery. This makes the monitoring of motors critical for successfully running an industrial plant.

One of the aspects of Industry 4.0 is wireless technologies; small and easy-to-install sensors are deployed in areas where cabling is not feasible for acquiring high-frequency motor condition monitoring data. Wireless connectivity helps overcome barriers posed by factors such as the location of machinery, limited length of cabling and availability of space to install cables, thereby facilitating remote monitoring of the motor and eventually machinery installed in a plant.

With technological improvements in the semiconductors industry, the cost of sensors used for remote monitoring of motors has come down drastically during the past years. This is making remote monitoring affordable even for small- and medium-scale industries. Sensors in industrial facilities are used to monitor temperature, vibration, corrosion, torque, alignment, and oil and wear debris, among others. Advancements in wireless sensor network technologies are enabling the rapid implementation of these technologies in condition monitoring. These factors are likely to fuel the demand for remote monitoring technologies.

Restraints: Limited technical know-how to manage monitoring solutions

The increasing adoption of predictive maintenance and monitoring solutions compels enterprises to establish a dedicated data analysis team. This team must possess in-depth knowledge of motors and their operation within specific machines to accurately assess motor health, thereby potentially increasing indirect costs for companies. Additionally, since motor manufacturing companies may not readily offer monitoring solutions, industries often need to seek expertise from external providers, potentially adding to overall costs alongside initial motor installation investments. Monitoring motor data requires distinct skill sets, necessitating staff training and the establishment of standardized procedures, with the scarcity of affordable skilled professionals anticipated as a major constraint to market growth in the forecast period.

Opportunity: Growing focus on energy audits and regulations worldwide

A government-mandated standard, an energy audit is a regulatory requirement for assessing the energy efficiency of diverse electrical equipment. It offers a systematic approach to optimize energy costs, enhance safety, and improve operating and maintenance practices in industrial systems. Energy audits play a vital role in decision-making related to energy mix, power conservation, and ensuring a reliable energy supply. Mandatory in regions like North America, Europe, and Asia, countries such as China, India, Tunisia, and Algeria enforce energy audits due to high electricity consumption. In Europe, industrial sectors, including manufacturing plants, must undergo compulsory energy audits. Sectors like automotive, aerospace, defense, consumer electronics, and medical equipment utilize power analyzers to comply with energy audit requirements. In Europe, the Energy Efficiency Directive necessitates large companies to conduct energy audits every four years, with non-compliance resulting in penalties. Given that motors contribute significantly to industrial energy consumption, proper motor monitoring becomes crucial for substantial energy savings and compliance with energy audit mandates.

Challenges: Long payback period on investment

Continuous monitoring entails a higher upfront investment in data gathering and analysis technology, along with installation costs. Major considerations for calculating the total cost of ownership encompass system engineering and installation, field instrumentation (such as sensors and cabling), monitoring and diagnostic systems (comprising hardware, software, installation, and licenses), user training, and customer support if needed, as well as system maintenance, external expertise, and support. These software, services, and equipment come with substantial costs and require specific skill sets for operation. Consequently, operators must invest in additional training and maintenance for the motor control process. The incurred costs are contingent on the industry's scale and the extent of control service deployment. While larger industries typically see a relatively short payback period, many small and medium-scale industries encounter challenges in achieving prompt payback for control processes. Additionally, the payback time and return on investment (ROI) are influenced by the likelihood of motor failures, factors that, when considered, extend the payback period duration.

Motor Monitoring Market Ecosystem

Notable players in this industry comprise long-standing, financially robust manufacturers of the Motor Monitoring Market and related components. These companies have a significant track record in the market, offering a wide range of products, employing cutting-edge technologies, and maintaining robust global sales and marketing networks. Prominent companies in this market include ABB (Switzerland), General Electric (US), Siemens (Germany), Honeywell (US), and Schneider Electric (France).

Motor Monitoring Market

Hardware is expected to be the largest market based on offering.

The motor monitoring market offering has been segmented into hardware, software, and services. Hardware is expected to be the largest segment by offering, as hardware is the most important component of a machine condition monitoring system. The hardware segment mainly includes vibration sensors, infrared sensors, ultrasound detectors, spectrum analyzers, and corrosion probes.

Power Generation, by end user industry, to hold the second largest market share during the forecast period.

The market has been segmented by end user industry into metals and mining, oil and gas, power generation, water and wastewater, food and beverages, chemicals, automotive, aerospace and defense, and others. The power Generation segment is expected to be the second largest segment in the market by end user industry. The power generation industry is one of the biggest end users of large motors. These motors are mission critical for continuous power generation. Power demand is rising across the world, which calls for power generators to act more efficiently and increase productivity. Power generation is one of the emerging segments in the motor monitoring market.

North America is expected to account for the second fastest market during the forecast period.

North America is the second fastest market because of its strong emphasis on industrial automation, a shift towards predictive maintenance practices, continuous technological advancements, adherence to stringent regulations, and a growing awareness among industries about the benefits of motor monitoring. These factors collectively contribute to the region's position as one of the second fastest-growing markets in the motor monitoring industry.

North American Motor Monitoring Market Size, and Share

Key Market Players

The motor monitoring market is dominated by a few major players that have a wide regional presence. The major players in the motor monitoring market are ABB (Switzerland), General Electric (US), Siemens (Germany), Honeywell (US), and Schneider Electric (France). Between 2019 and 2023, Strategies such as product launches, contracts, agreements, partnerships, collaborations, alliances, acquisitions, and expansions are followed by these companies to capture a larger share of the motor monitoring market.

Want to explore hidden markets that can drive new revenue in Motor Monitoring Market?

Scope of the Report

Report Metric

Details

Market size available for years

2019–2028

Base year considered

2022

Forecast period

2023–2028

Forecast units

Value (USD)

Segments Covered

Offering, Deployment, End User, Monitoring Process, and Region

Geographies covered

Asia Pacific, North America, Europe, Middle East & Africa, and South America

Companies covered

ABB (Switzerland), General Electric (US), Siemens (Germany), Honeywell (US), Schneider Electric (France), Banner Engineering (US), Wilson Transformers (US), SKF (Sweden), Emerson (US), Rockwell Automation (US), Qualitrol (US), WEG (Brazil), Mitsubishi Electrical Corporation (Japan), Eaton (Ireland), and Advantech (Taiwan).

This research report categorizes the Motor monitoring market by offering, deployment, end user, monitoring process, and region.

On the basis of offering, the Motor monitoring market has been segmented as follows:
  • Hardware
  • Software
  • Services
On the basis of deployment, the Motor monitoring market has been segmented as follows:
  • On-Premise
  • Cloud
On the basis of end users, the Motor monitoring market has been segmented as follows:
  • Metals and Minings
  • Oil and Gas
  • Power Generation
  • Water and Wastewater
  • Food and Beverages
  • Chemicals
  • Automotive
  • Aerospace and Defense
  • Others
On the basis of my monitoring process, the Motor monitoring market has been segmented as follows:
  • Online
  • Offline/Portable
On the basis of region, the Motor monitoring market has been segmented as follows:
  • Asia Pacific
  • Europe
  • North America
  • Middle East & Africa
  • South America

Recent Developments

  • In October 2023, Emerson acquired National Instruments in October 2023. The acquisition of NI advances Emerson’s position as a global automation leader and expands its opportunity to capitalize on key secular trends like nearshoring, digital transformation, and sustainability and decarbonization.
  • In September 2021, the WEG Subsidiary in Russia (WRU) opened a new sales office in Novosibirsk, Siberia. The new office is intended to provide improved support to local customers. The office structure also provides additional space for training, customer meetings, and commercial operations.
  • In October 2021, WEG entered into a partnership with Delta Delfini to provide a complete solution for a shrimp farm in Saudi Arabia. WEG provided 13 x W50, 480kW, six poles, frame size 400 electric motors; 13 electric panels with SSW06 soft-starters; a package for replacement; as well as a stand-by replacement motor and services. WEG also provided two main and 11 secondary panels wherein each panel included a soft-starter, touch screen, PLC, Ethernet serial converter, safety and light buttons, and others.

Frequently Asked Questions (FAQ):

To speak to our analyst for a discussion on the above findings, click Speak to Analyst

Exclusive indicates content/data unique to MarketsandMarkets and not available with any competitors.

INTRODUCTION
32
RESEARCH METHODOLOGY
38
EXECUTIVE SUMMARY
52
PREMIUM INSIGHTS
56
MARKET OVERVIEW
60
  • 5.1 INTRODUCTION
  • 5.2 MARKET DYNAMICS
    DRIVERS
    - Increasing adoption of industry 4.0 principles in manufacturing sector
    - Growing demand for predictive maintenance and analytics
    - Surging adoption of motor monitoring in transportation sector, especially in electric vehicles
    - Increasing adoption of wireless technology in motor monitoring
    RESTRAINTS
    - Limited technical know-how to manage monitoring solutions
    - Hesitation to adopt monitoring solutions due to high initial investment, especially in developing countries
    OPPORTUNITIES
    - Growing focus on energy audits and regulations worldwide
    - Growing demand from aerospace and automotive industries
    - Advent of intelligent transportation systems (ITS)
    CHALLENGES
    - Long payback period on investment
  • 5.3 TRENDS/DISRUPTIONS IMPACTING CUSTOMER BUSINESS
  • 5.4 ECOSYSTEM/MARKET MAP
  • 5.5 VALUE CHAIN ANALYSIS
  • 5.6 RAW MATERIAL PROVIDERS/SUPPLIERS/COMPONENT MANUFACTURERS
    MONITORING SOLUTION MANUFACTURERS/ASSEMBLERS
    DISTRIBUTORS/RESELLERS
    END USERS
    MAINTENANCE AND SERVICE PROVIDERS
  • 5.7 TECHNOLOGY ANALYSIS
    CONDITION MONITORING
    REMOTE VIBRATION MONITORING AND FAULT DIAGNOSIS SYSTEMS
  • 5.8 PRICING ANALYSIS
  • 5.9 TARIFFS, CODES, AND REGULATIONS
    TARIFF ANALYSIS
    CODES AND REGULATIONS RELATED TO MOTOR MONITORING
  • 5.10 PATENT ANALYSIS
  • 5.11 TRADE ANALYSIS
    EXPORT SCENARIO FOR HS CODE 9031
    IMPORT SCENARIO FOR HS CODE 9031
  • 5.12 KEY CONFERENCES AND EVENTS, 2023–2024
  • 5.13 CASE STUDY ANALYSIS
    EMERSON’S ONLINE MACHINERY HEALTH MONITORING HELPS PHOSPHATE MINE PROTECT CRITICAL ASSETS AND AVOID DOWNTIME
    FAULT DETECTION IN COMPONENTS OF SYNCHRONOUS MOTORS WITH PARTIAL DISCHARGE MONITORING
    SIEMENS PROVIDED HIGH-PRECISION MOTOR MONITORING FOR ENGINE TEST BENCHES
  • 5.14 PORTER’S FIVE FORCES ANALYSIS
    THREAT OF SUBSTITUTES
    BARGAINING POWER OF SUPPLIERS
    BARGAINING POWER OF BUYERS
    THREAT OF NEW ENTRANTS
    INTENSITY OF COMPETITIVE RIVALRY
MOTOR MONITORING MARKET, BY END-USER INDUSTRY
82
  • 6.1 INTRODUCTION
  • 6.2 OIL & GAS
    REMOTE PLANT LOCATIONS AND HIGH SAFETY STANDARDS TO NECESSITATE DEPLOYMENT OF MOTOR MONITORING SOLUTIONS
  • 6.3 METALS & MINING
    CONCERNS OVER RELIABILITY AND SAFETY IN MINING OPERATIONS TO DRIVE DEMAND FOR MOTOR MONITORING
  • 6.4 POWER GENERATION
    INCREASING PENETRATION OF INFORMATION TECHNOLOGY IN POWER GENERATION TO DRIVE MARKET
  • 6.5 AUTOMOTIVE
    INCREASING DEMAND FOR EVS AND EFFICIENT MANUFACTURING PROCESS TO DRIVE MARKET FOR MOTOR MONITORING
  • 6.6 CHEMICALS
    NEED TO REDUCE EXPENSIVE DOWNTIME IN CHEMICAL PRODUCTION TO AUGMENT DEMAND FOR MOTOR MONITORING SYSTEMS
  • 6.7 WATER & WASTEWATER TREATMENT
    INTENSIFYING NEED TO OPTIMIZE WATER SUPPLY AND WASTEWATER TREATMENT PROCESSES TO FUEL DEMAND FOR MOTOR MONITORING
  • 6.8 FOOD & BEVERAGES
    NEED TO IMPROVE PERFORMANCE OF CRITICAL ASSETS TO DRIVE DEMAND FOR MOTOR MONITORING SOLUTIONS
  • 6.9 AEROSPACE & DEFENSE
    NEED TO PREVENT FAILURE OF CRITICAL ASSETS DUE TO MOTOR FAILURE TO FUEL DEMAND FOR MOTOR MONITORING SOLUTIONS
  • 6.10 OTHER END-USER INDUSTRIES
MOTOR MONITORING MARKET, BY OFFERING
96
  • 7.1 INTRODUCTION
  • 7.2 HARDWARE
    VIBRATION SENSORS
    - Need to detect mechanical issues in motors to prevent downtime to fuel adoption of vibration sensors
    INFRARED SENSORS
    - Ability to identify anomalous patterns causing asset failure to induce demand for thermal monitoring of motors
    CORROSION PROBES
    - Ever-present risk of corrosion in motors to increase demand for corrosion probes
    ULTRASOUND DETECTORS
    - Rising need for non-invasive ways to detect problems in machinery to fuel demand for ultrasound detectors
    SPECTRUM ANALYZERS
    - Increasing demand for wireless communication to boost need for spectrum analyzers
  • 7.3 SOFTWARE
    INCREASING FOCUS ON PREDICTIVE MAINTENANCE TO FUEL DEMAND FOR MOTOR MONITORING SOFTWARE
    ANALYTICS SOFTWARE
    DIAGNOSTIC SOFTWARE
  • 7.4 SERVICES
    TRAINING SERVICES
    - Growth in motor monitoring market to drive demand for training services
    DATA ANALYSIS SERVICES
    - Advent of remote monitoring to boost demand for data analysis services
    TECHNICAL SUPPORT & MAINTENANCE SERVICES
    - Increasing focus on extending life of motors to boost need for maintenance services
MOTOR MONITORING MARKET, BY DEPLOYMENT
105
  • 8.1 INTRODUCTION
  • 8.2 ON-PREMISE
    NEED FOR FULL CONTROL OVER SENSITIVE DATA TO FUEL DEMAND FOR ON-PREMISE DEPLOYMENT OF MOTOR MONITORING SOLUTIONS
  • 8.3 CLOUD
    EASE OF DEPLOYMENT AND SCALABILITY TO DRIVE DEMAND FOR CLOUD-BASED MOTOR MONITORING SOLUTIONS
MOTOR MONITORING MARKET, BY MONITORING PROCESS
110
  • 9.1 INTRODUCTION
  • 9.2 ONLINE
    RISING EMPHASIS ON ELIMINATING IN-PERSON INSPECTIONS IN REMOTE LOCATIONS TO DRIVE DEMAND FOR ONLINE MONITORING
  • 9.3 OFFLINE/PORTABLE
    RISING DEMAND FOR COST-EFFICIENT MONITORING OF AGING MACHINES TO PROPEL SEGMENTAL GROWTH
MOTOR MONITORING MARKET, BY REGION
115
  • 10.1 INTRODUCTION
  • 10.2 ASIA PACIFIC
    CHINA
    - Rapid growth of manufacturing sector to drive market
    JAPAN
    - Demand from automotive sector to boost market growth
    SOUTH KOREA
    - Government policies aimed at boosting advanced manufacturing to support market growth
    INDIA
    - Government initiatives to boost manufacturing to increase demand for motor monitoring
    AUSTRALIA
    - Increase in minerals and resource mining to induce demand for motor monitoring solutions
    REST OF ASIA PACIFIC
  • 10.3 NORTH AMERICA
    US
    - Initiatives to promote adoption of Industry 4.0 technologies to drive market
    CANADA
    - Growing investments in mining and power generation industries to boost demand for motor monitoring solutions
    MEXICO
    - Increasing investments in metals and mining vertical to fuel demand for motor monitoring solutions in Mexico
  • 10.4 EUROPE
    GERMANY
    - Increasing penetration of industrial IoT to fuel demand for motor monitoring
    UK
    - Push toward clean energy and innovations to drive market
    FRANCE
    - Increasing investments in power generation industry to drive demand for motor monitoring solutions
    RUSSIA
    - Government policies to boost EVs industry to support market growth
    REST OF EUROPE
  • 10.5 MIDDLE EAST & AFRICA
    SAUDI ARABIA
    - Demand from oil & gas industry to drive market
    UAE
    - Government focus on boosting manufacturing sector to contribute to market growth
    TURKEY
    - Demand from agriculture industry to bring revenue opportunities for motor monitoring market players
    QATAR
    - Rising industrial activities to offer growth opportunities for motor monitoring solution providers
    SOUTH AFRICA
    - Increasing demand from mining industry to substantiate market growth
    REST OF MEA
COMPETITIVE LANDSCAPE
241
  • 11.1 OVERVIEW
  • 11.2 MARKET SHARE ANALYSIS
  • 11.3 REVENUE ANALYSIS
  • 11.4 COMPANY EVALUATION MATRIX
    STARS
    PERVASIVE PLAYERS
    EMERGING LEADERS
    PARTICIPANTS
  • 11.5 COMPANY FOOTPRINT
  • 11.6 START-UP/SME EVALUATION MATRIX
    PROGRESSIVE COMPANIES
    RESPONSIVE COMPANIES
    DYNAMIC COMPANIES
    STARTING BLOCKS
    COMPETITIVE BENCHMARKING
  • 11.7 COMPETITIVE SCENARIOS AND TRENDS
COMPANY PROFILES
259
  • 12.1 KEY PLAYERS
    ABB
    - Business overview
    - Products/Solutions/Services offered
    - Recent developments
    - MnM view
    GENERAL ELECTRIC
    - Business overview
    - Products/Solutions/Services offered
    - Recent developments
    - MnM view
    SIEMENS
    - Business overview
    - Products/Solutions/Services offered
    - Recent developments
    - MnM view
    HONEYWELL INTERNATIONAL INC.
    - Business overview
    - Products/Solutions/Services offered
    - Recent developments
    - MnM view
    SCHNEIDER ELECTRIC
    - Business overview
    - Products/Solutions/Services offered
    - Recent developments
    - MnM view
    BANNER ENGINEERING CORP.
    - Business overview
    - Products/Solutions/Services offered
    - Recent developments
    WILSON TRANSFORMERS
    - Business overview
    - Products/Solutions/Services offered
    SKF
    - Business overview
    - Products/Solutions/Services offered
    - Recent developments
    EMERSON ELECTRIC CO.
    - Business overview
    - Products/Solutions/Services offered
    - Recent developments
    ROCKWELL AUTOMATION
    - Business overview
    - Products/Solutions/Services offered
    - Recent developments
    QUALITROL COMPANY LLC
    - Business overview
    - Products/Solutions/Services offered
    WEG
    - Business overview
    - Products/Solutions/Services offered
    - Recent developments
    MITSUBISHI ELECTRIC CORPORATION
    - Business overview
    - Products/Solutions/Services offered
    - Recent developments
    EATON
    - Business overview
    - Products/Solutions/Services offered
    - Recent developments
    ADVANTECH CO., LTD.
    - Business overview
    - Products/Solutions/Services offered
    - Recent developments
  • 12.2 OTHER PLAYERS
    DYNAPAR
    KCF TECHNOLOGIES
    PHOENIX CONTACT
    ALLIED RELIABILITY
    KONCAR– ELECTRICAL ENGINEERING INSTITUTE
APPENDIX
332
  • 13.1 INSIGHTS FROM INDUSTRY EXPERTS
  • 13.2 DISCUSSION GUIDE
  • 13.3 KNOWLEDGESTORE: MARKETSANDMARKETS’ SUBSCRIPTION PORTAL
  • 13.4 CUSTOMIZATION OPTIONS
  • 13.5 RELATED REPORTS
  • 13.6 AUTHOR DETAILS
LIST OF TABLES
 
  • TABLE 1 MOTOR MONITORING MARKET, BY OFFERING: INCLUSIONS & EXCLUSIONS
  • TABLE 2 MARKET, BY MONITORING PROCESS: INCLUSIONS & EXCLUSIONS
  • TABLE 3 MARKET, BY END-USER INDUSTRIES: INCLUSIONS & EXCLUSIONS
  • TABLE 4 MARKET, BY DEPLOYMENT: INCLUSIONS & EXCLUSIONS
  • TABLE 5 MARKET SNAPSHOT
  • TABLE 6 MARKET: ROLE OF PLAYERS IN ECOSYSTEM
  • TABLE 7 ASP OF MOTOR MONITORING SYSTEMS, BY MONITORING PROCESS, 2021–2023 (USD/UNIT)
  • TABLE 8 ASP TREND FOR MOTOR MONITORING SYSTEMS, BY REGION, 2021–2023 (USD/UNIT)
  • TABLE 9 TARIFF FOR HS CODE 9031
  • TABLE 10 MOTOR MONITORING: CODES AND REGULATIONS
  • TABLE 11 GLOBAL: LIST OF REGULATORY BODIES, GOVERNMENT AGENCIES, AND OTHER ORGANIZATIONS
  • TABLE 12 MARKET: INNOVATIONS AND PATENT REGISTRATIONS
  • TABLE 13 EXPORT DATA FOR HS CODE 9031-COMPLIANT PRODUCTS, BY COUNTRY, 2020–2022 (USD THOUSAND)
  • TABLE 14 IMPORT DATA FOR HS CODE 9031-COMPLIANT PRODUCTS, BY COUNTRY, 2020–2022 (USD THOUSAND)
  • TABLE 15 MARKET: LIST OF CONFERENCES AND EVENTS
  • TABLE 16 MARKET: IMPACT OF PORTER’S FIVE FORCES
  • TABLE 17 MARKET, BY END-USER INDUSTRY, 2019–2022 (USD MILLION)
  • TABLE 18 MARKET, BY END-USER INDUSTRY, 2023–2028 (USD MILLION)
  • TABLE 19 OIL & GAS: MARKET, BY REGION, 2019–2022 (USD MILLION)
  • TABLE 20 OIL & GAS: MARKET, BY REGION, 2023–2028 (USD MILLION)
  • TABLE 21 METALS & MINING: MARKET, BY REGION, 2019–2022 (USD MILLION)
  • TABLE 22 METALS & MINING: MARKET, BY REGION, 2023–2028 (USD MILLION)
  • TABLE 23 POWER GENERATION: MARKET, BY REGION, 2019–2022 (USD MILLION)
  • TABLE 24 POWER GENERATION: MARKET, BY REGION, 2023–2028 (USD MILLION)
  • TABLE 25 AUTOMOTIVE: MARKET, BY REGION, 2019–2022 (USD MILLION)
  • TABLE 26 AUTOMOTIVE: MARKET, BY REGION, 2023–2028 (USD MILLION)
  • TABLE 27 CHEMICALS: MARKET, BY REGION, 2019–2022 (USD MILLION)
  • TABLE 28 CHEMICALS: MARKET, BY REGION, 2023–2028 (USD MILLION)
  • TABLE 29 WATER & WASTEWATER TREATMENT: MARKET, BY REGION, 2019–2022 (USD MILLION)
  • TABLE 30 WATER & WASTEWATER TREATMENT: MARKET, BY REGION, 2023–2028 (USD MILLION)
  • TABLE 31 FOOD & BEVERAGES: MARKET, BY REGION, 2019–2022 (USD MILLION)
  • TABLE 32 FOOD & BEVERAGES: MARKET, BY REGION, 2023–2028 (USD MILLION)
  • TABLE 33 AEROSPACE & DEFENSE: MARKET, BY REGION, 2019–2022 (USD MILLION)
  • TABLE 34 AEROSPACE & DEFENSE: MARKET, BY REGION, 2023–2028 (USD MILLION)
  • TABLE 35 OTHER END-USER INDUSTRIES: MARKET, BY REGION, 2019–2022 (USD MILLION)
  • TABLE 36 OTHER END-USER INDUSTRIES: MARKET, BY REGION, 2023–2028 (USD MILLION)
  • TABLE 37 MARKET, BY OFFERING, 2019–2022 (USD MILLION)
  • TABLE 38 MARKET, BY OFFERING, 2023–2028 (USD MILLION)
  • TABLE 39 HARDWARE: MARKET, BY REGION, 2019–2022 (USD MILLION)
  • TABLE 40 HARDWARE: MARKET, BY REGION, 2023–2028 (USD MILLION)
  • TABLE 41 HARDWARE: MARKET, BY TYPE, 2019–2022 (USD MILLION)
  • TABLE 42 HARDWARE: MARKET, BY TYPE, 2023–2028 (USD MILLION)
  • TABLE 43 SOFTWARE: MARKET, BY REGION, 2019–2022 (USD MILLION)
  • TABLE 44 SOFTWARE: MARKET, BY REGION, 2023–2028 (USD MILLION)
  • TABLE 45 SOFTWARE: MARKET, BY TYPE, 2019–2022 (USD MILLION)
  • TABLE 46 SOFTWARE: MARKET, BY TYPE, 2023–2028 (USD MILLION)
  • TABLE 47 SERVICES: MARKET, BY REGION, 2019–2022 (USD MILLION)
  • TABLE 48 SERVICES: MARKET, BY REGION, 2023–2028 (USD MILLION)
  • TABLE 49 SERVICES: MARKET, BY TYPE, 2019–2022 (USD MILLION)
  • TABLE 50 SERVICES: MARKET, BY TYPE, 2023–2028 (USD MILLION)
  • TABLE 51 MARKET, BY DEPLOYMENT, 2019–2022 (USD MILLION)
  • TABLE 52 MARKET, BY DEPLOYMENT, 2023–2028 (USD MILLION)
  • TABLE 53 ON-PREMISE: MARKET, BY REGION, 2019–2022 (USD MILLION)
  • TABLE 54 ON-PREMISE: MARKET, BY REGION, 2023–2028 (USD MILLION)
  • TABLE 55 CLOUD: MARKET, BY REGION, 2019–2022 (USD MILLION)
  • TABLE 56 CLOUD: MARKET, BY REGION, 2023–2028 (USD MILLION)
  • TABLE 57 MARKET, BY MONITORING PROCESS, 2019–2022 (USD MILLION)
  • TABLE 58 MARKET, BY MONITORING PROCESS, 2023–2028 (USD MILLION)
  • TABLE 59 ONLINE: MARKET, BY REGION, 2019–2022 (USD MILLION)
  • TABLE 60 ONLINE: MARKET, BY REGION, 2023–2028 (USD MILLION)
  • TABLE 61 OFFLINE/PORTABLE: MARKET, BY REGION, 2019–2022 (USD MILLION)
  • TABLE 62 OFFLINE/PORTABLE: MARKET, BY REGION, 2023–2028 (USD MILLION)
  • TABLE 63 MARKET, BY REGION, 2019–2022 (USD MILLION)
  • TABLE 64 MARKET, BY REGION, 2023–2028 (USD MILLION)
  • TABLE 65 ASIA PACIFIC: MARKET, BY OFFERING, 2019–2022 (USD MILLION)
  • TABLE 66 ASIA PACIFIC: MARKET, BY OFFERING, 2023–2028 (USD MILLION)
  • TABLE 67 ASIA PACIFIC: MARKET FOR HARDWARE, BY TYPE, 2019–2022 (USD MILLION)
  • TABLE 68 ASIA PACIFIC: MARKET FOR HARDWARE, BY TYPE, 2023–2028 (USD MILLION)
  • TABLE 69 ASIA PACIFIC: MOTOR MONITORING MARKE FOR SOFTWARE, BY TYPE, 2019–2022 (USD MILLION)
  • TABLE 70 ASIA PACIFIC: MOTOR MONITORING MARKE FOR SOFTWARE, BY TYPE, 2023–2028 (USD MILLION)
  • TABLE 71 ASIA PACIFIC: MARKET FOR SERVICES, BY TYPE, 2019–2022 (USD MILLION)
  • TABLE 72 ASIA PACIFIC: MARKET FOR SERVICES, BY TYPE, 2023–2028 (USD MILLION)
  • TABLE 73 ASIA PACIFIC: MARKET, BY DEPLOYMENT, 2019–2022 (USD MILLION)
  • TABLE 74 ASIA PACIFIC: MARKET, BY DEPLOYMENT, 2023–2028 (USD MILLION)
  • TABLE 75 ASIA PACIFIC: MARKET, BY MONITORING PROCESS, 2019–2022 (USD MILLION)
  • TABLE 76 ASIA PACIFIC: MARKET, BY MONITORING PROCESS, 2023–2028 (USD MILLION)
  • TABLE 77 ASIA PACIFIC: MARKET, BY END-USER INDUSTRY, 2019–2022 (USD MILLION)
  • TABLE 78 ASIA PACIFIC: MARKET, BY END-USER INDUSTRY, 2023–2028 (USD MILLION)
  • TABLE 79 ASIA PACIFIC: MARKET, BY COUNTRY, 2019–2022 (USD MILLION)
  • TABLE 80 ASIA PACIFIC: MARKET, BY COUNTRY, 2023–2028 (USD MILLION)
  • TABLE 81 CHINA: MARKET, BY OFFERING, 2019–2022 (USD MILLION)
  • TABLE 82 CHINA: MARKET, BY OFFERING, 2023–2028 (USD MILLION)
  • TABLE 83 CHINA: MARKET FOR HARDWARE, BY TYPE, 2019–2022 (USD MILLION)
  • TABLE 84 CHINA: MARKET FOR HARDWARE, BY TYPE, 2023–2028 (USD MILLION)
  • TABLE 85 CHINA: MOTOR MONITORING MARKE FOR SOFTWARE, BY TYPE, 2019–2022 (USD MILLION)
  • TABLE 86 CHINA: MOTOR MONITORING MARKE FOR SOFTWARE, BY TYPE, 2023–2028 (USD MILLION)
  • TABLE 87 CHINA: MARKET FOR SERVICES, BY TYPE, 2019–2022 (USD MILLION)
  • TABLE 88 CHINA: MARKET FOR SERVICES, BY TYPE, 2023–2028 (USD MILLION)
  • TABLE 89 CHINA: MARKET, BY DEPLOYMENT, 2019–2022 (USD MILLION)
  • TABLE 90 CHINA: MARKET, BY DEPLOYMENT, 2023–2028 (USD MILLION)
  • TABLE 91 CHINA: MARKET, BY MONITORING PROCESS, 2019–2022 (USD MILLION)
  • TABLE 92 CHINA: MARKET, BY MONITORING PROCESS, 2023–2028 (USD MILLION)
  • TABLE 93 CHINA: MARKET, BY END-USER INDUSTRY, 2019–2022 (USD MILLION)
  • TABLE 94 CHINA: MARKET, BY END-USER INDUSTRY, 2023–2028 (USD MILLION)
  • TABLE 95 JAPAN: MARKET, BY OFFERING, 2019–2022 (USD MILLION)
  • TABLE 96 JAPAN: MARKET, BY OFFERING, 2023–2028 (USD MILLION)
  • TABLE 97 JAPAN: MARKET FOR HARDWARE, BY TYPE, 2019–2022 (USD MILLION)
  • TABLE 98 JAPAN: MARKET FOR HARDWARE, BY TYPE, 2023–2028 (USD MILLION)
  • TABLE 99 JAPAN: MOTOR MONITORING MARKE FOR SOFTWARE, BY TYPE, 2019–2022 (USD MILLION)
  • TABLE 100 JAPAN: MOTOR MONITORING MARKE FOR SOFTWARE, BY TYPE, 2023–2028 (USD MILLION)
  • TABLE 101 JAPAN: MARKET FOR SERVICES, BY TYPE, 2019–2022 (USD MILLION)
  • TABLE 102 JAPAN: MARKET FOR SERVICES, BY TYPE, 2023–2028 (USD MILLION)
  • TABLE 103 JAPAN: MARKET, BY DEPLOYMENT, 2019–2022 (USD MILLION)
  • TABLE 104 JAPAN: MARKET, BY DEPLOYMENT, 2023–2028 (USD MILLION)
  • TABLE 105 JAPAN: MARKET, BY MONITORING PROCESS, 2019–2022 (USD MILLION)
  • TABLE 106 JAPAN: MARKET, BY MONITORING PROCESS, 2023–2028 (USD MILLION)
  • TABLE 107 JAPAN: MARKET, BY END-USER INDUSTRY, 2019–2022 (USD MILLION)
  • TABLE 108 JAPAN: MARKET, BY END-USER INDUSTRY, 2023–2028 (USD MILLION)
  • TABLE 109 SOUTH KOREA: MARKET, BY OFFERING, 2019–2022 (USD MILLION)
  • TABLE 110 SOUTH KOREA: MARKET, BY OFFERING, 2023–2028 (USD MILLION)
  • TABLE 111 SOUTH KOREA: MARKET FOR HARDWARE, BY TYPE, 2019–2022 (USD MILLION)
  • TABLE 112 SOUTH KOREA: MARKET FOR HARDWARE, BY TYPE, 2023–2028 (USD MILLION)
  • TABLE 113 SOUTH KOREA: MARKET FOR SOFTWARE, BY TYPE, 2019–2022 (USD MILLION)
  • TABLE 114 SOUTH KOREA: MARKET FOR SOFTWARE, BY TYPE, 2023–2028 (USD MILLION)
  • TABLE 115 SOUTH KOREA: MARKET FOR SERVICES, BY TYPE, 2019–2022 (USD MILLION)
  • TABLE 116 SOUTH KOREA: MARKET FOR SERVICES, BY TYPE, 2023–2028 (USD MILLION)
  • TABLE 117 SOUTH KOREA: MARKET, BY DEPLOYMENT, 2019–2022 (USD MILLION)
  • TABLE 118 SOUTH KOREA: MARKET, BY DEPLOYMENT, 2023–2028 (USD MILLION)
  • TABLE 119 SOUTH KOREA: MARKET, BY MONITORING PROCESS, 2019–2022 (USD MILLION)
  • TABLE 120 SOUTH KOREA: MARKET, BY MONITORING PROCESS, 2023–2028 (USD MILLION)
  • TABLE 121 SOUTH KOREA: MARKET, BY END-USER INDUSTRY, 2019–2022 (USD MILLION)
  • TABLE 122 SOUTH KOREA: MARKET, BY END-USER INDUSTRY, 2023–2028 (USD MILLION)
  • TABLE 123 INDIA: MARKET, BY OFFERING, 2019–2022 (USD MILLION)
  • TABLE 124 INDIA: MARKET, BY OFFERING, 2023–2028 (USD MILLION)
  • TABLE 125 INDIA: MARKET FOR HARDWARE, BY TYPE, 2019–2022 (USD MILLION)
  • TABLE 126 INDIA: MARKET FOR HARDWARE, BY TYPE, 2023–2028 (USD MILLION)
  • TABLE 127 INDIA: MOTOR MONITORING MARKE FOR SOFTWARE, BY TYPE, 2019–2022 (USD MILLION)
  • TABLE 128 INDIA: MOTOR MONITORING MARKE FOR SOFTWARE, BY TYPE, 2023–2028 (USD MILLION)
  • TABLE 129 INDIA: MARKET FOR SERVICES, BY TYPE, 2019–2022 (USD MILLION)
  • TABLE 130 INDIA: MARKET FOR SERVICES, BY TYPE, 2023–2028 (USD MILLION)
  • TABLE 131 INDIA: MARKET, BY DEPLOYMENT, 2019–2022 (USD MILLION)
  • TABLE 132 INDIA: MARKET, BY DEPLOYMENT, 2023–2028 (USD MILLION)
  • TABLE 133 INDIA: MARKET, BY MONITORING PROCESS, 2019–2022 (USD MILLION)
  • TABLE 134 INDIA: MARKET, BY MONITORING PROCESS, 2023–2028 (USD MILLION)
  • TABLE 135 INDIA: MARKET, BY END-USER INDUSTRY, 2019–2022 (USD MILLION)
  • TABLE 136 INDIA: MARKET, BY END-USER INDUSTRY, 2023–2028 (USD MILLION)
  • TABLE 137 AUSTRALIA: MARKET, BY OFFERING, 2019–2022 (USD MILLION)
  • TABLE 138 AUSTRALIA: MARKET, BY OFFERING, 2023–2028 (USD MILLION)
  • TABLE 139 AUSTRALIA: MARKET FOR HARDWARE, BY TYPE, 2019–2022 (USD MILLION)
  • TABLE 140 AUSTRALIA: MARKET FOR HARDWARE, BY TYPE, 2023–2028 (USD MILLION)
  • TABLE 141 AUSTRALIA: MARKET FOR SOFTWARE, BY TYPE, 2019–2022 (USD MILLION)
  • TABLE 142 AUSTRALIA: MARKET FOR SOFTWARE, BY TYPE, 2023–2028 (USD MILLION)
  • TABLE 143 AUSTRALIA: MARKET FOR SERVICES, BY TYPE, 2019–2022 (USD MILLION)
  • TABLE 144 AUSTRALIA: MARKET FOR SERVICES, BY TYPE, 2023–2028 (USD MILLION)
  • TABLE 145 AUSTRALIA: MARKET, BY DEPLOYMENT, 2019–2022 (USD MILLION)
  • TABLE 146 AUSTRALIA: MARKET, BY DEPLOYMENT, 2023–2028 (USD MILLION)
  • TABLE 147 AUSTRALIA: MARKET, BY MONITORING PROCESS, 2019–2022 (USD MILLION)
  • TABLE 148 AUSTRALIA: MARKET, BY MONITORING PROCESS, 2023–2028 (USD MILLION)
  • TABLE 149 AUSTRALIA: MARKET, BY END-USER INDUSTRY, 2019–2022 (USD MILLION)
  • TABLE 150 AUSTRALIA: MARKET, BY END-USER INDUSTRY, 2023–2028 (USD MILLION)
  • TABLE 151 REST OF ASIA PACIFIC: MARKET, BY OFFERING, 2019–2022 (USD MILLION)
  • TABLE 152 REST OF ASIA PACIFIC: MARKET, BY OFFERING, 2023–2028 (USD MILLION)
  • TABLE 153 REST OF ASIA PACIFIC: MARKET FOR HARDWARE, BY TYPE, 2019–2022 (USD MILLION)
  • TABLE 154 REST OF ASIA PACIFIC: MARKET FOR HARDWARE, BY TYPE, 2023–2028 (USD MILLION)
  • TABLE 155 REST OF ASIA PACIFIC: MOTOR MONITORING MARKE FOR SOFTWARE, BY TYPE, 2019–2022 (USD MILLION)
  • TABLE 156 REST OF ASIA PACIFIC: MOTOR MONITORING MARKE FOR SOFTWARE, BY TYPE, 2023–2028 (USD MILLION)
  • TABLE 157 REST OF ASIA PACIFIC: MARKET FOR SERVICES, BY TYPE, 2019–2022 (USD MILLION)
  • TABLE 158 REST OF ASIA PACIFIC: MARKET FOR SERVICES, BY TYPE, 2023–2028 (USD MILLION)
  • TABLE 159 REST OF ASIA PACIFIC: MARKET, BY DEPLOYMENT, 2019–2022 (USD MILLION)
  • TABLE 160 REST OF ASIA PACIFIC: MARKET, BY DEPLOYMENT, 2023–2028 (USD MILLION)
  • TABLE 161 REST OF ASIA PACIFIC: MARKET, BY MONITORING PROCESS, 2019–2022 (USD MILLION)
  • TABLE 162 REST OF ASIA PACIFIC: MARKET, BY MONITORING PROCESS, 2023–2028 (USD MILLION)
  • TABLE 163 REST OF ASIA PACIFIC: MARKET, BY END-USER INDUSTRY, 2019–2022 (USD MILLION)
  • TABLE 164 REST OF ASIA PACIFIC: MARKET, BY END-USER INDUSTRY, 2023–2028 (USD MILLION)
  • TABLE 165 NORTH AMERICA: MARKET, BY OFFERING, 2019–2022 (USD MILLION)
  • TABLE 166 NORTH AMERICA: MARKET, BY OFFERING, 2023–2028 (USD MILLION)
  • TABLE 167 NORTH AMERICA: MARKET FOR HARDWARE, BY TYPE, 2019–2022 (USD MILLION)
  • TABLE 168 NORTH AMERICA: MARKET FOR HARDWARE, BY TYPE, 2023–2028 (USD MILLION)
  • TABLE 169 NORTH AMERICA: MOTOR MONITORING MARKE FOR SOFTWARE, BY TYPE, 2019–2022 (USD MILLION)
  • TABLE 170 NORTH AMERICA: MOTOR MONITORING MARKE FOR SOFTWARE, BY TYPE, 2023–2028 (USD MILLION)
  • TABLE 171 NORTH AMERICA: MARKET FOR SERVICES, BY TYPE, 2019–2022 (USD MILLION)
  • TABLE 172 NORTH AMERICA: MARKET FOR SERVICES, BY TYPE, 2023–2028 (USD MILLION)
  • TABLE 173 NORTH AMERICA: MARKET, BY DEPLOYMENT, 2019–2022 (USD MILLION)
  • TABLE 174 NORTH AMERICA: MARKET, BY DEPLOYMENT, 2023–2028 (USD MILLION)
  • TABLE 175 NORTH AMERICA: MARKET, BY MONITORING PROCESS, 2019–2022 (USD MILLION)
  • TABLE 176 NORTH AMERICA: MARKET, BY MONITORING PROCESS, 2023–2028 (USD MILLION)
  • TABLE 177 NORTH AMERICA: MARKET, BY END-USER INDUSTRY, 2019–2022 (USD MILLION)
  • TABLE 178 NORTH AMERICA: MARKET, BY END-USER INDUSTRY, 2023–2028 (USD MILLION)
  • TABLE 179 NORTH AMERICA: MARKET, BY COUNTRY, 2019–2022 (USD MILLION)
  • TABLE 180 NORTH AMERICA: MARKET, BY COUNTRY, 2023–2028 (USD MILLION)
  • TABLE 181 US: MARKET, BY OFFERING, 2019–2022 (USD MILLION)
  • TABLE 182 US: MARKET, BY OFFERING, 2023–2028 (USD MILLION)
  • TABLE 183 US: MARKET FOR HARDWARE, BY TYPE, 2019–2022 (USD MILLION)
  • TABLE 184 US: MARKET FOR HARDWARE, BY TYPE, 2023–2028 (USD MILLION)
  • TABLE 185 US: MARKET FOR SOFTWARE, BY TYPE, 2019–2022 (USD MILLION)
  • TABLE 186 US: MARKET FOR SOFTWARE, BY TYPE, 2023–2028 (USD MILLION)
  • TABLE 187 US: MARKET FOR SERVICES, BY TYPE, 2019–2022 (USD MILLION)
  • TABLE 188 US: MARKET FOR SERVICES, BY TYPE, 2023–2028 (USD MILLION)
  • TABLE 189 US: MARKET, BY DEPLOYMENT, 2019–2022 (USD MILLION)
  • TABLE 190 US: MARKET, BY DEPLOYMENT, 2023–2028 (USD MILLION)
  • TABLE 191 US: MARKET, BY MONITORING PROCESS, 2019–2022 (USD MILLION)
  • TABLE 192 US: MARKET, BY MONITORING PROCESS, 2023–2028 (USD MILLION)
  • TABLE 193 US: MARKET, BY END-USER INDUSTRY, 2019–2022 (USD MILLION)
  • TABLE 194 US: MARKET, BY END-USER INDUSTRY, 2023–2028 (USD MILLION)
  • TABLE 195 CANADA: MARKET, BY OFFERING, 2019–2022 (USD MILLION)
  • TABLE 196 CANADA: MARKET, BY OFFERING, 2023–2028 (USD MILLION)
  • TABLE 197 CANADA: MARKET FOR HARDWARE, BY TYPE, 2019–2022 (USD MILLION)
  • TABLE 198 CANADA: MARKET FOR HARDWARE, BY TYPE, 2023–2028 (USD MILLION)
  • TABLE 199 CANADA: MOTOR MONITORING MARKE FOR SOFTWARE, BY TYPE, 2019–2022 (USD MILLION)
  • TABLE 200 CANADA: MOTOR MONITORING MARKE FOR SOFTWARE, BY TYPE, 2023–2028 (USD MILLION)
  • TABLE 201 CANADA: MARKET FOR SERVICES, BY TYPE, 2019–2022 (USD MILLION)
  • TABLE 202 CANADA: MARKET FOR SERVICES, BY TYPE, 2023–2028 (USD MILLION)
  • TABLE 203 CANADA: MARKET, BY DEPLOYMENT, 2019–2022 (USD MILLION)
  • TABLE 204 CANADA: MARKET, BY DEPLOYMENT, 2023–2028 (USD MILLION)
  • TABLE 205 CANADA: MARKET, BY MONITORING PROCESS, 2019–2022 (USD MILLION)
  • TABLE 206 CANADA: MARKET, BY MONITORING PROCESS, 2023–2028 (USD MILLION)
  • TABLE 207 CANADA: MARKET, BY END-USER INDUSTRY, 2019–2022 (USD MILLION)
  • TABLE 208 CANADA: MARKET, BY END-USER INDUSTRY, 2023–2028 (USD MILLION)
  • TABLE 209 MEXICO: MARKET, BY OFFERING, 2019–2022 (USD MILLION)
  • TABLE 210 MEXICO: MARKET, BY OFFERING, 2023–2028 (USD MILLION)
  • TABLE 211 MEXICO: MARKET FOR HARDWARE, BY TYPE, 2019–2022 (USD MILLION)
  • TABLE 212 MEXICO: MARKET FOR HARDWARE, BY TYPE, 2023–2028 (USD MILLION)
  • TABLE 213 MEXICO: MOTOR MONITORING MARKE FOR SOFTWARE, BY TYPE, 2019–2022 (USD MILLION)
  • TABLE 214 MEXICO: MOTOR MONITORING MARKE FOR SOFTWARE, BY TYPE, 2023–2028 (USD MILLION)
  • TABLE 215 MEXICO: MARKET FOR SERVICES, BY TYPE, 2019–2022 (USD MILLION)
  • TABLE 216 MEXICO: MARKET FOR SERVICES, BY TYPE, 2023–2028 (USD MILLION)
  • TABLE 217 MEXICO: MARKET, BY DEPLOYMENT, 2019–2022 (USD MILLION)
  • TABLE 218 MEXICO: MARKET, BY DEPLOYMENT, 2023–2028 (USD MILLION)
  • TABLE 219 MEXICO: MARKET, BY MONITORING PROCESS, 2019–2022 (USD MILLION)
  • TABLE 220 MEXICO: MARKET, BY MONITORING PROCESS, 2023–2028 (USD MILLION)
  • TABLE 221 MEXICO: MARKET, BY END-USER INDUSTRY, 2019–2022 (USD MILLION)
  • TABLE 222 MEXICO: MARKET, BY END-USER INDUSTRY, 2023–2028 (USD MILLION)
  • TABLE 223 EUROPE: MARKET, BY OFFERING, 2019–2022 (USD MILLION)
  • TABLE 224 EUROPE: MARKET, BY OFFERING, 2023–2028 (USD MILLION)
  • TABLE 225 EUROPE: MARKET FOR HARDWARE, BY TYPE, 2019–2022 (USD MILLION)
  • TABLE 226 EUROPE: MARKET FOR HARDWARE, BY TYPE, 2023–2028 (USD MILLION)
  • TABLE 227 EUROPE: MOTOR MONITORING MARKE FOR SOFTWARE, BY TYPE, 2019–2022 (USD MILLION)
  • TABLE 228 EUROPE: MOTOR MONITORING MARKE FOR SOFTWARE, BY TYPE, 2023–2028 (USD MILLION)
  • TABLE 229 EUROPE: MARKET FOR SERVICES, BY TYPE, 2019–2022 (USD MILLION)
  • TABLE 230 EUROPE: MARKET FOR SERVICES, BY TYPE, 2023–2028 (USD MILLION)
  • TABLE 231 EUROPE: MARKET, BY DEPLOYMENT, 2019–2022 (USD MILLION)
  • TABLE 232 EUROPE: MARKET, BY DEPLOYMENT, 2023–2028 (USD MILLION)
  • TABLE 233 EUROPE: MARKET, BY MONITORING PROCESS, 2019–2022 (USD MILLION)
  • TABLE 234 EUROPE: MARKET, BY MONITORING PROCESS, 2023–2028 (USD MILLION)
  • TABLE 235 EUROPE: MARKET, BY END-USER INDUSTRY, 2019–2022 (USD MILLION)
  • TABLE 236 EUROPE: MARKET, BY END-USER INDUSTRY, 2023–2028 (USD MILLION)
  • TABLE 237 EUROPE: MARKET, BY COUNTRY, 2019–2022 (USD MILLION)
  • TABLE 238 EUROPE: MARKET, BY COUNTRY, 2023–2028 (USD MILLION)
  • TABLE 239 GERMANY: MARKET, BY OFFERING, 2019–2022 (USD MILLION)
  • TABLE 240 GERMANY: MARKET, BY OFFERING, 2023–2028 (USD MILLION)
  • TABLE 241 GERMANY: MARKET FOR HARDWARE, BY TYPE, 2019–2022 (USD MILLION)
  • TABLE 242 GERMANY: MARKET FOR HARDWARE, BY TYPE, 2023–2028 (USD MILLION)
  • TABLE 243 GERMANY: MOTOR MONITORING MARKE FOR SOFTWARE, BY TYPE, 2019–2022 (USD MILLION)
  • TABLE 244 GERMANY: MOTOR MONITORING MARKE FOR SOFTWARE, BY TYPE, 2023–2028 (USD MILLION)
  • TABLE 245 GERMANY: MARKET FOR SERVICES, BY TYPE, 2019–2022 (USD MILLION)
  • TABLE 246 GERMANY: MARKET FOR SERVICES, BY TYPE, 2023–2028 (USD MILLION)
  • TABLE 247 GERMANY: MARKET, BY DEPLOYMENT, 2019–2022 (USD MILLION)
  • TABLE 248 GERMANY: MARKET, BY DEPLOYMENT, 2023–2028 (USD MILLION)
  • TABLE 249 GERMANY: MARKET, BY MONITORING PROCESS, 2019–2022 (USD MILLION)
  • TABLE 250 GERMANY: MARKET, BY MONITORING PROCESS, 2023–2028 (USD MILLION)
  • TABLE 251 GERMANY: MARKET, BY END-USER INDUSTRY, 2019–2022 (USD MILLION)
  • TABLE 252 GERMANY: MARKET, BY END-USER INDUSTRY, 2023–2028 (USD MILLION)
  • TABLE 253 UK: MARKET, BY OFFERING, 2019–2022 (USD MILLION)
  • TABLE 254 UK: MARKET, BY OFFERING, 2023–2028 (USD MILLION)
  • TABLE 255 UK: MARKET FOR HARDWARE, BY TYPE, 2019–2022 (USD MILLION)
  • TABLE 256 UK: MARKET FOR HARDWARE, BY TYPE, 2023–2028 (USD MILLION)
  • TABLE 257 UK: MARKET FOR SOFTWARE, BY TYPE, 2019–2022 (USD MILLION)
  • TABLE 258 UK: MARKET FOR SOFTWARE, BY TYPE, 2023–2028 (USD MILLION)
  • TABLE 259 UK: MARKET FOR SERVICES, BY TYPE, 2019–2022 (USD MILLION)
  • TABLE 260 UK: MARKET FOR SERVICES, BY TYPE, 2023–2028 (USD MILLION)
  • TABLE 261 UK: MARKET, BY DEPLOYMENT, 2019–2022 (USD MILLION)
  • TABLE 262 UK: MARKET, BY DEPLOYMENT, 2023–2028 (USD MILLION)
  • TABLE 263 UK: MARKET, BY MONITORING PROCESS, 2019–2022 (USD MILLION)
  • TABLE 264 UK: MARKET, BY MONITORING PROCESS, 2023–2028 (USD MILLION)
  • TABLE 265 UK: MARKET, BY END-USER INDUSTRY, 2019–2022 (USD MILLION)
  • TABLE 266 UK: MARKET, BY END-USER INDUSTRY, 2023–2028 (USD MILLION)
  • TABLE 267 FRANCE: MARKET, BY OFFERING, 2019–2022 (USD MILLION)
  • TABLE 268 FRANCE: MARKET, BY OFFERING, 2023–2028 (USD MILLION)
  • TABLE 269 FRANCE: MARKET FOR HARDWARE, BY TYPE, 2019–2022 (USD MILLION)
  • TABLE 270 FRANCE: MARKET FOR HARDWARE, BY TYPE, 2023–2028 (USD MILLION)
  • TABLE 271 FRANCE: MARKET FOR SOFTWARE, BY TYPE, 2019–2022 (USD MILLION)
  • TABLE 272 FRANCE: MARKET FOR SOFTWARE, BY TYPE, 2023–2028 (USD MILLION)
  • TABLE 273 FRANCE: MARKET FOR SERVICES, BY TYPE, 2019–2022 (USD MILLION)
  • TABLE 274 FRANCE: MARKET FOR SERVICES, BY TYPE, 2023–2028 (USD MILLION)
  • TABLE 275 FRANCE: MARKET, BY DEPLOYMENT, 2019–2022 (USD MILLION)
  • TABLE 276 FRANCE: MARKET, BY DEPLOYMENT, 2023–2028 (USD MILLION)
  • TABLE 277 FRANCE: MARKET, BY MONITORING PROCESS, 2019–2022 (USD MILLION)
  • TABLE 278 FRANCE: MARKET, BY MONITORING PROCESS, 2023–2028 (USD MILLION)
  • TABLE 279 FRANCE: MARKET, BY END-USER INDUSTRY, 2019–2022 (USD MILLION)
  • TABLE 280 FRANCE: MARKET, BY END-USER INDUSTRY, 2023–2028 (USD MILLION)
  • TABLE 281 RUSSIA: MARKET, BY OFFERING, 2019–2022 (USD MILLION)
  • TABLE 282 RUSSIA: MARKET, BY OFFERING, 2023–2028 (USD MILLION)
  • TABLE 283 RUSSIA: MARKET FOR HARDWARE, BY TYPE, 2019–2022 (USD MILLION)
  • TABLE 284 RUSSIA: MARKET FOR HARDWARE, BY TYPE, 2023–2028 (USD MILLION)
  • TABLE 285 RUSSIA: MARKET FOR SOFTWARE, BY TYPE, 2019–2022 (USD MILLION)
  • TABLE 286 RUSSIA: MARKET FOR SOFTWARE, BY TYPE, 2023–2028 (USD MILLION)
  • TABLE 287 RUSSIA: MARKET FOR SERVICES, BY TYPE, 2019–2022 (USD MILLION)
  • TABLE 288 RUSSIA: MARKET FOR SERVICES, BY TYPE, 2023–2028 (USD MILLION)
  • TABLE 289 RUSSIA: MARKET, BY DEPLOYMENT, 2019–2022 (USD MILLION)
  • TABLE 290 RUSSIA: MARKET, BY DEPLOYMENT, 2023–2028 (USD MILLION)
  • TABLE 291 RUSSIA: MARKET, BY MONITORING PROCESS, 2019–2022 (USD MILLION)
  • TABLE 292 RUSSIA: MARKET, BY MONITORING PROCESS, 2023–2028 (USD MILLION)
  • TABLE 293 RUSSIA: MARKET, BY END-USER INDUSTRY, 2019–2022 (USD MILLION)
  • TABLE 294 RUSSIA: MARKET, BY END-USER INDUSTRY, 2023–2028 (USD MILLION)
  • TABLE 295 REST OF EUROPE: MARKET, BY OFFERING, 2019–2022 (USD MILLION)
  • TABLE 296 REST OF EUROPE: MARKET, BY OFFERING, 2023–2028 (USD MILLION)
  • TABLE 297 REST OF EUROPE: MARKET FOR HARDWARE, BY TYPE, 2019–2022 (USD MILLION)
  • TABLE 298 REST OF EUROPE: MARKET FOR HARDWARE, BY TYPE, 2023–2028 (USD MILLION)
  • TABLE 299 REST OF EUROPE: MARKET FOR SOFTWARE, BY TYPE, 2019–2022 (USD MILLION)
  • TABLE 300 REST OF EUROPE: MARKET FOR SOFTWARE, BY TYPE, 2023–2028 (USD MILLION)
  • TABLE 301 REST OF EUROPE: MARKET FOR SERVICES, BY TYPE, 2019–2022 (USD MILLION)
  • TABLE 302 REST OF EUROPE: MARKET FOR SERVICES, BY TYPE, 2023–2028 (USD MILLION)
  • TABLE 303 REST OF EUROPE: MARKET, BY DEPLOYMENT, 2019–2022 (USD MILLION)
  • TABLE 304 REST OF EUROPE: MARKET, BY DEPLOYMENT, 2023–2028 (USD MILLION)
  • TABLE 305 REST OF EUROPE: MARKET, BY MONITORING PROCESS, 2019–2022 (USD MILLION)
  • TABLE 306 REST OF EUROPE: MARKET, BY MONITORING PROCESS, 2023–2028 (USD MILLION)
  • TABLE 307 REST OF EUROPE: MARKET, BY END-USER INDUSTRY, 2019–2022 (USD MILLION)
  • TABLE 308 REST OF EUROPE: MARKET, BY END-USER INDUSTRY, 2023–2028 (USD MILLION)
  • TABLE 309 MIDDLE EAST & AFRICA: MARKET, BY OFFERING, 2019–2022 (USD MILLION)
  • TABLE 310 MIDDLE EAST & AFRICA: MARKET, BY OFFERING, 2023–2028 (USD MILLION)
  • TABLE 311 MIDDLE EAST & AFRICA: MARKET FOR HARDWARE, BY TYPE, 2019–2022 (USD MILLION)
  • TABLE 312 MIDDLE EAST & AFRICA: MARKET FOR HARDWARE, BY TYPE, 2023–2028 (USD MILLION)
  • TABLE 313 MIDDLE EAST & AFRICA: MOTOR MONITORING MARKE FOR SOFTWARE, BY TYPE, 2019–2022 (USD MILLION)
  • TABLE 314 MIDDLE EAST & AFRICA: MOTOR MONITORING MARKE FOR SOFTWARE, BY TYPE, 2023–2028 (USD MILLION)
  • TABLE 315 MIDDLE EAST & AFRICA: MARKET FOR SERVICES, BY TYPE, 2019–2022 (USD MILLION)
  • TABLE 316 MIDDLE EAST & AFRICA: MARKET FOR SERVICES, BY TYPE, 2023–2028 (USD MILLION)
  • TABLE 317 MIDDLE EAST & AFRICA: MARKET, BY DEPLOYMENT, 2019–2022 (USD MILLION)
  • TABLE 318 MIDDLE EAST & AFRICA: MARKET, BY DEPLOYMENT, 2023–2028 (USD MILLION)
  • TABLE 319 MIDDLE EAST & AFRICA: MARKET, BY MONITORING PROCESS, 2019–2022 (USD MILLION)
  • TABLE 320 MIDDLE EAST & AFRICA: MARKET, BY MONITORING PROCESS, 2023–2028 (USD MILLION)
  • TABLE 321 MIDDLE EAST & AFRICA: MARKET, BY END-USER INDUSTRY, 2019–2022 (USD MILLION)
  • TABLE 322 MIDDLE EAST & AFRICA: MARKET, BY END-USER INDUSTRY, 2023–2028 (USD MILLION)
  • TABLE 323 MIDDLE EAST & AFRICA: MARKET, BY COUNTRY, 2019–2022 (USD MILLION)
  • TABLE 324 MIDDLE EAST & AFRICA: MARKET, BY COUNTRY, 2023–2028 (USD MILLION)
  • TABLE 325 SAUDI ARABIA: MARKET, BY OFFERING, 2019–2022 (USD MILLION)
  • TABLE 326 SAUDI ARABIA: MARKET, BY OFFERING, 2023–2028 (USD MILLION)
  • TABLE 327 SAUDI ARABIA: MARKET FOR HARDWARE, BY HARDWARE, 2019–2022 (USD MILLION)
  • TABLE 328 SAUDI ARABIA: MARKET FOR HARDWARE, BY TYPE, 2023–2028 (USD MILLION)
  • TABLE 329 SAUDI ARABIA: MARKET FOR SOFTWARE, BY SOFTWARE, 2019–2022 (USD MILLION)
  • TABLE 330 SAUDI ARABIA: MARKET FOR SOFTWARE, BY SOFTWARE, 2023–2028 (USD MILLION)
  • TABLE 331 SAUDI ARABIA: MARKET FOR SERVICES, BY SERVICES, 2019–2022 (USD MILLION)
  • TABLE 332 SAUDI ARABIA: MARKET FOR SERVICES, BY TYPE, 2023–2028 (USD MILLION)
  • TABLE 333 SAUDI ARABIA: MARKET, BY DEPLOYMENT, 2019–2022 (USD MILLION)
  • TABLE 334 SAUDI ARABIA: MARKET, BY DEPLOYMENT, 2023–2028 (USD MILLION)
  • TABLE 335 SAUDI ARABIA: MARKET, BY MONITORING PROCESS, 2019–2022 (USD MILLION)
  • TABLE 336 SAUDI ARABIA: MARKET, BY MONITORING PROCESS, 2023–2028 (USD MILLION)
  • TABLE 337 SAUDI ARABIA: MARKET, BY END-USER INDUSTRY, 2019–2022 (USD MILLION)
  • TABLE 338 SAUDI ARABIA: MARKET, BY END-USER INDUSTRY, 2023–2028 (USD MILLION)
  • TABLE 339 UAE: MARKET, BY OFFERING, 2019–2022 (USD MILLION)
  • TABLE 340 UAE: MARKET, BY OFFERING, 2023–2028 (USD MILLION)
  • TABLE 341 UAE: MARKET FOR HARDWARE, BY HARDWARE, 2019–2022 (USD MILLION)
  • TABLE 342 UAE: MARKET FOR HARDWARE, BY HARDWARE, 2023–2028 (USD MILLION)
  • TABLE 343 UAE: MARKET FOR SOFTWARE, BY SOFTWARE, 2019–2022 (USD MILLION)
  • TABLE 344 UAE: MARKET FOR SOFTWARE, BY SOFTWARE, 2023–2028 (USD MILLION)
  • TABLE 345 UAE: MARKET FOR SERVICES, BY SERVICES, 2019–2022 (USD MILLION)
  • TABLE 346 UAE: MARKET FOR SERVICES, BY SERVICES, 2023–2028 (USD MILLION)
  • TABLE 347 UAE: MARKET, BY DEPLOYMENT, 2019–2022 (USD MILLION)
  • TABLE 348 UAE: MARKET, BY DEPLOYMENT, 2023–2028 (USD MILLION)
  • TABLE 349 UAE: MARKET, BY MONITORING PROCESS, 2019–2022 (USD MILLION)
  • TABLE 350 UAE: MARKET, BY MONITORING PROCESS, 2023–2028 (USD MILLION)
  • TABLE 351 UAE: MARKET, BY END-USER INDUSTRY, 2019–2022 (USD MILLION)
  • TABLE 352 UAE: MARKET, BY END-USER INDUSTRY, 2023–2028 (USD MILLION)
  • TABLE 353 TURKEY: MARKET, BY OFFERING, 2019–2022 (USD MILLION)
  • TABLE 354 TURKEY: MARKET, BY OFFERING, 2023–2028 (USD MILLION)
  • TABLE 355 TURKEY: MARKET FOR HARDWARE, BY HARDWARE, 2019–2022 (USD MILLION)
  • TABLE 356 TURKEY: MARKET FOR HARDWARE, BY HARDWARE, 2023–2028 (USD MILLION)
  • TABLE 357 TURKEY: MARKET FOR SOFTWARE, BY SOFTWARE, 2019–2022 (USD MILLION)
  • TABLE 358 TURKEY: MARKET FOR SOFTWARE, BY SOFTWARE, 2023–2028 (USD MILLION)
  • TABLE 359 TURKEY: MARKET FOR SERVICES, BY SERVICES, 2019–2022 (USD MILLION)
  • TABLE 360 TURKEY: MARKET FOR SERVICES, BY SERVICES, 2023–2028 (USD MILLION)
  • TABLE 361 TURKEY: MARKET, BY DEPLOYMENT, 2019–2022 (USD MILLION)
  • TABLE 362 TURKEY: MARKET, BY DEPLOYMENT, 2023–2028 (USD MILLION)
  • TABLE 363 TURKEY: MARKET, BY MONITORING PROCESS, 2019–2022 (USD MILLION)
  • TABLE 364 TURKEY: MARKET, BY MONITORING PROCESS, 2023–2028 (USD MILLION)
  • TABLE 365 TURKEY: MARKET, BY END-USER INDUSTRY, 2019–2022 (USD MILLION)
  • TABLE 366 TURKEY: MARKET, BY END-USER INDUSTRY, 2023–2028 (USD MILLION)
  • TABLE 367 QATAR: MARKET, BY OFFERING, 2019–2022 (USD MILLION)
  • TABLE 368 QATAR: MARKET, BY OFFERING, 2023–2028 (USD MILLION)
  • TABLE 369 QATAR: MARKET FOR HARDWARE, BY HARDWARE, 2019–2022 (USD MILLION)
  • TABLE 370 QATAR: MARKET FOR HARDWARE, BY HARDWARE, 2023–2028 (USD MILLION)
  • TABLE 371 QATAR: MOTOR MONITORING MARKE FOR SOFTWARE, BY SOFTWARE, 2019–2022 (USD MILLION)
  • TABLE 372 QATAR: MOTOR MONITORING MARKE FOR SOFTWARE, BY SOFTWARE, 2023–2028 (USD MILLION)
  • TABLE 373 QATAR: MARKET FOR SERVICES, BY SERVICES, 2019–2022 (USD MILLION)
  • TABLE 374 QATAR: MARKET FOR SERVICES, BY SERVICES, 2023–2028 (USD MILLION)
  • TABLE 375 QATAR: MARKET, BY DEPLOYMENT, 2019–2022 (USD MILLION)
  • TABLE 376 QATAR: MARKET, BY DEPLOYMENT, 2023–2028 (USD MILLION)
  • TABLE 377 QATAR: MARKET, BY MONITORING PROCESS, 2019–2022 (USD MILLION)
  • TABLE 378 QATAR: MARKET, BY MONITORING PROCESS, 2023–2028 (USD MILLION)
  • TABLE 379 QATAR: MARKET, BY END-USER INDUSTRY, 2019–2022 (USD MILLION)
  • TABLE 380 QATAR: MARKET, BY END-USER INDUSTRY, 2023–2028 (USD MILLION)
  • TABLE 381 SOUTH AFRICA: MARKET, BY OFFERING, 2019–2022 (USD MILLION)
  • TABLE 382 SOUTH AFRICA: MARKET, BY OFFERING, 2023–2028 (USD MILLION)
  • TABLE 383 SOUTH AFRICA: MARKET FOR HARDWARE, BY HARDWARE, 2019–2022 (USD MILLION)
  • TABLE 384 SOUTH AFRICA: MARKET FOR HARDWARE, BY HARDWARE, 2023–2028 (USD MILLION)
  • TABLE 385 SOUTH AFRICA: MOTOR MONITORING MARKE FOR SOFTWARE, BY SOFTWARE, 2019–2022 (USD MILLION)
  • TABLE 386 SOUTH AFRICA: MOTOR MONITORING MARKE FOR SOFTWARE, BY SOFTWARE, 2023–2028 (USD MILLION)
  • TABLE 387 SOUTH AFRICA: MARKET FOR SERVICES, BY SERVICES, 2019–2022 (USD MILLION)
  • TABLE 388 SOUTH AFRICA: MARKET FOR SERVICES, BY SERVICES, 2023–2028 (USD MILLION)
  • TABLE 389 SOUTH AFRICA: MARKET, BY DEPLOYMENT, 2019–2022 (USD MILLION)
  • TABLE 390 SOUTH AFRICA: MARKET, BY DEPLOYMENT, 2023–2028 (USD MILLION)
  • TABLE 391 SOUTH AFRICA: MARKET, BY MONITORING PROCESS, 2019–2022 (USD MILLION)
  • TABLE 392 SOUTH AFRICA: MARKET, BY MONITORING PROCESS, 2023–2028 (USD MILLION)
  • TABLE 393 SOUTH AFRICA: MARKET, BY END-USER INDUSTRY, 2019–2022 (USD MILLION)
  • TABLE 394 SOUTH AFRICA: MARKET, BY END-USER INDUSTRY, 2023–2028 (USD MILLION)
  • TABLE 395 REST OF MEA: MARKET, BY OFFERING, 2019–2022 (USD MILLION)
  • TABLE 396 REST OF MEA: MARKET, BY OFFERING, 2023–2028 (USD MILLION)
  • TABLE 397 REST OF MEA: MARKET FOR HARDWARE, BY HARDWARE, 2019–2022 (USD MILLION)
  • TABLE 398 REST OF MEA: MARKET FOR HARDWARE, BY HARDWARE, 2023–2028 (USD MILLION)
  • TABLE 399 REST OF MEA: MARKET FOR SOFTWARE, BY SOFTWARE, 2019–2022 (USD MILLION)
  • TABLE 400 REST OF MEA: MARKET FOR SOFTWARE, BY SOFTWARE, 2023–2028 (USD MILLION)
  • TABLE 401 REST OF MEA: MARKET FOR SERVICES, BY SERVICES, 2019–2022 (USD MILLION)
  • TABLE 402 REST OF MEA: MARKET FOR SERVICES, BY SERVICES, 2023–2028 (USD MILLION)
  • TABLE 403 REST OF MEA: MARKET, BY DEPLOYMENT, 2019–2022 (USD MILLION)
  • TABLE 404 REST OF MEA: MARKET, BY DEPLOYMENT, 2023–2028 (USD MILLION)
  • TABLE 405 REST OF MEA: MARKET, BY MONITORING PROCESS, 2019–2022 (USD MILLION)
  • TABLE 406 REST OF MEA: MARKET, BY MONITORING PROCESS, 2023–2028 (USD MILLION)
  • TABLE 407 REST OF MEA: MARKET, BY END-USER INDUSTRY, 2019–2022 (USD MILLION)
  • TABLE 408 REST OF MEA: MARKET, BY END-USER INDUSTRY, 2023–2028 (USD MILLION)
  • TABLE 409 OVERVIEW OF STRATEGIES ADOPTED BY KEY PLAYERS, 2019– 2022
  • TABLE 410 MARKET: DEGREE OF COMPETITION, 2022
  • TABLE 411 BY OFFERING: COMPANY FOOTPRINT
  • TABLE 412 BY REGION: COMPANY FOOTPRINT
  • TABLE 413 COMPANY FOOTPRINT
  • TABLE 414 MARKET: DETAILED LIST OF KEY STARTUPS/SMES
  • TABLE 415 MARKET: COMPETITIVE BENCHMARKING OF KEY STARTUPS/SMES
  • TABLE 416 MARKET: COMPETITIVE BENCHMARKING OF KEY STARTUPS/SMES (END USERS)
  • TABLE 417 MARKET: PRODUCT LAUNCHES, AUGUST 2017– OCTOBER 2020
  • TABLE 418 MARKET: DEALS, OCTOBER 2020– SEPTEMBER 2021
  • TABLE 419 MARKET: OTHERS, MARCH 2018 – AUGUST 2020
  • TABLE 420 ABB: COMPANY OVERVIEW
  • TABLE 421 ABB: PRODUCTS/SOLUTIONS/SERVICES OFFERED
  • TABLE 422 ABB: PRODUCT LAUNCHES
  • TABLE 423 ABB: DEALS
  • TABLE 424 ABB: OTHERS
  • TABLE 425 GENERAL ELECTRIC: COMPANY OVERVIEW
  • TABLE 426 GENERAL ELECTRIC: PRODUCTS/SOLUTIONS/SERVICES OFFERED
  • TABLE 427 GENERAL ELECTRIC: PRODUCT LAUNCHES
  • TABLE 428 SIEMENS: COMPANY OVERVIEW
  • TABLE 429 SIEMENS: PRODUCTS/SOLUTIONS/SERVICES OFFERED
  • TABLE 430 SIEMENS: PRODUCT LAUNCHES
  • TABLE 431 SIEMENS: DEALS
  • TABLE 432 HONEYWELL INTERNATIONAL INC.: COMPANY OVERVIEW
  • TABLE 433 HONEYWELL INTERNATIONAL INC.: PRODUCTS/SOLUTIONS/SERVICES OFFERED
  • TABLE 434 HONEYWELL INTERNATIONAL INC.: PRODUCT LAUNCHES
  • TABLE 435 HONEYWELL INTERNATIONAL INC.: OTHERS
  • TABLE 436 SCHNEIDER ELECTRIC: COMPANY OVERVIEW
  • TABLE 437 SCHNEIDER ELECTRIC: PRODUCTS/SOLUTIONS/SERVICES OFFERED
  • TABLE 438 SCHNEIDER ELECTRIC: DEALS
  • TABLE 439 BANNER ENGINEERING CORP.: COMPANY OVERVIEW
  • TABLE 440 BANNER ENGINEERING CORP.: PRODUCTS/SOLUTIONS/SERVICES OFFERED
  • TABLE 441 BANNER ENGINEERING CORP.: PRODUCT LAUNCHES
  • TABLE 442 WILSON TRANSFORMERS: COMPANY OVERVIEW
  • TABLE 443 WILSON TRANSFORMERS: PRODUCTS/SOLUTIONS/SERVICES OFFERED
  • TABLE 444 SKF: COMPANY OVERVIEW
  • TABLE 445 SKF: PRODUCTS/SOLUTIONS/SERVICES OFFERED
  • TABLE 446 SKF: PRODUCT LAUNCHES
  • TABLE 447 SKF: DEALS
  • TABLE 448 SKF: OTHERS
  • TABLE 449 EMERSON ELECTRIC CO.: COMPANY OVERVIEW
  • TABLE 450 EMERSON ELECTRIC CO.: PRODUCTS/SOLUTIONS/SERVICES OFFERED
  • TABLE 451 EMERSON ELECTRIC CO.: PRODUCT LAUNCHES
  • TABLE 452 EMERSON ELECTRIC CO.: DEALS
  • TABLE 453 ROCKWELL AUTOMATION: COMPANY OVERVIEW
  • TABLE 454 ROCKWELL AUTOMATION: PRODUCTS/SOLUTIONS/SERVICES OFFERED
  • TABLE 455 ROCKWELL AUTOMATION: DEALS
  • TABLE 456 QUALITROL COMPANY LLC: COMPANY OVERVIEW
  • TABLE 457 QUALITROL COMPANY LLC: PRODUCTS/SOLUTIONS/SERVICES OFFERED
  • TABLE 458 WEG: COMPANY OVERVIEW
  • TABLE 459 WEG: PRODUCTS/SOLUTIONS/SERVICES OFFERED
  • TABLE 460 WEG: PRODUCT LAUNCHES
  • TABLE 461 WEG: DEALS
  • TABLE 462 WEG: OTHERS
  • TABLE 463 MITSUBISHI ELECTRIC CORPORATION: COMPANY OVERVIEW
  • TABLE 464 MITSUBISHI ELECTRIC CORPORATION: PRODUCTS/SOLUTIONS/SERVICES OFFERED
  • TABLE 465 MITSUBISHI ELECTRIC CORPORATION: PRODUCT LAUNCHES
  • TABLE 466 MITSUBISHI ELECTRIC CORPORATION: DEALS
  • TABLE 467 MITSUBISHI ELECTRIC CORPORATION
  • TABLE 468 EATON: COMPANY OVERVIEW
  • TABLE 469 EATON: PRODUCTS/SOLUTIONS/SERVICES OFFERED
  • TABLE 470 EATON: PRODUCT LAUNCHES
  • TABLE 471 EATON: OTHERS
  • TABLE 472 ADVANTECH CO., LTD.: COMPANY OVERVIEW
  • TABLE 473 ADVANTECH CO., LTD.: PRODUCTS/SOLUTIONS/SERVICES OFFERED
  • TABLE 474 ADVANTECH CO., LTD.: PRODUCT LAUNCHES
  • TABLE 475 ADVANTECH CO., LTD.: DEALS
LIST OF FIGURES
 
  • FIGURE 1 MARKET SEGMENTATION
  • FIGURE 2 MARKET: RESEARCH DESIGN
  • FIGURE 3 DATA TRIANGULATION METHODOLOGY
  • FIGURE 4 BREAKDOWN OF PRIMARIES: BY COMPANY TYPE, DESIGNATION, AND REGION
  • FIGURE 5 MAIN METRICS CONSIDERED TO ANALYZE AND ASSESS DEMAND FOR MARKET
  • FIGURE 6 MARKET SIZE ESTIMATION METHODOLOGY: BOTTOM-UP APPROACH
  • FIGURE 7 MARKET SIZE ESTIMATION METHODOLOGY: TOP-DOWN APPROACH
  • FIGURE 8 KEY STEPS CONSIDERED TO ASSESS SUPPLY OF MOTOR MONITORING
  • FIGURE 9 MARKET: SUPPLY-SIDE ANALYSIS
  • FIGURE 10 ASIA PACIFIC TO REGISTER HIGHEST CAGR IN MARKET DURING FORECAST PERIOD
  • FIGURE 11 HARDWARE SEGMENT TO CAPTURE LARGEST SIZE OF MARKET DURING FORECAST PERIOD
  • FIGURE 12 ONLINE SEGMENT TO LEAD MARKET DURING FORECAST PERIOD
  • FIGURE 13 OIL & GAS SEGMENT TO ACQUIRE LARGEST SHARE OF MARKET DURING FORECAST PERIOD
  • FIGURE 14 ON-PREMISE SEGMENT TO COMMAND LARGER SHARE OF MARKET DURING FORECAST PERIOD
  • FIGURE 15 RISING NEED FOR ENERGY EFFICIENCY TO DRIVE MARKET
  • FIGURE 16 ASIA PACIFIC TO REGISTER HIGHEST CAGR IN MARKET DURING FORECAST PERIOD
  • FIGURE 17 OIL & GAS SEGMENT AND US DOMINATED MARKET IN NORTH AMERICA IN 2022
  • FIGURE 18 HARDWARE SEGMENT TO COMMAND LARGEST SHARE OF MARKET IN 2028
  • FIGURE 19 ONLINE SEGMENT TO ACCOUNT FOR LARGER SHARE OF MARKET IN 2028
  • FIGURE 20 OIL & GAS SEGMENT TO HOLD LARGEST MARKET SHARE IN 2028
  • FIGURE 21 ON-PREMISE SEGMENT TO HOLD LARGER MARKET SHARE IN 2028
  • FIGURE 22 MARKET: DRIVERS, RESTRAINTS, OPPORTUNITIES, AND CHALLENGES
  • FIGURE 23 INDUSTRIAL SENSORS MARKET, 2017–2020
  • FIGURE 24 GLOBAL EV (CARS) SALES, 2016–2020 (UNITS)
  • FIGURE 25 TRENDS/DISRUPTIONS IMPACTING CUSTOMER BUSINESS
  • FIGURE 26 MARKET MAP/ECOSYSTEM
  • FIGURE 27 MARKET: VALUE CHAIN ANALYSIS
  • FIGURE 28 AVERAGE SELLING PRICE (ASP) OF MOTOR MONITORING SYSTEMS, BY MONITORING PROCESS, 2021–2023, (USD/UNIT)
  • FIGURE 29 ASP TREND FOR MOTOR MONITORING SYSTEMS, BY REGION, 2021–2023
  • FIGURE 30 MARKET: PORTER’S FIVE FORCES ANALYSIS
  • FIGURE 31 MARKET SHARE, IN TERMS OF VALUE, BY END-USER INDUSTRY, 2022
  • FIGURE 32 MARKET SHARE, IN TERMS OF VALUE, BY OFFERING, 2022
  • FIGURE 33 MARKET SHARE, IN TERMS OF VALUE, BY DEPLOYMENT, 2022
  • FIGURE 34 MARKET SHARE, IN TERMS OF VALUE, BY MONITORING PROCESS, 2022
  • FIGURE 35 MARKET SHARE, IN TERMS OF VALUE, BY REGION, 2022
  • FIGURE 36 ASIA PACIFIC MARKET TO REGISTER HIGHEST CAGR FROM 2023 TO 2028
  • FIGURE 37 ASIA PACIFIC: MARKET SNAPSHOT
  • FIGURE 38 MARKET SHARE ANALYSIS, 2022
  • FIGURE 39 FIVE-YEAR REVENUE ANALYSIS OF TOP PLAYERS IN MARKET
  • FIGURE 40 MARKET: COMPANY EVALUATION MATRIX, 2022
  • FIGURE 41 MARKET: STARTUP/SME EVALUATION MATRIX, 2022
  • FIGURE 42 ABB: COMPANY SNAPSHOT
  • FIGURE 43 GENERAL ELECTRIC: COMPANY SNAPSHOT
  • FIGURE 44 SIEMENS: COMPANY SNAPSHOT
  • FIGURE 45 HONEYWELL INTERNATIONAL INC.: COMPANY SNAPSHOT
  • FIGURE 46 SCHNEIDER ELECTRIC: COMPANY SNAPSHOT
  • FIGURE 47 SKF: COMPANY SNAPSHOT
  • FIGURE 48 EMERSON ELECTRIC CO.: COMPANY SNAPSHOT
  • FIGURE 49 ROCKWELL AUTOMATION: COMPANY SNAPSHOT
  • FIGURE 50 WEG: COMPANY SNAPSHOT
  • FIGURE 51 MITSUBISHI ELECTRIC CORPORATION: COMPANY SNAPSHOT
  • FIGURE 52 EATON: COMPANY SNAPSHOT
  • FIGURE 53 ADVANTECH CO., LTD.: COMPANY SNAPSHOT


The study involved major activities in estimating the current size of the motor monitoring market. Exhaustive secondary research was done to collect information on the peer and parent markets. The next step was to validate these findings, assumptions, and sizing with industry experts across the value chain through primary research. Both top-down and bottom-up approaches were employed to estimate the complete market size. Thereafter, market breakdown and data triangulation were used to estimate the market size of the segments and subsegments.

Secondary Research

This research study on the Motor monitoring market involved the use of extensive secondary sources, directories, and databases, such as The Energy Policy and Conservation Act of 1975 (EPCA), Electrical Appliances and Materials Safety Act, CE marking, The Electrical Equipment (Safety) Regulations 2016, UL 508, Energy Policy Act of 1992 (effective from 1997), International Organization for Standardization (ISO), ASTM International, National Electrical Manufacturers Association (NEMA) and International Electrotechnical Commission (IEC) to identify and collect information useful for a technical, market-oriented, and commercial study of the global Motor monitoring market. The other secondary sources included annual reports, press releases & investor presentations of companies, white papers, certified publications, articles by recognized authors, manufacturer associations, trade directories, and databases.

Primary Research

The motor monitoring market comprises several stakeholders such as motor monitoring manufacturers, manufacturers of subcomponents of motor monitoring, manufacturing technology providers, and technology support providers in the supply chain. The value chain of the motor monitoring market comprises research, design, and development centers, monitoring solution developers, system integrators, suppliers and distributors, end users, and post-sales service providers.  The value chain model helps portray the service flow for motor monitoring development from the lab to various end users. It notionally estimates the value gained or lost by various stakeholders. The value chain model provides situational awareness of the drivers that influence the demand for motor monitoring. 
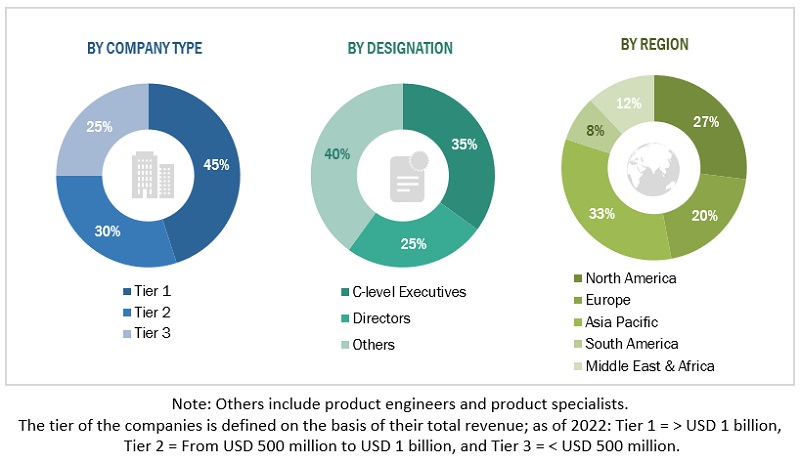
Motor Monitoring Market Size, and Share

To know about the assumptions considered for the study, download the pdf brochure

Market Size Estimation

Both top-down and bottom-up approaches were used to estimate and validate the total size of the Motor monitoring market. These methods were also used extensively to estimate the size of various subsegments in the market. The research methodology used to estimate the market size includes the following:

  • The key players in the industry and market have been identified through extensive secondary research, and their market share in the respective regions has been determined through both primary and secondary research.
  • The industry’s value chain and market size, in terms of value, have been determined through primary and secondary research processes.
  • All percentage shares, splits, and breakdowns have been determined using secondary sources and verified through primary sources.

Global Motor Monitoring Market Size: Top-down Approach
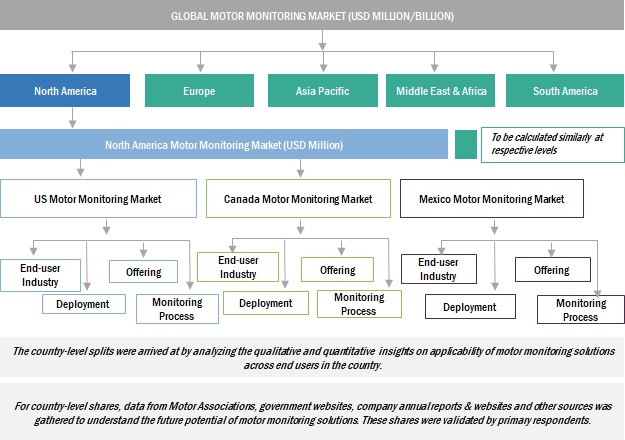
Motor Monitoring Market Size, and Share

To know about the assumptions considered for the study, Request for Free Sample Report

Global Motor Monitoring Market Size: Bottom-Up Approach
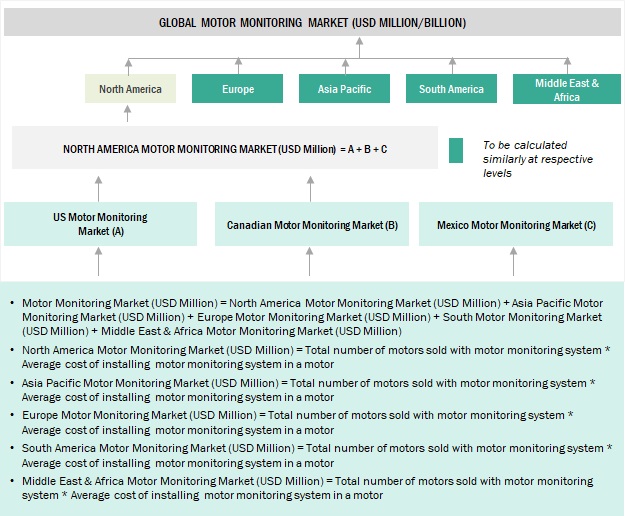
Motor Monitoring Market Size, and Share

Data Triangulation

After arriving at the overall market size from the estimation process explained above, the total market has been split into several segments and subsegments. To complete the overall market engineering process and arrive at the exact statistics for all the segments and subsegments, the data triangulation and market breakdown processes have been employed, wherever applicable. The data has been triangulated by studying various factors and trends from both the demand- and supply sides. Along with this, the market has been validated using both the top-down and bottom-up approaches.

Market Definition

Motor monitoring is the process of tracking the performance of motors to minimize downtime needed for repairs. It is one of the aspects of predictive maintenance. The failing machinery is predicted by monitoring the vibration or temperature of the motor case or the bearings; it can also be detected by monitoring and analyzing the current in the motor. Routine monitoring is the most effective strategy for detecting potential problems, and it can prompt invaluable follow-up inspections. Predictive maintenance has become a worldwide accepted practice and is being implemented and finely tuned by nearly every industry. Locating, defining, and acting on potential problems before they become catastrophic is the main objective of a predictive maintenance program.

Key Stakeholders

  • Technicians and repair personnel
  • Government and research organizations
  • Investment banks
  • End-user industries
  • Motor monitoring solution providers
  • Consulting companies
  • Associations, organizations, forums, and alliances related to motor monitoring solutions
  • Venture capitalists, private equity firms, and start-ups
  • Organizations, forums, alliances, and associations
  • State and national regulatory authorities
  • Venture capital firms

Objectives of the Study

  • To define, describe, segment, and forecast the motor monitoring market, in terms of value and volume, offering, deployment, end user, monitoring process and region
  • To forecast the market size for five key regions: North America, South America, Europe, Asia Pacific, and Middle East & Africa, along with their key countries
  • To provide detailed information about the key drivers, restraints, opportunities, and challenges influencing the growth of the market
  • To strategically analyze the subsegments with respect to individual growth trends, prospects, and contributions of each segment to the overall market size
  • To analyze market opportunities for stakeholders and the competitive landscape of the market
  • To strategically profile the key players and comprehensively analyze their market shares and core competencies
  • To analyze competitive developments, such as deals and agreements in the market

Available Customizations:

With the given market data, MarketsandMarkets offers customizations as per the client’s specific needs. The following customization options are available for this report:

Geographic Analysis

  • Further breakdown of region or country-specific analysis

Company Information

  • Detailed analyses and profiling of additional market players (up to 5)
Custom Market Research Services

We will customize the research for you, in case the report listed above does not meet with your exact requirements. Our custom research will comprehensively cover the business information you require to help you arrive at strategic and profitable business decisions.

Request Customization

Instant Answers with GPT - Ask Now!

Ask real questions. Get complete answers !
Report Code
EP 7815
Published ON
Nov, 2023
Choose License Type
BUY NOW
  • SHARE
X
Request Customization
Speak to Analyst
Speak to Analyst
OR FACE-TO-FACE MEETING
PERSONALIZE THIS RESEARCH
  • Triangulate with your Own Data
  • Get Data as per your Format and Definition
  • Gain a Deeper Dive on a Specific Application, Geography, Customer or Competitor
  • Any level of Personalization
REQUEST A FREE CUSTOMIZATION
LET US HELP YOU!
  • What are the Known and Unknown Adjacencies Impacting the Motor Monitoring Market
  • What will your New Revenue Sources be?
  • Who will be your Top Customer; what will make them switch?
  • Defend your Market Share or Win Competitors
  • Get a Scorecard for Target Partners
CUSTOMIZED WORKSHOP REQUEST
knowledgestore logo

Want to explore hidden markets that can drive new revenue in Motor Monitoring Market?

Find Hidden Markets
  • Call Us
  • +1-888-600-6441 (Corporate office hours)
  • +1-888-600-6441 (US/Can toll free)
  • +44-800-368-9399 (UK office hours)
CONNECT WITH US
ABOUT TRUST ONLINE
©2024 MarketsandMarkets Research Private Ltd. All rights reserved
DMCA.com Protection Status
Website Feedback