The research process for this study included systematic gathering, recording, and analysis of data about customers and companies operating in the industrial robotics market. This process involved the extensive use of secondary sources, directories, and databases (Factiva, Oanda, and OneSource) for identifying and collecting valuable information for the comprehensive, technical, market-oriented, and commercial study of the industrial robotics market. In-depth interviews were conducted with primary respondents, including experts from core and related industries and preferred manufacturers, to obtain and verify critical qualitative and quantitative information as well as to assess growth prospects. Key players in the industrial robotics market were identified through secondary research, and their market rankings were determined through primary and secondary research. This research included studying annual reports of top players and interviewing key industry experts such as CEOs, directors, and marketing executives.
Secondary Research
In the secondary research process, various secondary sources were referred to for identifying and collecting information important for this study. Secondary sources included corporate filings, such as annual reports, investor presentations, and financial statements; trade, business, and professional associations; white papers; industrial robotics market products-related journals; certified publications; articles by recognized authors; directories; and databases.
Secondary research was conducted to obtain key information about the industry supply chain, market value chain, key players, market classification and segmentation as per industry trends to the bottom-most level, geographic markets, and key developments from both market- and technology-oriented perspectives. Data from secondary research was collected and analyzed to determine the overall market size, which was further validated by primary research.
Primary Research
In the primary research process, various primary sources from the supply and demand sides were interviewed to obtain qualitative and quantitative information for this report. Primary sources from the supply side included industry experts such as CEOs, VPs, marketing directors, technology & innovation directors, and key executives from major companies in the industrial robotics market.
After going through market engineering (which includes calculations for market statistics, market breakdown, market size estimations, market forecasting, and data triangulation), extensive primary research was conducted to gather information and verify and validate the critical numbers obtained. Primary research was conducted to identify segmentation types, industry trends, key players, competitive landscape, and key market dynamics such as drivers, restraints, opportunities, and challenges, along with the key strategies adopted by players operating in the market.

To know about the assumptions considered for the study, download the pdf brochure
Market size Estimation
The market engineering process included using both top-down and bottom-up approaches, as well as several data triangulation methods, to estimate the size of the market, its segments, and sub-segments listed in this report. A whole qualitative and quantitative analysis on the complete market engineering process was conducted and through it, the key information/insights that will be related to the industrial robotics market were put together.
The key players in the market were identified through secondary research, and their rankings in the respective regions were determined through primary and secondary research. This entire procedure involved the study of the annual and financial reports of top players, as well as interviews with industry experts such as chief executive officers, vice presidents, directors, and marketing executives for quantitative and qualitative key insights. All percentage shares, splits, and breakdowns were determined using secondary sources and verified through primary sources. All parameters that affect the markets covered in this research study were accounted for, viewed in extensive detail, verified through primary research, and analyzed to obtain the final quantitative and qualitative data. This data was consolidated and enhanced with detailed inputs and analysis from MarketsandMarkets and presented in this report.

Data Triangulation
After arriving at the overall size of the industrial robotics market from the market size estimation process explained above, the total market was split into several segments and subsegments. Where applicable, the market breakdown and data triangulation procedures were employed to complete the overall market engineering process and arrive at the exact statistics for all segments and subsegments. The data was triangulated by studying various factors and trends from both the demand and supply sides. Along with this, the market size was validated using top-down and bottom-up approaches.
Market Definition
An industrial robot, as defined in International Organization for Standardization (ISO 8373), is multipurpose, automatically controlled, reprogrammable manipulator programmable in three or more axes. Systems designed for the purpose of performing various other industrial tasks are known as industrial robotics. More particularly, this refers to repetitive and hazardous jobs or jobs not suitable for human workers.
Key Stakeholders
-
Original equipment manufacturers (OEMs)
-
Providers of technology solutions
-
Research institutes
-
Market research and consulting firms
-
Forums, alliances, and associations related to industrial robots
-
Technology investors
-
Governments and financial institutions
-
Analysts and strategic business planners
-
Existing end users and prospective ones
Report Objectives
-
To describe and forecast the industrial robotics market, by robot type and offering, in terms of value
-
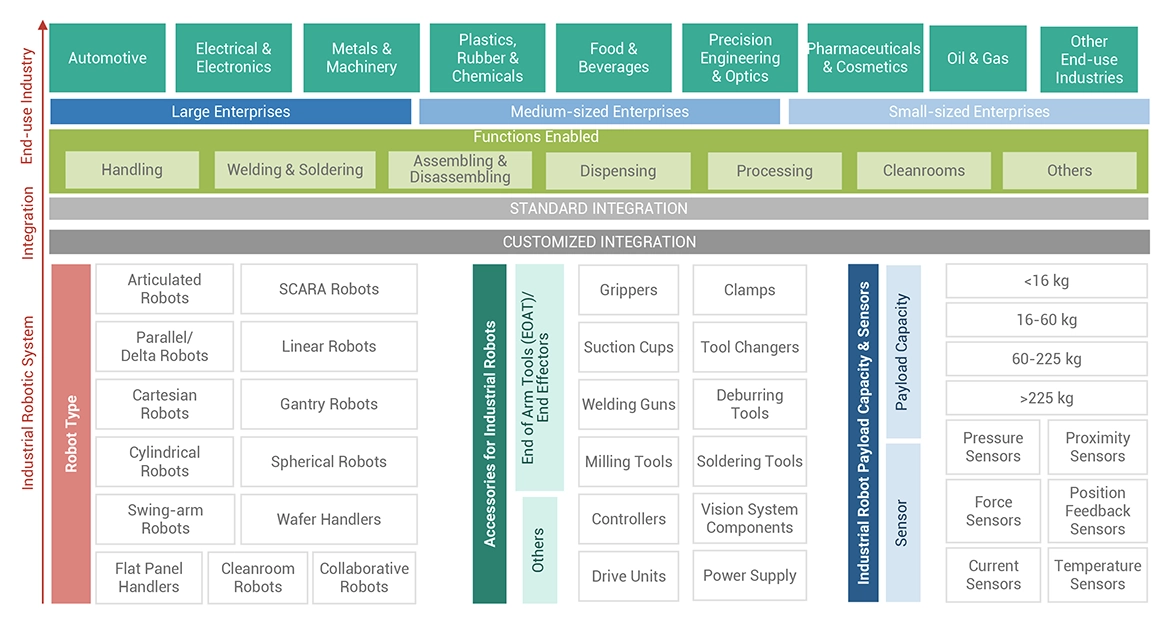
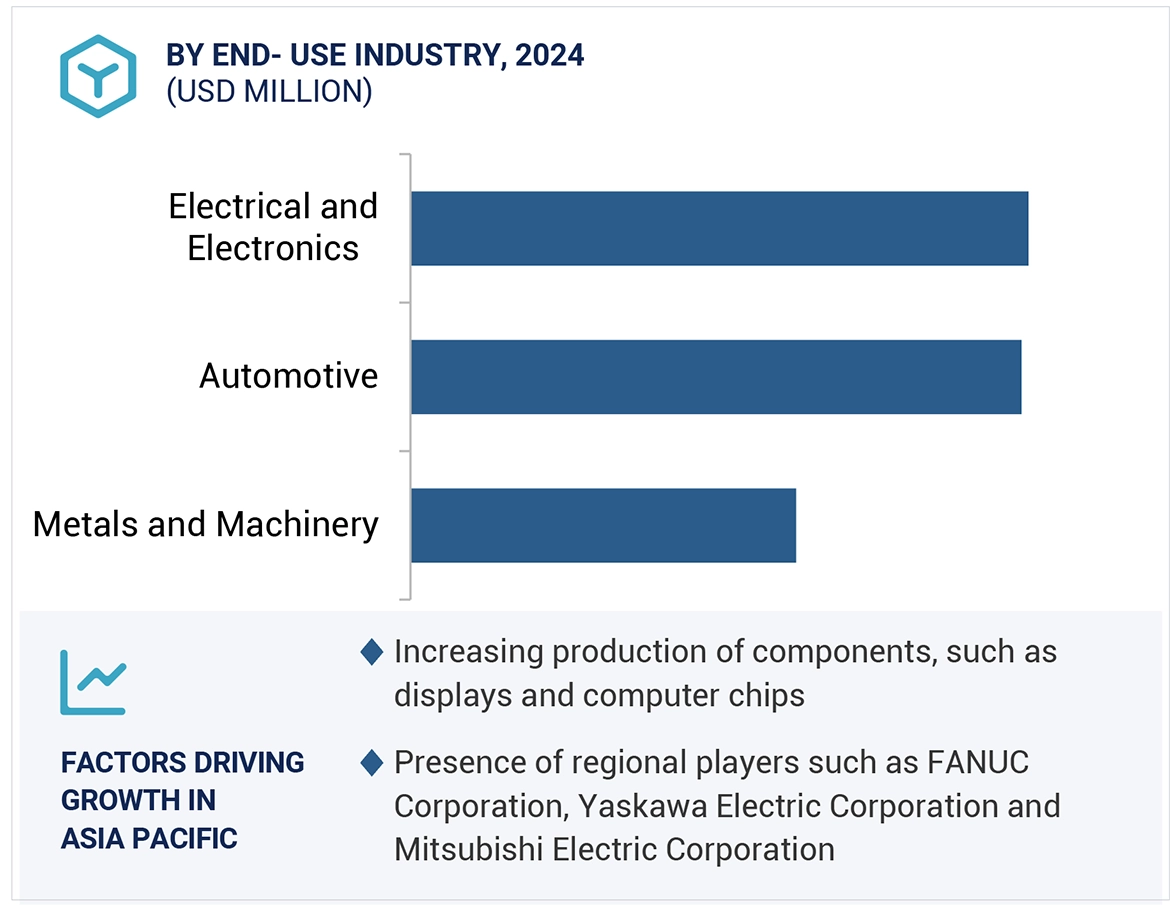
To describe and forecast the industrial robots market, by robot type, payload, application, and end-use industry, in terms of value
-
To describe and forecast the industrial robots market, by robot type, payload, application, and end-use industry, in terms of volume
-
To describe and forecast the industrial robots market size with respect to four main regions, namely, North America, Europe, Asia Pacific, and the Rest of the World (RoW), in terms of value and volume
-
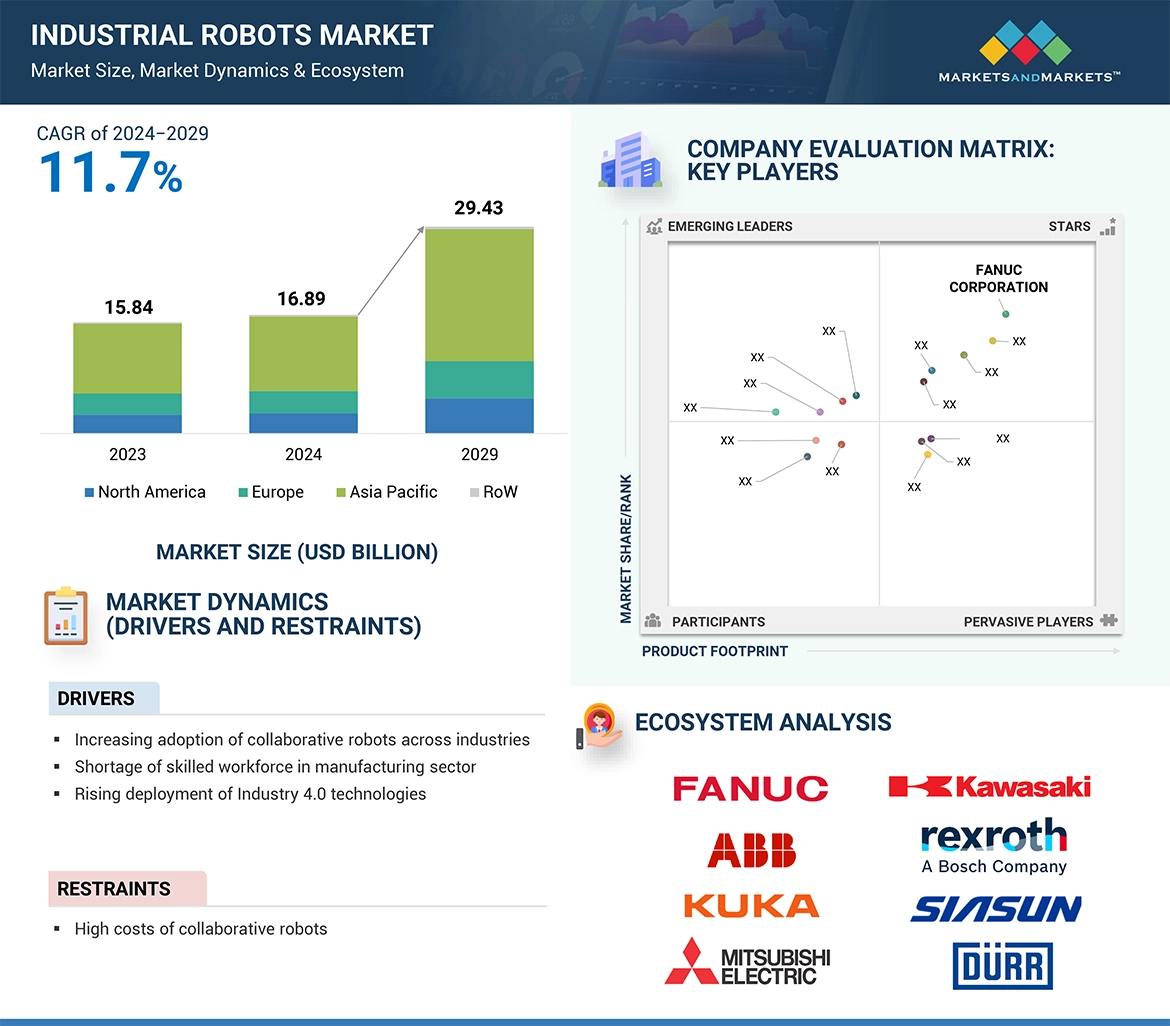
To provide detailed information regarding the drivers, restraints, opportunities, and challenges influencing the growth of the industrial robotics market
-
To provide a detailed overview of the supply chain, ecosystem analysis, case study analysis, patent analysis, trade analysis, technology analysis, average selling price (ASP) analysis, AI/gen AI impact analysis, porter’s five forces analysis, and regulations pertaining to the market of the industrial robotics
-
To strategically analyze micromarkets1 with respect to individual growth trends, prospects, and contributions to the overall market
-
To analyze opportunities in the market for various stakeholders by identifying the high-growth segments of the market
-
To benchmark the market players using the proprietary company evaluation matrix framework, which analyzes the market players on various parameters within the broad categories of business strategy excellence and strength of product portfolios
-
To strategically profile the key players and comprehensively analyze their market positions in terms of ranking and core competencies2, along with a detailed competitive landscape of the market
-
To analyze competitive developments, such as acquisitions, product launches, partnerships, expansions, and collaborations, in the industrial robotics market
Available customizations
With the given market data, MarketsandMarkets offers customizations according to the specific requirements of companies.
Product analysis
-
Detailed analysis and profiling of additional market players
The following customization options are available for the report:
-
Market sizing and forecast for additional countries
-
Additional five companies profiling


Ravi
Nov, 2018
We need to know the industrial robots market size for electronics industry specifically. .
Shoko
Oct, 2017
Interested in a separate study on Philippines industrial robotics market (overall and by industry) and after-market of industrial robotics. Could you please quickly provide estimated fees and timeline for delivery?.
Peter
Jun, 2018
I am currently pursuing MBA and require some market data on industrial Robots for the Oceania region (Australia and New Zealand). Can you help me with this?.
Ivan
Dec, 2014
We are interested in all Market type above and we would like to know more about Robotic molds appertain in Cast Industry. .
Olga
Mar, 2016
Hello, I am interested in the warehousing, logistics and robotics. .
Koji
Apr, 2015
Please let me know if this report include 1.Value chain analysis data 2.Total system cost analysis including materials cost and production cost and units/parts cost by each types of industry robots?.
Nathalie
Mar, 2017
Hi, I'm interested in a sample or an overview of the report before purchase. I'm currently looking for forecasts and predictions in the different markets. .
Yannick
Sep, 2013
Specific interest is in Automotive robotics for different applications such as, dispensing, handling, welding, and fitting. Looking for market size of each application in this industry..
Assaf
Apr, 2017
I am interested in information regarding Milking Robotics and future trends. Last time where I have purchased a report from you -finally the report did not answer my needs and expectations. Before purchasing any new report on milking robots - I would like to get insights on and from the report that will assure me I am getting what I really expecting to get. Can you please provide me this info?.
Arun
Nov, 2016
Does your report have information on industrial robots and various end users of industrial robots?.
Arun
Nov, 2016
Does your report have quantitate information on industrial robots and various end users of industrial robots?.
Patrick
Jul, 2016
I have purchased the report and need to understand what is driving the growth rates for the components of the industrial robots..
Philippe
Jul, 2014
Would you have student version of the report, I am interested in a free version or a much reduced cost version as part of your corporate policy to support higher education?.
Christopher
Jul, 2019
I would like a free sample report to check weather this report fits with what I am looking for..
Luis
May, 2015
I'm doing a study to determine the size of robot market and how to define our strategy to address this market..
Peter
May, 2019
Does this report include information regarding the average unit price / cost for these robots and any unit cost data of their assembly components (gear drives, motors, sensors, structural elements, etc.)?.
MOO
May, 2016
Is there any scope for new entrants in the market? If yes please provide me few start-ups in the market along with entry barriers in the market. Information on best practices in the market will also be well appreciated..
Jeffrey
Mar, 2015
Can you provide me comparative qualitative and quantitate analysis of industrial robots? Make sure to provide unit shipments and ASP of industrial robots. Also provide me the top 10 vendors in the industrial robots market. .
R
Feb, 2019
Interested in purchasing the complete "Industrial Robotics Market". Please suggest me the complete process and any discount offer available. .