Industrial Robotics Market Size, Share & Analysis

Report Code SE 2733
Published in Sep, 2024, By MarketsandMarkets™
Download PDF

Choose License Type

Buy Report Now Inquire Before Buying

Industrial Robotics Market by Robot (Articulated, SCARA, Cartesian, Parallel, Cylindrical, Collaborative), Payload (up to 16 kg, >16 to 60 kg, >60 to 225 kg, >225 kg), Offering (End Effectors, Controllers, Drive Units, Sensors) - Global Forecast to 2029

Overview

The industrial robots market is projected to grow from USD 16.89 billion in 2024 to USD 29.43 billion by 2029, registering a CAGR of 11.7% during the forecast period. Mounting adoption of automation solutions to optimize manufacturing operations and rapid advances in artificial intelligence (Al) and digital automation technologies are major factors driving the market. Additionally, the increasing automation in the electronics manufacturing industry is poised to offer lucrative growth opportunities for players in the market during the forecast period. The emergence of Industry 4.0 and Industry 5.0 technologies are also among the major growth drivers for the industrial robotics market. Digital transformation in the manufacturing industry focuses on automation, interconnectivity, and optimization of processes in real time, using emerging digital technologies, such as the Internet of Things (IoT), machine learning (ML), and AI. The use of AI will become increasingly crucial in Industry 5.0, as it improves human-machine communication and helps decision-making processes. Furthermore, the integration of 5G technologies and AI into collaborative robots acts as a driver for the market. According to MarketsandMarkets analysis, the collaborative robots market is growing at a rate of 31% from 2021 to 2022.

Attractive Opportunities in the Industrial Robotics Market

Asia Pacific

The Asia Pacific industrial robotics market growth can be attributed due to the rising number of automotive manufacturing plants and the emergence of Industry 5.0.

The increasing use of robots in automotive, electrical & electronics, and metal & machinery sectors drive the Asia Pacific industrial robotics market.

Leading countries, such as the US, China, and Japan, as well as emerging economies, including India and other Asian countries, are expected to be major markets for industrial robotics during the forecast period.

By robot type, the market for collaborative robots is expected to grow at a higher CAGR during the forecast period.

Increasing automation in the electronics industry worldwide is expected to fuel the growth of the Asia Pacific industrial robotics market during the forecast period.

Global Industrial Robotics Market Dynamics

Driver: Rapid advances in AI technology

The integration of artificial intelligence to enhance automation has enabled industrial robots to be more precise, efficient, and adaptive. This technology has brought about an effective transformation in the manufacturing process of many industrial sectors, such as automotive, oil & gas, and consumer electronics, among others. By leveraging AI-driven algorithms, industrial robots can perceive their surroundings, recognize objects, and make decisions based on the recognitions they collect from sensors in real time. The industrial robotics segment has also witnessed rapid development in recent times, including the new introductions of robots embedded with AI and other advanced technologies that help improve efficiency and workers’ safety. For instance, OMRON Corporation has brought an AI-enabled robot, Omron i4, which is capable of diagnosing and informing automatically about any need for maintenance. FANUC CORPORATION launched the collaborative robot CRX-10iA, a lightweight robot featuring a user interface via tablet and an autonomous vision system. Similarly, Universal Robots A/S extended the offerings to include the UR16e-a, a high-payload robotic arm that could be applied to many applications. Such innovations address industry challenges and drive the global industrial robotics market.

Restraint: initial investments

The implementation of a robotic automation project can be a challenging task for companies without any prior experience. The only way to reduce operational costs is to replace human workers with robots. A single collaborative robot system costs between USD 3,000 and USD 10,000. The cost of an industrial robotic system is between USD 15,000 and USD 75,000. The total investment includes the cost of industrial robots, integration fees, and the cost of additional components, such as end effectors and vision systems. This is why automation is an expensive investment for small- and medium-sized enterprises (SMEs), which are mostly engaged in low-volume production. Cost is even more crucial to companies with seasonal and irregular production schedules. The rapid changes in consumer preferences require the robots to be frequently reprogrammed, as the products are updated annually. Over-automation can also lead to problems. For example, the US automotive industry relied more on automation than Japan. This led to cost overruns as product lines and consumer demand evolved, rendering many robots unnecessary or obsolete. Collaborative robot manufacturers have taken steps to support automation in small- and medium-scale industries. For instance, Universal Robots (Denmark) assists its clients in calculating the return on investment (ROI) from automation to make informed decisions.


Opportunity: Implementation of Industry 5.0

Industry 5.0 is the new user-centered production concept whereby collaboration between humans and robots can be seen. With this application, operators would have certain advantages over robots in terms of technical precision and seamless execution of heavy and challenging tasks. This cooperation can maintain greater control and personalization for every production stage. The European Commission perceives that Industry 5.0 is a deeper vision than the concept of efficiency and effectiveness in production, as workers’ well-being plays a central role in the whole process of production. Industry 5.0 completes the concept of Industry 4.0 and encompasses research and innovation activities for sustainable, human-centered, and resilient industries in Europe. Besides, companies, such as Amazon, Bosch, and Google, are already using these technologies to boost productivity, quality, and flexibility. The progress of the Industry 5.0 manufacturing sector will follow its developmental course. For example, in May 2023, ABB launched an automated and flexible miniature circuit breaker production line in China to demonstrate concepts of Industry 5.0. In this case, automation enabled an entire digitalized factory that employed AI techniques, such as visual recognition and flexible feeding for quick changeover product types, and even produced different types of MCBs.

Challenge: Complexities associated with equipment integration

The challenges in the industrial robotics market are complexities and integration challenges. In addition, the deployment of cobots requires a close working relationship among robotics professionals, production engineers, and floor operators. This is due to specific tasks, such as picking components, assembling parts, and aiding in heavy lifting, which are programmed into cobots. Failure in system implementation and integration of machines remain primal challenges. Besides this, cobots must be versatile enough to cater to different varieties of products with varying designs or sizes. This makes programming more difficult as it must support reprogramming to meet these changes. Furthermore, seamless task transitions are crucial to successful integration since they reduce interruptions caused by excess downtimes by allowing one task to move to another without needing any break. Key solutions to complexity and integration problems include detailed planning, coding, and exhaustive testing. Companies must also engage the services of educated robotics integrators and offer their workforce training sessions for the smooth uptake of new technologies. Once these issues are dealt with appropriately, the industry will be able to take advantage of cobots, improving productivity, especially in manufacturing line operations.

Global Industrial Robotics Market Ecosystem Analysis

Industrial Robotics Ecosystem Various companies are involved in various stages of the ecosystem. A few companies that manufacture industrial robots are ABB, KUKA, Mitsubishi Electric, Yaskawa Electric Corporation, and FANUC CORPORATION, among others. Industrial Robots are used in various industries, such as automotive, electrical & electronics, metals & machinery, plastics, rubber & chemicals, food & beverages, precision engineering & optics, and pharmaceuticals & optics. New opportunities are provided for the players offering industrial robots due to the emergence of industrial automation global


Articulated robot segment to capture largest market share in 2029.

The articulated robots segment is expected to capture the largest share of the industrial robotics market in 2029. These robots are used almost exclusively in the automotive industry for spot welding and painting since they can operate in difficult-to-reach areas due to their long reach and flexibility. Although robots in the metals & machinery industry were initially limited to manipulating sheet metal parts, they are used for part transfer, machine loading/unloading, deburring, and arc welding. With robots becoming cost-effective, manufacturers can increase their investments in industrial applications. Articulated robots are experiencing large-scale adoption in the pharmaceuticals & cosmetics industry due to their suitability for picking and packaging, laboratory applications, such as pipetting and mixing, drug production processes, and the inspection and development of pharmaceutical drugs. Recent technological advancements in articulated robots have enhanced their flexibility, accuracy, and cost-effectiveness. For instance, actuator advancements have increased their capability to handle heavy loads and perform intricate tasks. In May 2024, ABB introduced the new IRB 7710 and IRB 7720 to its modular large robot portfolio, along with the IRB 5710-IRB 5720 and IRB 6710-IRB 6740, offering a total of 46 different variants capable of handling payloads between 70 and 620 kg.

Automotive segment to account for largest market share in 2029

The automotive end-use industry segment is projected to account for the largest industrial robotics market share in 2029. The deployment of robotics systems is higher in the automotive industry than in other industries. Automakers are committed to quality and repeatability to prevent the vehicle assembly line from stopping or issues arising from the breakdown of the equipment. Vehicle production has two main stages: production and assembly. Robots are largely employed in manufacturing, where they do spot welding and painting. Assembly is the second stage, where robots are used for handling parts randomly or ordered. Some companies, such as BMW AG (Germany), Nissan (Japan), and Bajaj Auto (India), have either introduced or replaced traditional industrial robots with collaborative robots for operations, including material handling and dispensing. The Gestamp Group (Spain) has established its base at the Bielefeld facility, where it adopted KUKA Systems’ fully automatic arc welding system. With this, they can guarantee quality manufacturing of metal automotive components. KUKA (Germany) supplies at least 18 varieties of robots to the auto industry, ranging from laser welding and washing to shaping seat components of BMW using 3D geometry. Acieta (US) has embedded over 4,400 industrial automotive manufacturing robots in different plants in North America.

Asia Pacific region holds the largest share of the Industrial Robotics Market.

The industrial robots market is prominent in Asia Pacific. The region has adopted industrial robotics systems at a faster rate than other regions. It holds a prominent position in the industrial robots market, serving local and international demand. Leading countries, such as Japan, China, South Korea, and Taiwan, are at the forefront of robotics adoption, particularly in the automotive, electronics, and machinery industries. It is considered one of the world’s major manufacturing hubs and is expected to provide growth opportunities for players in the industrial robotics market. Low production costs, easy availability of labor, lenient emission and safety norms, and government initiatives for foreign direct investments (FDIs) are some major factors fueling the growth of this market in Asia Pacific. China is expected to remain the largest market for traditional and collaborative robots. The country imports industrial robots and manufactures them domestically. The industrial robots market in the automotive sector is expected to remain the largest for most Asian Pacific countries except for Taiwan. The electrical & electronics industry is the second most important driver for the industrial robots market in the region, owing to the rising demand for electronic products.


Recent Developments of Industrial Robotics Market industry

  • In May 2024, ABB introduced new models in its modular big robot range: IRB 7710 and IRB 7720. This has further led to the arrival of 46 new variants of the robots, along with the recent arrival of the IRB 5710-IRB 5720 and IRB 6710-IRB 6740. The robots are able to carry out the tasks with the payloads, which weigh between 70 and 620 kg, which will provide the companies with more flexibility, better choice, and execution
  • In May 2024, Yaskawa Electric Corporation declared a capital and business alliance with Oishii Farm Corporation, a US-based startup committed to producing strawberries. The alliance’s main goal was to change Yaskawa Electric Corporation into a leading global agriculture and food automation company. As a result, Oishii would be getting automation systems based on Yaskawa Electric Corporation’s “i3 Mechatronics” solution concept.

Key Market Players

KEY PLAYERS IN THE Industrial Robotics Market INCLUDE

Want to explore hidden markets that can drive new revenue in Industrial Robotics Market?

Scope of the Report

Report Attribute Details
Market Revenue in 2024 $16.89 billion
Industrial Robotics Market Size Estimated Value by    2029                                                                         $29.43 billion by 2029 
Growth Rate Poised to grow at a CAGR of 11.7%
Market Size Available for Years 2020–2029
Base Year 2023
Forecast Period 2024–2029
Units Value (USD Million/USD Billion), Volume (Thousand Units)
Segments Covered Robot Type, Offering, Payload, Application, End Use Industry, and Region
Regions Covered North America, Europe, Asia Pacific, and RoW
Companies Covered FANUC CORPORATION (Japan), ABB (Switzerland), Yaskawa Electric Corporation (Japan), KUKA AG (Germany), Mitsubishi Electric Corporation (Japan), Kawasaki Heavy Industries,  Ltd, (Japan), Denso Corporation (Japan), Nachi-Fujikoshi (Japan), Seiko Epson Corpo


Key Questions Addressed by the Report

What are the major companies in the industrial robotics market and their primary strategies to strengthen the market presence?
FANUC CORPORATION (Japan), ABB (Switzerland), Yaskawa Electric Corporation (Japan), KUKA AG (Germany), and Mitsubishi Electric Corporation (Japan) are among the leading players in the market. These companies have adopted inorganic and organic growth strategies, such as partnerships, product launches, and acquisitions, to gain a competitive advantage in the market.
Which is the potential end-use industry for the industrial robotics market?
Automotive, electrical & electronics, and metal & machinery are end-user industries with high growth opportunities owing to technological advancements.
What are the opportunities for new market entrants?
The rising automation in electronics manufacturing and the emergence of industry 5.0 technologies create opportunities for players in the industrial robotics market.
Which robot type is expected to drive the traditional robots market over the next six years?
Articulated robots are expected to remain a major robot type, driving the demand for traditional robots.
What are the major strategies adopted by industrial robotics companies?
Industrial robotics companies have adopted product launches, expansions, acquisitions, and contracts to strengthen their position in the market.


Personalize This Research

  • Triangulate with your Own Data
  • Get Data as per your Format and Definition
  • Gain a Deeper Dive on a Specific Application, Geography, Customer or Competitor
  • Any level of Personalization
Request A Free Customisation

Let Us Help You

  • What are the Known and Unknown Adjacencies Impacting the Industrial Robotics Market
  • What will your New Revenue Sources be?
  • Who will be your Top Customer; what will make them switch?
  • Defend your Market Share or Win Competitors
  • Get a Scorecard for Target Partners
Customized Workshop Request

Table of Contents

Exclusive indicates content/data unique to MarketsandMarkets and not available with any competitors.

TITLE
PAGE NO
INTRODUCTION
35
RESEARCH METHODOLOGY
40
EXECUTIVE SUMMARY
53
PREMIUM INSIGHTS
58
MARKET OVERVIEW
60
  • 5.1 INTRODUCTION
  • 5.2 MARKET DYNAMICS
    DRIVERS
    - Increasing adoption of collaborative robots across industries
    - Shortage of skilled workforce in manufacturing sector
    - Rising deployment of Industry 4.0 technologies
    - Mounting adoption of automation solutions to optimize manufacturing operations
    - Rapid advances in AI and digital automation technologies
    RESTRAINTS
    - High costs of collaborative robots
    OPPORTUNITIES
    - Rise in automation in electronics manufacturing
    - Emergence of Industry 5.0
    CHALLENGES
    - Requirement for extensive training and expertise in setting up high-end robots
    - Lack of standardization and interoperability issues
    - Complexities associated with integrating cobots into diverse workstations
  • 5.3 VALUE CHAIN ANALYSIS
    SUPPLY CHAIN PARTICIPANTS
    - Original equipment manufacturers (OEMs)
    - Suppliers
    - Robot integrators
    - Distributors
    - IT/Big data companies
    - Research centers
  • 5.4 ECOSYSTEM ANALYSIS
  • 5.5 PRICING ANALYSIS
    INDICATIVE PRICING TREND OF KEY PLAYERS, BY ROBOT TYPE
    AVERAGE SELLING PRICE TREND, BY TYPE
    AVERAGE SELLING PRICE TREND, BY REGION
  • 5.6 INVESTMENT AND FUNDING SCENARIO
  • 5.7 TRENDS/DISRUPTIONS IMPACTING CUSTOMER BUSINESS
  • 5.8 IMPACT OF GEN AI/AI ON INDUSTRIAL ROBOTICS MARKET
  • 5.9 TECHNOLOGY ANALYSIS
    KEY TECHNOLOGIES
    - Industrial robots and vision systems
    COMPLEMENTARY TECHNOLOGIES
    - Industrial Internet of Things and artificial intelligence
    - Safety sensors
    ADJACENT TECHNOLOGIES
    - 5G
  • 5.10 CASE STUDY ANALYSIS
    QISDA ADOPTS TOUCHÉ SOLUTIONS’ HUMAN–ROBOT COLLABORATION SAFETY SOLUTION TO MINIMIZE COLLISIONS
    GREAT PLAINS MANUFACTURING IMPLEMENTS GENESIS’ VIRTUAL SOLUTION FOR ROBOT WELDING TO INCREASE PRODUCTION SPEED
    TTI, INC. USES DRIVERLESS ROBOTS TO AUTOMATE CART PICKING AND DELIVERY PROCESSES
    SCHOTT AG IMPLEMENTS AUTOMATION SOLUTION USING ONROBOT’S RG2-FT GRIPPER TO MITIGATE MANUAL LOADING
    EMERSON PROFESSIONAL TOOLS ADOPTS FANUC COBOT CRX-10IA/L TO MEET SAFETY REQUIREMENTS
    GRUPO FORTEC LEVERAGES MITSUBISHI ELECTRIC’S ROBOTICS TECHNOLOGY TO FACILITATE BULK PALLETIZING
  • 5.11 PATENT ANALYSIS
  • 5.12 TRADE ANALYSIS
    IMPORT DATA (HS CODE 847950)
    EXPORT DATA (HS CODE 847950)
  • 5.13 PORTER’S FIVE FORCES ANALYSIS
    INTENSITY OF COMPETITIVE RIVALRY
    BARGAINING POWER OF SUPPLIERS
    BARGAINING POWER OF BUYERS
    THREAT OF SUBSTITUTES
    THREAT OF NEW ENTRANTS
  • 5.14 KEY STAKEHOLDERS AND BUYING CRITERIA
    KEY STAKEHOLDERS IN BUYING PROCESS
    BUYING CRITERIA
  • 5.15 TARIFF AND REGULATORY LANDSCAPE
    TARIFF ANALYSIS
    REGULATORY BODIES, GOVERNMENT AGENCIES, AND OTHER ORGANIZATIONS
    STANDARDS
  • 5.16 KEY CONFERENCES AND EVENTS, 2024–2025
REFURBISHMENT OF INDUSTRIAL ROBOTS
108
  • 6.1 INTRODUCTION
  • 6.2 KEY PARAMETERS
    CYCLE TIME
    PERFORMANCE & ACCURACY
    WEAR & TEAR
  • 6.3 INDUSTRIAL ROBOT REFURBISHMENT TRENDS
  • 6.4 TOP FIVE INDUSTRIES ADOPTING REFURBISHED ROBOTS
    AUTOMOTIVE
    METALS & MACHINERY
    ELECTRICAL & ELECTRONICS
    FOOD & BEVERAGES
    PHARMACEUTICALS & HEALTHCARE
    LOGISTICS & WAREHOUSING
  • 6.5 KEY PRACTICES ADOPTED BY ORIGINAL EQUIPMENT MANUFACTURERS OF INDUSTRIAL ROBOTS
    FOCUS ON NEW ROBOTS
    POST-SALES SERVICES
    RESEARCH & DEVELOPMENT
    CUSTOMIZATION & FLEXIBILITY
    INTEGRATION & CONNECTIVITY
    SAFETY STANDARDS & COMPLIANCE
INDUSTRIAL ROBOTICS MARKET, BY ROBOT TYPE
117
  • 7.1 INTRODUCTION
  • 7.2 TRADITIONAL ROBOTS
    ARTICULATED ROBOTS
    - Flexibility, accuracy, and cost-effectiveness to boost segmental growth
    SCARA ROBOTS
    - Precision in material handling to contribute to segmental growth
    PARALLEL ROBOTS
    - Enhanced stiffness, accuracy, and dynamic performance to augment segmental growth
    CARTESIAN ROBOTS
    - Capability to handle heavy loads to accelerate segmental growth
    CYLINDRICAL ROBOTS
    - Compact and space-saving structures to expedite segmental growth
    OTHER TRADITIONAL ROBOTS
  • 7.3 COLLABORATIVE ROBOTS
    EASE OF USE AND LOW-COST DEPLOYMENT TO DRIVE MARKET
INDUSTRIAL ROBOTICS MARKET, BY PAYLOAD
174
  • 8.1 INTRODUCTION
  • 8.2 UP TO 16 KG
    ADOPTION TO INCREASE MANUFACTURING EFFICIENCY AND PRECISION TO FOSTER SEGMENTAL GROWTH
  • 8.3 >16 TO 60 KG
    USE TO AUTOMATE HIGH-POWER ELECTRONIC CIRCUIT MANUFACTURING TO AUGMENT SEGMENTAL GROWTH
  • 8.4 >60 TO 225 KG
    DEPLOYMENT IN INDUSTRIES FOR LIFTING HEAVY PARTS TO BOOST SEGMENTAL GROWTH
  • 8.5 ABOVE 225 KG
    REQUIREMENT FOR AUTOMATED SYSTEMS TO HANDLE LARGE AND HEAVY COMPONENTS DURING AUTOMOTIVE MANUFACTURING TO FUEL SEGMENTAL GROWTH
INDUSTRIAL ROBOTICS MARKET, BY OFFERING
182
  • 9.1 INTRODUCTION
  • 9.2 INDUSTRIAL ROBOTS
    RISING PREFERENCE FOR AUTOMATED MACHINES TO REDUCE REPETITIVE TASKS TO AUGMENT SEGMENTAL GROWTH
  • 9.3 ROBOT ACCESSORIES
    INCREASING ADOPTION TO PERFORM COMPLEX MATERIAL HANDLING AND PACKAGING TASKS TO EXHIBIT SEGMENTAL GROWTH
    END EFFECTORS
    - Welding guns
    - Grippers
    - Tool changers
    - Clamps
    - Suction cups
    - Other end effectors
    CONTROLLERS
    DRIVE UNITS
    - Hydraulic drives
    - Electric drives
    - Pneumatic drives
    VISION SYSTEMS
    SENSORS
    POWER SUPPLY ACCESSORIES
    OTHER ROBOT ACCESSORIES
  • 9.4 OTHER ROBOTIC HARDWARE
    GROWING FOCUS ON IMPROVING ACCURACY, SAFETY, AND FUNCTIONALITY OF ROBOTS TO ACCELERATE SEGMENTAL GROWTH
    SAFETY FENCING HARDWARE
    FIXTURES TOOLS
    CONVEYORS HARDWARE
  • 9.5 SYSTEM ENGINEERING
    RISING EMPHASIS OF MAINTENANCE SPECIALISTS ON MITIGATING HAZARDS TO CONTRIBUTE TO SEGMENTAL GROWTH
  • 9.6 SOFTWARE & PROGRAMMING
    INCREASING NEED FOR OPTIMAL MAINTENANCE AND OPERATION OF ROBOTS TO BOOST SEGMENTAL GROWTH
INDUSTRIAL ROBOTS MARKET, BY APPLICATION
198
  • 10.1 INTRODUCTION
  • 10.2 HANDLING
    INCREASING DEMAND FOR PALLETIZING ROBOTS TO MOVE HEAVY OBJECTS TO BOOST SEGMENTAL GROWTH
    PICK & PLACE
    MATERIAL HANDLING
    PACKAGING & PALLETIZING
  • 10.3 ASSEMBLING & DISASSEMBLING
    RISING EMPHASIS ON MAINTAINING MANUFACTURING QUALITY AND CONSISTENCY TO FOSTER SEGMENTAL GROWTH
  • 10.4 WELDING & SOLDERING
    GROWING FOCUS ON IMPROVING WELD QUALITY AND JOINT INTEGRITY TO DRIVE MARKET
  • 10.5 DISPENSING
    RAPID ADVANCES IN MOTION CONTROL AND SENSING TECHNOLOGIES TO BOLSTER SEGMENTAL GROWTH
    GLUING
    PAINTING
    FOOD DISPENSING
  • 10.6 PROCESSING
    RISING DEPLOYMENT OF ROBOTIC GRINDERS IN AUTOMOTIVE SECTOR TO FUEL SEGMENTAL GROWTH
    GRINDING & POLISHING
    MILLING
    CUTTING
  • 10.7 CLEANROOM
    INCREASING NEED TO MINIMIZE PARTICLE GENERATION AND COMPLY WITH REGULATIONS TO AUGMENT SEGMENTAL GROWTH
  • 10.8 OTHER APPLICATIONS
INDUSTRIAL ROBOTS MARKET, BY END-USE INDUSTRY
237
  • 11.1 INTRODUCTION
  • 11.2 AUTOMOTIVE
    INCREASING NEED FOR AUTOMATED SPOT WELDING AND PAINTING TO DRIVE MARKET
  • 11.3 ELECTRICAL & ELECTRONICS
    RISING ADOPTION OF SCARA ROBOTS IN CLEANROOM APPLICATIONS TO BOLSTER SEGMENTAL GROWTH
  • 11.4 METALS & MACHINERY
    INCREASING USE OF END EFFECTORS TO AUTOMATE HAZARDOUS TASKS TO FUEL SEGMENTAL GROWTH
  • 11.5 PLASTICS, RUBBER & CHEMICALS
    MOUNTING DEMAND FOR ROBOTS TO ENSURE HIGH-SPEED TASK EXECUTION TO ACCELERATE SEGMENTAL GROWTH
  • 11.6 FOOD & BEVERAGES
    INCREASING REQUIREMENT FOR WATER-RESISTANT ROBOTS TO FOSTER SEGMENTAL GROWTH
  • 11.7 PRECISION ENGINEERING & OPTICS
    RISING EMPHASIS ON REDUCING MANUAL LABOR AND AUTOMATING COMPLEX TASKS TO CONTRIBUTE TO SEGMENTAL GROWTH
  • 11.8 PHARMACEUTICALS & COSMETICS
    ESCALATING ADOPTION OF AUTOMATED SYSTEMS TO MINIMIZE CONTAMINATION AND HUMAN ERROR TO DRIVE MARKET
  • 11.9 OIL & GAS
    GROWING FOCUS ON INCREASING ACCURACY OF DRILLING OPERATIONS TO BOOST SEGMENTAL GROWTH
  • 11.10 OTHER END-USE INDUSTRIES
INDUSTRIAL ROBOTS MARKET, BY REGION
295
  • 12.1 INTRODUCTION
  • 12.2 NORTH AMERICA
    MACROECONOMIC OUTLOOK FOR NORTH AMERICA
    US
    - Increased emphasis on automating manufacturing operations to contribute to market growth
    CANADA
    - Implementation of policies and grants to encourage adoption of robots to drive market
    MEXICO
    - Expansion of manufacturing facilities to boost market growth
  • 12.3 EUROPE
    MACROECONOMIC OUTLOOK FOR EUROPE
    GERMANY
    - Mounting investment in electric and hybrid vehicles to fuel market growth
    ITALY
    - Escalating adoption of robots in automobile manufacturing facilities to augment market growth
    FRANCE
    - Rising adoption of electric and hybrid vehicles to drive demand for robots
    SPAIN
    - Increasing adoption of robots in surgical applications to accelerate market growth
    UK
    - Rising deployment of advanced technologies in industrial sectors to foster market growth
    REST OF EUROPE
  • 12.4 ASIA PACIFIC
    MACROECONOMIC OUTLOOK FOR ASIA PACIFIC
    CHINA
    - Mounting adoption of automation solutions due to labor shortage to drive market
    SOUTH KOREA
    - Rising implementation of initiatives to support automated machine training to boost market growth
    JAPAN
    - Increasing aging population and automation trends to contribute to market growth
    TAIWAN
    - Rising implementation of government policies to promote research of automation technologies to drive market
    INDIA
    - Mounting demand for cobots in industries to expedite market growth
    THAILAND
    - Rising emphasis on automating manufacturing operations to fuel market growth
    REST OF ASIA PACIFIC
  • 12.5 ROW
    MACROECONOMIC OUTLOOK FOR ROW
    MIDDLE EAST
    - Burgeoning demand for automated material handling systems to drive market
    - GCC
    - Rest of Middle East
    AFRICA
    - Increasing shipment of robots for industrial operations to augment market growth
    SOUTH AMERICA
    - Rapid urbanization and industrial development to fuel market growth
COMPETITIVE LANDSCAPE
336
  • 13.1 OVERVIEW
  • 13.2 KEY PLAYER STRATEGIES/RIGHT TO WIN, 2020–2024
  • 13.3 REVENUE ANALYSIS, 2019–2023
  • 13.4 MARKET SHARE ANALYSIS, 2023
  • 13.5 COMPANY VALUATION AND FINANCIAL METRICS
  • 13.6 BRAND/PRODUCT COMPARISON
  • 13.7 COMPANY EVALUATION MATRIX: KEY PLAYERS, 2023
    STARS
    EMERGING LEADERS
    PERVASIVE PLAYERS
    PARTICIPANTS
    COMPANY FOOTPRINT: KEY PLAYERS, 2023
    - Company footprint
    - Payload footprint
    - Robot type footprint
    - End-use industry footprint
    - Region footprint
  • 13.8 COMPANY EVALUATION MATRIX: STARTUPS/SMES, 2023
    PROGRESSIVE COMPANIES
    RESPONSIVE COMPANIES
    DYNAMIC COMPANIES
    STARTING BLOCKS
    COMPETITIVE BENCHMARKING: STARTUPS/SMES, 2023
    - Detailed list of key startups/SMEs
    - Competitive benchmarking of key startups/SMEs
  • 13.9 COMPETITIVE SCENARIO
    PRODUCT LAUNCHES
    DEALS
    EXPANSIONS
COMPANY PROFILES
362
  • 14.1 KEY PLAYERS
    ABB
    - Business overview
    - Products/Solutions/Services offered
    - Recent developments
    - MnM view
    YASKAWA ELECTRIC CORPORATION
    - Business overview
    - Products/Solutions/Services offered
    - Recent developments
    - MnM view
    FANUC CORPORATION
    - Business overview
    - Products/Solutions/Services offered
    - Recent developments
    - MnM view
    KUKA AG
    - Business overview
    - Products/Solutions/Services offered
    - Recent developments
    - MnM view
    MITSUBISHI ELECTRIC CORPORATION
    - Business overview
    - Products/Solutions/Services offered
    - Recent developments
    - MnM view
    KAWASAKI HEAVY INDUSTRIES, LTD.
    - Business overview
    - Products/Solutions/Services offered
    - Recent developments
    DENSO CORPORATION
    - Business overview
    - Products/Solutions/Services offered
    - Recent developments
    NACHI-FUJIKOSHI CORP.
    - Business overview
    - Products/Solutions/Services offered
    - Recent developments
    SEIKO EPSON CORPORATION
    - Business overview
    - Products/Solutions/Services offered
    - Recent developments
    DÜRR GROUP
    - Business overview
    - Products/Solutions/Services offered
    - Recent developments
  • 14.2 OTHER PLAYERS
    YAMAHA MOTOR CO., LTD.
    ESTUN AUTOMATION CO.,LTD
    SHIBAURA MACHINE
    DOVER CORPORATION
    AUROTEK CORPORATION
    HIRATA CORPORATION
    RETHINK ROBOTICS
    FRANKA ROBOTICS GMBH
    TECHMAN ROBOT INC.
    BOSCH REXROTH AG
    UNIVERSAL ROBOTS A/S
    OMRON CORPORATION
    STÄUBLI INTERNATIONAL AG
    COMAU
    B+M SURFACE SYSTEMS GMBH
    ICR SERVICES
    IRS ROBOTICS
    HD HYUNDAI ROBOTICS
    SIASUN ROBOT & AUTOMATION CO., LTD
    ROBOTWORX
APPENDIX
432
  • 15.1 DISCUSSION GUIDE
  • 15.2 KNOWLEDGESTORE: MARKETSANDMARKETS’ SUBSCRIPTION PORTAL
  • 15.3 CUSTOMIZATION OPTIONS
  • 15.4 RELATED REPORTS
  • 15.5 AUTHOR DETAILS
LIST OF TABLES
 
  • TABLE 1 INDUSTRIAL ROBOTICS MARKET: RESEARCH ASSUMPTIONS
  • TABLE 2 INDUSTRIAL ROBOTICS MARKET: RISK ANALYSIS
  • TABLE 3 ORIGINAL EQUIPMENT MANUFACTURERS OF INDUSTRIAL ROBOTS
  • TABLE 4 ROLE OF COMPANIES IN INDUSTRIAL ROBOTICS ECOSYSTEM
  • TABLE 5 INDICATIVE PRICING TREND OF INDUSTRIAL ROBOTS OFFERED BY KEY PLAYERS, BY ROBOT TYPE (USD)
  • TABLE 6 AVERAGE SELLING PRICE TREND OF TRADITIONAL INDUSTRIAL ROBOTS, BY TYPE (USD)
  • TABLE 7 LIST OF MAJOR PATENTS, 2022–2024
  • TABLE 8 PORTER’S FIVE FORCES ANALYSIS
  • TABLE 9 INFLUENCE OF STAKEHOLDERS ON BUYING PROCESS FOR TOP THREE END-USE INDUSTRIES
  • TABLE 10 KEY BUYING CRITERIA FOR TOP THREE END-USE INDUSTRIES
  • TABLE 11 MFN TARIFF FOR HS CODE 847950-COMPLIANT INDUSTRIAL ROBOTS EXPORTED BY US, 2023
  • TABLE 12 MFN TARIFF FOR HS CODE 847950-COMPLIANT INDUSTRIAL ROBOTS EXPORTED BY CHINA, 2023
  • TABLE 13 MFN TARIFF FOR HS CODE 847950-COMPLIANT INDUSTRIAL ROBOTS EXPORTED BY GERMANY, 2023
  • TABLE 14 NORTH AMERICA: REGULATORY BODIES, GOVERNMENT AGENCIES, AND OTHER ORGANIZATIONS
  • TABLE 15 EUROPE: REGULATORY BODIES, GOVERNMENT AGENCIES, AND OTHER ORGANIZATIONS
  • TABLE 16 ASIA PACIFIC: REGULATORY BODIES, GOVERNMENT AGENCIES, AND OTHER ORGANIZATIONS
  • TABLE 17 ROW: REGULATORY BODIES, GOVERNMENT AGENCIES, AND OTHER ORGANIZATIONS
  • TABLE 18 INTERNATIONAL: SAFETY STANDARDS
  • TABLE 19 NORTH AMERICA: SAFETY STANDARDS
  • TABLE 20 EUROPE: SAFETY STANDARDS
  • TABLE 21 ASIA PACIFIC: SAFETY STANDARDS
  • TABLE 22 ROW: SAFETY STANDARDS
  • TABLE 23 LIST OF KEY CONFERENCES AND EVENTS. 2024–2025
  • TABLE 24 INDUSTRIAL ROBOTS MARKET, BY ROBOT TYPE, 2020–2023 (USD MILLION)
  • TABLE 25 INDUSTRIAL ROBOTS MARKET, BY ROBOT TYPE, 2024–2029 (USD MILLION)
  • TABLE 26 INDUSTRIAL ROBOTS MARKET, BY ROBOT TYPE, 2020–2023 (THOUSAND UNITS)
  • TABLE 27 INDUSTRIAL ROBOTS MARKET, BY ROBOT TYPE, 2024–2029 (THOUSAND UNITS)
  • TABLE 28 TRADITIONAL INDUSTRIAL ROBOTS MARKET, BY TYPE, 2020–2023 (USD MILLION)
  • TABLE 29 TRADITIONAL INDUSTRIAL ROBOTS MARKET, BY TYPE, 2024–2029 (USD MILLION)
  • TABLE 30 TRADITIONAL INDUSTRIAL ROBOTS MARKET, BY TYPE, 2020–2023 (THOUSAND UNITS)
  • TABLE 31 TRADITIONAL INDUSTRIAL ROBOTS MARKET, BY TYPE, 2024–2029 (THOUSAND UNITS)
  • TABLE 32 TRADITIONAL ROBOTS: INDUSTRIAL ROBOTICS MARKET, BY TYPE, 2020–2023 (USD MILLION)
  • TABLE 33 TRADITIONAL ROBOTS: INDUSTRIAL ROBOTICS MARKET, BY TYPE, 2024–2029 (USD MILLION)
  • TABLE 34 SUMMARY OF ARTICULATED ROBOTS
  • TABLE 35 ARTICULATED INDUSTRIAL ROBOTS MARKET, BY APPLICATION, 2020–2023 (USD MILLION)
  • TABLE 36 ARTICULATED INDUSTRIAL ROBOTS MARKET, BY APPLICATION, 2024–2029 (USD MILLION)
  • TABLE 37 ARTICULATED INDUSTRIAL ROBOTS MARKET, BY APPLICATION, 2020–2023 (THOUSAND UNITS)
  • TABLE 38 ARTICULATED INDUSTRIAL ROBOTS MARKET, BY APPLICATION, 2024–2029 (THOUSAND UNITS)
  • TABLE 39 ARTICULATED INDUSTRIAL ROBOTICS MARKET, BY APPLICATION, 2020–2023 (USD MILLION)
  • TABLE 40 ARTICULATED INDUSTRIAL ROBOTICS MARKET, BY APPLICATION, 2024–2029 (USD MILLION)
  • TABLE 41 ARTICULATED INDUSTRIAL ROBOTS MARKET, BY END-USE INDUSTRY, 2020–2023 (USD MILLION)
  • TABLE 42 ARTICULATED INDUSTRIAL ROBOTS MARKET, BY END-USE INDUSTRY, 2024–2029 (USD MILLION)
  • TABLE 43 ARTICULATED INDUSTRIAL ROBOTS MARKET, BY END-USE INDUSTRY, 2020–2023 (THOUSAND UNITS)
  • TABLE 44 ARTICULATED INDUSTRIAL ROBOTS MARKET, BY END-USE INDUSTRY, 2024–2029 (THOUSAND UNITS)
  • TABLE 45 ARTICULATED ROBOTS: INDUSTRIAL ROBOTICS MARKET, BY END-USE INDUSTRY, 2020–2023 (USD MILLION)
  • TABLE 46 ARTICULATED ROBOTS: INDUSTRIAL ROBOTICS MARKET, BY END-USE INDUSTRY, 2024–2029 (USD MILLION)
  • TABLE 47 SUMMARY OF SCARA ROBOTS
  • TABLE 48 SCARA INDUSTRIAL ROBOTS MARKET, BY APPLICATION, 2020–2023 (USD MILLION)
  • TABLE 49 SCARA INDUSTRIAL ROBOTS MARKET, BY APPLICATION, 2024–2029 (USD MILLION)
  • TABLE 50 SCARA INDUSTRIAL ROBOTS MARKET, BY APPLICATION, 2020–2023 (THOUSAND UNITS)
  • TABLE 51 SCARA INDUSTRIAL ROBOTS MARKET, BY APPLICATION, 2024–2029 (THOUSAND UNITS)
  • TABLE 52 SCARA ROBOTS: INDUSTRIAL ROBOTICS MARKET, BY APPLICATION, 2020–2023 (USD MILLION)
  • TABLE 53 SCARA ROBOTS: INDUSTRIAL ROBOTICS MARKET, BY APPLICATION, 2024–2029 (USD MILLION)
  • TABLE 54 SCARA INDUSTRIAL ROBOTS MARKET, BY END-USE INDUSTRY, 2020–2023 (USD MILLION)
  • TABLE 55 SCARA INDUSTRIAL ROBOTS MARKET, BY END-USE INDUSTRY, 2024–2029 (USD MILLION)
  • TABLE 56 SCARA INDUSTRIAL ROBOTS MARKET, BY END-USE INDUSTRY, 2020–2023 (THOUSAND UNITS)
  • TABLE 57 SCARA INDUSTRIAL ROBOTS MARKET, BY END-USE INDUSTRY, 2024–2029 (THOUSAND UNITS)
  • TABLE 58 SCARA ROBOTS: INDUSTRIAL ROBOTICS MARKET, BY END-USE INDUSTRY, 2020–2023 (USD MILLION)
  • TABLE 59 SCARA ROBOTS: INDUSTRIAL ROBOTICS MARKET, BY END-USE INDUSTRY, 2024–2029 (USD MILLION)
  • TABLE 60 SUMMARY OF PARALLEL ROBOTS
  • TABLE 61 PARALLEL INDUSTRIAL ROBOTS MARKET, BY APPLICATION, 2020–2023 (USD MILLION)
  • TABLE 62 PARALLEL INDUSTRIAL ROBOTS MARKET, BY APPLICATION, 2024–2029 (USD MILLION)
  • TABLE 63 PARALLEL INDUSTRIAL ROBOTS MARKET, BY APPLICATION, 2020–2023 (THOUSAND UNITS)
  • TABLE 64 PARALLEL INDUSTRIAL ROBOTS MARKET, BY APPLICATION, 2024–2029 (THOUSAND UNITS)
  • TABLE 65 PARALLEL ROBOTS: INDUSTRIAL ROBOTICS MARKET, BY APPLICATION, 2020–2023 (USD MILLION)
  • TABLE 66 PARALLEL ROBOTS: INDUSTRIAL ROBOTICS MARKET, BY APPLICATION, 2024–2029 (USD MILLION)
  • TABLE 67 PARALLEL INDUSTRIAL ROBOTS MARKET, BY END-USE INDUSTRY, 2020–2023 (USD MILLION)
  • TABLE 68 PARALLEL INDUSTRIAL ROBOTS MARKET, BY END-USE INDUSTRY, 2024–2029 (USD MILLION)
  • TABLE 69 PARALLEL INDUSTRIAL ROBOTS MARKET, BY END-USE INDUSTRY, 2020–2023 (THOUSAND UNITS)
  • TABLE 70 PARALLEL INDUSTRIAL ROBOTS MARKET, BY END-USE INDUSTRY, 2024–2029 (THOUSAND UNITS)
  • TABLE 71 PARALLEL ROBOTS: INDUSTRIAL ROBOTICS MARKET, BY END-USE INDUSTRY, 2020–2023 (USD MILLION)
  • TABLE 72 PARALLEL ROBOTS: INDUSTRIAL ROBOTICS MARKET, BY END-USE INDUSTRY, 2024–2029 (USD MILLION)
  • TABLE 73 SUMMARY OF CARTESIAN ROBOTS
  • TABLE 74 CARTESIAN INDUSTRIAL ROBOTS MARKET, BY APPLICATION, 2020–2023 (USD MILLION)
  • TABLE 75 CARTESIAN INDUSTRIAL ROBOTS MARKET, BY APPLICATION, 2024–2029 (USD MILLION)
  • TABLE 76 CARTESIAN INDUSTRIAL ROBOTS MARKET, BY APPLICATION, 2020–2023 (THOUSAND UNITS)
  • TABLE 77 CARTESIAN INDUSTRIAL ROBOTS MARKET, BY APPLICATION, 2024–2029 (THOUSAND UNITS)
  • TABLE 78 CARTESIAN ROBOTS: INDUSTRIAL ROBOTICS MARKET, BY APPLICATION, 2020–2023 (USD MILLION)
  • TABLE 79 CARTESIAN ROBOTS: INDUSTRIAL ROBOTICS MARKET, BY APPLICATION, 2024–2029 (USD MILLION)
  • TABLE 80 CARTESIAN INDUSTRIAL ROBOTS MARKET, BY END-USE INDUSTRY, 2020–2023 (USD MILLION)
  • TABLE 81 CARTESIAN INDUSTRIAL ROBOTS MARKET, BY END-USE INDUSTRY, 2024–2029 (USD MILLION)
  • TABLE 82 CARTESIAN INDUSTRIAL ROBOTS MARKET, BY END-USE INDUSTRY, 2020–2023 (THOUSAND UNITS)
  • TABLE 83 CARTESIAN INDUSTRIAL ROBOTS MARKET, BY END-USE INDUSTRY, 2024–2029 (THOUSAND UNITS)
  • TABLE 84 CARTESIAN ROBOTS: INDUSTRIAL ROBOTICS MARKET, BY END-USE INDUSTRY, 2020–2023 (USD MILLION)
  • TABLE 85 CARTESIAN ROBOTS: INDUSTRIAL ROBOTICS MARKET, BY END-USE INDUSTRY, 2024–2029 (USD MILLION)
  • TABLE 86 SUMMARY OF CYLINDRICAL ROBOTS
  • TABLE 87 CYLINDRICAL INDUSTRIAL ROBOTS MARKET, BY APPLICATION, 2020–2023 (USD MILLION)
  • TABLE 88 CYLINDRICAL INDUSTRIAL ROBOTS MARKET, BY APPLICATION, 2024–2029 (USD MILLION)
  • TABLE 89 CYLINDRICAL INDUSTRIAL ROBOTS MARKET, BY APPLICATION, 2020–2023 (THOUSAND UNITS)
  • TABLE 90 CYLINDRICAL INDUSTRIAL ROBOTS MARKET, BY APPLICATION, 2024–2029 (THOUSAND UNITS)
  • TABLE 91 CYLINDRICAL ROBOTS: INDUSTRIAL ROBOTICS MARKET, BY APPLICATION, 2020–2023 (USD MILLION)
  • TABLE 92 CYLINDRICAL ROBOTS: INDUSTRIAL ROBOTICS MARKET, BY APPLICATION, 2024–2029 (USD MILLION)
  • TABLE 93 CYLINDRICAL INDUSTRIAL ROBOTS MARKET, BY END-USE INDUSTRY, 2020–2023 (USD MILLION)
  • TABLE 94 CYLINDRICAL INDUSTRIAL ROBOTS MARKET, BY END-USE INDUSTRY, 2024–2029 (USD MILLION)
  • TABLE 95 CYLINDRICAL INDUSTRIAL ROBOTS MARKET, BY END-USE INDUSTRY, 2020–2023 (THOUSAND UNITS)
  • TABLE 96 CYLINDRICAL INDUSTRIAL ROBOTS MARKET, BY END-USE INDUSTRY, 2024–2029 (THOUSAND UNITS)
  • TABLE 97 CYLINDRICAL ROBOTS: INDUSTRIAL ROBOTICS MARKET, BY END-USE INDUSTRY, 2020–2023 (USD MILLION)
  • TABLE 98 CYLINDRICAL ROBOTS: INDUSTRIAL ROBOTICS MARKET, BY END-USE INDUSTRY, 2024–2029 (USD MILLION)
  • TABLE 99 SUMMARY OF SPHERICAL ROBOTS
  • TABLE 100 SUMMARY OF SWING-ARM ROBOTS
  • TABLE 101 OTHER TRADITIONAL ROBOTS: INDUSTRIAL ROBOTS MARKET, BY APPLICATION, 2020–2023 (USD MILLION)
  • TABLE 102 OTHER TRADITIONAL ROBOTS: INDUSTRIAL ROBOTS MARKET, BY APPLICATION, 2024–2029 (USD MILLION)
  • TABLE 103 OTHER TRADITIONAL ROBOTS: INDUSTRIAL ROBOTS MARKET, BY APPLICATION, 2020–2023 (THOUSAND UNITS)
  • TABLE 104 OTHER TRADITIONAL ROBOTS: INDUSTRIAL ROBOTS MARKET, BY APPLICATION, 2024–2029 (THOUSAND UNITS)
  • TABLE 105 OTHER TRADITIONAL ROBOTS: INDUSTRIAL ROBOTICS MARKET, BY APPLICATION, 2020–2023 (USD MILLION)
  • TABLE 106 OTHER TRADITIONAL ROBOTS: INDUSTRIAL ROBOTICS MARKET, BY APPLICATION, 2024–2029 (USD MILLION)
  • TABLE 107 OTHER TRADITIONAL ROBOTS: INDUSTRIAL ROBOTS MARKET, BY END-USE INDUSTRY, 2020–2023 (USD MILLION)
  • TABLE 108 OTHER TRADITIONAL ROBOTS: INDUSTRIAL ROBOTS MARKET, BY END-USE INDUSTRY, 2024–2029 (USD MILLION)
  • TABLE 109 OTHER TRADITIONAL ROBOTS: INDUSTRIAL ROBOTS MARKET, BY END-USE INDUSTRY, 2020–2023 (THOUSAND UNITS)
  • TABLE 110 OTHER TRADITIONAL ROBOTS: INDUSTRIAL ROBOTS MARKET, BY END-USE INDUSTRY, 2024–2029 (THOUSAND UNITS)
  • TABLE 111 OTHER TRADITIONAL ROBOTS: INDUSTRIAL ROBOTICS MARKET, BY END-USE INDUSTRY, 2020–2023 (USD MILLION)
  • TABLE 112 OTHER TRADITIONAL ROBOTS: INDUSTRIAL ROBOTICS MARKET, BY END-USE INDUSTRY, 2024–2029 (USD MILLION)
  • TABLE 113 SUMMARY OF COLLABORATIVE ROBOTS
  • TABLE 114 COLLABORATIVE INDUSTRIAL ROBOTS MARKET, BY VALUE AND VOLUME, 2020–2023
  • TABLE 115 COLLABORATIVE INDUSTRIAL ROBOTS MARKET, BY VALUE AND VOLUME, 2024–2029
  • TABLE 116 INDUSTRIAL ROBOTS MARKET, BY PAYLOAD, 2020–2023 (USD MILLION)
  • TABLE 117 INDUSTRIAL ROBOTS MARKET, BY PAYLOAD, 2024–2029 (USD MILLION)
  • TABLE 118 INDUSTRIAL ROBOTS MARKET, BY PAYLOAD, 2020–2023 (THOUSAND UNITS)
  • TABLE 119 INDUSTRIAL ROBOTS MARKET, BY PAYLOAD, 2024–2029 (THOUSAND UNITS)
  • TABLE 120 TYPES OF INDUSTRIAL ROBOTS WITH UP TO 16 KG PAYLOAD CAPACITY
  • TABLE 121 TYPES OF INDUSTRIAL ROBOTS WITH >16 TO 60 KG PAYLOAD CAPACITY
  • TABLE 122 TYPES OF INDUSTRIAL ROBOTS WITH >60 TO 225 KG PAYLOAD CAPACITY
  • TABLE 123 TYPES OF INDUSTRIAL ROBOTS WITH ABOVE 225 KG PAYLOAD CAPACITY
  • TABLE 124 TRADITIONAL ROBOTS: INDUSTRIAL ROBOTICS MARKET, BY OFFERING, 2020–2023 (USD MILLION)
  • TABLE 125 TRADITIONAL ROBOTS: INDUSTRIAL ROBOTICS MARKET, BY OFFERING, 2024–2029 (USD MILLION)
  • TABLE 126 COMPARISON AMONG MECHANICAL, ELECTRIC, AND MAGNETIC GRIPPERS
  • TABLE 127 INDUSTRIAL ROBOTS MARKET, BY APPLICATION, 2020–2023 (USD MILLION)
  • TABLE 128 INDUSTRIAL ROBOTS MARKET, BY APPLICATION, 2024–2029 (USD MILLION)
  • TABLE 129 INDUSTRIAL ROBOTS MARKET, BY APPLICATION, 2020–2023 (THOUSAND UNITS)
  • TABLE 130 INDUSTRIAL ROBOTS MARKET, BY APPLICATION, 2024–2029 (THOUSAND UNITS)
  • TABLE 131 TRADITIONAL INDUSTRIAL ROBOTS MARKET, BY APPLICATION, 2020–2023 (USD MILLION)
  • TABLE 132 TRADITIONAL INDUSTRIAL ROBOTS MARKET, BY APPLICATION, 2024–2029 (USD MILLION)
  • TABLE 133 TRADITIONAL INDUSTRIAL ROBOTS MARKET, BY APPLICATION, 2020–2023 (THOUSAND UNITS)
  • TABLE 134 TRADITIONAL INDUSTRIAL ROBOTS MARKET, BY APPLICATION, 2024–2029 (THOUSAND UNITS)
  • TABLE 135 COLLABORATIVE INDUSTRIAL ROBOTS MARKET, BY APPLICATION, 2020–2023 (USD MILLION)
  • TABLE 136 COLLABORATIVE INDUSTRIAL ROBOTS MARKET, BY APPLICATION, 2024–2029 (USD MILLION)
  • TABLE 137 COLLABORATIVE INDUSTRIAL ROBOTS MARKET, BY APPLICATION, 2020–2023 (THOUSAND UNITS)
  • TABLE 138 COLLABORATIVE INDUSTRIAL ROBOTS MARKET, BY APPLICATION, 2024–2029 (THOUSAND UNITS)
  • TABLE 139 COMPANIES OFFERING INDUSTRIAL ROBOTS FOR HANDLING APPLICATIONS
  • TABLE 140 HANDLING: INDUSTRIAL ROBOTS MARKET, BY ROBOT TYPE, 2020–2023 (USD MILLION)
  • TABLE 141 HANDLING: INDUSTRIAL ROBOTS MARKET, BY ROBOT TYPE, 2024–2029 (USD MILLION)
  • TABLE 142 HANDLING: INDUSTRIAL ROBOTS MARKET, BY ROBOT TYPE, 2020–2023 (THOUSAND UNITS)
  • TABLE 143 HANDLING: INDUSTRIAL ROBOTS MARKET, BY ROBOT TYPE, 2024–2029 (THOUSAND UNITS)
  • TABLE 144 HANDLING: TRADITIONAL INDUSTRIAL ROBOTS MARKET, BY TYPE, 2020–2023 (USD MILLION)
  • TABLE 145 HANDLING: TRADITIONAL INDUSTRIAL ROBOTS MARKET, BY TYPE, 2024–2029 (USD MILLION)
  • TABLE 146 HANDLING: TRADITIONAL INDUSTRIAL ROBOTS MARKET, BY TYPE, 2020–2023 (THOUSAND UNITS)
  • TABLE 147 HANDLING: TRADITIONAL INDUSTRIAL ROBOTS MARKET, BY TYPE, 2024–2029 (THOUSAND UNITS)
  • TABLE 148 COMPANIES OFFERING INDUSTRIAL ROBOTS FOR ASSEMBLING & DISASSEMBLING APPLICATIONS
  • TABLE 149 ASSEMBLING & DISASSEMBLING: INDUSTRIAL ROBOTS MARKET, BY ROBOT TYPE, 2020–2023 (USD MILLION)
  • TABLE 150 ASSEMBLING & DISASSEMBLING: INDUSTRIAL ROBOTS MARKET, BY ROBOT TYPE, 2024–2029 (USD MILLION)
  • TABLE 151 ASSEMBLING & DISASSEMBLING: INDUSTRIAL ROBOTS MARKET, BY ROBOT TYPE, 2020–2023 (THOUSAND UNITS)
  • TABLE 152 ASSEMBLING & DISASSEMBLING: INDUSTRIAL ROBOTS MARKET, BY ROBOT TYPE, 2024–2029 (THOUSAND UNITS)
  • TABLE 153 ASSEMBLING & DISASSEMBLING: TRADITIONAL INDUSTRIAL ROBOTS MARKET, BY TYPE, 2020–2023 (USD MILLION)
  • TABLE 154 ASSEMBLING & DISASSEMBLING: TRADITIONAL INDUSTRIAL ROBOTS MARKET, BY TYPE, 2024–2029 (USD MILLION)
  • TABLE 155 ASSEMBLING & DISASSEMBLING: TRADITIONAL INDUSTRIAL ROBOTS MARKET, BY TYPE, 2020–2023 (THOUSAND UNITS)
  • TABLE 156 ASSEMBLING & DISASSEMBLING: TRADITIONAL INDUSTRIAL ROBOTS MARKET, BY TYPE, 2024–2029 (THOUSAND UNITS)
  • TABLE 157 COMPANIES OFFERING INDUSTRIAL ROBOTS FOR WELDING & SOLDERING APPLICATIONS
  • TABLE 158 WELDING & SOLDERING: INDUSTRIAL ROBOTS MARKET, BY ROBOT TYPE, 2020–2023 (USD MILLION)
  • TABLE 159 WELDING & SOLDERING: INDUSTRIAL ROBOTS MARKET, BY ROBOT TYPE, 2024–2029 (USD MILLION)
  • TABLE 160 WELDING & SOLDERING: INDUSTRIAL ROBOTS MARKET, BY ROBOT TYPE, 2020–2023 (THOUSAND UNITS)
  • TABLE 161 WELDING & SOLDERING: INDUSTRIAL ROBOTS MARKET, BY ROBOT TYPE, 2024–2029 (THOUSAND UNITS)
  • TABLE 162 WELDING & SOLDERING: TRADITIONAL INDUSTRIAL ROBOTS MARKET, BY TYPE, 2020–2023 (USD MILLION)
  • TABLE 163 WELDING & SOLDERING: TRADITIONAL INDUSTRIAL ROBOTS MARKET, BY TYPE, 2024–2029 (USD MILLION)
  • TABLE 164 WELDING & SOLDERING: TRADITIONAL INDUSTRIAL ROBOTS MARKET, BY TYPE, 2020–2023 (THOUSAND UNITS)
  • TABLE 165 WELDING & SOLDERING: TRADITIONAL INDUSTRIAL ROBOTS MARKET, BY TYPE, 2024–2029 (THOUSAND UNITS)
  • TABLE 166 COMPANIES OFFERING INDUSTRIAL ROBOTS FOR DISPENSING APPLICATIONS
  • TABLE 167 DISPENSING: INDUSTRIAL ROBOTS MARKET, BY ROBOT TYPE, 2020–2023 (USD MILLION)
  • TABLE 168 DISPENSING: INDUSTRIAL ROBOTS MARKET, BY ROBOT TYPE, 2024–2029 (USD MILLION)
  • TABLE 169 DISPENSING: INDUSTRIAL ROBOTS MARKET, BY ROBOT TYPE, 2020–2023 (THOUSAND UNITS)
  • TABLE 170 DISPENSING: INDUSTRIAL ROBOTS MARKET, BY ROBOT TYPE, 2024–2029 (THOUSAND UNITS)
  • TABLE 171 DISPENSING: TRADITIONAL INDUSTRIAL ROBOTS MARKET, BY TYPE, 2020–2023 (USD MILLION)
  • TABLE 172 DISPENSING: TRADITIONAL INDUSTRIAL ROBOTS MARKET, BY TYPE, 2024–2029 (USD MILLION)
  • TABLE 173 DISPENSING: TRADITIONAL INDUSTRIAL ROBOTS MARKET, BY TYPE, 2020–2023 (THOUSAND UNITS)
  • TABLE 174 DISPENSING: TRADITIONAL INDUSTRIAL ROBOTS MARKET, BY TYPE, 2024–2029 (THOUSAND UNITS)
  • TABLE 175 COMPANIES OFFERING INDUSTRIAL ROBOTS FOR PROCESSING APPLICATIONS
  • TABLE 176 PROCESSING: INDUSTRIAL ROBOTS MARKET, BY ROBOT TYPE, 2020–2023 (USD MILLION)
  • TABLE 177 PROCESSING: INDUSTRIAL ROBOTS MARKET, BY ROBOT TYPE, 2024–2029 (USD MILLION)
  • TABLE 178 PROCESSING: INDUSTRIAL ROBOTS MARKET, BY ROBOT TYPE, 2020–2023 (THOUSAND UNITS)
  • TABLE 179 PROCESSING: INDUSTRIAL ROBOTS MARKET, BY ROBOT TYPE, 2024–2029 (THOUSAND UNITS)
  • TABLE 180 PROCESSING: TRADITIONAL INDUSTRIAL ROBOTS MARKET, BY TYPE, 2020–2023 (USD MILLION)
  • TABLE 181 PROCESSING: TRADITIONAL INDUSTRIAL ROBOTS MARKET, BY TYPE, 2024–2029 (USD MILLION)
  • TABLE 182 PROCESSING: TRADITIONAL INDUSTRIAL ROBOTS MARKET, BY TYPE, 2020–2023 (THOUSAND UNITS)
  • TABLE 183 PROCESSING: TRADITIONAL INDUSTRIAL ROBOTS MARKET, BY TYPE, 2024–2029 (THOUSAND UNITS)
  • TABLE 184 CLEANROOM: INDUSTRIAL ROBOTS MARKET, BY ROBOT TYPE, 2020–2023 (USD MILLION)
  • TABLE 185 CLEANROOM: INDUSTRIAL ROBOTS MARKET, BY ROBOT TYPE, 2024–2029 (USD MILLION)
  • TABLE 186 CLEANROOM: INDUSTRIAL ROBOTS MARKET, BY ROBOT TYPE, 2020–2023 (THOUSAND UNITS)
  • TABLE 187 CLEANROOM: INDUSTRIAL ROBOTS MARKET, BY ROBOT TYPE, 2024–2029 (THOUSAND UNITS)
  • TABLE 188 CLEANROOM: TRADITIONAL INDUSTRIAL ROBOTS MARKET, BY TYPE, 2020–2023 (USD MILLION)
  • TABLE 189 CLEANROOM: TRADITIONAL INDUSTRIAL ROBOTS MARKET, BY TYPE, 2024–2029 (USD MILLION)
  • TABLE 190 CLEANROOM: TRADITIONAL INDUSTRIAL ROBOTS MARKET, BY TYPE, 2020–2023 (THOUSAND UNITS)
  • TABLE 191 CLEANROOM: TRADITIONAL INDUSTRIAL ROBOTS MARKET, BY TYPE, 2024–2029 (THOUSAND UNITS)
  • TABLE 192 COMPANIES OFFERING INDUSTRIAL ROBOTS FOR OTHER APPLICATIONS
  • TABLE 193 OTHER APPLICATIONS: INDUSTRIAL ROBOTS MARKET, BY ROBOT TYPE, 2020–2023 (USD MILLION)
  • TABLE 194 OTHER APPLICATIONS: INDUSTRIAL ROBOTS MARKET, BY ROBOT TYPE, 2024–2029 (USD MILLION)
  • TABLE 195 OTHER APPLICATIONS: INDUSTRIAL ROBOTS MARKET, BY ROBOT TYPE, 2020–2023 (THOUSAND UNITS)
  • TABLE 196 OTHER APPLICATIONS: INDUSTRIAL ROBOTS MARKET, BY ROBOT TYPE, 2024–2029 (THOUSAND UNITS)
  • TABLE 197 OTHER APPLICATIONS: TRADITIONAL INDUSTRIAL ROBOTS MARKET, BY TYPE, 2020–2023 (USD MILLION)
  • TABLE 198 OTHER APPLICATIONS: TRADITIONAL INDUSTRIAL ROBOTS MARKET, BY TYPE, 2024–2029 (USD MILLION)
  • TABLE 199 OTHER APPLICATIONS: TRADITIONAL INDUSTRIAL ROBOTS MARKET, BY TYPE, 2020–2023 (THOUSAND UNITS)
  • TABLE 200 OTHER APPLICATIONS: TRADITIONAL INDUSTRIAL ROBOTS MARKET, BY TYPE, 2024–2029 (THOUSAND UNITS)
  • TABLE 201 INDUSTRIAL ROBOTS MARKET, BY END-USE INDUSTRY, 2020–2023 (USD MILLION)
  • TABLE 202 INDUSTRIAL ROBOTS MARKET, BY END-USE INDUSTRY, 2024–2029 (USD MILLION)
  • TABLE 203 INDUSTRIAL ROBOTS MARKET, BY END-USE INDUSTRY, 2020–2023 (THOUSAND UNITS)
  • TABLE 204 INDUSTRIAL ROBOTS MARKET, BY END-USE INDUSTRY, 2024–2029 (THOUSAND UNITS)
  • TABLE 205 TRADITIONAL INDUSTRIAL ROBOTS MARKET, BY END-USE INDUSTRY, 2020–2023 (USD MILLION)
  • TABLE 206 TRADITIONAL INDUSTRIAL ROBOTS MARKET, BY END-USE INDUSTRY, 2024–2029 (USD MILLION)
  • TABLE 207 TRADITIONAL INDUSTRIAL ROBOTS MARKET, BY END-USE INDUSTRY, 2020–2023 (THOUSAND UNITS)
  • TABLE 208 TRADITIONAL INDUSTRIAL ROBOTS MARKET, BY END-USE INDUSTRY, 2024–2029 (THOUSAND UNITS)
  • TABLE 209 COLLABORATIVE INDUSTRIAL ROBOTS MARKET, BY END-USE INDUSTRY, 2020–2023 (USD MILLION)
  • TABLE 210 COLLABORATIVE INDUSTRIAL ROBOTS MARKET, BY END-USE INDUSTRY, 2024–2029 (USD MILLION)
  • TABLE 211 COLLABORATIVE INDUSTRIAL ROBOTS MARKET, BY END-USE INDUSTRY, 2020–2023 (THOUSAND UNITS)
  • TABLE 212 COLLABORATIVE INDUSTRIAL ROBOTS MARKET, BY END-USE INDUSTRY, 2024–2029 (THOUSAND UNITS)
  • TABLE 213 AUTOMOTIVE: TRADITIONAL INDUSTRIAL ROBOTS MARKET, BY REGION, 2020–2023 (THOUSAND UNITS)
  • TABLE 214 AUTOMOTIVE: TRADITIONAL INDUSTRIAL ROBOTS MARKET, BY REGION, 2024–2029 (THOUSAND UNITS)
  • TABLE 215 AUTOMOTIVE: TRADITIONAL INDUSTRIAL ROBOTS MARKET IN NORTH AMERICA, BY COUNTRY, 2020–2023 (THOUSAND UNITS)
  • TABLE 216 AUTOMOTIVE: TRADITIONAL INDUSTRIAL ROBOTS MARKET IN NORTH AMERICA, BY COUNTRY, 2024–2029 (THOUSAND UNITS)
  • TABLE 217 AUTOMOTIVE: TRADITIONAL INDUSTRIAL ROBOTS MARKET IN EUROPE, BY COUNTRY, 2020–2023 (THOUSAND UNITS)
  • TABLE 218 AUTOMOTIVE: TRADITIONAL INDUSTRIAL ROBOTS MARKET IN EUROPE, BY COUNTRY, 2024–2029 (THOUSAND UNITS)
  • TABLE 219 AUTOMOTIVE: TRADITIONAL INDUSTRIAL ROBOTS MARKET IN ASIA PACIFIC, BY COUNTRY, 2020–2023 (THOUSAND UNITS)
  • TABLE 220 AUTOMOTIVE: TRADITIONAL INDUSTRIAL ROBOTS MARKET IN ASIA PACIFIC, BY COUNTRY, 2024–2029 (THOUSAND UNITS)
  • TABLE 221 AUTOMOTIVE: TRADITIONAL INDUSTRIAL ROBOTS MARKET IN ROW, BY REGION, 2020–2023 (THOUSAND UNITS)
  • TABLE 222 AUTOMOTIVE: TRADITIONAL INDUSTRIAL ROBOTS MARKET IN ROW, BY REGION, 2024–2029 (THOUSAND UNITS)
  • TABLE 223 ELECTRICAL & ELECTRONICS: TRADITIONAL INDUSTRIAL ROBOTS MARKET, BY REGION, 2020–2023 (THOUSAND UNITS)
  • TABLE 224 ELECTRICAL & ELECTRONICS: TRADITIONAL INDUSTRIAL ROBOTS MARKET, BY REGION, 2024–2029 (THOUSAND UNITS)
  • TABLE 225 ELECTRICAL & ELECTRONICS: TRADITIONAL INDUSTRIAL ROBOTS MARKET IN NORTH AMERICA, BY COUNTRY, 2020–2023 (THOUSAND UNITS)
  • TABLE 226 ELECTRICAL & ELECTRONICS: TRADITIONAL INDUSTRIAL ROBOTS MARKET IN NORTH AMERICA, BY COUNTRY, 2024–2029 (THOUSAND UNITS)
  • TABLE 227 ELECTRICAL & ELECTRONICS: TRADITIONAL INDUSTRIAL ROBOTS MARKET IN EUROPE, BY COUNTRY, 2020–2023 (THOUSAND UNITS)
  • TABLE 228 ELECTRICAL & ELECTRONICS: TRADITIONAL INDUSTRIAL ROBOTS MARKET IN EUROPE, BY COUNTRY, 2024–2029 (THOUSAND UNITS)
  • TABLE 229 ELECTRICAL & ELECTRONICS: TRADITIONAL INDUSTRIAL ROBOTS MARKET IN ASIA PACIFIC, BY COUNTRY, 2020–2023 (THOUSAND UNITS)
  • TABLE 230 ELECTRICAL & ELECTRONICS: TRADITIONAL INDUSTRIAL ROBOTS MARKET IN ASIA PACIFIC, BY COUNTRY, 2024–2029 (THOUSAND UNITS)
  • TABLE 231 ELECTRICAL & ELECTRONICS: TRADITIONAL INDUSTRIAL ROBOTS MARKET IN ROW, BY REGION, 2020–2023 (THOUSAND UNITS)
  • TABLE 232 ELECTRICAL & ELECTRONICS: TRADITIONAL INDUSTRIAL ROBOTS MARKET IN ROW, BY REGION, 2024–2029 (THOUSAND UNITS)
  • TABLE 233 METALS & MACHINERY: TRADITIONAL INDUSTRIAL ROBOTS MARKET, BY REGION, 2020–2023 (THOUSAND UNITS)
  • TABLE 234 METALS & MACHINERY: TRADITIONAL INDUSTRIAL ROBOTS MARKET, BY REGION, 2024–2029 (THOUSAND UNITS)
  • TABLE 235 METALS & MACHINERY: TRADITIONAL INDUSTRIAL ROBOTS MARKET IN NORTH AMERICA, BY COUNTRY, 2020–2023 (THOUSAND UNITS)
  • TABLE 236 METALS & MACHINERY: TRADITIONAL INDUSTRIAL ROBOTS MARKET IN NORTH AMERICA, BY COUNTRY, 2024–2029 (THOUSAND UNITS)
  • TABLE 237 METALS & MACHINERY: TRADITIONAL INDUSTRIAL ROBOTS MARKET IN EUROPE, BY COUNTRY, 2020–2023 (THOUSAND UNITS)
  • TABLE 238 METALS & MACHINERY: TRADITIONAL INDUSTRIAL ROBOTS MARKET IN EUROPE, BY COUNTRY, 2024–2029 (THOUSAND UNITS)
  • TABLE 239 METALS & MACHINERY: TRADITIONAL INDUSTRIAL ROBOTS MARKET IN ASIA PACIFIC, BY COUNTRY, 2020–2023 (THOUSAND UNITS)
  • TABLE 240 METALS & MACHINERY: TRADITIONAL INDUSTRIAL ROBOTS MARKET IN ASIA PACIFIC, BY COUNTRY, 2024–2029 (THOUSAND UNITS)
  • TABLE 241 METALS & MACHINERY: TRADITIONAL INDUSTRIAL ROBOTS MARKET IN ROW, BY REGION, 2020–2023 (THOUSAND UNITS)
  • TABLE 242 METALS & MACHINERY: TRADITIONAL INDUSTRIAL ROBOTS MARKET IN ROW, BY REGION, 2024–2029 (THOUSAND UNITS)
  • TABLE 243 PLASTICS, RUBBER & CHEMICALS: TRADITIONAL INDUSTRIAL ROBOTS MARKET, BY REGION, 2020–2023 (THOUSAND UNITS)
  • TABLE 244 PLASTICS, RUBBER & CHEMICALS: TRADITIONAL INDUSTRIAL ROBOTS MARKET, BY REGION, 2024–2029 (THOUSAND UNITS)
  • TABLE 245 PLASTICS, RUBBER & CHEMICALS: TRADITIONAL INDUSTRIAL ROBOTS MARKET IN NORTH AMERICA, BY COUNTRY, 2020–2023 (THOUSAND UNITS)
  • TABLE 246 PLASTICS, RUBBER & CHEMICALS: TRADITIONAL INDUSTRIAL ROBOTS MARKET IN NORTH AMERICA, BY COUNTRY, 2024–2029 (THOUSAND UNITS)
  • TABLE 247 PLASTICS, RUBBER & CHEMICALS: TRADITIONAL INDUSTRIAL ROBOTS MARKET IN EUROPE, BY COUNTRY, 2020–2023 (THOUSAND UNITS)
  • TABLE 248 PLASTICS, RUBBER & CHEMICALS: TRADITIONAL INDUSTRIAL ROBOTS MARKET IN EUROPE, BY COUNTRY, 2024–2029 (THOUSAND UNITS)
  • TABLE 249 PLASTICS, RUBBER & CHEMICALS: TRADITIONAL INDUSTRIAL ROBOTS MARKET IN ASIA PACIFIC, BY COUNTRY, 2020–2023 (THOUSAND UNITS)
  • TABLE 250 PLASTICS, RUBBER & CHEMICALS: TRADITIONAL INDUSTRIAL ROBOTS MARKET IN ASIA PACIFIC, BY COUNTRY, 2024–2029 (THOUSAND UNITS)
  • TABLE 251 PLASTICS, RUBBER & CHEMICALS: TRADITIONAL INDUSTRIAL ROBOTS MARKET IN ROW, BY REGION, 2020–2023 (THOUSAND UNITS)
  • TABLE 252 PLASTICS, RUBBER & CHEMICALS: TRADITIONAL INDUSTRIAL ROBOTS MARKET IN ROW, BY REGION, 2024–2029 (THOUSAND UNITS)
  • TABLE 253 FOOD & BEVERAGES: TRADITIONAL INDUSTRIAL ROBOTS MARKET, BY REGION, 2020–2023 (THOUSAND UNITS)
  • TABLE 254 FOOD & BEVERAGES: TRADITIONAL INDUSTRIAL ROBOTS MARKET, BY REGION, 2024–2029 (THOUSAND UNITS)
  • TABLE 255 FOOD & BEVERAGES: TRADITIONAL INDUSTRIAL ROBOTS MARKET IN NORTH AMERICA, BY COUNTRY, 2020–2023 (THOUSAND UNITS)
  • TABLE 256 FOOD & BEVERAGES: TRADITIONAL INDUSTRIAL ROBOTS MARKET IN NORTH AMERICA, BY COUNTRY, 2024–2029 (THOUSAND UNITS)
  • TABLE 257 FOOD & BEVERAGES: TRADITIONAL INDUSTRIAL ROBOTS MARKET IN EUROPE, BY COUNTRY, 2020–2023 (THOUSAND UNITS)
  • TABLE 258 FOOD & BEVERAGES: TRADITIONAL INDUSTRIAL ROBOTS MARKET IN EUROPE, BY COUNTRY, 2024–2029 (THOUSAND UNITS)
  • TABLE 259 FOOD & BEVERAGES: TRADITIONAL INDUSTRIAL ROBOTS MARKET IN ASIA PACIFIC, BY COUNTRY, 2020–2023 (THOUSAND UNITS)
  • TABLE 260 FOOD & BEVERAGES: TRADITIONAL INDUSTRIAL ROBOTS MARKET IN ASIA PACIFIC, BY COUNTRY, 2024–2029 (THOUSAND UNITS)
  • TABLE 261 FOOD & BEVERAGES: TRADITIONAL INDUSTRIAL ROBOTS MARKET IN ROW, BY REGION, 2020–2023 (THOUSAND UNITS)
  • TABLE 262 FOOD & BEVERAGES: TRADITIONAL INDUSTRIAL ROBOTS MARKET IN ROW, BY REGION, 2024–2029 (THOUSAND UNITS)
  • TABLE 263 PRECISION ENGINEERING & OPTICS: TRADITIONAL INDUSTRIAL ROBOTS MARKET, BY REGION, 2020–2023 (THOUSAND UNITS)
  • TABLE 264 PRECISION ENGINEERING & OPTICS: TRADITIONAL INDUSTRIAL ROBOTS MARKET, BY REGION, 2024–2029 (THOUSAND UNITS)
  • TABLE 265 PRECISION ENGINEERING & OPTICS: TRADITIONAL INDUSTRIAL ROBOTS MARKET IN NORTH AMERICA, BY COUNTRY, 2020–2023 (THOUSAND UNITS)
  • TABLE 266 PRECISION ENGINEERING & OPTICS: TRADITIONAL INDUSTRIAL ROBOTS MARKET IN NORTH AMERICA, BY COUNTRY, 2024–2029 (THOUSAND UNITS)
  • TABLE 267 PRECISION ENGINEERING & OPTICS: TRADITIONAL INDUSTRIAL ROBOTS MARKET IN EUROPE, BY COUNTRY, 2020–2023 (THOUSAND UNITS)
  • TABLE 268 PRECISION ENGINEERING & OPTICS: TRADITIONAL INDUSTRIAL ROBOTS MARKET IN EUROPE, BY COUNTRY, 2024–2029 (THOUSAND UNITS)
  • TABLE 269 PRECISION ENGINEERING & OPTICS: TRADITIONAL INDUSTRIAL ROBOTS MARKET IN ASIA PACIFIC, BY COUNTRY, 2020–2023 (THOUSAND UNITS)
  • TABLE 270 PRECISION ENGINEERING & OPTICS: TRADITIONAL INDUSTRIAL ROBOTS MARKET IN ASIA PACIFIC, BY COUNTRY, 2024–2029 (THOUSAND UNITS)
  • TABLE 271 PRECISION ENGINEERING & OPTICS: TRADITIONAL INDUSTRIAL ROBOTS MARKET IN ROW, BY REGION, 2020–2023 (THOUSAND UNITS)
  • TABLE 272 PRECISION ENGINEERING & OPTICS: TRADITIONAL INDUSTRIAL ROBOTS MARKET IN ROW, BY REGION, 2024–2029 (THOUSAND UNITS)
  • TABLE 273 PHARMACEUTICALS & COSMETICS: TRADITIONAL INDUSTRIAL ROBOTS MARKET, BY REGION, 2020–2023 (THOUSAND UNITS)
  • TABLE 274 PHARMACEUTICALS & COSMETICS: TRADITIONAL INDUSTRIAL ROBOTS MARKET, BY REGION, 2024–2029 (THOUSAND UNITS)
  • TABLE 275 PHARMACEUTICALS & COSMETICS: TRADITIONAL INDUSTRIAL ROBOTS MARKET IN NORTH AMERICA, BY COUNTRY, 2020–2023 (THOUSAND UNITS)
  • TABLE 276 PHARMACEUTICALS & COSMETICS: TRADITIONAL INDUSTRIAL ROBOTS MARKET IN NORTH AMERICA, BY COUNTRY, 2024–2029 (THOUSAND UNITS)
  • TABLE 277 PHARMACEUTICALS & COSMETICS: TRADITIONAL INDUSTRIAL ROBOTS MARKET IN EUROPE, BY COUNTRY, 2020–2023 (THOUSAND UNITS)
  • TABLE 278 PHARMACEUTICALS & COSMETICS: TRADITIONAL INDUSTRIAL ROBOTS MARKET IN EUROPE, BY COUNTRY, 2024–2029 (THOUSAND UNITS)
  • TABLE 279 PHARMACEUTICALS & COSMETICS: TRADITIONAL INDUSTRIAL ROBOTS MARKET IN ASIA PACIFIC, BY COUNTRY, 2020–2023 (THOUSAND UNITS)
  • TABLE 280 PHARMACEUTICALS & COSMETICS: TRADITIONAL INDUSTRIAL ROBOTS MARKET IN ASIA PACIFIC, BY COUNTRY, 2024–2029 (THOUSAND UNITS)
  • TABLE 281 PHARMACEUTICALS & COSMETICS: TRADITIONAL INDUSTRIAL ROBOTS MARKET IN ROW, BY REGION, 2020–2023 (THOUSAND UNITS)
  • TABLE 282 PHARMACEUTICALS & COSMETICS: TRADITIONAL INDUSTRIAL ROBOTS MARKET IN ROW, BY REGION, 2024–2029 (THOUSAND UNITS)
  • TABLE 283 OIL & GAS: TRADITIONAL INDUSTRIAL ROBOTS MARKET, BY REGION, 2020–2023 (THOUSAND UNITS)
  • TABLE 284 OIL & GAS: TRADITIONAL INDUSTRIAL ROBOTS MARKET, BY REGION, 2024–2029 (THOUSAND UNITS)
  • TABLE 285 OIL & GAS: TRADITIONAL INDUSTRIAL ROBOTS MARKET IN NORTH AMERICA, BY COUNTRY, 2020–2023 (THOUSAND UNITS)
  • TABLE 286 OIL & GAS: TRADITIONAL INDUSTRIAL ROBOTS MARKET IN NORTH AMERICA, BY COUNTRY, 2024–2029 (THOUSAND UNITS)
  • TABLE 287 OIL & GAS: TRADITIONAL INDUSTRIAL ROBOTS MARKET IN EUROPE, BY COUNTRY, 2020–2023 (THOUSAND UNITS)
  • TABLE 288 OIL & GAS: TRADITIONAL INDUSTRIAL ROBOTS MARKET IN EUROPE, BY COUNTRY, 2024–2029 (THOUSAND UNITS)
  • TABLE 289 OIL & GAS: TRADITIONAL INDUSTRIAL ROBOTS MARKET IN ASIA PACIFIC, BY COUNTRY, 2020–2023 (THOUSAND UNITS)
  • TABLE 290 OIL & GAS: TRADITIONAL INDUSTRIAL ROBOTS MARKET IN ASIA PACIFIC, BY COUNTRY, 2024–2029 (THOUSAND UNITS)
  • TABLE 291 OIL & GAS: TRADITIONAL INDUSTRIAL ROBOTS MARKET IN ROW, BY REGION, 2020–2023 (THOUSAND UNITS)
  • TABLE 292 OIL & GAS: TRADITIONAL INDUSTRIAL ROBOTS MARKET IN ROW, BY REGION, 2024–2029 (THOUSAND UNITS)
  • TABLE 293 OTHER END-USE INDUSTRIES: TRADITIONAL INDUSTRIAL ROBOTS MARKET, BY REGION, 2020–2023 (THOUSAND UNITS)
  • TABLE 294 OTHER END-USE INDUSTRIES: TRADITIONAL INDUSTRIAL ROBOTS MARKET, BY REGION, 2024–2029 (THOUSAND UNITS)
  • TABLE 295 OTHER END-USE INDUSTRIES: TRADITIONAL INDUSTRIAL ROBOTS MARKET IN NORTH AMERICA, BY COUNTRY, 2020–2023 (THOUSAND UNITS)
  • TABLE 296 OTHER END-USE INDUSTRIES: TRADITIONAL INDUSTRIAL ROBOTS MARKET IN NORTH AMERICA, BY COUNTRY, 2024–2029 (THOUSAND UNITS)
  • TABLE 297 OTHER END-USE INDUSTRIES: TRADITIONAL INDUSTRIAL ROBOTS MARKET IN EUROPE, BY COUNTRY, 2020–2023 (THOUSAND UNITS)
  • TABLE 298 OTHER END-USE INDUSTRIES: TRADITIONAL INDUSTRIAL ROBOTS MARKET IN EUROPE, BY COUNTRY, 2024–2029 (THOUSAND UNITS)
  • TABLE 299 OTHER END-USE INDUSTRIES: TRADITIONAL INDUSTRIAL ROBOTS MARKET IN ASIA PACIFIC, BY COUNTRY, 2020–2023 (THOUSAND UNITS)
  • TABLE 300 OTHER END-USE INDUSTRIES: TRADITIONAL INDUSTRIAL ROBOTS MARKET IN ASIA PACIFIC, BY COUNTRY, 2024–2029 (THOUSAND UNITS)
  • TABLE 301 OTHER END-USE INDUSTRIES: TRADITIONAL INDUSTRIAL ROBOTS MARKET IN ROW, BY REGION, 2020–2023 (THOUSAND UNITS)
  • TABLE 302 OTHER END-USE INDUSTRIES: TRADITIONAL INDUSTRIAL ROBOTS MARKET IN ROW, BY REGION, 2024–2029 (THOUSAND UNITS)
  • TABLE 303 INDUSTRIAL ROBOTS MARKET, BY REGION, 2020–2023 (USD MILLION)
  • TABLE 304 INDUSTRIAL ROBOTS MARKET, BY REGION, 2024–2029 (USD MILLION)
  • TABLE 305 INDUSTRIAL ROBOTS MARKET, BY REGION, 2020–2023 (THOUSAND UNITS)
  • TABLE 306 INDUSTRIAL ROBOTS MARKET, BY REGION, 2024–2029 (THOUSAND UNITS)
  • TABLE 307 TRADITIONAL INDUSTRIAL ROBOTS MARKET, BY REGION, 2020–2023 (USD MILLION)
  • TABLE 308 TRADITIONAL INDUSTRIAL ROBOTS MARKET, BY REGION, 2024–2029 (USD MILLION)
  • TABLE 309 TRADITIONAL INDUSTRIAL ROBOTS MARKET, BY REGION, 2020–2023 (THOUSAND UNITS)
  • TABLE 310 TRADITIONAL INDUSTRIAL ROBOTS MARKET, BY REGION, 2024–2029 (THOUSAND UNITS)
  • TABLE 311 COLLABORATIVE INDUSTRIAL ROBOTS MARKET, BY REGION, 2020–2023 (USD MILLION)
  • TABLE 312 COLLABORATIVE INDUSTRIAL ROBOTS MARKET, BY REGION, 2024–2029 (USD MILLION)
  • TABLE 313 COLLABORATIVE INDUSTRIAL ROBOTS MARKET, BY REGION, 2020–2023 (THOUSAND UNITS)
  • TABLE 314 COLLABORATIVE INDUSTRIAL ROBOTS MARKET, BY REGION, 2024–2029 (THOUSAND UNITS)
  • TABLE 315 NORTH AMERICA: TRADITIONAL INDUSTRIAL ROBOTS MARKET, BY COUNTRY, 2020–2023 (THOUSAND UNITS)
  • TABLE 316 NORTH AMERICA: TRADITIONAL INDUSTRIAL ROBOTS MARKET, BY COUNTRY, 2024–2029 (THOUSAND UNITS)
  • TABLE 317 NORTH AMERICA: TRADITIONAL INDUSTRIAL ROBOTS MARKET, BY END-USE INDUSTRY, 2020–2023 (THOUSAND UNITS)
  • TABLE 318 NORTH AMERICA: TRADITIONAL INDUSTRIAL ROBOTS MARKET, BY END-USE INDUSTRY, 2024–2029 (THOUSAND UNITS)
  • TABLE 319 NORTH AMERICA: COLLABORATIVE INDUSTRIAL ROBOTS MARKET, BY COUNTRY, 2020–2023 (USD MILLION)
  • TABLE 320 NORTH AMERICA: COLLABORATIVE INDUSTRIAL ROBOTS MARKET, BY COUNTRY, 2024–2029 (USD MILLION)
  • TABLE 321 NORTH AMERICA: COLLABORATIVE INDUSTRIAL ROBOTS MARKET, BY COUNTRY, 2020–2023 (THOUSAND UNITS)
  • TABLE 322 NORTH AMERICA: COLLABORATIVE INDUSTRIAL ROBOTS MARKET, BY COUNTRY, 2024–2029 (THOUSAND UNITS)
  • TABLE 323 EUROPE: TRADITIONAL INDUSTRIAL ROBOTS MARKET, BY COUNTRY, 2020–2023 (THOUSAND UNITS)
  • TABLE 324 EUROPE: TRADITIONAL INDUSTRIAL ROBOTS MARKET, BY COUNTRY, 2024–2029 (THOUSAND UNITS)
  • TABLE 325 EUROPE: TRADITIONAL INDUSTRIAL ROBOTS MARKET, BY END-USE INDUSTRY, 2020–2023 (THOUSAND UNITS)
  • TABLE 326 EUROPE: TRADITIONAL INDUSTRIAL ROBOTS MARKET, BY END-USE INDUSTRY, 2024–2029 (THOUSAND UNITS)
  • TABLE 327 EUROPE: COLLABORATIVE INDUSTRIAL ROBOTS MARKET, BY COUNTRY, 2020–2023 (USD MILLION)
  • TABLE 328 EUROPE: COLLABORATIVE INDUSTRIAL ROBOTS MARKET, BY COUNTRY, 2024–2029 (USD MILLION)
  • TABLE 329 EUROPE: COLLABORATIVE INDUSTRIAL ROBOTS MARKET, BY COUNTRY, 2020–2023 (THOUSAND UNITS)
  • TABLE 330 EUROPE: COLLABORATIVE INDUSTRIAL ROBOTS MARKET, BY COUNTRY, 2024–2029 (THOUSAND UNITS)
  • TABLE 331 ASIA PACIFIC: TRADITIONAL INDUSTRIAL ROBOTS MARKET, BY COUNTRY, 2020–2023 (THOUSAND UNITS)
  • TABLE 332 ASIA PACIFIC: TRADITIONAL INDUSTRIAL ROBOTS MARKET, BY COUNTRY, 2024–2029 (THOUSAND UNITS)
  • TABLE 333 ASIA PACIFIC: TRADITIONAL INDUSTRIAL ROBOTS MARKET, BY END-USE INDUSTRY, 2020–2023 (THOUSAND UNITS)
  • TABLE 334 ASIA PACIFIC: TRADITIONAL INDUSTRIAL ROBOTS MARKET, BY END-USE INDUSTRY, 2024–2029 (THOUSAND UNITS)
  • TABLE 335 ASIA PACIFIC: COLLABORATIVE INDUSTRIAL ROBOTS MARKET, BY COUNTRY, 2020–2023 (USD MILLION)
  • TABLE 336 ASIA PACIFIC: COLLABORATIVE INDUSTRIAL ROBOTS MARKET, BY COUNTRY, 2024–2029 (USD MILLION)
  • TABLE 337 ASIA PACIFIC: COLLABORATIVE INDUSTRIAL ROBOTS MARKET, BY COUNTRY, 2020–2023 (THOUSAND UNITS)
  • TABLE 338 ASIA PACIFIC: COLLABORATIVE INDUSTRIAL ROBOTS MARKET, BY COUNTRY, 2024–2029 (THOUSAND UNITS)
  • TABLE 339 ROW: TRADITIONAL INDUSTRIAL ROBOTS MARKET, BY REGION, 2020–2023 (THOUSAND UNITS)
  • TABLE 340 ROW: TRADITIONAL INDUSTRIAL ROBOTS MARKET, BY REGION, 2024–2029 (THOUSAND UNITS)
  • TABLE 341 ROW: TRADITIONAL INDUSTRIAL ROBOTS MARKET, BY END-USE INDUSTRY, 2020–2023 (THOUSAND UNITS)
  • TABLE 342 ROW: TRADITIONAL INDUSTRIAL ROBOTS MARKET, BY END-USE INDUSTRY, 2024–2029 (THOUSAND UNITS)
  • TABLE 343 ROW: COLLABORATIVE INDUSTRIAL ROBOTS MARKET, BY REGION, 2020–2023 (USD MILLION)
  • TABLE 344 ROW: COLLABORATIVE INDUSTRIAL ROBOTS MARKET, BY REGION, 2024–2029 (USD MILLION)
  • TABLE 345 ROW: COLLABORATIVE INDUSTRIAL ROBOTS MARKET, BY REGION, 2020–2023 (THOUSAND UNITS)
  • TABLE 346 ROW: COLLABORATIVE INDUSTRIAL ROBOTS MARKET, BY REGION, 2024–2029 (THOUSAND UNITS)
  • TABLE 347 MIDDLE EAST: TRADITIONAL INDUSTRIAL ROBOTS MARKET, BY COUNTRY, 2020–2023 (THOUSAND UNITS)
  • TABLE 348 MIDDLE EAST: TRADITIONAL INDUSTRIAL ROBOTS MARKET, BY COUNTRY, 2024–2029 (THOUSAND UNITS)
  • TABLE 349 INDUSTRIAL ROBOTICS MARKET: OVERVIEW OF STRATEGIES ADOPTED BY KEY PLAYERS, 2020–2024
  • TABLE 350 INDUSTRIAL ROBOTS MARKET: DEGREE OF COMPETITION, 2023
  • TABLE 351 INDUSTRIAL ROBOTICS MARKET: PAYLOAD FOOTPRINT
  • TABLE 352 INDUSTRIAL ROBOTICS MARKET: ROBOT TYPE FOOTPRINT
  • TABLE 353 INDUSTRIAL ROBOTICS MARKET: END-USE INDUSTRY FOOTPRINT
  • TABLE 354 INDUSTRIAL ROBOTICS MARKET: REGION FOOTPRINT
  • TABLE 355 INDUSTRIAL ROBOTICS MARKET: DETAILED LIST OF KEY STARTUPS/SMES
  • TABLE 356 INDUSTRIAL ROBOTICS MARKET: COMPETITIVE BENCHMARKING OF KEY STARTUPS/SMES
  • TABLE 357 INDUSTRIAL ROBOTICS MARKET: PRODUCT LAUNCHES, JANUARY 2020–JULY 2024
  • TABLE 358 INDUSTRIAL ROBOTICS MARKET: DEALS, JANUARY 2020–JULY 2024
  • TABLE 359 INDUSTRIAL ROBOTICS MARKET: EXPANSIONS, JANUARY 2020–JULY 2024
  • TABLE 360 ABB: COMPANY OVERVIEW
  • TABLE 361 ABB: PRODUCTS/SOLUTIONS/SERVICES OFFERED
  • TABLE 362 ABB: PRODUCT LAUNCHES
  • TABLE 363 ABB: DEALS
  • TABLE 364 ABB: EXPANSIONS
  • TABLE 365 YASKAWA ELECTRIC CORPORATION: COMPANY OVERVIEW
  • TABLE 366 YASKAWA ELECTRIC CORPORATION: PRODUCTS/SOLUTIONS/SERVICES OFFERED
  • TABLE 367 YASKAWA ELECTRIC CORPORATION: PRODUCT LAUNCHES
  • TABLE 368 YASKAWA ELECTRIC CORPORATION: DEALS
  • TABLE 369 YASKAWA ELECTRIC CORPORATION: EXPANSIONS
  • TABLE 370 FANUC CORPORATION: COMPANY OVERVIEW
  • TABLE 371 FANUC CORPORATION: PRODUCTS/SOLUTIONS/SERVICES OFFERED
  • TABLE 372 FANUC CORPORATION: PRODUCT LAUNCHES
  • TABLE 373 FANUC CORPORATION: DEALS
  • TABLE 374 FANUC CORPORATION: EXPANSIONS
  • TABLE 375 KUKA AG: COMPANY OVERVIEW
  • TABLE 376 KUKA AG: PRODUCTS/SOLUTIONS/SERVICES OFFERED
  • TABLE 377 KUKA AG: PRODUCT LAUNCHES
  • TABLE 378 KUKA AG: DEALS
  • TABLE 379 MITSUBISHI ELECTRIC CORPORATION: COMPANY OVERVIEW
  • TABLE 380 MITSUBISHI ELECTRIC CORPORATION: PRODUCTS/SOLUTIONS/SERVICES OFFERED
  • TABLE 381 MITSUBISHI ELECTRIC CORPORATION: PRODUCT LAUNCHES
  • TABLE 382 MITSUBISHI ELECTRIC CORPORATION: DEALS
  • TABLE 383 MITSUBISHI ELECTRIC CORPORATION: EXPANSIONS
  • TABLE 384 KAWASAKI HEAVY INDUSTRIES, LTD.: COMPANY OVERVIEW
  • TABLE 385 KAWASAKI HEAVY INDUSTRIES, LTD.: PRODUCTS/SOLUTIONS/SERVICES OFFERED
  • TABLE 386 KAWASAKI HEAVY INDUSTRIES, LTD.: PRODUCT LAUNCHES
  • TABLE 387 KAWASAKI HEAVY INDUSTRIES, LTD.: DEALS
  • TABLE 388 DENSO CORPORATION: COMPANY OVERVIEW
  • TABLE 389 DENSO CORPORATION: PRODUCTS/SOLUTIONS/SERVICES OFFERED
  • TABLE 390 DENSO CORPORATION: PRODUCT LAUNCHES
  • TABLE 391 NACHI-FUJIKOSHI CORP.: COMPANY OVERVIEW
  • TABLE 392 NACHI-FUJIKOSHI CORP.: PRODUCTS/SOLUTIONS/SERVICES OFFERED
  • TABLE 393 NACHI-FUJIKOSHI CORP.: PRODUCT LAUNCHES
  • TABLE 394 SEIKO EPSON CORPORATION: COMPANY OVERVIEW
  • TABLE 395 SEIKO EPSON CORPORATION: PRODUCTS/SOLUTIONS/SERVICES OFFERED
  • TABLE 396 SEIKO EPSON CORPORATION: PRODUCT LAUNCHES
  • TABLE 397 SEIKO EPSON CORPORATION: DEALS
  • TABLE 398 DURR: COMPANY OVERVIEW
  • TABLE 399 DURR: PRODUCTS/SOLUTIONS/SERVICES OFFERED
  • TABLE 400 DURR: PRODUCT LAUNCHES
  • TABLE 401 DURR: DEALS
LIST OF FIGURES
 
  • FIGURE 1 INDUSTRIAL ROBOTICS MARKET SEGMENTATION
  • FIGURE 2 INDUSTRIAL ROBOTICS MARKET: RESEARCH DESIGN
  • FIGURE 3 INDUSTRIAL ROBOTS MARKET: BOTTOM-UP APPROACH
  • FIGURE 4 INDUSTRIAL ROBOTS MARKET SIZE ESTIMATION METHODOLOGY (DEMAND SIDE)
  • FIGURE 5 INDUSTRIAL ROBOTS MARKET: TOP-DOWN APPROACH
  • FIGURE 6 INDUSTRIAL ROBOTS MARKET SIZE ESTIMATION METHODOLOGY (SUPPLY SIDE)
  • FIGURE 7 INDUSTRIAL ROBOTICS MARKET: DATA TRIANGULATION
  • FIGURE 8 INDUSTRIAL ROBOTICS MARKET: RESEARCH LIMITATIONS
  • FIGURE 9 ARTICULATED ROBOTS TO DOMINATE TRADITIONAL INDUSTRIAL ROBOTS MARKET, IN TERMS OF VOLUME, DURING FORECAST PERIOD
  • FIGURE 10 >16 TO 60 KG SEGMENT TO REGISTER HIGHEST CAGR BETWEEN 2024 AND 2029
  • FIGURE 11 SOFTWARE & PROGRAMMING SEGMENT TO RECORD HIGHEST CAGR IN TRADITIONAL INDUSTRIAL ROBOTICS MARKET DURING FORECAST PERIOD
  • FIGURE 12 HANDLING SEGMENT TO HOLD LARGEST SHARE OF INDUSTRIAL ROBOTS MARKET IN 2024
  • FIGURE 13 FOOD & BEVERAGES SEGMENT TO RECORD HIGHEST CAGR DURING FORECAST PERIOD
  • FIGURE 14 ASIA PACIFIC ACCOUNTED FOR LARGEST MARKET SHARE IN 2023
  • FIGURE 15 RAPID DIGITALIZATION AND ADOPTION OF IOT TECHNOLOGIES TO CONTRIBUTE TO MARKET GROWTH
  • FIGURE 16 COLLABORATIVE ROBOTS SEGMENT HELD LARGER MARKET SHARE IN 2024
  • FIGURE 17 ELECTRICAL & ELECTRONICS SEGMENT AND CHINA TO HOLD LARGEST SHARES OF ASIA PACIFIC INDUSTRIAL ROBOTS MARKET IN 2024
  • FIGURE 18 INDIA TO EXHIBIT HIGHEST CAGR IN GLOBAL INDUSTRIAL ROBOTS MARKET DURING FORECAST PERIOD
  • FIGURE 19 DRIVERS, RESTRAINTS, OPPORTUNITIES, AND CHALLENGES
  • FIGURE 20 IMPACT ANALYSIS: DRIVERS
  • FIGURE 21 SHIPMENT OF COLLABORATIVE ROBOTS, 2020–2022
  • FIGURE 22 IMPACT ANALYSIS: RESTRAINTS
  • FIGURE 23 IMPACT ANALYSIS: OPPORTUNITIES
  • FIGURE 24 IMPACT ANALYSIS: CHALLENGES
  • FIGURE 25 INDUSTRIAL ROBOTICS VALUE CHAIN
  • FIGURE 26 INDUSTRIAL ROBOTICS ECOSYSTEM
  • FIGURE 27 INDICATIVE PRICING TREND OF INDUSTRIAL ROBOTS OFFERED BY KEY PLAYERS, BY ROBOT TYPE
  • FIGURE 28 AVERAGE SELLING PRICE TREND OF TRADITIONAL INDUSTRIAL ROBOTS, BY TYPE, 2020–2023
  • FIGURE 29 AVERAGE SELLING PRICE TREND OF ARTICULATED ROBOTS, BY REGION, 2020–2023
  • FIGURE 30 INVESTMENT AND FUNDING SCENARIO
  • FIGURE 31 TRENDS/DISRUPTIONS IMPACTING CUSTOMER BUSINESS
  • FIGURE 32 PATENTS APPLIED AND GRANTED, 2013–2023
  • FIGURE 33 IMPORT DATA FOR HS CODE 847950-COMPLIANT PRODUCTS, BY COUNTRY, 2019–2023 (USD THOUSAND)
  • FIGURE 34 EXPORT DATA FOR HS CODE 847950-COMPLIANT PRODUCTS, BY COUNTRY, 2019–2023 (USD THOUSAND)
  • FIGURE 35 PORTER’S FIVE FORCES ANALYSIS
  • FIGURE 36 INFLUENCE OF STAKEHOLDERS ON BUYING PROCESS FOR TOP THREE END-USE INDUSTRIES
  • FIGURE 37 KEY BUYING CRITERIA FOR TOP THREE END-USE INDUSTRIES
  • FIGURE 38 COLLABORATIVE ROBOTS SEGMENT TO RECORD HIGHER CAGR DURING FORECAST PERIOD
  • FIGURE 39 ARTICULATED ROBOTS SEGMENT TO HOLD LARGEST SHARE OF MARKET, IN TERMS OF VOLUME, IN 2024
  • FIGURE 40 REPRESENTATION OF 6-AXIS ARTICULATED ROBOTS
  • FIGURE 41 PROCESSING SEGMENT TO EXHIBIT HIGHEST CAGR IN MARKET FOR ARTICULATED ROBOTS FROM 2024 TO 2029
  • FIGURE 42 REPRESENTATION OF 4-AXIS SCARA ROBOTS
  • FIGURE 43 HANDLING SEGMENT TO DOMINATE MARKET FOR SCARA ROBOTS BETWEEN 2024 AND 2029
  • FIGURE 44 REPRESENTATION OF PARALLEL ROBOTS
  • FIGURE 45 DISPENSING SEGMENT TO REGISTER HIGHEST CAGR IN MARKET FOR PARALLEL ROBOTS DURING FORECAST PERIOD
  • FIGURE 46 REPRESENTATION OF CARTESIAN ROBOTS
  • FIGURE 47 PROCESSING SEGMENT TO WITNESS HIGHEST CAGR DURING FORECAST PERIOD
  • FIGURE 48 HANDLING SEGMENT TO ACCOUNT FOR LARGEST SHARE OF MARKET FOR CYLINDRICAL ROBOTS IN 2029
  • FIGURE 49 DISPENSING SEGMENT TO EXHIBIT HIGHEST CAGR IN MARKET FOR OTHER TRADITIONAL ROBOTS FROM 2024 TO 2029
  • FIGURE 50 >16 TO 60 KG SEGMENT TO RECORD HIGHEST CAGR IN INDUSTRIAL ROBOTS MARKET BETWEEN 2024 AND 2029
  • FIGURE 51 SOFTWARE & PROGRAMMING SEGMENT TO EXHIBIT HIGHEST CAGR DURING FORECAST PERIOD
  • FIGURE 52 HANDLING SEGMENT TO DOMINATE INDUSTRIAL ROBOTS MARKET FROM 2024 TO 2029
  • FIGURE 53 HANDLING SEGMENT TO HOLD LARGEST SHARE OF TRADITIONAL INDUSTRIAL ROBOTS MARKET IN 2029
  • FIGURE 54 HANDLING SEGMENT TO ACCOUNT FOR LARGEST SHARE OF COLLABORATIVE INDUSTRIAL ROBOTS MARKET IN 2029
  • FIGURE 55 AUTOMOTIVE SEGMENT TO DOMINATE INDUSTRIAL ROBOTS MARKET BETWEEN 2024 AND 2029
  • FIGURE 56 ASIA PACIFIC TO HOLD LARGEST SHARE OF INDUSTRIAL ROBOTS MARKET FOR AUTOMOTIVE, IN TERMS OF VOLUME, IN 2024
  • FIGURE 57 ASIA PACIFIC TO REGISTER HIGHEST CAGR IN MARKET FOR ELECTRICAL & ELECTRONICS, IN TERMS OF VOLUME, BETWEEN 2024 AND 2029
  • FIGURE 58 ASIA PACIFIC TO HOLD LARGEST SHARE OF MARKET FOR METALS & MACHINERY, IN TERMS OF VOLUME, IN 2029
  • FIGURE 59 ASIA PACIFIC TO ACCOUNT FOR LARGEST SHARE OF MARKET FOR PLASTICS, RUBBER & CHEMICALS, IN TERMS OF VOLUME, IN 2029
  • FIGURE 60 ASIA PACIFIC TO EXHIBIT HIGHEST CAGR FOR TRADITIONAL INDUSTRIAL ROBOTS MARKET FOR FOOD & BEVERAGES FROM 2024 TO 2029
  • FIGURE 61 ASIA PACIFIC TO RECORD HIGHEST CAGR IN MARKET FOR PRECISION ENGINEERING & OPTICS DURING FORECAST PERIOD
  • FIGURE 62 ASIA PACIFIC TO HOLD LARGEST SHARE OF MARKET FOR PHARMACEUTICALS & COSMETICS, IN TERMS OF VOLUME, IN 2024
  • FIGURE 63 NORTH AMERICA TO RECORD HIGHEST CAGR IN MARKET FOR OIL & GAS, IN TERMS OF VOLUME, BETWEEN 2024 AND 2029
  • FIGURE 64 ASIA PACIFIC TO HOLD LARGEST SHARE OF MARKET FOR OTHER END-USE INDUSTRIES, IN TERMS OF VOLUME, IN 2029
  • FIGURE 65 INDIA TO EXHIBIT HIGHEST CAGR IN GLOBAL INDUSTRIAL ROBOTS MARKET, IN TERMS OF VOLUME, BETWEEN 2024 AND 2029
  • FIGURE 66 ASIA PACIFIC TO REGISTER HIGHEST CAGR DURING FORECAST PERIOD
  • FIGURE 67 NORTH AMERICA: INDUSTRIAL ROBOTS MARKET SNAPSHOT
  • FIGURE 68 EUROPE: INDUSTRIAL ROBOTS MARKET SNAPSHOT
  • FIGURE 69 ASIA PACIFIC: INDUSTRIAL ROBOTS MARKET SNAPSHOT
  • FIGURE 70 INDUSTRIAL ROBOTS MARKET: REVENUE ANALYSIS OF FIVE KEY PLAYERS, 2019–2023
  • FIGURE 71 MARKET SHARE ANALYSIS OF KEY PLAYERS OFFERING INDUSTRIAL ROBOTS, 2023
  • FIGURE 72 COMPANY VALUATION, 2024
  • FIGURE 73 FINANCIAL METRICS, 2024 (EV/EBITDA)
  • FIGURE 74 BRAND/PRODUCT COMPARISON
  • FIGURE 75 INDUSTRIAL ROBOTICS MARKET: COMPANY EVALUATION MATRIX (KEY PLAYERS), 2023
  • FIGURE 76 INDUSTRIAL ROBOTICS MARKET: COMPANY FOOTPRINT
  • FIGURE 77 INDUSTRIAL ROBOTICS MARKET: COMPANY EVALUATION MATRIX (STARTUPS/SMES), 2023
  • FIGURE 78 ABB LTD: COMPANY SNAPSHOT
  • FIGURE 79 YASKAWA ELECTRIC CORPORATION: COMPANY SNAPSHOT
  • FIGURE 80 FANUC CORPORATION: COMPANY SNAPSHOT
  • FIGURE 81 KUKA AG: COMPANY SNAPSHOT
  • FIGURE 82 MITSUBISHI ELECTRIC CORPORATION: COMPANY SNAPSHOT
  • FIGURE 83 KAWASAKI HEAVY INDUSTRIES, LTD.: COMPANY SNAPSHOT
  • FIGURE 84 DENSO CORPORATION: COMPANY SNAPSHOT
  • FIGURE 85 NACHI-FUJIKOSHI CORP.: COMPANY SNAPSHOT
  • FIGURE 86 SEIKO EPSON CORPORATION: COMPANY SNAPSHOT
  • FIGURE 87 DURR: COMPANY SNAPSHOT

The research process for this study included systematic gathering, recording, and analysis of data about customers and companies operating in the industrial robotics market. This process involved the extensive use of secondary sources, directories, and databases (Factiva, Oanda, and OneSource) for identifying and collecting valuable information for the comprehensive, technical, market-oriented, and commercial study of the industrial robotics market. In-depth interviews were conducted with primary respondents, including experts from core and related industries and preferred manufacturers, to obtain and verify critical qualitative and quantitative information as well as to assess growth prospects. Key players in the industrial robotics market were identified through secondary research, and their market rankings were determined through primary and secondary research. This research included studying annual reports of top players and interviewing key industry experts such as CEOs, directors, and marketing executives.

Secondary Research

In the secondary research process, various secondary sources were referred to for identifying and collecting information important for this study. Secondary sources included corporate filings, such as annual reports, investor presentations, and financial statements; trade, business, and professional associations; white papers; industrial robotics market products-related journals; certified publications; articles by recognized authors; directories; and databases.

Secondary research was conducted to obtain key information about the industry supply chain, market value chain, key players, market classification and segmentation as per industry trends to the bottom-most level, geographic markets, and key developments from both market- and technology-oriented perspectives. Data from secondary research was collected and analyzed to determine the overall market size, which was further validated by primary research.

Primary Research

In the primary research process, various primary sources from the supply and demand sides were interviewed to obtain qualitative and quantitative information for this report. Primary sources from the supply side included industry experts such as CEOs, VPs, marketing directors, technology & innovation directors, and key executives from major companies in the industrial robotics market.

After going through market engineering (which includes calculations for market statistics, market breakdown, market size estimations, market forecasting, and data triangulation), extensive primary research was conducted to gather information and verify and validate the critical numbers obtained. Primary research was conducted to identify segmentation types, industry trends, key players, competitive landscape, and key market dynamics such as drivers, restraints, opportunities, and challenges, along with the key strategies adopted by players operating in the market.
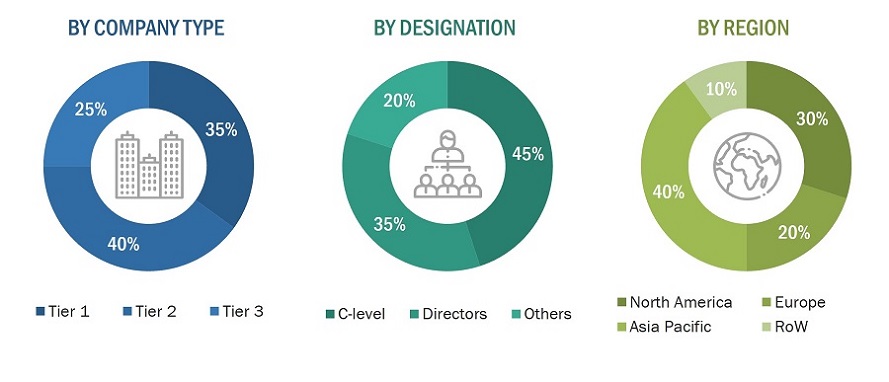
Industrial Robotics Market Size, and Share

To know about the assumptions considered for the study, download the pdf brochure

Market size Estimation

The market engineering process included using both top-down and bottom-up approaches, as well as several data triangulation methods, to estimate the size of the market, its segments, and sub-segments listed in this report. A whole qualitative and quantitative analysis on the complete market engineering process was conducted and through it, the key information/insights that will be related to the industrial robotics market were put together.

The key players in the market were identified through secondary research, and their rankings in the respective regions were determined through primary and secondary research. This entire procedure involved the study of the annual and financial reports of top players, as well as interviews with industry experts such as chief executive officers, vice presidents, directors, and marketing executives for quantitative and qualitative key insights. All percentage shares, splits, and breakdowns were determined using secondary sources and verified through primary sources. All parameters that affect the markets covered in this research study were accounted for, viewed in extensive detail, verified through primary research, and analyzed to obtain the final quantitative and qualitative data. This data was consolidated and enhanced with detailed inputs and analysis from MarketsandMarkets and presented in this report.
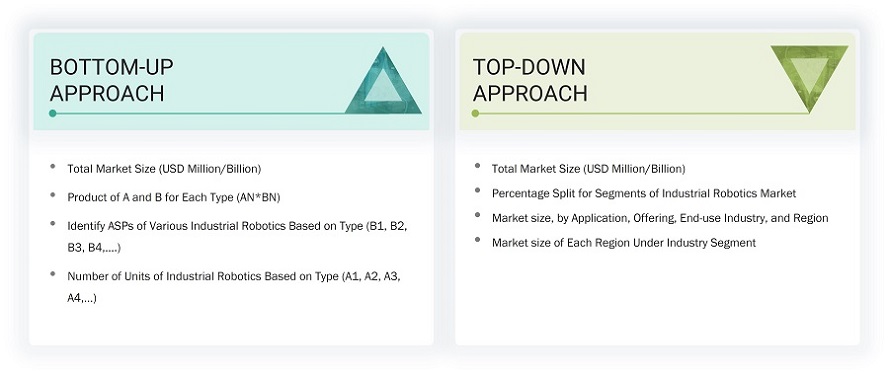
Industrial Robotics Market Size, and Top_down_bottom_up

Data Triangulation

After arriving at the overall size of the industrial robotics market from the market size estimation process explained above, the total market was split into several segments and subsegments. Where applicable, the market breakdown and data triangulation procedures were employed to complete the overall market engineering process and arrive at the exact statistics for all segments and subsegments. The data was triangulated by studying various factors and trends from both the demand and supply sides. Along with this, the market size was validated using top-down and bottom-up approaches.

Market Definition

An industrial robot, as defined in International Organization for Standardization (ISO 8373), is multipurpose, automatically controlled, reprogrammable manipulator programmable in three or more axes. Systems designed for the purpose of performing various other industrial tasks are known as industrial robotics. More particularly, this refers to repetitive and hazardous jobs or jobs not suitable for human workers.

Key Stakeholders

  • Original equipment manufacturers (OEMs)
  • Providers of technology solutions
  • Research institutes
  • Market research and consulting firms
  • Forums, alliances, and associations related to industrial robots
  • Technology investors
  • Governments and financial institutions
  • Analysts and strategic business planners
  • Existing end users and prospective ones

Report Objectives

  • To describe and forecast the industrial robotics market, by robot type and offering, in terms of value
  • To describe and forecast the industrial robots market, by robot type, payload, application, and end-use industry, in terms of value
  • To describe and forecast the industrial robots market, by robot type, payload, application, and end-use industry, in terms of volume
  • To describe and forecast the industrial robots market size with respect to four main regions, namely, North America, Europe, Asia Pacific, and the Rest of the World (RoW), in terms of value and volume
  • To provide detailed information regarding the drivers, restraints, opportunities, and challenges influencing the growth of the industrial robotics market
  • To provide a detailed overview of the supply chain, ecosystem analysis, case study analysis, patent analysis, trade analysis, technology analysis, average selling price (ASP) analysis, AI/gen AI impact analysis, porter’s five forces analysis, and regulations pertaining to the market of the industrial robotics
  • To strategically analyze micromarkets1 with respect to individual growth trends, prospects, and contributions to the overall market
  • To analyze opportunities in the market for various stakeholders by identifying the high-growth segments of the market
  • To benchmark the market players using the proprietary company evaluation matrix framework, which analyzes the market players on various parameters within the broad categories of business strategy excellence and strength of product portfolios
  • To strategically profile the key players and comprehensively analyze their market positions in terms of ranking and core competencies2, along with a detailed competitive landscape of the market
  • To analyze competitive developments, such as acquisitions, product launches, partnerships, expansions, and collaborations, in the industrial robotics market

Available customizations

With the given market data, MarketsandMarkets offers customizations according to the specific requirements of companies.

Product analysis

  • Detailed analysis and profiling of additional market players

The following customization options are available for the report:

  • Market sizing and forecast for additional countries
  • Additional five companies profiling

Previous Versions of this Report

Industrial Robotics Market by Robot (Articulated, SCARA, Cartesian, Parallel, Cylindrical, Collaborative), Payload (up to 16 kg, >16 to 60 kg, >60 to 225 kg, >225 kg), Offering (End Effectors, Controllers, Drive Units, Sensors) - Global Forecast to 2029

Report Code SE 2733
Published in Sep, 2024, By MarketsandMarkets™

Industrial Robotics Market by Type (Traditional, Collaborative), Component, Payload (Upto 16.00 Kg, 16.01-60.00 Kg, 60.01-225.00 Kg, More than 225 Kg), Application (Handling, Dispensing, Processing), End Use Industry and Region - Global Forecast to 2028

Report Code SE 2733
Published in Jul, 2023, By MarketsandMarkets™

Industrial Robotics Market by Type (Traditional, Collaborative Robots), Component, Payload, Application (Handling, Processing), Industry (Automotive, Food & Beverages) and Region (North America, Europe, APAC, RoW) - Global Forecast to 2027

Report Code SE 2733
Published in Sep, 2022, By MarketsandMarkets™

Industrial Robotics Market with COVID-19 Impact Analysis by Type (Articulated, Collaborative Robots), Component, Payload, Application (Handling, Processing), Industry (Automotive, Food & Beverages), and Region - Global Forecast to 2026

Report Code SE 2733
Published in Jun, 2021, By MarketsandMarkets™

Industrial Robotics Market by Type (Articulated Robots, Collaborative Robots), Application (Handling, Processing, Dispensing), Industry (Automotive, Electrical & Electronics, Metals & Machinery, Food & Beverages) and Geography - Global Forecast to 2024

Report Code SE 2733
Published in Oct, 2019, By MarketsandMarkets™

Industrial Robotics Market by Type (Articulated, Cartesian, SCARA, Parallel, Collaborative Robots), Industry (Automotive, Electrical & Electronics, Metals & Machinery, Pharmaceuticals & Cosmetics), and Geography - Global Forecast to 2023

Report Code SE 2733
Published in Jul, 2017, By MarketsandMarkets™

Industrial Robotics Market by Type (Articulated, Cartesian, SCARA, Cylindrical, Parallel), Application (Automotive, Electrical and Electronics, and Metal and Machinery), Component (Controller, Sensors, Drive), and Geography - Analysis & Forecast to 2022

Report Code SE 2733
Published in Feb, 2016, By MarketsandMarkets™

Industrial Robotics Market by Type, Component, Function, Industry (Automotive, Electrical & Electronic, Chemical, Rubber, & Plastic, Metal & Machinery, Food & Beverages, Pharmaceutical, & Construction), & Geography - Analysis & Forecast to 2014 - 2020

Report Code SE 2733
Published in Oct, 2014, By MarketsandMarkets™

Industrial Robotics Market by Type, Component, Function, Industry (Automotive, Electrical & Electronic, Chemical, Rubber, & Plastic, Metal & Machinery, Food & Beverages, Pharmaceutical, & Construction), & Geography - Analysis & Forecast to 2014 - 2020

Report Code SE 2733
Published in Jan, 2011, By MarketsandMarkets™

Custom Market Research Services

We Will Customise The Research For You, In Case The Report Listed Above Does Not Meet With Your Requirements

Get 10% Free Customisation

Growth opportunities and latent adjacency in Industrial Robotics Market

Ravi

Nov, 2018

We need to know the industrial robots market size for electronics industry specifically. .

Shoko

Oct, 2017

Interested in a separate study on Philippines industrial robotics market (overall and by industry) and after-market of industrial robotics. Could you please quickly provide estimated fees and timeline for delivery?.

Peter

Jun, 2018

I am currently pursuing MBA and require some market data on industrial Robots for the Oceania region (Australia and New Zealand). Can you help me with this?.

Ivan

Dec, 2014

We are interested in all Market type above and we would like to know more about Robotic molds appertain in Cast Industry. .

Olga

Mar, 2016

Hello, I am interested in the warehousing, logistics and robotics. .

Koji

Apr, 2015

Please let me know if this report include 1.Value chain analysis data 2.Total system cost analysis including materials cost and production cost and units/parts cost by each types of industry robots?.

Nathalie

Mar, 2017

Hi, I'm interested in a sample or an overview of the report before purchase. I'm currently looking for forecasts and predictions in the different markets. .

Yannick

Sep, 2013

Specific interest is in Automotive robotics for different applications such as, dispensing, handling, welding, and fitting. Looking for market size of each application in this industry..

Assaf

Apr, 2017

I am interested in information regarding Milking Robotics and future trends. Last time where I have purchased a report from you -finally the report did not answer my needs and expectations. Before purchasing any new report on milking robots - I would like to get insights on and from the report that will assure me I am getting what I really expecting to get. Can you please provide me this info?.

Arun

Nov, 2016

Does your report have information on industrial robots and various end users of industrial robots?.

Arun

Nov, 2016

Does your report have quantitate information on industrial robots and various end users of industrial robots?.

Patrick

Jul, 2016

I have purchased the report and need to understand what is driving the growth rates for the components of the industrial robots..

Philippe

Jul, 2014

Would you have student version of the report, I am interested in a free version or a much reduced cost version as part of your corporate policy to support higher education?.

Christopher

Jul, 2019

I would like a free sample report to check weather this report fits with what I am looking for..

Luis

May, 2015

I'm doing a study to determine the size of robot market and how to define our strategy to address this market..

Peter

May, 2019

Does this report include information regarding the average unit price / cost for these robots and any unit cost data of their assembly components (gear drives, motors, sensors, structural elements, etc.)?.

MOO

May, 2016

Is there any scope for new entrants in the market? If yes please provide me few start-ups in the market along with entry barriers in the market. Information on best practices in the market will also be well appreciated..

Jeffrey

Mar, 2015

Can you provide me comparative qualitative and quantitate analysis of industrial robots? Make sure to provide unit shipments and ASP of industrial robots. Also provide me the top 10 vendors in the industrial robots market. .

R

Feb, 2019

Interested in purchasing the complete "Industrial Robotics Market". Please suggest me the complete process and any discount offer available. .

Show More
DMCA.com Protection Status