Hydraulic Fluids Market by Base Oil (Mineral Oil, Synthetic Oil), Point of Sale (OEM and Aftermarket), Application (Mobile Equipment), End-use Industry (Construction, Agriculture, Transportation, Metal & Mining), and Region - Global Forecast to 2029
Hydraulic Fluids Market
The global Hydraulic fluids market is valued at USD 8.7 billion in 2024 and is projected to reach USD 10.2 billion by 2029, growing at 3.2% cagr from 2024 to 2029. The main factors behind growth of the hydraulic fluids market are; rising demand for hygienically processed food, rising demand hydraulic fluids from construction, mining agricultural and marine equipment and extend use of Automation in industries. In addition, the availability of re-refining technology, the central hydraulic fluid technology, and others are the technological driver that is boosting the market. More specifically, the particular re-refining technology is popular among the key stakeholders including Shell plc, BP p.l.c. , and others. For instance, on July 2024 TotalEnergies SE declared that the company had acquired Tecoil. It is used in the production or re-refinied base oils (RRBO’s) by utilizing a used oil. It processes 50,000 tons of re-refinined base oils annually from its Hamina and Finland facilities.
To know about the assumptions considered for the study, Request for Free Sample Report
Hydraulic Fluids Market Dynamics
Driver: mounting demand from construction, mining, agriculture, and marine industries across worldwide
The growth in the hydraulic fluids market is driven by the rising construction, marine, mining, and agriculture sectors. These industries heavily depends on high performance machinery such as trucks, excavators, bulldozers, tractors, pavers, and harvesters, they requires high-quality hydraulic fluids to ensure smooth operations in harsh conditions. This increased equipment usage and focus on performance and effectiveness are the key reasons in driving hydraulic fluids market. Also, there is a expanding demand for specialty hydraulic fluids which can efficient of meeting these stringent requirements of specially designed modern machinery for optimum performance under harsh conditions. In addition, the geographical expansion is driving the of construction and mining activities, specially in Asia Pacific and the Middle East regions.
Restraints: Strict environmental norms
Strict environmental regulations present a considerable restraint for the hydraulic fluids market. The manufacturers must come up with products that are eco-environmentally friendly and sustainable to fulfill with these regulations. These products should release fewer pollutants, and degrade naturally which can be a challenge for the manufacturers. Besides this, to support with sustainability goals and bio-based lubricants, industry exerts pressure to focus towards the renewable energy sources. Furthermore, the growing automation technologies will pressure the demand for traditional hydraulic fluids and has potential to impact the market dynamics in future. Overall, changing environmental norms needs innovation and change which is restraining the hydraulic fluids market.
Opportunities: Growing demand for renewable energy
The growing demand for renewable energy providing special opportunities for the hydraulic fluids. Sources including solar power and wind are considered as renewable energy sources which requires specialized equipment and machinery for generation and distribution.These machinery depends on effective lubrication for flowing operation. Thus, the demand for hydraulic fluids for specific requirements of renewable energy applications is projected to increase, as these areas are growing to meet the growing energy demands. This will create a sufficient market for lubricant manufacturers to develop speciallized innovative products to improve the endurance of renewable energy equipments.
Challenges: fluctuating prices of raw materials
The basic raw material of hydraulic fluids is base oils and additives, mostly the base oil. The crude oil is the key source from where the base oil are derived. Therefore, the price fluctuation in the prices of crude oil affects the most of the hydraulic fluids market. As it is directly increase the final price of hydraulic fluids, the profit margins for producers will be affected. Sudden increase in price change of crude oil can also lead to the high production costs which will be further exerted on customers. On the other hand sudden drop of prices can disturb supply chains and investment scenarios in hydraulic fluids market.
Hydraulic Fluids Market Ecosystem
Prominent companies in this market include well-established, financially stable manufacturers of hydraulic fluids. These companies have been in business for a while and have a broad range of products, cutting-edge technologies, and robust international sales and marketing networks. Prominent companies in this market include Shell plc (UK), Exxon Mobil Corporation (US), BP p.l.c. (UK), Chevron Corporation (US), TotalEnergies SE (France), FUCHS SE (Germany), PetroChina Company Limited (China), ENEOS Holdings, Inc. (Japan), China Petroleum & Chemical Corporation (China), and among others.
Based on base oil type, synthetic oil is accounted for largest share and projected to register highest CAGR in hydraulic fluids market, in terms of value, during forecast period.
Synthetic oil is projected to be the fastest growing base oil type, in terms of value of the hydraulic fluids market, due to changing customer preferences towards environmental friendly and sustainable products. Also, rising awareness regarding the health and environmental benefits of synthetic oil base hydraulic fluids is increasing the demand for synthetic fluids. Furthermore, this rising demand is supported by the changing government regulations to promote safety and clarity regarding synthetic oil based lubricants. To support this trend manufacturers are also rising investments to develope new products with using re-refined oil and natural alternatives. Thus, the growing innovations, changing regulations and investments are driving the demand for synthetic oil based lubricants.
Based on point of sale, aftermarket was the largest segment of hydraulic fluids market, in terms of value, in 2023.
By point of sale, aftermarket segment dominated the hydraulic fluids market , in terms of value, in 2023. This is because of it considerable position in supply chain of hydraulic fluids in various industrial applications. The aftermarket segment mainly serves independent worshops, service centers, and DIY customers who are continuously searching for specialized and fast solutions for their machineries and equipment. The hydraulic systems which are installed in construction and metal & mining, aftermarket sale revolves around the changing the fluids and their maintenance requirements. Aftermarket sale freedom, specialized service systems and wast turnouver cycles contributes in overall growth of aftermarket segment with assurance of supply demand.
Asia Pacific was the largest and projected to be the fastest-growing region, in terms of value, during the forecast period in the hydraulic fluids market.
Asia Pacific was largest and is projected to be fastest-growing region in the hydraulic fluids market, in terms of value, during forecast period. This is because of growing industrialization in region due to rising Foreign Direct Investments (FDIs), government supports and favourable regulations, and rising urbanization. China and India are the key participants in the region to drive the hydraulic fluids market. Furthermore, growing end-use industries in region such as transportation (manufacturing), cement production, agriculture, construction, and metal & mining are drives the demand for hydraulic fluids market. Thus, overall the Asia Pacific’s industrial growth and growing economies driving the hydraulic fluids market.
To know about the assumptions considered for the study, download the pdf brochure
Hydraulic Fluids Market Players
Shell plc (UK), Exxon Mobil Corporation (US), BP p.l.c. (UK), Chevron Corporation (US), TotalEnergies SE (France), FUCHS SE (Germany), PetroChina Company Limited (China), ENEOS Holdings, Inc. (Japan), China Petroleum & Chemical Corporation (China), Idemitsu Kosan Co., Ltd. (Japan), and among others, these are the key manufacturers that secured major market share in the last few years.
Hydraulic Fluids Market Report Scope
Report Metric |
Details |
Years considered for the study |
2018–2029 |
Base year considered |
2023 |
Forecast period |
2024–2029 |
Units considered |
Volume (Kiloton) and Value (USD Million) |
Segments Covered |
Base Oil Type, Point of Sale, Application, End-use Industry, and Region |
Regions covered |
Asia Pacific, North America, Europe, Middle East & Africa, and South America |
Companies profiled |
The key players profiled in the report include Shell plc (UK), Exxon Mobil Corporation (US), BP p.l.c. (UK), Chevron Corporation (US), TotalEnergies SE (France), FUCHS SE (Germany), PetroChina Company Limited (China), ENEOS Holdings, Inc. (Japan), China Petroleum & Chemical Corporation (China), and others.
|
This report categorizes the global Hydraulic Fluids Market based on base oil type, point of sale, application, end-use industry, and region.
On the basis of base oil type, the Hydraulic Fluids Market has been segmented as follows:
- Mineral Oil
- Synthetic Oil
- PAO
- PAG
- Esters
- Group III (Hydrocracking)
- Bio-based Oil
On the basis of Point of Sale, the Hydraulic Fluids Market has been segmented as follows:
- OEM
- Aftermarket
On the basis of Application, the Hydraulic Fluids Market has been segmented as follows:
- Mobile Equipment
- Industrial Equipment
On the basis of End-use Industry, the Hydraulic Fluids Market has been segmented as follows:
- Construction
- Metal & Mining
- Cement Production
- Power Generation
- Transportation
- Oil & Gas
- Agriculture
- Food Processing
- Others
On the basis of region, the Hydraulic Fluids Market has been segmented as follows:
- Asia Pacific
- Europe
- North America
- Middle East & Arica
- South America
Recent Developments
- In December 2022, from PANOLIN Group Shell plc acquired the Environmentally Considerate Lubricants (ECLs) business. It has subsidiaries in the UK, Switzerland, Sweden, and the US.
- In May 2024, Exxon Mobil Corporation acquired Pioneer Natural Resources Company and will be separate entity . It will help exxon mobil to establish a unique, unconventional business in the Permian Basin.
- In January 2021, BP p.l.c. had set a digital hub in Pune, India. This expansion helped them grow their digital expertise and meet the changing demands by providing sustainable solutions.
- In April 2024, TotalEnergies SE (TotalEnergies Marketing USA) has made strategic partnership with OK Petroleum, it is a distributor based in Long Island, New York.
- In March 2023, Hindustan Petroleum Corporation Limited has signed an agreement with Chevron Corporation (Chevron Brands International LLC), to manufacture, distribute, and market its lubricants in India.
Frequently Asked Questions (FAQ):
Which are the major players in the hydraulic fluids market?
The key players profiled in the report include Shell plc (UK), Exxon Mobil Corporation (US), BP p.l.c. (UK), Chevron Corporation (US), TotalEnergies SE (France), FUCHS SE (Germany), PetroChina Company Limited (China), ENEOS Holdings, Inc. (Japan), China Petroleum & Chemical Corporation (China), Idemitsu Kosan Co., Ltd. (Japan), and among others.
What are the drivers and opportunities for the hydraulic fluids market?
The mounting demand for renewable energy and growing demand for bio-based lubricants across worldwide are the major driver for this market.
What are the various strategies key players are focusing within hydraulic fluids market?
New product launches, expansion and partnerships are some of the strategies adopted by key players to expand their global presence.
What is the CAGR of the hydraulic fluids Market?
The market is projected to grow at a CAGR of 3.2% in terms of value, during the forecast period.
What are the major factors restraining hydraulic fluids market growth during the forecast period?
strict environmental norms, and global shift towards synthetic lubricants is expected to restrict the market demand. .
To speak to our analyst for a discussion on the above findings, click Speak to Analyst
Exclusive indicates content/data unique to MarketsandMarkets and not available with any competitors.
- 5.1 INTRODUCTION
-
5.2 MARKET DYNAMICSDRIVERS- Massive industrial growth in Asia Pacific and Middle East & Africa- Growth of automotive industry in Asia Pacific- Increasing demand for hydraulic fluids in mining and construction sectors- Rising use of automation in various end-use industries- Growing demand for processed foodRESTRAINTS- Shift toward synthetic lubricants- High cost of synthetic & bio-based hydraulic fluids and stringent environmental regulations- Technological advancements in hybrid vehiclesOPPORTUNITIES- Increasing demand for bio-based hydraulic fluids- Pressing need for semi-synthetic hydraulic fluids- Availability of zinc-free (ashless) hydraulic fluids- Rising demand for renewable energyCHALLENGES- Volatile crude oil prices
-
5.3 PORTER’S FIVE FORCES ANALYSISTHREAT OF SUBSTITUTESTHREAT OF NEW ENTRANTSBARGAINING POWER OF SUPPLIERSBARGAINING POWER OF BUYERSINTENSITY OF COMPETITIVE RIVALRY
-
5.4 MACROECONOMIC INDICATORSGDP TRENDS AND FORECAST FOR MAJOR ECONOMIES
-
6.1 KEY STAKEHOLDERS AND BUYING CRITERIAKEY STAKEHOLDERS IN BUYING PROCESSBUYING CRITERIA
-
6.2 SUPPLY CHAIN ANALYSISRAW MATERIAL SUPPLIERSMANUFACTURERSDISTRIBUTORSEND-USE INDUSTRIES
- 6.3 ECOSYSTEM ANALYSIS/MARKET MAP
-
6.4 CASE STUDY ANALYSISREDUCING OPERATING COSTS OF INJECTION MOLDING MACHINE USING HYDRAULIC FLUIDSUPGRADING PERFORMANCE POTENTIAL OF INJECTION MOLDING MACHINES USING HYDRAULIC FLUIDSSAVING ENERGY BY USING HYDRO-CRACKED BASE OIL FOR HYDRAULIC OILS
-
6.5 REGULATORY LANDSCAPEREGULATORY BODIES, GOVERNMENT AGENCIES, AND OTHER ORGANIZATIONS
-
6.6 TECHNOLOGY ANALYSISKEY TECHNOLOGY- Ester in hydraulic fluid- Central hydraulic fluid- Re-refining- NanotechnologyCOMPLEMENTARY TECHNOLOGY- SO2 scrubbing system
-
6.7 TRENDS/DISRUPTIONS IMPACTING CUSTOMER BUSINESSREVENUE SHIFT & NEW REVENUE POCKETS IN HYDRAULIC FLUIDS MARKET
-
6.8 TRADE ANALYSISIMPORT SCENARIOEXPORT SCENARIO
- 6.9 KEY CONFERENCES & EVENTS IN 2024–2025
-
6.10 PRICING ANALYSISAVERAGE SELLING PRICE TREND OF KEY PLAYERS, BY BASE OIL TYPEAVERAGE SELLING PRICE TREND, BY REGION
- 6.11 INVESTMENT AND FUNDING SCENARIO
-
6.12 PATENT ANALYSISAPPROACHDOCUMENT TYPESTOP APPLICANTSLEGAL STATUSJURISDICTION ANALYSIS
- 7.1 INTRODUCTION
- 7.2 OEM
- 7.3 AFTERMARKET
- 8.1 INTRODUCTION
-
8.2 MINERAL OILLOW COST TO BOOST DEMAND FOR MINERAL OIL-BASED HYDRAULIC FLUIDS
-
8.3 SYNTHETIC OILSURGE IN INDUSTRIAL ACTIVITIES TO INCREASE DEMAND FOR HIGH-PERFORMANCE HYDRAULIC FLUIDSPOLYALPHAOLEFINSPOLYALKYLENE GLYCOLSESTERSGROUP III
-
8.4 BIO-BASED OILRISING AWARENESS ABOUT BIO-BASED HYDRAULIC FLUIDS TO FUEL DEMAND
- 9.1 INTRODUCTION
- 9.2 MOBILE EQUIPMENT
- 9.3 INDUSTRIAL EQUIPMENT
- 10.1 INTRODUCTION
-
10.2 CONSTRUCTIONRISING DEMAND IN CONSTRUCTION EQUIPMENT TO DRIVE MARKET
-
10.3 METAL & MININGSURGE IN METAL PRODUCTION AND MINING ACTIVITIES TO BOOST MARKET
-
10.4 AGRICULTUREGROWING GLOBAL FOOD DEMAND TO INCREASE NEED FOR HYDRAULIC FLUIDS
-
10.5 OIL & GASNEED FOR LONG-TERM STABILITY AND SMOOTH FUNCTIONING OF MACHINERY TO FUEL MARKET
-
10.6 TRANSPORTATIONGROWTH OF MARINE AND AVIATION INDUSTRIES TO DRIVE MARKETMARINEAVIATIONAUTOMOTIVE
-
10.7 CEMENT PRODUCTIONSURGE IN CONSTRUCTION ACTIVITIES TO DRIVE MARKET
-
10.8 FOOD PROCESSINGRISING AWARENESS ABOUT FOOD SAFETY TO DRIVE MARKET
-
10.9 POWER GENERATIONINCREASING USE OF RENEWABLE SOURCES FOR POWER GENERATION TO DRIVE MARKET
- 10.10 OTHER END-USE INDUSTRIES
- 11.1 INTRODUCTION
-
11.2 ASIA PACIFICRECESSION IMPACTCHINA- Increasing population and rapid industrialization to drive marketINDIA- Growing construction industry to boost marketJAPAN- Government’s fiscal support for technological developments to drive marketSOUTH KOREA- Increasing demand from transportation end-use industry to drive marketAUSTRALIA & NEW ZEALAND- Growth of mining industry to drive demand for hydraulic fluidsTHAILAND- Viable economic policies to drive marketINDONESIA- Established crude oil and mining sectors to boost market
-
11.3 EUROPERECESSION IMPACTRUSSIA- Capacity expansion for producing crude oil products to boost marketGERMANY- Growth of food processing industry to boost marketUK- Government plans for infrastructure spending to drive marketFRANCE- Presence of established international companies to boost demand for hydraulic fluidsITALY- Growth of manufacturing industry to fuel demand for hydraulic fluidsSPAIN- Rising demand for hydraulic fluids in energy and agriculture sector to drive marketTURKEY- Increase in automotive sales to boost market
-
11.4 NORTH AMERICARECESSION IMPACTUS- Strong industrial infrastructure and increasing environmental awareness to drive marketCANADA- Growth of automotive industry to drive marketMEXICO- Booming industrialization and rising population to increase demand for hydraulic fluids
-
11.5 MIDDLE EAST & AFRICARECESSION IMPACTGCC COUNTRIES- Saudi ArabiaSOUTH AFRICA- Demand for platinum to boost marketIRAN- Rapid growth in industrial sectors to propel market
-
11.6 SOUTH AMERICARECESSION IMPACTBRAZIL- Rapidly expanding economy stimulated by increasing investments to drive marketARGENTINA- Developing mining industry to drive market
- 12.1 INTRODUCTION
- 12.2 KEY PLAYER STRATEGIES
- 12.3 REVENUE ANALYSIS
- 12.4 MARKET SHARE ANALYSIS
-
12.5 COMPANY EVALUATION MATRIX: KEY PLAYERS, 2023STARSEMERGING LEADERSPERVASIVE PLAYERSPARTICIPANTSCOMPANY FOOTPRINT: KEY PLAYERS, 2023- Company footprint- Region footprint- Base oil footprint- Application footprint- Point of Sale footprint- End-use industry footprint
-
12.6 COMPANY EVALUATION MATRIX: STARTUPS/SMES, 2023PROGRESSIVE COMPANIESRESPONSIVE COMPANIESDYNAMIC COMPANIESSTARTING BLOCKSCOMPETITIVE BENCHMARKING: STARTUPS/SMES, 2023- Hydraulic fluids market: Key startups/SMEs- Hydraulic fluids market: Competitive benchmarking of key startups/SMEs
- 12.7 COMPANY VALUATION AND FINANCIAL METRICS
- 12.8 BRAND/PRODUCT COMPARISON ANALYSIS
-
12.9 COMPETITIVE SITUATION AND TRENDSPRODUCT LAUNCHESDEALSEXPANSIONS
-
13.1 KEY COMPANIESEXXON MOBIL CORPORATION- Business overview- Products/Solutions/Services offered- Recent developments- MnM viewTOTALENERGIES SE- Business overview- Products/Solutions/Services offered- Recent developments- MnM viewSHELL PLC- Business overview- Products/Solutions/Services offered- Recent developments- MnM viewCHEVRON CORPORATION- Business overview- Products/Solutions/Services offered- Recent developments- MnM ViewBP P.L.C.- Business overview- Products/Solutions/Services offered- Recent developments- MnM viewFUCHS SE- Business overview- Products/Solutions/Services offered- Recent developmentsCHINA PETROLEUM & CHEMICAL CORPORATION- Business overview- Products/Solutions/Services offered- Recent developmentsENEOS HOLDINGS, INC.- Business overview- Products/Solutions/Services offered- Recent developmentsIDEMITSU KOSAN CO., LTD.- Business overview- Products/Solutions/Services offered- Recent developmentsPETROCHINA COMPANY LIMITED- Business overview- Products/Solutions/Services offered- Recent developments
-
13.2 OTHER PLAYERSPETROLIAM NASIONAL BERHAD (PETRONAS)LUKOILPT PERTAMINA (PERSERO)INDIAN OIL CORPORATION LIMITEDHINDUSTAN PETROLEUM CORPORATION LIMITEDPHILLIPS 66PETRÓLEO BRASILEIRO S.A. (PETROBRAS)BALMER LAWRIE & CO. LTD.PJSC ROSNEFT OIL COMPANYLUBRI-LAB INC.CALUMET SPECIALTY PRODUCTS PARTNERS, L.P.CITGO PETROLEUM CORPORATIONHARRISON MANUFACTURING PTY LIMITEDNYCOPENRITE OIL
- 14.1 INTRODUCTION
- 14.2 LIMITATIONS
-
14.3 INDUSTRIAL LUBRICANTS MARKETMARKET DEFINITIONMARKET OVERVIEW
-
14.4 INDUSTRIAL LUBRICANTS MARKET, BY REGIONASIA PACIFICNORTH AMERICAEUROPEMIDDLE EAST & AFRICASOUTH AMERICA
- 15.1 DISCUSSION GUIDE
- 15.2 KNOWLEDGESTORE: MARKETSANDMARKETS’ SUBSCRIPTION PORTAL
- 15.3 CUSTOMIZATION OPTIONS
- 15.4 RELATED REPORTS
- 15.5 AUTHOR DETAILS
- TABLE 1 HYDRAULIC FLUIDS MARKET: RISK ASSESSMENT
- TABLE 2 INDUSTRIAL GROWTH RATE OF COUNTRIES IN ASIA PACIFIC, 2023
- TABLE 3 TOP FIVE MOTOR VEHICLE PRODUCERS IN ASIA PACIFIC, 2023
- TABLE 4 CRUDE OIL PRICE TREND (2019–2022)
- TABLE 5 HYDRAULIC FLUIDS MARKET: PORTER’S FIVE FORCES ANALYSIS
- TABLE 6 GDP TRENDS AND FORECAST OF MAJOR ECONOMIES, 2021–2029 (USD BILLION)
- TABLE 7 INFLUENCE OF STAKEHOLDERS ON BUYING PROCESS FOR TOP THREE END-USE INDUSTRIES (%)
- TABLE 8 KEY BUYING CRITERIA FOR TOP THREE END-USE INDUSTRIES
- TABLE 9 HYDRAULIC FLUIDS MARKET: ROLE IN ECOSYSTEM
- TABLE 10 NORTH AMERICA: REGULATIONS FOR HYDRAULIC FLUIDS
- TABLE 11 EUROPE: REGULATIONS FOR HYDRAULIC FLUIDS
- TABLE 12 ASIA PACIFIC: REGULATIONS FOR HYDRAULIC FLUIDS
- TABLE 13 MIDDLE EAST & AFRICA: REGULATIONS FOR HYDRAULIC FLUIDS
- TABLE 14 SOUTH AMERICA: REGULATIONS FOR HYDRAULIC FLUIDS
- TABLE 15 IMPORT OF HYDRAULIC FLUIDS, BY REGION, 2018–2022 (USD BILLION)
- TABLE 16 EXPORT OF HYDRAULIC FLUIDS, BY REGION, 2018–2022 (USD BILLION)
- TABLE 17 HYDRAULIC FLUIDS MARKET: KEY CONFERENCES & EVENTS, 2024–2025
- TABLE 18 AVERAGE SELLING PRICE TREND OF KEY PLAYERS FOR TOP THREE BASE OIL TYPES (USD/KG)
- TABLE 19 AVERAGE SELLING PRICE TREND OF HYDRAULIC FLUIDS, BY REGION, 2022–2029 (USD/KG)
- TABLE 20 PATENT STATUS: PATENT APPLICATIONS, LIMITED PATENTS, AND GRANTED PATENTS
- TABLE 21 MAJOR PATENTS FOR HYDRAULIC FLUIDS
- TABLE 22 PATENTS BY HALLIBURTON ENERGY SERVICES, INC.
- TABLE 23 PATENTS BY SAUDI ARABIAN OIL COMPANY
- TABLE 24 TOP 10 PATENT OWNERS IN US, 2013–2023
- TABLE 25 HYDRAULIC FLUIDS MARKET, BY POINT OF SALE, 2018–2022 (USD MILLION)
- TABLE 26 HYDRAULIC FLUIDS MARKET, BY POINT OF SALE, 2023–2029 (USD MILLION)
- TABLE 27 HYDRAULIC FLUIDS MARKET, BY POINT OF SALE, 2018–2022 (KILOTON)
- TABLE 28 HYDRAULIC FLUIDS MARKET, BY POINT OF SALE, 2023–2029 (KILOTON)
- TABLE 29 BASE OIL DESCRIPTION, BY CATEGORY
- TABLE 30 HYDRAULIC FLUIDS MARKET, BY BASE OIL, 2018–2022 (USD MILLION)
- TABLE 31 HYDRAULIC FLUIDS MARKET, BY BASE OIL, 2023–2029 (USD MILLION)
- TABLE 32 HYDRAULIC FLUIDS MARKET, BY BASE OIL, 2018–2022 (KILOTON)
- TABLE 33 HYDRAULIC FLUIDS MARKET, BY BASE OIL, 2023–2029 (KILOTON)
- TABLE 34 MINERAL OIL: HYDRAULIC FLUIDS MARKET, BY REGION, 2018–2022 (USD MILLION)
- TABLE 35 MINERAL OIL: HYDRAULIC FLUIDS MARKET, BY REGION, 2023–2029 (USD MILLION)
- TABLE 36 MINERAL OIL: HYDRAULIC FLUIDS MARKET, BY REGION, 2018–2022 (KILOTON)
- TABLE 37 MINERAL OIL: HYDRAULIC FLUIDS MARKET, BY REGION, 2023–2029 (KILOTON)
- TABLE 38 SYNTHETIC OIL: HYDRAULIC FLUIDS MARKET, BY REGION, 2018–2022 (USD MILLION)
- TABLE 39 SYNTHETIC OIL: HYDRAULIC FLUIDS MARKET, BY REGION, 2023–2029 (USD MILLION)
- TABLE 40 SYNTHETIC OIL: HYDRAULIC FLUIDS MARKET, BY REGION, 2018–2022 (KILOTON)
- TABLE 41 SYNTHETIC OIL: HYDRAULIC FLUIDS MARKET, BY REGION, 2023–2029 (KILOTON)
- TABLE 42 BIO-BASED OIL: HYDRAULIC FLUIDS MARKET, BY REGION, 2018–2022 (USD MILLION)
- TABLE 43 BIO-BASED OIL: HYDRAULIC FLUIDS MARKET, BY REGION, 2023–2029 (USD MILLION)
- TABLE 44 BIO-BASED OIL: HYDRAULIC FLUIDS MARKET, BY REGION, 2018–2022 (KILOTON)
- TABLE 45 BIO-BASED OIL: HYDRAULIC FLUIDS MARKET, BY REGION, 2023–2029 (KILOTON)
- TABLE 46 HYDRAULIC FLUIDS MARKET, BY APPLICATION, 2018–2022 (USD MILLION)
- TABLE 47 HYDRAULIC FLUIDS MARKET, BY APPLICATION, 2023–2029 (USD MILLION)
- TABLE 48 HYDRAULIC FLUIDS MARKET, BY APPLICATION, 2018–2022 (KILOTON)
- TABLE 49 HYDRAULIC FLUIDS MARKET, BY APPLICATION, 2023–2029 (KILOTON)
- TABLE 50 HYDRAULIC FLUIDS MARKET, BY END-USE INDUSTRY, 2018–2022 (USD MILLION)
- TABLE 51 HYDRAULIC FLUIDS MARKET, BY END-USE INDUSTRY, 2023–2029 (USD MILLION)
- TABLE 52 HYDRAULIC FLUIDS MARKET, BY END-USE INDUSTRY, 2018–2022 (KILOTON)
- TABLE 53 HYDRAULIC FLUIDS MARKET, BY END-USE INDUSTRY, 2023–2029 (KILOTON)
- TABLE 54 CONSTRUCTION: HYDRAULIC FLUIDS MARKET, BY REGION, 2018–2022 (USD MILLION)
- TABLE 55 CONSTRUCTION: HYDRAULIC FLUIDS MARKET, BY REGION, 2023–2029 (USD MILLION)
- TABLE 56 CONSTRUCTION: HYDRAULIC FLUIDS MARKET, BY REGION, 2018–2022 (KILOTON)
- TABLE 57 CONSTRUCTION: HYDRAULIC FLUIDS MARKET, BY REGION, 2023–2029 (KILOTON)
- TABLE 58 METAL & MINING: HYDRAULIC FLUIDS MARKET, BY REGION, 2018–2022 (USD MILLION)
- TABLE 59 METAL & MINING: HYDRAULIC FLUIDS MARKET, BY REGION, 2023–2029 (USD MILLION)
- TABLE 60 METAL & MINING: HYDRAULIC FLUIDS MARKET, BY REGION, 2018–2022 (KILOTON)
- TABLE 61 METAL & MINING: HYDRAULIC FLUIDS MARKET, BY REGION, 2023–2029 (KILOTON)
- TABLE 62 AGRICULTURE: HYDRAULIC FLUIDS MARKET, BY REGION, 2018–2022 (USD MILLION)
- TABLE 63 AGRICULTURE: HYDRAULIC FLUIDS MARKET, BY REGION, 2023–2029 (USD MILLION)
- TABLE 64 AGRICULTURE: HYDRAULIC FLUIDS MARKET, BY REGION, 2018–2022 (KILOTON)
- TABLE 65 AGRICULTURE: HYDRAULIC FLUIDS MARKET, BY REGION, 2023–2029 (KILOTON)
- TABLE 66 OIL & GAS: HYDRAULIC FLUIDS MARKET, BY REGION, 2018–2022 (USD MILLION)
- TABLE 67 OIL & GAS: HYDRAULIC FLUIDS MARKET, BY REGION, 2023–2029 (USD MILLION)
- TABLE 68 OIL & GAS: HYDRAULIC FLUIDS MARKET, BY REGION, 2018–2022 (KILOTON)
- TABLE 69 OIL & GAS: HYDRAULIC FLUIDS MARKET, BY REGION, 2023–2029 (KILOTON)
- TABLE 70 TRANSPORTATION: HYDRAULIC FLUIDS MARKET, BY REGION, 2018–2022 (USD MILLION)
- TABLE 71 TRANSPORTATION: HYDRAULIC FLUIDS MARKET, BY REGION, 2023–2029 (USD MILLION)
- TABLE 72 TRANSPORTATION: HYDRAULIC FLUIDS MARKET, BY REGION, 2018–2022 (KILOTON)
- TABLE 73 TRANSPORTATION: HYDRAULIC FLUIDS MARKET, BY REGION, 2023–2029 (KILOTON)
- TABLE 74 CEMENT PRODUCTION: HYDRAULIC FLUIDS MARKET, BY REGION, 2018–2022 (USD MILLION)
- TABLE 75 CEMENT PRODUCTION: HYDRAULIC FLUIDS MARKET, BY REGION, 2023–2029 (USD MILLION)
- TABLE 76 CEMENT PRODUCTION: HYDRAULIC FLUIDS MARKET, BY REGION, 2018–2022 (KILOTON)
- TABLE 77 CEMENT PRODUCTION: HYDRAULIC FLUIDS MARKET, BY REGION, 2023–2029 (KILOTON)
- TABLE 78 FOOD PROCESSING: HYDRAULIC FLUIDS MARKET, BY REGION, 2018–2022 (USD MILLION)
- TABLE 79 FOOD PROCESSING: HYDRAULIC FLUIDS MARKET, BY REGION, 2023–2029 (USD MILLION)
- TABLE 80 FOOD PROCESSING: HYDRAULIC FLUIDS MARKET, BY REGION, 2018–2022 (KILOTON)
- TABLE 81 FOOD PROCESSING: HYDRAULIC FLUIDS MARKET, BY REGION, 2023–2029 (KILOTON)
- TABLE 82 POWER GENERATION: HYDRAULIC FLUIDS MARKET, BY REGION, 2018–2022 (USD MILLION)
- TABLE 83 POWER GENERATION: HYDRAULIC FLUIDS MARKET, BY REGION, 2023–2029 (USD MILLION)
- TABLE 84 POWER GENERATION: HYDRAULIC FLUIDS MARKET, BY REGION, 2018–2022 (KILOTON)
- TABLE 85 POWER GENERATION: HYDRAULIC FLUIDS MARKET, BY REGION, 2023–2029 (KILOTON)
- TABLE 86 OTHER END-USE INDUSTRIES: HYDRAULIC FLUIDS MARKET, BY REGION, 2018–2022 (USD MILLION)
- TABLE 87 OTHER END-USE INDUSTRIES: HYDRAULIC FLUIDS MARKET, BY REGION, 2023–2029 (USD MILLION)
- TABLE 88 OTHER END-USE INDUSTRIES: HYDRAULIC FLUIDS MARKET, BY REGION, 2018–2022 (KILOTON)
- TABLE 89 OTHER END-USE INDUSTRIES: HYDRAULIC FLUIDS MARKET, BY REGION, 2023–2029 (KILOTON)
- TABLE 90 HYDRAULIC FLUIDS MARKET, BY REGION, 2018–2022 (USD MILLION)
- TABLE 91 HYDRAULIC FLUIDS MARKET, BY REGION, 2023–2029 (USD MILLION)
- TABLE 92 HYDRAULIC FLUIDS MARKET, BY REGION, 2018–2022 (KILOTON)
- TABLE 93 HYDRAULIC FLUIDS MARKET, BY REGION, 2023–2029 (KILOTON)
- TABLE 94 ASIA PACIFIC: HYDRAULIC FLUIDS MARKET, BY BASE OIL, 2018–2022 (USD MILLION)
- TABLE 95 ASIA PACIFIC: HYDRAULIC FLUIDS MARKET, BY BASE OIL, 2023–2029 (USD MILLION)
- TABLE 96 ASIA PACIFIC: HYDRAULIC FLUIDS MARKET, BY BASE OIL, 2018–2022 (KILOTON)
- TABLE 97 ASIA PACIFIC: HYDRAULIC FLUIDS MARKET, BY BASE OIL, 2023–2029 (KILOTON)
- TABLE 98 ASIA PACIFIC: HYDRAULIC FLUIDS MARKET, BY END-USE INDUSTRY, 2018–2022 (USD MILLION)
- TABLE 99 ASIA PACIFIC: HYDRAULIC FLUIDS MARKET, BY END-USE INDUSTRY, 2023–2029 (USD MILLION)
- TABLE 100 ASIA PACIFIC: HYDRAULIC FLUIDS MARKET, BY END-USE INDUSTRY, 2018–2022 (KILOTON)
- TABLE 101 ASIA PACIFIC: HYDRAULIC FLUIDS MARKET, BY END-USE INDUSTRY, 2023–2029 (KILOTON)
- TABLE 102 ASIA PACIFIC: HYDRAULIC FLUIDS MARKET, BY COUNTRY, 2018–2022 (USD MILLION)
- TABLE 103 ASIA PACIFIC: HYDRAULIC FLUIDS MARKET, BY COUNTRY, 2023–2029 (USD MILLION)
- TABLE 104 ASIA PACIFIC: HYDRAULIC FLUIDS MARKET, BY COUNTRY, 2018–2022 (KILOTON)
- TABLE 105 ASIA PACIFIC: HYDRAULIC FLUIDS MARKET, BY COUNTRY, 2023–2029 (KILOTON)
- TABLE 106 CHINA: HYDRAULIC FLUIDS MARKET, BY END-USE INDUSTRY, 2018–2022 (USD MILLION)
- TABLE 107 CHINA: HYDRAULIC FLUIDS MARKET, BY END-USE INDUSTRY, 2023–2029 (USD MILLION)
- TABLE 108 CHINA: HYDRAULIC FLUIDS MARKET, BY END-USE INDUSTRY, 2018–2022 (KILOTON)
- TABLE 109 CHINA: HYDRAULIC FLUIDS MARKET, BY END-USE INDUSTRY, 2023–2029 (KILOTON)
- TABLE 110 INDIA: HYDRAULIC FLUIDS MARKET, BY END-USE INDUSTRY, 2018–2022 (USD MILLION)
- TABLE 111 INDIA: HYDRAULIC FLUIDS MARKET, BY END-USE INDUSTRY, 2023–2029 (USD MILLION)
- TABLE 112 INDIA: HYDRAULIC FLUIDS MARKET, BY END-USE INDUSTRY, 2018–2022 (KILOTON)
- TABLE 113 INDIA: HYDRAULIC FLUIDS MARKET, BY END-USE INDUSTRY, 2023–2029 (KILOTON)
- TABLE 114 JAPAN: HYDRAULIC FLUIDS MARKET, BY END-USE INDUSTRY, 2018–2022 (USD MILLION)
- TABLE 115 JAPAN: HYDRAULIC FLUIDS MARKET, BY END-USE INDUSTRY, 2023–2029 (USD MILLION)
- TABLE 116 JAPAN: HYDRAULIC FLUIDS MARKET, BY END-USE INDUSTRY, 2018–2022 (KILOTON)
- TABLE 117 JAPAN: HYDRAULIC FLUIDS MARKET, BY END-USE INDUSTRY, 2023–2029 (KILOTON)
- TABLE 118 SOUTH KOREA: HYDRAULIC FLUIDS MARKET, BY END-USE INDUSTRY, 2018–2022 (USD MILLION)
- TABLE 119 SOUTH KOREA: HYDRAULIC FLUIDS MARKET, BY END-USE INDUSTRY, 2023–2029 (USD MILLION)
- TABLE 120 SOUTH KOREA: HYDRAULIC FLUIDS MARKET, BY END-USE INDUSTRY, 2018–2022 (KILOTON)
- TABLE 121 SOUTH KOREA: HYDRAULIC FLUIDS MARKET, BY END-USE INDUSTRY, 2023–2029 (KILOTON)
- TABLE 122 AUSTRALIA & NEW ZEALAND: HYDRAULIC FLUIDS MARKET, BY END-USE INDUSTRY, 2018–2022 (USD MILLION)
- TABLE 123 AUSTRALIA & NEW ZEALAND: HYDRAULIC FLUIDS MARKET, BY END-USE INDUSTRY, 2023–2029 (USD MILLION)
- TABLE 124 AUSTRALIA & NEW ZEALAND: HYDRAULIC FLUIDS MARKET, BY END-USE INDUSTRY, 2018–2022 (KILOTON)
- TABLE 125 AUSTRALIA & NEW ZEALAND: HYDRAULIC FLUIDS MARKET, BY END-USE INDUSTRY, 2023–2029 (KILOTON)
- TABLE 126 THAILAND: HYDRAULIC FLUIDS MARKET, BY END-USE INDUSTRY, 2018–2022 (USD MILLION)
- TABLE 127 THAILAND: HYDRAULIC FLUIDS MARKET, BY END-USE INDUSTRY, 2023–2029 (USD MILLION)
- TABLE 128 THAILAND: HYDRAULIC FLUIDS MARKET, BY END-USE INDUSTRY, 2018–2022 (KILOTON)
- TABLE 129 THAILAND: HYDRAULIC FLUIDS MARKET, BY END-USE INDUSTRY, 2023–2029 (KILOTON)
- TABLE 130 INDONESIA: HYDRAULIC FLUIDS MARKET, BY END-USE INDUSTRY, 2018–2022 (USD MILLION)
- TABLE 131 INDONESIA: HYDRAULIC FLUIDS MARKET, BY END-USE INDUSTRY, 2023–2029 (USD MILLION)
- TABLE 132 INDONESIA: HYDRAULIC FLUIDS MARKET, BY END-USE INDUSTRY, 2018–2022 (KILOTON)
- TABLE 133 INDONESIA: HYDRAULIC FLUIDS MARKET, BY END-USE INDUSTRY, 2023–2029 (KILOTON)
- TABLE 134 EUROPE: HYDRAULIC FLUIDS MARKET, BY BASE OIL, 2018–2022 (USD MILLION)
- TABLE 135 EUROPE: HYDRAULIC FLUIDS MARKET, BY BASE OIL, 2023–2029 (USD MILLION)
- TABLE 136 EUROPE: HYDRAULIC FLUIDS MARKET, BY BASE OIL, 2018–2022 (KILOTON)
- TABLE 137 EUROPE: HYDRAULIC FLUIDS MARKET, BY BASE OIL, 2023–2029 (KILOTON)
- TABLE 138 EUROPE: HYDRAULIC FLUIDS MARKET, BY END-USE INDUSTRY, 2018–2022 (USD MILLION)
- TABLE 139 EUROPE: HYDRAULIC FLUIDS MARKET, BY END-USE INDUSTRY, 2023–2029 (USD MILLION)
- TABLE 140 EUROPE: HYDRAULIC FLUIDS MARKET, BY END-USE INDUSTRY, 2018–2022 (KILOTON)
- TABLE 141 EUROPE: HYDRAULIC FLUIDS MARKET, BY END-USE INDUSTRY, 2023–2029 (KILOTON)
- TABLE 142 EUROPE: HYDRAULIC FLUIDS MARKET, BY COUNTRY, 2018–2022 (USD MILLION)
- TABLE 143 EUROPE: HYDRAULIC FLUIDS MARKET, BY COUNTRY, 2023–2029 (USD MILLION)
- TABLE 144 EUROPE: HYDRAULIC FLUIDS MARKET, BY COUNTRY, 2018–2022 (KILOTON)
- TABLE 145 EUROPE: HYDRAULIC FLUIDS MARKET, BY COUNTRY, 2023–2029 (KILOTON)
- TABLE 146 RUSSIA: HYDRAULIC FLUIDS MARKET, BY END-USE INDUSTRY, 2018–2022 (USD MILLION)
- TABLE 147 RUSSIA: HYDRAULIC FLUIDS MARKET, BY END-USE INDUSTRY, 2023–2029 (USD MILLION)
- TABLE 148 RUSSIA: HYDRAULIC FLUIDS MARKET, BY END-USE INDUSTRY, 2018–2022 (KILOTON)
- TABLE 149 RUSSIA: HYDRAULIC FLUIDS MARKET, BY END-USE INDUSTRY, 2023–2029 (KILOTON)
- TABLE 150 GERMANY: HYDRAULIC FLUIDS MARKET, BY END-USE INDUSTRY, 2018–2022 (USD MILLION)
- TABLE 151 GERMANY: HYDRAULIC FLUIDS MARKET, BY END-USE INDUSTRY, 2023–2029 (USD MILLION)
- TABLE 152 GERMANY: HYDRAULIC FLUIDS MARKET, BY END-USE INDUSTRY, 2018–2022 (KILOTON)
- TABLE 153 GERMANY: HYDRAULIC FLUIDS MARKET, BY END-USE INDUSTRY, 2023–2029 (KILOTON)
- TABLE 154 UK: HYDRAULIC FLUIDS MARKET, BY END-USE INDUSTRY, 2018–2022 (USD MILLION)
- TABLE 155 UK: HYDRAULIC FLUIDS MARKET, BY END-USE INDUSTRY, 2023–2029 (USD MILLION)
- TABLE 156 UK: HYDRAULIC FLUIDS MARKET, BY END-USE INDUSTRY, 2018–2022 (KILOTON)
- TABLE 157 UK: HYDRAULIC FLUIDS MARKET, BY END-USE INDUSTRY, 2023–2029 (KILOTON)
- TABLE 158 FRANCE: HYDRAULIC FLUIDS MARKET, BY END-USE INDUSTRY, 2018–2022 (USD MILLION)
- TABLE 159 FRANCE: HYDRAULIC FLUIDS MARKET, BY END-USE INDUSTRY, 2023–2029 (USD MILLION)
- TABLE 160 FRANCE: HYDRAULIC FLUIDS MARKET, BY END-USE INDUSTRY, 2018–2022 (KILOTON)
- TABLE 161 FRANCE: HYDRAULIC FLUIDS MARKET, BY END-USE INDUSTRY, 2023–2029 (KILOTON)
- TABLE 162 ITALY: HYDRAULIC FLUIDS MARKET, BY END-USE INDUSTRY, 2018–2022 (USD MILLION)
- TABLE 163 ITALY: HYDRAULIC FLUIDS MARKET, BY END-USE INDUSTRY, 2023–2029 (USD MILLION)
- TABLE 164 ITALY: HYDRAULIC FLUIDS MARKET, BY END-USE INDUSTRY, 2018–2022 (KILOTON)
- TABLE 165 ITALY: HYDRAULIC FLUIDS MARKET, BY END-USE INDUSTRY, 2023–2029 (KILOTON)
- TABLE 166 SPAIN: HYDRAULIC FLUIDS MARKET, BY END-USE INDUSTRY, 2018–2022 (USD MILLION)
- TABLE 167 SPAIN: HYDRAULIC FLUIDS MARKET, BY END-USE INDUSTRY, 2023–2029 (USD MILLION)
- TABLE 168 SPAIN: HYDRAULIC FLUIDS MARKET, BY END-USE INDUSTRY, 2018–2022 (KILOTON)
- TABLE 169 SPAIN: HYDRAULIC FLUIDS MARKET, BY END-USE INDUSTRY, 2023–2029 (KILOTON)
- TABLE 170 TURKEY: HYDRAULIC FLUIDS MARKET, BY END-USE INDUSTRY, 2018–2022 (USD MILLION)
- TABLE 171 TURKEY: HYDRAULIC FLUIDS MARKET, BY END-USE INDUSTRY, 2023–2029 (USD MILLION)
- TABLE 172 TURKEY: HYDRAULIC FLUIDS MARKET, BY END-USE INDUSTRY, 2018–2022 (KILOTON)
- TABLE 173 TURKEY: HYDRAULIC FLUIDS MARKET, BY END-USE INDUSTRY, 2023–2029 (KILOTON)
- TABLE 174 NORTH AMERICA: HYDRAULIC FLUIDS MARKET, BY BASE OIL, 2018–2022 (USD MILLION)
- TABLE 175 NORTH AMERICA: HYDRAULIC FLUIDS MARKET, BY BASE OIL, 2023–2029 (USD MILLION)
- TABLE 176 NORTH AMERICA: HYDRAULIC FLUIDS MARKET, BY BASE OIL, 2018–2022 (KILOTON)
- TABLE 177 NORTH AMERICA: HYDRAULIC FLUIDS MARKET, BY BASE OIL, 2023–2029 (KILOTON)
- TABLE 178 NORTH AMERICA: HYDRAULIC FLUIDS MARKET, BY END-USE INDUSTRY, 2018–2022 (USD MILLION)
- TABLE 179 NORTH AMERICA: HYDRAULIC FLUIDS MARKET, BY END-USE INDUSTRY, 2023–2029 (USD MILLION)
- TABLE 180 NORTH AMERICA: HYDRAULIC FLUIDS MARKET, BY END-USE INDUSTRY, 2018–2022 (KILOTON)
- TABLE 181 NORTH AMERICA: HYDRAULIC FLUIDS MARKET, BY END-USE INDUSTRY, 2023–2029 (KILOTON)
- TABLE 182 NORTH AMERICA: HYDRAULIC FLUIDS MARKET, BY COUNTRY, 2018–2022 (USD MILLION)
- TABLE 183 NORTH AMERICA: HYDRAULIC FLUIDS MARKET, BY COUNTRY, 2023–2029 (USD MILLION)
- TABLE 184 NORTH AMERICA: HYDRAULIC FLUIDS MARKET, BY COUNTRY, 2018–2022 (KILOTON)
- TABLE 185 NORTH AMERICA: HYDRAULIC FLUIDS MARKET, BY COUNTRY, 2023–2029 (KILOTON)
- TABLE 186 US: HYDRAULIC FLUIDS MARKET, BY END-USE INDUSTRY, 2018–2022 (USD MILLION)
- TABLE 187 US: HYDRAULIC FLUIDS MARKET, BY END-USE INDUSTRY, 2023–2029 (USD MILLION)
- TABLE 188 US: HYDRAULIC FLUIDS MARKET, BY END-USE INDUSTRY, 2018–2022 (KILOTON)
- TABLE 189 US: HYDRAULIC FLUIDS MARKET, BY END-USE INDUSTRY, 2023–2029 (KILOTON)
- TABLE 190 CANADA: HYDRAULIC FLUIDS MARKET, BY END-USE INDUSTRY, 2018–2022 (USD MILLION)
- TABLE 191 CANADA: HYDRAULIC FLUIDS MARKET, BY END-USE INDUSTRY, 2023–2029 (USD MILLION)
- TABLE 192 CANADA: HYDRAULIC FLUIDS MARKET, BY END-USE INDUSTRY, 2018–2022 (KILOTON)
- TABLE 193 CANADA: HYDRAULIC FLUIDS MARKET, BY END-USE INDUSTRY, 2023–2029 (KILOTON)
- TABLE 194 MEXICO: HYDRAULIC FLUIDS MARKET, BY END-USE INDUSTRY, 2018–2022 (USD MILLION)
- TABLE 195 MEXICO: HYDRAULIC FLUIDS MARKET, BY END-USE INDUSTRY, 2023–2029 (USD MILLION)
- TABLE 196 MEXICO: HYDRAULIC FLUIDS MARKET, BY END-USE INDUSTRY, 2018–2022 (KILOTON)
- TABLE 197 MEXICO: HYDRAULIC FLUIDS MARKET, BY END-USE INDUSTRY, 2023–2029 (KILOTON)
- TABLE 198 MIDDLE EAST & AFRICA: HYDRAULIC FLUIDS MARKET, BY BASE OIL, 2018–2022 (USD MILLION)
- TABLE 199 MIDDLE EAST & AFRICA: HYDRAULIC FLUIDS MARKET, BY BASE OIL, 2023–2029 (USD MILLION)
- TABLE 200 MIDDLE EAST & AFRICA: HYDRAULIC FLUIDS MARKET, BY BASE OIL, 2018–2022 (KILOTON)
- TABLE 201 MIDDLE EAST & AFRICA: HYDRAULIC FLUIDS MARKET, BY BASE OIL, 2023–2029 (KILOTON)
- TABLE 202 MIDDLE EAST & AFRICA: HYDRAULIC FLUIDS MARKET, BY END-USE INDUSTRY, 2018–2022 (USD MILLION)
- TABLE 203 MIDDLE EAST & AFRICA: HYDRAULIC FLUIDS MARKET, BY END-USE INDUSTRY, 2023–2029 (USD MILLION)
- TABLE 204 MIDDLE EAST & AFRICA: HYDRAULIC FLUIDS MARKET, BY END-USE INDUSTRY, 2018–2022 (KILOTON)
- TABLE 205 MIDDLE EAST & AFRICA: HYDRAULIC FLUIDS MARKET, BY END-USE INDUSTRY, 2023–2029 (KILOTON)
- TABLE 206 MIDDLE EAST & AFRICA: HYDRAULIC FLUIDS MARKET, BY COUNTRY, 2018–2022 (USD MILLION)
- TABLE 207 MIDDLE EAST & AFRICA: HYDRAULIC FLUIDS MARKET, BY COUNTRY, 2023–2029 (USD MILLION)
- TABLE 208 MIDDLE EAST & AFRICA: HYDRAULIC FLUIDS MARKET, BY COUNTRY, 2018–2022 (KILOTON)
- TABLE 209 MIDDLE EAST & AFRICA: HYDRAULIC FLUIDS MARKET, BY COUNTRY, 2023–2029 (KILOTON)
- TABLE 210 SAUDI ARABIA: HYDRAULIC FLUIDS MARKET, BY END-USE INDUSTRY, 2018–2022 (USD MILLION)
- TABLE 211 SAUDI ARABIA: HYDRAULIC FLUIDS MARKET, BY END-USE INDUSTRY, 2023–2029 (USD MILLION)
- TABLE 212 SAUDI ARABIA: HYDRAULIC FLUIDS MARKET, BY END-USE INDUSTRY, 2018–2022 (KILOTON)
- TABLE 213 SAUDI ARABIA: HYDRAULIC FLUIDS MARKET, BY END-USE INDUSTRY, 2023–2029 (KILOTON)
- TABLE 214 SOUTH AFRICA: HYDRAULIC FLUIDS MARKET, BY END-USE INDUSTRY, 2018–2022 (USD MILLION)
- TABLE 215 SOUTH AFRICA: HYDRAULIC FLUIDS MARKET, BY END-USE INDUSTRY, 2023–2029 (USD MILLION)
- TABLE 216 SOUTH AFRICA: HYDRAULIC FLUIDS MARKET, BY END-USE INDUSTRY, 2018–2022 (KILOTON)
- TABLE 217 SOUTH AFRICA: HYDRAULIC FLUIDS MARKET, BY END-USE INDUSTRY, 2023–2029 (KILOTON)
- TABLE 218 IRAN: HYDRAULIC FLUIDS MARKET, BY END-USE INDUSTRY, 2018–2022 (USD MILLION)
- TABLE 219 IRAN: HYDRAULIC FLUIDS MARKET, BY END-USE INDUSTRY, 2023–2029 (USD MILLION)
- TABLE 220 IRAN: HYDRAULIC FLUIDS MARKET, BY END-USE INDUSTRY, 2018–2022 (KILOTON)
- TABLE 221 IRAN: HYDRAULIC FLUIDS MARKET, BY END-USE INDUSTRY, 2023–2029 (KILOTON)
- TABLE 222 SOUTH AMERICA: HYDRAULIC FLUIDS MARKET, BY BASE OIL, 2018–2022 (USD MILLION)
- TABLE 223 SOUTH AMERICA: HYDRAULIC FLUIDS MARKET, BY BASE OIL, 2023–2029 (USD MILLION)
- TABLE 224 SOUTH AMERICA: HYDRAULIC FLUIDS MARKET, BY BASE OIL, 2018–2022 (KILOTON)
- TABLE 225 SOUTH AMERICA: HYDRAULIC FLUIDS MARKET, BY BASE OIL, 2023–2029 (KILOTON)
- TABLE 226 SOUTH AMERICA: HYDRAULIC FLUIDS MARKET, BY END-USE INDUSTRY, 2018–2022 (USD MILLION)
- TABLE 227 SOUTH AMERICA: HYDRAULIC FLUIDS MARKET, BY END-USE INDUSTRY, 2023–2029 (USD MILLION)
- TABLE 228 SOUTH AMERICA: HYDRAULIC FLUIDS MARKET, BY END-USE INDUSTRY, 2018–2022 (KILOTON)
- TABLE 229 SOUTH AMERICA: HYDRAULIC FLUIDS MARKET, BY END-USE INDUSTRY, 2023–2029 (KILOTON)
- TABLE 230 SOUTH AMERICA: HYDRAULIC FLUIDS MARKET, BY COUNTRY, 2018–2022 (USD MILLION)
- TABLE 231 SOUTH AMERICA: HYDRAULIC FLUIDS MARKET, BY COUNTRY, 2023–2029 (USD MILLION)
- TABLE 232 SOUTH AMERICA: HYDRAULIC FLUIDS MARKET, BY COUNTRY, 2018–2022 (KILOTON)
- TABLE 233 SOUTH AMERICA: HYDRAULIC FLUIDS MARKET, BY COUNTRY, 2023–2029 (KILOTON)
- TABLE 234 BRAZIL: HYDRAULIC FLUIDS MARKET, BY END-USE INDUSTRY, 2018–2022 (USD MILLION)
- TABLE 235 BRAZIL: HYDRAULIC FLUIDS MARKET, BY END-USE INDUSTRY, 2023–2029 (USD MILLION)
- TABLE 236 BRAZIL: HYDRAULIC FLUIDS MARKET, BY END-USE INDUSTRY, 2018–2022 (KILOTON)
- TABLE 237 BRAZIL: HYDRAULIC FLUIDS MARKET, BY END-USE INDUSTRY, 2023–2029 (KILOTON)
- TABLE 238 ARGENTINA: HYDRAULIC FLUIDS MARKET, BY END-USE INDUSTRY, 2018–2022 (USD MILLION)
- TABLE 239 ARGENTINA: HYDRAULIC FLUIDS MARKET, BY END-USE INDUSTRY, 2023–2029 (USD MILLION)
- TABLE 240 ARGENTINA: HYDRAULIC FLUIDS MARKET, BY END-USE INDUSTRY, 2018–2022 (KILOTON)
- TABLE 241 ARGENTINA: HYDRAULIC FLUIDS MARKET, BY END-USE INDUSTRY, 2023–2029 (KILOTON)
- TABLE 242 OVERVIEW OF STRATEGIES ADOPTED BY KEY HYDRAULIC FLUID MANUFACTURERS
- TABLE 243 HYDRAULIC FLUIDS MARKET: DEGREE OF COMPETITION
- TABLE 244 HYDRAULIC FLUIDS MARKET: REGION FOOTPRINT
- TABLE 245 HYDRAULIC FLUIDS MARKET: BASE OIL FOOTPRINT
- TABLE 246 HYDRAULIC FLUIDS MARKET: APPLICATION FOOTPRINT
- TABLE 247 HYDRAULIC FLUIDS MARKET: POINT OF SALE FOOTPRINT
- TABLE 248 HYDRAULIC FLUIDS MARKET: END-USE INDUSTRY FOOTPRINT
- TABLE 249 HYDRAULIC FLUIDS MARKET: PRODUCT LAUNCHES, JANUARY 2019–JUNE 2024
- TABLE 250 HYDRAULIC FLUIDS MARKET: DEALS, JANUARY 2019–JUNE 2024
- TABLE 251 HYDRAULIC FLUIDS MARKET: EXPANSION, JANUARY 2019–JUNE 2024
- TABLE 252 EXXON MOBIL CORPORATION: COMPANY OVERVIEW
- TABLE 253 EXXON MOBIL CORPORATION: PRODUCTS/SOLUTIONS/SERVICES OFFERED
- TABLE 254 EXXON MOBIL CORPORATION: PRODUCT LAUNCHES
- TABLE 255 EXXON MOBIL CORPORATION: DEALS
- TABLE 256 EXXON MOBIL CORPORATION: EXPANSIONS
- TABLE 257 TOTALENERGIES SE: COMPANY OVERVIEW
- TABLE 258 TOTALENERGIES SE: PRODUCTS/SOLUTIONS/SERVICES OFFERED
- TABLE 259 TOTALENERGIES SE: PRODUCT LAUNCHES
- TABLE 260 TOTALENERGIES SE: DEALS
- TABLE 261 TOTALENERGIES SE: EXPANSIONS
- TABLE 262 SHELL PLC: COMPANY OVERVIEW
- TABLE 263 SHELL PLC: PRODUCTS/SOLUTIONS/SERVICES OFFERED
- TABLE 264 SHELL PLC: PRODUCT LAUNCHES
- TABLE 265 SHELL PLC: DEALS
- TABLE 266 SHELL PLC: EXPANSIONS
- TABLE 267 CHEVRON CORPORATION: COMPANY OVERVIEW
- TABLE 268 CHEVRON CORPORATION: PRODUCTS/SOLUTIONS/SERVICES OFFERED
- TABLE 269 CHEVRON CORPORATION: DEALS
- TABLE 270 CHEVRON CORPORATION: EXPANSIONS
- TABLE 271 BP P.L.C.: COMPANY OVERVIEW
- TABLE 272 BP P.L.C.: PRODUCTS/SOLUTIONS/SERVICES OFFERED
- TABLE 273 BP P.L.C.: EXPANSIONS
- TABLE 274 FUCHS SE: COMPANY OVERVIEW
- TABLE 275 FUCHS SE: PRODUCTS/SOLUTIONS/SERVICES OFFERED
- TABLE 276 FUCHS SE: DEALS
- TABLE 277 FUCHS SE: EXPANSIONS
- TABLE 278 CHINA PETROLEUM & CHEMICAL CORPORATION: COMPANY OVERVIEW
- TABLE 279 CHINA PETROLEUM & CHEMICAL CORPORATION: PRODUCTS/SOLUTIONS/SERVICES OFFERED
- TABLE 280 CHINA PETROLEUM & CHEMICAL CORPORATION: DEALS
- TABLE 281 CHINA PETROLEUM & CHEMICAL CORPORATION: EXPANSIONS
- TABLE 282 ENEOS HOLDINGS, INC.: COMPANY OVERVIEW
- TABLE 283 ENEOS HOLDINGS, INC.: PRODUCTS/SOLUTIONS/SERVICES OFFERED
- TABLE 284 ENEOS HOLDINGS, INC.: DEALS
- TABLE 285 ENEOS HOLDINGS, INC.: EXPANSIONS
- TABLE 286 IDEMITSU KOSAN CO., LTD.: COMPANY OVERVIEW
- TABLE 287 IDEMITSU KOSAN CO., LTD.: PRODUCTS/SOLUTIONS/SERVICES OFFERED
- TABLE 288 IDEMITSU KOSAN CO., LTD.: DEALS
- TABLE 289 IDEMITSU KOSAN CO., LTD.: EXPANSIONS
- TABLE 290 PETROCHINA COMPANY LIMITED: COMPANY OVERVIEW
- TABLE 291 PETROCHINA COMPANY LIMITED: PRODUCTS/SOLUTIONS/SERVICES OFFERED
- TABLE 292 PETROCHINA COMPANY LIMITED: DEALS
- TABLE 293 PETROLIAM NASIONAL BERHAD (PETRONAS): COMPANY OVERVIEW
- TABLE 294 LUKOIL: COMPANY OVERVIEW
- TABLE 295 PT PERTAMINA (PERSERO): COMPANY OVERVIEW
- TABLE 296 INDIAN OIL CORPORATION LIMITED: COMPANY OVERVIEW
- TABLE 297 HINDUSTAN PETROLEUM CORPORATION LIMITED: COMPANY OVERVIEW
- TABLE 298 PHILLIPS 66: COMPANY OVERVIEW
- TABLE 299 PETRÓLEO BRASILEIRO S.A. (PETROBRAS): COMPANY OVERVIEW
- TABLE 300 BALMER LAWRIE & CO. LTD.: COMPANY OVERVIEW
- TABLE 301 PJSC ROSNEFT OIL COMPANY: COMPANY OVERVIEW
- TABLE 302 LUBRI-LAB INC.: COMPANY OVERVIEW
- TABLE 303 CALUMET SPECIALTY PRODUCTS PARTNERS, L.P.: COMPANY OVERVIEW
- TABLE 304 CITGO PETROLEUM CORPORATION: COMPANY OVERVIEW
- TABLE 305 HARRISON MANUFACTURING PTY LIMITED: COMPANY OVERVIEW
- TABLE 306 NYCO: COMPANY OVERVIEW
- TABLE 307 PENRITE OIL: COMPANY OVERVIEW
- TABLE 308 INDUSTRIAL LUBRICANTS MARKET, BY REGION, 2018–2022 (USD MILLION)
- TABLE 309 INDUSTRIAL LUBRICANTS MARKET, BY REGION, 2023–2029 (USD MILLION)
- TABLE 310 INDUSTRIAL LUBRICANTS MARKET, BY REGION, 2018–2022 (KILOTON)
- TABLE 311 INDUSTRIAL LUBRICANTS MARKET, BY REGION, 2023–2029 (KILOTON)
- TABLE 312 ASIA PACIFIC: INDUSTRIAL LUBRICANTS MARKET, BY BASE OIL, 2018–2022 (USD MILLION)
- TABLE 313 ASIA PACIFIC: INDUSTRIAL LUBRICANTS MARKET, BY BASE OIL, 2023–2029 (USD MILLION)
- TABLE 314 ASIA PACIFIC: INDUSTRIAL LUBRICANTS MARKET, BY BASE OIL, 2018–2022 (KILOTON)
- TABLE 315 ASIA PACIFIC: INDUSTRIAL LUBRICANTS MARKET, BY BASE OIL, 2023–2029 (KILOTON)
- TABLE 316 NORTH AMERICA: INDUSTRIAL LUBRICANTS MARKET, BY BASE OIL, 2018–2022 (USD MILLION)
- TABLE 317 NORTH AMERICA: INDUSTRIAL LUBRICANTS MARKET, BY BASE OIL, 2023–2029 (USD MILLION)
- TABLE 318 NORTH AMERICA: INDUSTRIAL LUBRICANTS MARKET, BY BASE OIL, 2018–2022 (KILOTON)
- TABLE 319 NORTH AMERICA: INDUSTRIAL LUBRICANTS MARKET, BY BASE OIL, 2023–2029 (KILOTON)
- TABLE 320 EUROPE: INDUSTRIAL LUBRICANTS MARKET, BY BASE OIL, 2018–2022 (USD MILLION)
- TABLE 321 EUROPE: INDUSTRIAL LUBRICANTS MARKET, BY BASE OIL, 2023–2029 (USD MILLION)
- TABLE 322 EUROPE: INDUSTRIAL LUBRICANTS MARKET, BY BASE OIL, 2018–2022 (KILOTON)
- TABLE 323 EUROPE: INDUSTRIAL LUBRICANTS MARKET, BY BASE OIL, 2023–2029 (KILOTON)
- TABLE 324 MIDDLE EAST & AFRICA: INDUSTRIAL LUBRICANTS MARKET, BY BASE OIL, 2018–2022 (USD MILLION)
- TABLE 325 MIDDLE EAST & AFRICA: INDUSTRIAL LUBRICANTS MARKET, BY BASE OIL, 2023–2029 (USD MILLION)
- TABLE 326 MIDDLE EAST & AFRICA: INDUSTRIAL LUBRICANTS MARKET, BY BASE OIL, 2018–2022 (KILOTON)
- TABLE 327 MIDDLE EAST & AFRICA: INDUSTRIAL LUBRICANTS MARKET, BY BASE OIL, 2023–2029 (KILOTON)
- TABLE 328 SOUTH AMERICA: INDUSTRIAL LUBRICANTS MARKET, BY BASE OIL, 2018–2022 (USD MILLION)
- TABLE 329 SOUTH AMERICA: INDUSTRIAL LUBRICANTS MARKET, BY BASE OIL, 2023–2029 (USD MILLION)
- TABLE 330 SOUTH AMERICA: INDUSTRIAL LUBRICANTS MARKET, BY BASE OIL, 2018–2022 (KILOTON)
- TABLE 331 SOUTH AMERICA: INDUSTRIAL LUBRICANTS MARKET, BY BASE OIL, 2023–2029 (KILOTON)
- FIGURE 1 HYDRAULIC FLUIDS MARKET SEGMENTATION
- FIGURE 2 HYDRAULIC FLUIDS MARKET: RESEARCH DESIGN
- FIGURE 3 MARKET SIZE ESTIMATION METHODOLOGY: APPROACH 1 (SUPPLY SIDE): COLLECTIVE SHARE OF MAJOR PLAYERS
- FIGURE 4 MARKET SIZE ESTIMATION METHODOLOGY: APPROACH 2 (SUPPLY SIDE): COLLECTIVE REVENUE OF ALL PRODUCTS (BOTTOM-UP)
- FIGURE 5 MARKET SIZE ESTIMATION METHODOLOGY: APPROACH 3 – BOTTOM UP (DEMAND SIDE): PRODUCTS SOLD
- FIGURE 6 MARKET SIZE ESTIMATION METHODOLOGY: TOP-DOWN APPROACH
- FIGURE 7 HYDRAULIC FLUIDS MARKET: DATA TRIANGULATION
- FIGURE 8 MARKET GROWTH PROJECTION FROM SUPPLY SIDE
- FIGURE 9 MARKET GROWTH PROJECTION FROM DEMAND-SIDE DRIVERS AND OPPORTUNITIES
- FIGURE 10 AFTERMARKET SEGMENT TO DOMINATE MARKET DURING FORECAST PERIOD
- FIGURE 11 SYNTHETIC OIL TO BE FASTEST-GROWING BASE OIL SEGMENT DURING FORECAST PERIOD
- FIGURE 12 CONSTRUCTION INDUSTRY TO LEAD MARKET DURING FORECAST PERIOD
- FIGURE 13 ASIA PACIFIC ACCOUNTED FOR LARGEST MARKET SHARE IN 2023
- FIGURE 14 HYDRAULIC FLUIDS MARKET TO WITNESS STEADY GROWTH DURING FORECAST PERIOD
- FIGURE 15 CHINA AND MINERAL OIL SEGMENT LED MARKET IN 2023
- FIGURE 16 ASIA PACIFIC TO BE LARGEST MARKET FOR HYDRAULIC FLUIDS DURING FORECAST PERIOD
- FIGURE 17 CONSTRUCTION END-USE INDUSTRY ACCOUNTED FOR LARGEST MARKET SHARE IN 2023
- FIGURE 18 INDIA PROJECTED TO BE FASTEST-GROWING MARKET DURING FORECAST PERIOD
- FIGURE 19 FACTORS GOVERNING HYDRAULIC FLUIDS MARKET
- FIGURE 20 HYDRAULIC FLUIDS MARKET: PORTER’S FIVE FORCES ANALYSIS
- FIGURE 21 INFLUENCE OF STAKEHOLDERS ON BUYING PROCESS FOR TOP THREE END-USE INDUSTRIES
- FIGURE 22 KEY BUYING CRITERIA FOR TOP THREE END-USE INDUSTRIES
- FIGURE 23 HYDRAULIC FLUIDS MARKET: SUPPLY CHAIN ANALYSIS
- FIGURE 24 HYDRAULIC FLUIDS MARKET: ECOSYSTEM ANALYSIS/MARKET MAP
- FIGURE 25 HYDRAULIC FLUIDS MARKET: FUTURE REVENUE MIX
- FIGURE 26 HYDRAULIC FLUIDS IMPORT, BY KEY COUNTRY (2018–2022)
- FIGURE 27 HYDRAULIC FLUIDS EXPORT, BY KEY COUNTRY (2018–2022)
- FIGURE 28 AVERAGE SELLING PRICE TREND OF KEY PLAYERS FOR TOP THREE BASE OIL TYPES
- FIGURE 29 AVERAGE SELLING PRICE TREND OF HYDRAULIC FLUIDS, BY REGION (2022–2029)
- FIGURE 30 PATENTS REGISTERED, 2013–2023
- FIGURE 31 LIST OF MAJOR PATENTS FOR HYDRAULIC FLUIDS
- FIGURE 32 LEGAL STATUS OF PATENTS FILED FOR HYDRAULIC FLUIDS
- FIGURE 33 MAXIMUM PATENTS FILED IN JURISDICTION OF US
- FIGURE 34 AFTERMARKET SEGMENT TO DOMINATE MARKET DURING FORECAST PERIOD
- FIGURE 35 SYNTHETIC OIL-BASED HYDRAULIC FLUIDS TO ACCOUNT FOR LARGEST MARKET SHARE DURING FORECAST PERIOD
- FIGURE 36 MOBILE EQUIPMENT SEGMENT TO BE LARGEST APPLICATION OF HYDRAULIC FLUIDS DURING FORECAST PERIOD
- FIGURE 37 CONSTRUCTION END-USE INDUSTRY TO LEAD HYDRAULIC FLUIDS MARKET DURING FORECAST PERIOD
- FIGURE 38 ASIA PACIFIC TO REGISTER HIGHEST CAGR DURING FORECAST PERIOD
- FIGURE 39 ASIA PACIFIC: HYDRAULIC FLUIDS MARKET SNAPSHOT
- FIGURE 40 EUROPE: HYDRAULIC FLUIDS MARKET SNAPSHOT
- FIGURE 41 NORTH AMERICA: HYDRAULIC FLUIDS MARKET SNAPSHOT
- FIGURE 42 REVENUE ANALYSIS OF KEY COMPANIES (2019−2023)
- FIGURE 43 SHELL PLC DOMINATED HYDRAULIC FLUIDS MARKET IN 2023
- FIGURE 44 COMPANY EVALUATION MATRIX: KEY PLAYERS, 2023
- FIGURE 45 HYDRAULIC FLUIDS MARKET: COMPANY FOOTPRINT
- FIGURE 46 COMPANY EVALUATION MATRIX: STARTUPS/SMES, 2023
- FIGURE 47 COMPANY VALUATION AND FINANCIAL METRICS OF KEY PLAYERS
- FIGURE 48 EV/EBITDA OF KEY PLAYERS
- FIGURE 49 EXXON MOBIL CORPORATION: COMPANY SNAPSHOT
- FIGURE 50 TOTALENERGIES SE: COMPANY SNAPSHOT
- FIGURE 51 SHELL PLC: COMPANY SNAPSHOT
- FIGURE 52 CHEVRON CORPORATION: COMPANY SNAPSHOT
- FIGURE 53 BP P.L.C.: COMPANY SNAPSHOT
- FIGURE 54 FUCHS SE: COMPANY SNAPSHOT
- FIGURE 55 CHINA PETROLEUM & CHEMICAL CORPORATION: COMPANY SNAPSHOT
- FIGURE 56 ENEOS HOLDINGS, INC.: COMPANY SNAPSHOT
- FIGURE 57 IDEMITSU KOSAN CO., LTD.: COMPANY SNAPSHOT
- FIGURE 58 PETROCHINA COMPANY LIMITED: COMPANY SNAPSHOT
The study involved four major activities in estimating the market size for hydraulic fluids market. Exhaustive secondary research was done to collect information on the market, the peer market, and the parent market. The next step was to validate these findings, assumptions, and sizing with industry experts across the value chain through primary research. Both top-down and bottom-up approaches were employed to estimate the complete market size. After that, the market breakdown and data triangulation procedures were used to estimate the market size of the segments and subsegments.
Secondary Research
Secondary sources used in this study included annual reports, press releases, and investor presentations of companies; white papers; certified publications; articles from recognized authors; and gold standard & silver standard websites such as Factiva, ICIS, Bloomberg, and others. The findings of this study were verified through primary research by conducting extensive interviews with key officials such as CEOs, VPs, directors, and other executives. The breakdown of profiles of the primary interviewees is illustrated in the figure below:
Primary Research
The hydraulic fluids market comprises several stakeholders, such as raw material suppliers, end-product manufacturers, and regulatory organizations in the supply chain. The demand side of this market is characterized by base oil such as mineral oil, synthetic oil, and bio-based oil. The supply side is characterized by advancements in technology and diverse application industries. Various primary sources from both the supply and demand sides of the market were interviewed to obtain qualitative and quantitative information.
Breakdown of Primary Participants
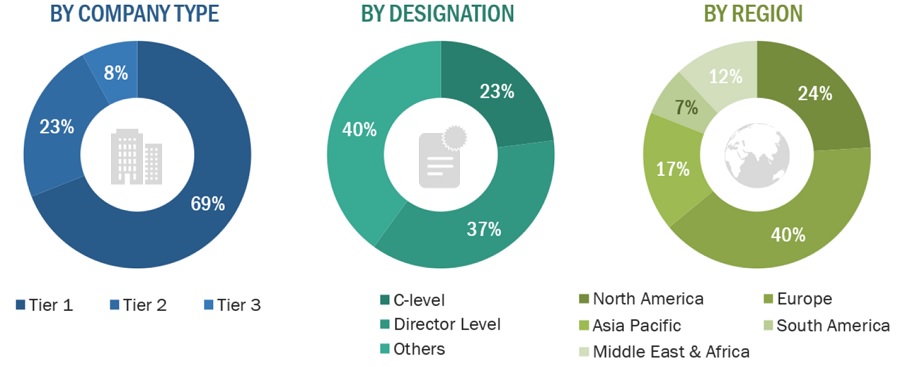
Note: Tier 1, Tier 2, and Tier 3 companies are classified based on their market revenue in 2022/ 2023, available in the public domain, product portfolios, and geographical presence.
Other designations include consultants and sales, marketing, and procurement managers.
To know about the assumptions considered for the study, download the pdf brochure
COMPANY NAME |
DESIGNATION |
BP p.l.c. |
Senior Manager |
Chevron Corporation |
Innovation Manager |
Indian Oil Corporation Limited |
Vice-President |
Exxon Mobil Corporation |
Production Supervisor |
Shell plc |
Sales Manager |
Market Size Estimation
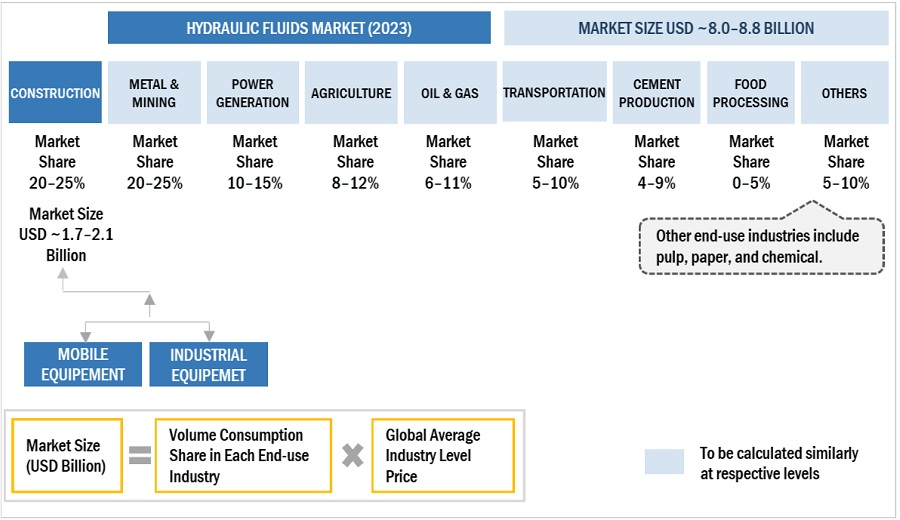
Both top-down and bottom-up approaches were used to estimate and validate the total size of the hydraulic fluids market. These methods were also used extensively to estimate the size of various subsegments in the market. The research methodology used to estimate the market size includes the following:
- The key players in the industry have been identified through extensive secondary research.
- The supply chain of the industry has been determined through primary and secondary research.
- All percentage shares, splits, and breakdowns have been determined using secondary sources and verified through primary sources.
- All possible parameters that affect the markets covered in this research study have been accounted for, viewed in extensive detail, verified through primary research, and analyzed to obtain the final quantitative and qualitative data.
Hydraulic Fluids Market: Bottom-Up Approach
To know about the assumptions considered for the study, Request for Free Sample Report
Hydraulic Fluids Market: Top-Down Approach
Data Triangulation
After arriving at the overall market size—using the market size estimation processes as explained above—the market was split into several segments and subsegments. To complete the overall market engineering process and arrive at the exact statistics of each market segment and subsegment, data triangulation, and market breakdown procedures were employed, wherever applicable. The data was triangulated by studying various factors and trends from both the demand and supply sides in the hydraulic fluids industry.
Market Definition
Hydraulic fluids industry is defined as the business of manufacturing and distributing such specialized fluids and selling them for use in hydraulic systems all over the world. These fluids are useful in distribution of power in different equipments in different industries like construction, agriculture, metal & mining, transportation, power generation, cement production, oil & gas and others. It includes liquids that vary in kinds suitable for particular hydraulic systems; it focuses on the capabilities for optimum performance, resource utilization and compatibility with the elements of the machinery.
Key Stakeholders
- Hydraulic Fluids manufacturers
- Hydraulic Fluids suppliers
- Raw material suppliers
- Service providers
- Application sector companies
- Government bodies
Report Objectives
- To define, describe, and forecast the Hydraulic Fluids market in terms of value and volume
- To provide detailed information regarding the drivers, opportunities, restraints, and challenges influencing market growth
- To estimate and forecast the market size by base oil type, point of sale, application, end-use industry, and region
- To forecast the size of the market for five main regions: Asia Pacific, Europe, North America, South America, and the Middle East & Africa, along with their key countries
- To strategically analyze micromarkets1 with respect to their growth trends, prospects, and contribution to the overall market
- To analyze opportunities in the market for stakeholders and provide a competitive landscape for market leaders
- To analyze competitive developments, such as deals and expansions, in the market
- To analyze the impact of the recession on the market
- To analyze the impact of Recession on the market and end-use industries
- To strategically profile key players and comprehensively analyze their growth strategies
Available Customizations
Along with the given market data, MarketsandMarkets offers customizations according to the company’s specific needs. The following customization options are available for the report:
Regional Analysis
- Further breakdown of a region with respect to a particular country or additional application type
Company Information
- Detailed analysis and profiles of additional market players (up to five)
Growth opportunities and latent adjacency in Hydraulic Fluids Market