Virtual Reality (VR) Market Size, Industry Trends 2030

Virtual Reality (VR) Market Size, Share & Industry Growth Analysis Report by Technology (Non-immersive, Semi & Fully Immersive), Offering, Device Type (Head-mounted Devices, Gesture Tracking Devices, Projectors & Display Walls), Application and Region - Global Forecast to 2029

Report Code: SE 3528 May, 2024, by marketsandmarkets.com

Updated on : Oct 15, 2024

The growing penetration of the metaverse and significant adoption of HMDs across various sectors are attributed to the ever-increasing demand for virtual reality systems, driving impressive virtual reality market growth and vr industry growth. This growth is fueled by advancements in VR technology and the expanding use of VR in industries like VR automotive, VR retail, VR healthcare, VR manufacturing, and VR aerospace & defense.

Virtual Reality (VR) Market Size & Share

The global virtual reality (VR) market size is estimated to be USD 15.9 billion in 2024 and projected to reach USD 38.0 billion by 2029, growing at a CAGR of 19.1% during the forecast period. According to recent virtual reality statistics, the vr market size is poised for significant growth.

Attractive opportunities in the virtual reality market


Virtual Reality Market

Virtual Reality Market

Virtual Reality Market Forecast to 2029

To know about the assumptions considered for the study, Request for Free Sample Report

Virtual Reality (VR) Market Trends

Driver: The growing penetration of the Metaverse

The metaverse is all about creating a sense of presence in a virtual world. Virtual Reality (VR) technology is at the forefront of the metaverse, providing immersive experiences that blur the lines between reality and the virtual world.

VR headsets, such as Meta's Oculus, offer a 360-degree view of virtual worlds, replacing the user's view of the outside world. This technology has already contributed significantly to various industries, including education, healthcare, and customer service. VR has been shown to improve learning and increase accuracy in medical practice, making it a valuable tool for training and education. Immersive experiences in the metaverse, particularly those powered by VR, have the potential to revolutionize the way we work, learn, and socialize.

To access the metaverse, users will require immersive devices like VR headsets, smart glasses, augmented reality (AR) devices, or even smartphones and tablets. VR is one of the mediums that will let users connect with the metaverse, but it is only one part of the implicit concept. The metaverse is a platform that comprises VR as one of its features, delivering a cross-platform experience that enables users to interact with people globally in the virtual world. This is driving growth in the virtual reality headset market and impacting vr headset market share.

For instance, in April 2024, Metaverse911 (India), a metaverse research and advisory firm launched Metaverse Experience Center (MEC) in Noida (India). The MEC is designed to serve as the hub for showcasing cutting-edge AR, VR, Mixed Reality (MR), Digital Twin, and Metaverse solutions, creating a unique space for industry leaders to explore and experience the latest developments in immersive technologies like extended reality.

Restraint: Latency issues and high energy consumption

The efficacy of virtual reality devices hinges upon a delicate balance between various technical factors, with latency in display and energy consumption emerging as pivotal determinants of their overall performance. Latency, referring to the delay between user input and the corresponding visual response in the virtual reality environment, has the potential to disrupt the seamless immersion that virtual reality strives to achieve. Even the slightest delay can lead to motion sickness, discomfort, and a perceptible detachment from the virtual world.

On the other hand, the energy consumption of virtual reality devices plays a critical role in determining the practicality and user experience. High energy demands can lead to shorter battery life, necessitating frequent recharges and limiting the duration of immersive experiences. This not only impacts user convenience but also constrains the scope of applications, particularly in scenarios where uninterrupted usage is essential, such as extended training simulations or immersive educational modules.

Both latency and energy consumption are intertwined, as addressing one often influences the other. Mitigating latency requires rapid data processing, which can strain the device's hardware and subsequently increase energy usage.

Conversely, optimizing energy efficiency might involve lowering processing speeds, inadvertently introducing latency. This intricate interplay highlights the intricate trade-offs virtual reality developers must navigate.

Overcoming these challenges requires advancements in display technology, computational efficiency, and battery capacity. Cutting-edge displays with higher refresh rates can reduce latency, while energy-efficient hardware design and VR software optimization can prolong usage time. As the virtual reality industry matures, technological innovation in these areas is expected to be pivotal in crafting a virtual reality experience that is both immersive and sustainable, ensuring that the impact of latency and energy consumption on overall effectiveness is minimized.

Opportunity: Continuous developments in 5G technology

The adoption of virtual reality technology has been gaining momentum in both personal and professional applications. The advent of the 5G technology is expected to address some challenges by paving the way for optimized distribution of processing capabilities. 5G's enhanced performance enables faster and more reliable connections, leading to an improved user experience in VR applications. The technology's higher data transfer rates and lower latency result in responsive VR experiences, while enhanced visuals allow for the streaming of higher-resolution content and complex 3D graphics in real time. The capabilities of 5G open up new use cases for VR, such as real-time cloud rendering and edge computing, enabling complex and data-intensive applications like virtual tourism and smart city simulations.

For instance, in May 2023, Telefónica S.A. (Spain) partnered with Atlético de Madrid, a Spanish professional football club, to implement a new immersive way of enjoying matches via 5G and in Virtual Reality (VR). This is a new way of watching football matches through the 5G Multicam project, which allows fans to enjoy a 360° real-time experience of the match from various angles, including behind the goal, the tunnel exit, the press area, or the stadium control room. This showcases the potential for VR entertainment applications.

Challenge: Creating VR systems with user-friendly interface

The challenge of developing a virtual reality system with a user-friendly interface delves into the intricate balance between immersive technology and intuitive usability. While the potential of Virtual Reality to transport users to new dimensions is exhilarating, the complexity of integrating intricate hardware, sophisticated software, and natural interaction demands careful consideration.

In crafting a user-friendly virtual reality system, designers must grapple with multifaceted elements. Firstly, the interface should seamlessly guide users through the experience, ensuring that interactions feel intuitive and natural. Complex menus, intricate gestures, and challenging controls can hinder the sense of immersion, disconnecting users from the virtual environment they seek to explore.

Secondly, comfort is paramount. Prolonged virtual reality use can lead to discomfort, motion sickness, and fatigue. Developing an interface that minimizes these negative effects requires understanding how visual cues, motion tracking, and sensory inputs align with the user's physiological response.

Content accessibility must not be compromised. Users, regardless of technical expertise, should be able to access and navigate virtual reality content effortlessly. Striking this balance is a challenge, especially as virtual reality applications expand into diverse industries and user demographics.

Addressing these challenges involves iterative design, user testing, and collaboration among experts in human- computer interaction, interface design, and ergonomics. As the virtual reality landscape matures, the successful resolution of this challenge ensures that immersive experiences are not just exhilarating but also inclusive, comfortable, and easily navigable for a wide spectrum of users.

Creating a user-friendly virtual reality interface involves a combination of thoughtful design, usability testing, and ongoing refinement. Prioritizing user experience and accessibility will contribute to the success of the virtual reality system and enhance user satisfaction, ultimately making virtual reality technology more accessible and enjoyable for a broader audience. This is key for driving VR adoption and expanding the consumer VR market.

Virtual Reality (VR) Market Analysis

The virtual reality (VR) market is experiencing robust growth, fueled by advancements in technology and a broader range of applications. Standalone VR headsets are gaining traction due to their convenience and mobility. While VR gaming continues to drive demand, VR is making significant inroads in education, healthcare, and enterprise sectors for training and simulation purposes. Enhanced user experiences through AI and improved haptic feedback are also contributing to the VR market's expansion. This virtual reality market analysis highlights the key factors driving the VR industry's virtual reality growth and vr growth.

Virtual Reality (VR) Market Trends

The virtual reality (VR) market is rapidly growing, driven by technological advancements and broader adoption across various sectors. Standalone VR headsets are becoming popular due to their enhanced mobility and ease of use. While VR gaming remains a major driver, VR is increasingly used in VR education, healthcare, and remote collaboration for immersive training and virtual meetings.
 
Enterprise applications for design, simulation, and training are also expanding, showcasing the potential for enterprise VR. Integration of AI and improved haptic feedback is enhancing user experiences. As VR hardware becomes more affordable and VR content libraries expand, its appeal broadens, paving the way for mainstream adoption and new business opportunities. These VR industry trends, as detailed in this vr report, showcase the exciting developments shaping the future of the VR market and driving VR market growth. Virtual reality marketing is also emerging as a powerful tool for brands to engage with consumers in immersive ways.

Virtual Reality (VR) Market Ecosystem

Prominent companies in this market include well-established, financially stable providers of virtual reality systems. These companies have been operating in the market for several years and possess a diversified product portfolio, state- of-the-art technologies, and strong global sales and marketing networks.

Prominent companies in this market include Meta (US), Sony (Japan), Samsung Electronics Co., Ltd. (South Korea), Microsoft (US), Unity Technologies (US), Barco (Belgium), Penumbra, Inc. (US), HTC Corporation (Taiwan), PICO Immersive Pte.ltd (US), and DPVR (China). These key VR market players are shaping the virtual reality market share and

Virtual Reality Market by Ecosystem

Virtual Reality (VR) Market Segementation:

By offering, hardware segment is expected to grow with the highest CAGR from 2024 to 2029.

The hardware segment is expected to grow at a higher CAGR of 22% during the forecast period. The growth for hardware segment is anticipated to the demand of VR headsets popularity in gaming, providing an immersive experience that is unmatched by traditional monitors. With the growing popularity of esports and the rising demand for more realistic gaming experiences, VR hardware is expected to see continued growth.

By device type, gesture tracking devices segment is expected to grow with the highest CAGR in 2029.

The Gesture Tracking Devices are expected to record a highest CAGR of 25.2% during the forecast period. Gesture tracking allows for a more natural and intuitive way to interact with the virtual world. By using your hands and body movements to control objects and navigate environments, you feel a deeper sense of presence within the VR experience. This is a major advantage over traditional controllers, which can feel clunky and break immersion.

The advancement of machine learning and computer vision techniques has led to the development of more accurate and robust gesture recognition algorithms. These algorithms can better understand and interpret complex hand and body movements, enabling more intuitive and natural interactions with the virtual environment.

Virtual Reality (VR) Market Growth:

By technology, the Semi & Fully Immersive segment is expected to grow with the highest CAGR from 2024 to 2029.

The Semi & Fully Immersive segment is expected to exhibit a higher CAGR of 19.6% during the forecast. Fully immersive technology provides a high level of immersion, where users feel completely transported into a digital environment, often to the extent that they lose awareness of their physical surroundings.This level of immersion is typically achieved through advanced hardware like high-quality virtual reality headsets and motion-tracking systems that accurately replicate users’ movements in the virtual world.

Semi-immersive technology offers a moderate level of immersion in a digital environment. Users typically interact with these systems using some form of interface, such as a computer screen, projection, or a smaller-scale immersive device like a head-mounted display or Cave Automatic Virtual Environment (CAVE).

Virtual Reality Market by Region

Virtual Reality Market by Region

To know about the assumptions considered for the study, download the pdf brochure

Virtual Reality (VR) Market: Regional Analysis

In 2029, Asia Pacific is projected to hold the highest CAGR of the overall virtual reality market.

In 2029, The virtual reality market in Asia Pacific is expected to grow at the highest CAGR. The Asia Pacific virtual reality market is experiencing significant growth due to the rise of eSports and immersive gaming experiences is a major driver. VR offers a new level of engagement for gamers, and the growing popularity of eSports fuels the demand for VR. Significant players from the region Sony (Japan), Samsung Electronics Co., Ltd. (South Korea), DPVR (China), FOVE, Inc (Japan), Vection Technologies (Australia), and Vighnesh Inc. (India).

Virtual Reality (VR) Industry Overview

The virtual reality (VR) market is rapidly evolving, driven by technological advancements and increasing adoption across diverse sectors. Standalone VR headsets are popular for their convenience and mobility. While gaming remains a key driver, VR is expanding into education, healthcare, and enterprise for applications like training, therapy, and design simulations. Improvements in AI and haptic feedback are enhancing the user experience. As VR technology becomes more affordable and content libraries grow, the market is poised for widespread adoption and new business opportunities.

Top Virtual Reality (VR) Companies - Key Market Players

Virtual Reality (VR) Market Report Scope

Report Metric

Details

Estimated Market Size USD 15.9 billion in 2024
Projected Market Size USD 38.0 billion by 2029
Virtual Reality (VR) Market Growth Rate CAGR of 19.1%

Market Size Availability for Years

2020–2029

Base Year

2023

Forecast Period

2024–2029

Forecast Units

Value (USD Million/Billion)

Segments Covered

By technology, offering, device type, application, and region

Geographies Covered

North America, Europe, Asia Pacific, and RoW

Companies Covered

Meta (US), Sony (Japan), Samsung Electronics Co., Ltd. (South Korea), Microsoft (US), Unity Technologies (US), Barco (Belgium), Penumbra, Inc.  (US), HTC Corporation (Taiwan), PICO Immersive Pte.ltd (US), and DPVR (China) are some of the key players in the virtual reality market.

Virtual Reality Market Highlights

This research report categorizes the virtual reality market based technology, offering, device type, application, and region.

Segment

Subsegment

By Technology

  • Introduction
  • Semi & Fully Immersive
  • Non-immersive

By Offering

  • Introduction
  • Hardware
  • Software

By Device Type

  • Introduction
  • Head-Mounted Displays
  • Projectors & Display Walls
  • Gesture-Tracking Devices

By Application

  • Introduction
  • Consumer
  • Commercial
  • Aerospace & Defense
  • Healthcare
  • Enterprise (Manufacturing)
  • Other Applications

By Region

  • Introduction
  • North America
    • Impact of Recession
    • US
    • Canada
    • Mexico
  • Europe
    • Impact of Recession
    • UK
    • Germany
    • France
    • Rest of Europe
  • Asia Pacific
    • Impact of Recession
    • China
    • Japan
    • India
    • South Korea
    • Rest of Asia Pacific
  • RoW
  • Impact of Recession
  • Middle East & Africa
    • GCC Countries
    • Rest of Middle East & Africa
  • South America

Recent Developments in Virtual Reality (VR) industry

  • In December 2023, DPVR collaborated with SchooVR, provider of immersive educational content. The collaboration between DPVR and SchooVR aims to enhance learning solutions for teachers and students by integrating virtual reality (VR) into the classroom environment.
  • In October 2023, Sony unveiled PlayStation 5 Slim version. It's a redesigned version of the original PS5 that's smaller and lighter, with a few other improvements. The PS5 Slim is about 30% smaller in volume than the original PS5. It's also lighter, making it easier to transport and fit into entertainment centers.
  • In October 2023, DPVR introduced E4C headset is an ideal choice for VR rotation chairs, shooting and fighting games, and other large group applications. The DPVR E4C is designed for simulation training, allowing users to learn how to operate equipment, drive a vehicle, or fly an aircraft through virtual reality
  • In September 2023, DPVR launched P2, a virtual reality headset designed for PC use. It boasts stereo speakers, a longer detachable cable, and a leather faceliner, making it suitable for traffic use and supporting FEC owners in business transformation and revenue growth.
  • In February 2023, Sony introduced PlayStation VR2, it features high fidelity visuals, new sensory features, and enhanced tracking, providing gamers with extraordinary experiences. The headset includes an OLED display with a resolution of 2000 x 2040 pixels per eye, a 110-degree field of view, and foveated rendering. It also incorporates innovative technology like the PlayStation VR2 Sense controller, 3D Audio, and eye tracking to enhance sensory features during gameplay.

Frequently Asked Questions (FAQs):

To speak to our analyst for a discussion on the above findings, click Speak to Analyst

TABLE OF CONTENTS
 
1 INTRODUCTION (Page No. - 22)
    1.1 STUDY OBJECTIVES 
    1.2 MARKET DEFINITION 
           1.2.1 INCLUSIONS AND EXCLUSIONS
    1.3 STUDY SCOPE 
           1.3.1 MARKETS COVERED
           1.3.2 REGIONAL SCOPE
    1.4 YEARS CONSIDERED 
    1.5 CURRENCY CONSIDERED 
    1.6 UNITS CONSIDERED 
    1.7 LIMITATIONS 
    1.8 STAKEHOLDERS 
    1.9 SUMMARY OF CHANGES 
           1.9.1 IMPACT OF RECESSION
 
2 RESEARCH METHODOLOGY (Page No. - 28)
    2.1 INTRODUCTION 
    2.2 RESEARCH DATA 
           2.2.1 SECONDARY DATA
                    2.2.1.1 List of major secondary sources
                    2.2.1.2 Key data from secondary sources
           2.2.2 PRIMARY DATA
                    2.2.2.1 List of key participants in primary interviews
                    2.2.2.2 Breakdown of primary profiles
                    2.2.2.3 Key data from primary sources
                    2.2.2.4 Key insights from industry experts
    2.3 FACTOR ANALYSIS 
           2.3.1 SUPPLY-SIDE ANALYSIS
    2.4 MARKET SIZE ESTIMATION METHODOLOGY 
           2.4.1 BOTTOM-UP APPROACH
                    2.4.1.1 Approach to arrive at market size using bottom-up analysis (demand side)
           2.4.2 TOP-DOWN APPROACH
                    2.4.2.1 Approach to arrive at market size using top-down approach (supply side)
           2.4.3 GROWTH PROJECTIONS AND FORECAST-RELATED ASSUMPTIONS
    2.5 MARKET BREAKDOWN AND DATA TRIANGULATION 
    2.6 RESEARCH ASSUMPTIONS 
    2.7 LIMITATIONS 
    2.8 RISK ASSESSMENT 
    2.9 PARAMETERS CONSIDERED TO ANALYZE RECESSION IMPACT 
 
3 EXECUTIVE SUMMARY (Page No. - 42)
 
4 PREMIUM INSIGHTS (Page No. - 46)
    4.1 ATTRACTIVE GROWTH OPPORTUNITIES FOR KEY PLAYERS IN VIRTUAL REALITY MARKET 
    4.2 VIRTUAL REALITY MARKET, BY COMPONENT 
    4.3 HARDWARE: VIRTUAL REALITY MARKET, BY APPLICATION 
    4.4 SOFTWARE: VIRTUAL REALITY MARKET, BY APPLICATION 
    4.5 CONSUMERS: VIRTUAL REALITY MARKET, BY DEVICE TYPE 
    4.6 VIRTUAL REALITY MARKET, BY REGION 
    4.7 VIRTUAL REALITY MARKET, BY COUNTRY 
 
5 MARKET OVERVIEW (Page No. - 50)
    5.1 INTRODUCTION 
    5.2 MARKET DYNAMICS 
           5.2.1 DRIVERS
                    5.2.1.1 Growing penetration of metaverse
                    5.2.1.2 Rapid adoption of digital technologies in healthcare and gaming & entertainment sectors
                    5.2.1.3 Potential for transformative change across numerous industries
                    5.2.1.4 Significant adoption of HMDs
                    5.2.1.5 Emergence of virtual classrooms offering immersive and engaging learning experiences
           5.2.2 RESTRAINTS
                    5.2.2.1 Latency issues and high energy consumption
                    5.2.2.2 Health issues caused by excessive use of VR devices
           5.2.3 OPPORTUNITIES
                    5.2.3.1 Emerging applications of VR in telemedicine
                    5.2.3.2 Continuous developments in 5G technology
                    5.2.3.3 Growth of global travel & tourism industry
           5.2.4 CHALLENGES
                    5.2.4.1 Creating VR systems with user-friendly interface
                    5.2.4.2 Display latency and limited field of view
    5.3 TRENDS/DISRUPTIONS IMPACTING CUSTOMERS’ BUSINESSES 
    5.4 PRICING ANALYSIS 
           5.4.1 AVERAGE SELLING PRICE TREND FOR TOP PLAYERS, BY HEAD-MOUNTED DISPLAY
           5.4.2 AVERAGE SELLING PRICE TREND, BY REGION
    5.5 VALUE CHAIN ANALYSIS 
    5.6 ECOSYSTEM ANALYSIS 
    5.7 INVESTMENT AND FUNDING SCENARIO 
    5.8 TECHNOLOGY ANALYSIS 
           5.8.1 KEY TECHNOLOGIES
                    5.8.1.1 Motion tracking
                    5.8.1.2 Haptic technology
           5.8.2 COMPLEMENTARY TECHNOLOGY
                    5.8.2.1 Cloud computing
           5.8.3 ADJACENT TECHNOLOGIES
                    5.8.3.1 Artificial Intelligence (AI)
                    5.8.3.2 5G and high-speed networking
    5.9 PATENT ANALYSIS 
    5.10 TRADE DATA ANALYSIS 
           5.10.1 IMPORT DATA
           5.10.2 EXPORT DATA
    5.11 KEY CONFERENCES AND EVENTS 
    5.12 CASE STUDY ANALYSIS 
           5.12.1 EUROPEAN MANUFACTURING COMPANY TRANSFORMED MANUFACTURING TRAINING WITH INNOWISE’S VIRTUAL REALITY APP
           5.12.2 TSINGHUA UNIVERSITY PARTNERED WITH BARCO TO CREATE VIRTUAL SIMULATION DISASTER EMERGENCY RESPONSE LABORATORY
           5.12.3 NESTLE PURINA ACHIEVED EFFICIENCY AND GAINED PRODUCTIVITY WITH QUEST VR
           5.12.4 TATA STEEL LIMITED PARTNERED WITH STEEL SIM VR AND VARJO TO IMPROVE SAFETY AND REDUCE COSTS ASSOCIATED WITH TRADITIONAL TRAINING METHODS
    5.13 TARIFF AND REGULATORY LANDSCAPE 
           5.13.1 COUNTRY-WISE TARIFFS FOR HS CODE 9504-COMPLIANT PRODUCTS
           5.13.2 REGULATORY BODIES, GOVERNMENT AGENCIES, AND OTHER ORGANIZATIONS
           5.13.3 REGULATORY STANDARDS
    5.14 PORTER’S FIVE FORCES ANALYSIS 
           5.14.1 THREAT OF NEW ENTRANTS
           5.14.2 THREAT OF SUBSTITUTES
           5.14.3 BARGAINING POWER OF SUPPLIERS
           5.14.4 BARGAINING POWER OF BUYERS
           5.14.5 INTENSITY OF COMPETITIVE RIVALRY
    5.15 KEY STAKEHOLDERS AND BUYING CRITERIA 
           5.15.1 KEY STAKEHOLDERS IN BUYING PROCESS
           5.15.2 BUYING CRITERIA
 
6 VIRTUAL REALITY MARKET, BY APPLICATION (Page No. - 84)
    6.1 INTRODUCTION 
    6.2 CONSUMERS 
           6.2.1 INCREASING DEMAND, ADVANCED VIRTUAL REALITY HARDWARE EVOLUTION, AND REDUCED COSTS OF VIRTUAL REALITY DEVICES TO CONTRIBUTE TO MARKET GROWTH
           6.2.2 GAMING & ENTERTAINMENT
           6.2.3 SPORTS
           6.2.4 USE CASES OF VIRTUAL REALITY IN CONSUMER APPLICATIONS
    6.3 COMMERCIAL 
           6.3.1 STREAMLINED LEARNING EXPERIENCES, EFFECTIVE PROMOTIONS, AND IMPACTFUL ADVERTISING TO FUEL DEMAND FOR VR IN RETAIL AND ECOMMERCE SECTORS
           6.3.2 RETAIL & ECOMMERCE
           6.3.3 EDUCATION & TRAINING
           6.3.4 TRAVEL & TOURISM
           6.3.5 ADVERTISING
           6.3.6 USE CASES OF VIRTUAL REALITY IN COMMERCIAL APPLICATIONS
    6.4 ENTERPRISES (MANUFACTURING) 
           6.4.1 NEED FOR HEIGHTENED LEVEL OF IMMERSION AND ENHANCED COMPREHENSION FOR TRAINEES TO FOSTER MARKET GROWTH
           6.4.2 USE CASES OF VIRTUAL REALITY IN ENTERPRISE (MANUFACTURING) APPLICATIONS
    6.5 HEALTHCARE 
           6.5.1 INCREASING ADOPTION OF VIRTUAL REALITY TO ENHANCE SURGICAL PLANNING, TRAINING, AND SKILL DEVELOPMENT TO ACCELERATE MARKET GROWTH
           6.5.2 SURGERY
           6.5.3 PATIENT CARE MANAGEMENT
           6.5.4 FITNESS MANAGEMENT
           6.5.5 PHARMACY MANAGEMENT
           6.5.6 MEDICAL TRAINING & EDUCATION
           6.5.7 USE CASES OF VIRTUAL REALITY IN HEALTHCARE APPLICATIONS
    6.6 AEROSPACE & DEFENSE 
           6.6.1 INTEGRATION OF VIRTUAL REALITY IN COCKPIT DESIGN & TESTING AND VIRTUAL COMBAT TRAINING TO SUPPORT MARKET GROWTH
           6.6.2 USE CASES OF VIRTUAL REALITY IN AEROSPACE & DEFENSE APPLICATIONS
    6.7 OTHER APPLICATIONS 
           6.7.1 AUTOMOTIVE
           6.7.2 REAL ESTATE (ARCHITECTURE & BUILDING DESIGN)
           6.7.3 GEOSPATIAL MINING
           6.7.4 USE CASES OF VIRTUAL REALITY IN OTHER APPLICATIONS
 
7 VIRTUAL REALITY MARKET, BY DEVICE TYPE (Page No. - 108)
    7.1 INTRODUCTION 
    7.2 HEAD-MOUNTED DISPLAYS 
           7.2.1 WIDESPREAD USE OF HEAD-MOUNTED DISPLAY DEVICES IN GAMING AND ENTERTAINMENT APPLICATIONS TO DRIVE MARKET
    7.3 GESTURE-TRACKING DEVICES 
           7.3.1 GESTURE-TRACKING DEVICES TO MONITOR PATIENTS’ MOVEMENTS, PROVIDE REAL-TIME FEEDBACK, AND IMPROVE EFFECTIVENESS OF TREATMENTS
           7.3.2 DATA GLOVES
           7.3.3 OTHER GESTURE-TRACKING DEVICES
    7.4 PROJECTORS & DISPLAY WALLS 
           7.4.1 PROJECTORS AND DISPLAY WALLS TO ENABLE MULTIPLE USERS TO INTERACT WITH VIRTUAL ENVIRONMENTS OR LARGE-SCALE VISUALIZATIONS
 
8 VIRTUAL REALITY MARKET, BY OFFERING (Page No. - 119)
    8.1 INTRODUCTION 
    8.2 HARDWARE 
           8.2.1 VIRTUAL REALITY HARDWARE DEVICES TO CREATE IMMERSIVE AND INTERACTIVE EXPERIENCES IN VARIOUS FIELDS
           8.2.2 SENSORS
                    8.2.2.1 Need to detect and capture motions, velocity, magnetic fields, and presence of objects to fuel demand for sensors
                    8.2.2.2 Accelerometers
                    8.2.2.3 Gyroscopes
                    8.2.2.4 Magnetometers
                    8.2.2.5 Proximity sensors
           8.2.3 SEMICONDUCTOR COMPONENTS
                    8.2.3.1 Significant role of controllers in smartphones and tablets to increase demand for virtual reality devices
                    8.2.3.2 Controllers & processors
                    8.2.3.3 Integrated circuits
           8.2.4 DISPLAY & PROJECTORS
                    8.2.4.1 Display & projectors to shape how users perceive and interact with digital content
           8.2.5 POSITION TRACKERS
                    8.2.5.1 Position trackers to monitor users’ movements accurately and position within virtual or augmented environments
           8.2.6 CAMERAS
                    8.2.6.1 Need to enhance user experience, capture user’s surroundings, and facilitate outside-in tracking to boost demand for cameras
           8.2.7 OTHER COMPONENTS
    8.3 SOFTWARE 
           8.3.1 VIRTUAL REALITY SOFTWARE TO BLEND DIGITAL INFORMATION AND VIRTUAL OBJECTS SEAMLESSLY WITH REAL-WORLD ENVIRONMENT
           8.3.2 SDKS
           8.3.3 CLOUD-BASED SERVICES
 
9 VIRTUAL REALITY MARKET, BY TECHNOLOGY (Page No. - 131)
    9.1 INTRODUCTION 
    9.2 NON-IMMERSIVE TECHNOLOGY 
           9.2.1 GROWING USE OF NON-IMMERSIVE TECHNOLOGY IN DEVELOPING VIRTUAL REALITY SOFTWARE TO DRIVE MARKET
    9.3 SEMI-IMMERSIVE AND FULLY IMMERSIVE TECHNOLOGY 
           9.3.1 NEED FOR HIGH LEVEL OF IMMERSION AND AWARENESS OF PHYSICAL WORLD WHILE GAMING TO PROPEL MARKET
 
10 VIRTUAL REALITY MARKET, BY REGION (Page No. - 134)
     10.1 INTRODUCTION 
     10.2 NORTH AMERICA 
             10.2.1 US
                        10.2.1.1 Presence of industry giants and need for VR to promote marketing campaigns to drive market
             10.2.2 CANADA
                        10.2.2.1 Need to streamline workflow automation, enhance operational efficiency, and deliver interactive information within tourism and hospitality sectors to propel market
             10.2.3 MEXICO
                        10.2.3.1 Advancements in commercial & consumer sectors and utilization of VR in real-life situations to stimulate market expansion
             10.2.4 RECESSION IMPACT ON VIRTUAL REALITY MARKET IN NORTH AMERICA
     10.3 EUROPE 
             10.3.1 GERMANY
                        10.3.1.1 Widespread adoption of emerging technologies in enterprises to fuel demand for VR solutions
             10.3.2 FRANCE
                        10.3.2.1 High digital display adoption, increased spending on VR devices, and focus on online advertising to spur market growth
             10.3.3 UK
                        10.3.3.1 Ongoing investments, presence of major vendors, and predominant focus on content production to foster market growth
             10.3.4 REST OF EUROPE
             10.3.5 RECESSION IMPACT ON VIRTUAL REALITY MARKET IN EUROPE
     10.4 ASIA PACIFIC 
             10.4.1 CHINA
                        10.4.1.1 Emergence of numerous start-ups, focus on exploring emerging technologies, and rising trends of expos and conferences to drive market
             10.4.2 INDIA
                        10.4.2.1 Heightened awareness of advanced technology and extensive R&D to accelerate market growth
             10.4.3 JAPAN
                        10.4.3.1 Growing integration of advanced technologies within healthcare sector to boost demand for VR solutions
             10.4.4 SOUTH KOREA
                        10.4.4.1 Digital transformation within industrial sector to stimulate market growth
             10.4.5 REST OF ASIA PACIFIC
             10.4.6 RECESSION IMPACT ON VIRTUAL REALITY MARKET IN ASIA PACIFIC
     10.5 ROW 
             10.5.1 SOUTH AMERICA
                        10.5.1.1 Expanding consumer market, favorable low-interest rates, and robust commodity pricing to bolster market growth
             10.5.2 MIDDLE EAST & AFRICA
                        10.5.2.1 Rising incorporation of virtual reality into various applications of healthcare industry to propel market
                        10.5.2.2 GCC countries
                                     10.5.2.2.1 Rising government focus on digital transformation and increasing awareness regarding benefits of wearable VR to spur market growth
                        10.5.2.3 Rest of Middle East & Africa
             10.5.3 RECESSION IMPACT ON VIRTUAL REALITY MARKET IN ROW
 
11 COMPETITIVE LANDSCAPE (Page No. - 156)
     11.1 OVERVIEW 
     11.2 KEY PLAYER STRATEGIES/RIGHT TO WIN 
     11.3 MARKET SHARE ANALYSIS 
     11.4 REVENUE ANALYSIS, 2019–2023 
     11.5 COMPANY VALUATION AND FINANCIAL METRICS 
             11.5.1 VIRTUAL REALITY MARKET: FINANCIAL METRICS
     11.6 VIRTUAL REALITY MARKET: BRAND/PRODUCT COMPARISON 
     11.7 COMPANY EVALUATION MATRIX: KEY PLAYERS, 2023 
             11.7.1 STARS
             11.7.2 EMERGING LEADERS
             11.7.3 PERVASIVE PLAYERS
             11.7.4 PARTICIPANTS
             11.7.5 COMPANY FOOTPRINT
                        11.7.5.1 Company footprint
                        11.7.5.2 Technology footprint
                        11.7.5.3 Offering footprint
                        11.7.5.4 Device type footprint
                        11.7.5.5 Application footprint
                        11.7.5.6 Regional footprint
     11.8 COMPANY EVALUATION MATRIX: START-UPS/SMES, 2023 
             11.8.1 PROGRESSIVE COMPANIES
             11.8.2 RESPONSIVE COMPANIES
             11.8.3 DYNAMIC COMPANIES
             11.8.4 STARTING BLOCKS
             11.8.5 COMPETITIVE BENCHMARKING, START-UPS/SMES, 2023
                        11.8.5.1 Detailed list of key start-ups/SMEs
             11.8.6 COMPETITIVE BENCHMARKING OF KEY START-UPS/SMES
     11.9 COMPETITIVE SCENARIOS AND TRENDS 
             11.9.1 PRODUCT LAUNCHES
             11.9.2 DEALS
 
12 COMPANY PROFILES (Page No. - 175)
     12.1 KEY PLAYERS 
             12.1.1 SONY
                        12.1.1.1 Business overview
                        12.1.1.2 Products/Solutions/Services offered
                        12.1.1.3 Recent developments
                                     12.1.1.3.1 Product launches and enhancements
                        12.1.1.4 MnM view
                                     12.1.1.4.1 Key strengths
                                     12.1.1.4.2 Strategic choices made
                                     12.1.1.4.3 Weaknesses and competitive threats
             12.1.2 SAMSUNG ELECTRONICS CO., LTD.
                        12.1.2.1 Business overview
                        12.1.2.2 Products/Solutions/Services offered
                        12.1.2.3 MnM view
                                     12.1.2.3.1 Key strengths
                                     12.1.2.3.2 Strategic choices made
                                     12.1.2.3.3 Weaknesses and competitive threats
             12.1.3 MICROSOFT
                        12.1.3.1 Business overview
                        12.1.3.2 Products/Solutions/Services offered
                        12.1.3.3 Recent developments
                                     12.1.3.3.1 Deals
                        12.1.3.4 MnM view
                                     12.1.3.4.1 Key strengths
                                     12.1.3.4.2 Strategic choices made
                                     12.1.3.4.3 Weaknesses and competitive threats
             12.1.4 META
                        12.1.4.1 Business overview
                        12.1.4.2 Products/Solutions/Services offered
                        12.1.4.3 Recent developments
                                     12.1.4.3.1 Product launches and enhancements
                                     12.1.4.3.2 Deals
                        12.1.4.4 MnM view
                                     12.1.4.4.1 Key strengths
                                     12.1.4.4.2 Strategic choices made
                                     12.1.4.4.3 Weaknesses and competitive threats
             12.1.5 HTC CORPORATION
                        12.1.5.1 Business overview
                        12.1.5.2 Products/Solutions/Services offered
                        12.1.5.3 Recent developments
                                     12.1.5.3.1 Product launches and enhancements
             12.1.6 BARCO
                        12.1.6.1 Business overview
                        12.1.6.2 Products/Solutions/Services offered
                        12.1.6.3 Recent developments
                                     12.1.6.3.1 Deals
             12.1.7 PICO IMMERSIVE PTE.LTD.
                        12.1.7.1 Business overview
                        12.1.7.2 Products/Solutions/Services offered
                        12.1.7.3 Recent developments
                                     12.1.7.3.1 Product launches and enhancements
             12.1.8 CYBERGLOVE SYSTEMS INC.
                        12.1.8.1 Business overview
                        12.1.8.2 Products/Solutions/Services offered
             12.1.9 UNITY TECHNOLOGIES
                        12.1.9.1 Business overview
                        12.1.9.2 Products/Solutions/Services offered
             12.1.10 PENUMBRA, INC.
                        12.1.10.1 Business overview
                        12.1.10.2 Products/Solutions/Services offered
                        12.1.10.3 Recent developments
                                     12.1.10.3.1 Product launches and enhancements
                                     12.1.10.3.2 Deals
             12.1.11 DPVR
                        12.1.11.1 Business overview
                        12.1.11.2 Products/Solutions/Services offered
                        12.1.11.3 Recent developments
                                     12.1.11.3.1 Product launches and enhancements
                                     12.1.11.3.2 Deals
     12.2 OTHER PLAYERS 
             12.2.1 ULTRALEAP
             12.2.2 FOVE INC
             12.2.3 QUYTECH
             12.2.4 HQSOFTWARE
             12.2.5 INNOWISE
             12.2.6 XRHEALTH IL LTD.
             12.2.7 VECTION TECHNOLOGIES
             12.2.8 MINDMAZE
             12.2.9 FIRSTHAND TECHNOLOGY
             12.2.10 WORLDVIZ, INC.
             12.2.11 VIRTUIX
             12.2.12 VIGHNESH INC.
             12.2.13 MERGE LABS, INC.
             12.2.14 SPACEVR
 
13 APPENDIX (Page No. - 217)
     13.1 INSIGHTS FROM INDUSTRY EXPERTS 
     13.2 DISCUSSION GUIDE 
     13.3 KNOWLEDGESTORE: MARKETSANDMARKETS’ SUBSCRIPTION PORTAL 
     13.4 CUSTOMIZATION OPTIONS 
     13.5 RELATED REPORTS 
     13.6 AUTHOR DETAILS 
 
LIST OF TABLES (171 TABLES)
 
TABLE 1 VIRTUAL REALITY MARKET: GROWTH ASSUMPTIONS
TABLE 2 VIRTUAL REALITY MARKET: RESEARCH ASSUMPTIONS
TABLE 3 VIRTUAL REALITY MARKET: RISK ASSESSMENT
TABLE 4 VIRTUAL REALITY MARKET: PARAMETERS CONSIDERED TO ANALYZE RECESSION IMPACT
TABLE 5 AVERAGE SELLING PRICE TREND, BY DEVICE TYPE, 2018–2023 (USD)
TABLE 6 AVERAGE SELLING PRICE TREND, BY REGION, 2019–2023 (USD)
TABLE 7 VIRTUAL REALITY MARKET: ECOSYSTEM
TABLE 8 INNOVATIONS AND PATENT REGISTRATIONS, 2022–2023
TABLE 9 IMPORT SCENARIO FOR HS CODE 9504-COMPLIANT PRODUCTS, BY COUNTRY, 2019–2023 (USD MILLION)
TABLE 10 EXPORT SCENARIO FOR HS CODE 9504-COMPLIANT PRODUCTS, BY COUNTRY, 2019–2023 (USD MILLION)
TABLE 11 KEY CONFERENCES AND EVENTS, 2024–2025
TABLE 12 MOST-FAVORED NATION TARIFF FOR HS CODE 9504-COMPLIANT PRODUCTS EXPORTED BY UNITED STATES, 2023
TABLE 13 NORTH AMERICA: REGULATORY BODIES, GOVERNMENT AGENCIES, AND OTHER ORGANIZATIONS
TABLE 14 EUROPE: REGULATORY BODIES, GOVERNMENT AGENCIES, AND OTHER ORGANIZATIONS
TABLE 15 ASIA PACIFIC: REGULATORY BODIES, GOVERNMENT AGENCIES, AND OTHER ORGANIZATIONS
TABLE 16 REST OF THE WORLD: REGULATORY BODIES, GOVERNMENT AGENCIES, AND OTHER ORGANIZATIONS
TABLE 17 PORTER’S FIVE FORCES’ IMPACT ON VIRTUAL REALITY MARKET
TABLE 18 INFLUENCE OF STAKEHOLDERS ON BUYING PROCESS, BY OFFERING (%)
TABLE 19 KEY BUYING CRITERIA, BY APPLICATION
TABLE 20 VIRTUAL REALITY MARKET, BY APPLICATION, 2020–2023 (USD MILLION)
TABLE 21 VIRTUAL REALITY MARKET, BY APPLICATION, 2024–2029 (USD MILLION)
TABLE 22 CONSUMERS: VIRTUAL REALITY MARKET, BY REGION, 2020–2023 (USD MILLION)
TABLE 23 CONSUMERS: VIRTUAL REALITY MARKET, BY REGION, 2024–2029 (USD MILLION)
TABLE 24 CONSUMERS: VIRTUAL REALITY MARKET, BY DEVICE TYPE, 2020–2023 (USD MILLION)
TABLE 25 CONSUMERS: VIRTUAL REALITY MARKET, BY DEVICE TYPE, 2024–2029 (USD MILLION)
TABLE 26 CONSUMERS: VIRTUAL REALITY MARKET, BY OFFERING, 2020–2023 (USD MILLION)
TABLE 27 CONSUMERS: VIRTUAL REALITY MARKET, BY OFFERING, 2024–2029 (USD MILLION)
TABLE 28 CONSUMERS: VIRTUAL REALITY MARKET, BY TECHNOLOGY, 2020–2023 (USD MILLION)
TABLE 29 CONSUMERS: VIRTUAL REALITY MARKET, BY TECHNOLOGY, 2024–2029 (USD MILLION)
TABLE 30 COMMERCIAL: VIRTUAL REALITY MARKET, BY REGION, 2020–2023 (USD MILLION)
TABLE 31 COMMERCIAL: VIRTUAL REALITY MARKET, BY REGION, 2024–2029 (USD MILLION)
TABLE 32 COMMERCIAL: VIRTUAL REALITY MARKET, BY DEVICE TYPE, 2020–2023 (USD MILLION)
TABLE 33 COMMERCIAL: VIRTUAL REALITY MARKET, BY DEVICE TYPE, 2024–2029 (USD MILLION)
TABLE 34 COMMERCIAL: VIRTUAL REALITY MARKET, BY OFFERING, 2020–2023 (USD MILLION)
TABLE 35 COMMERCIAL: VIRTUAL REALITY MARKET, BY OFFERING, 2024–2029 (USD MILLION)
TABLE 36 COMMERCIAL: VIRTUAL REALITY MARKET, BY TECHNOLOGY, 2020–2023 (USD MILLION)
TABLE 37 COMMERCIAL: VIRTUAL REALITY MARKET, BY TECHNOLOGY, 2024–2029 (USD MILLION)
TABLE 38 ENTERPRISES: VIRTUAL REALITY MARKET, BY REGION, 2020–2023 (USD MILLION)
TABLE 39 ENTERPRISES: VIRTUAL REALITY MARKET, BY REGION, 2024–2029 (USD MILLION)
TABLE 40 ENTERPRISES: VIRTUAL REALITY MARKET, BY DEVICE TYPE, 2020–2023 (USD MILLION)
TABLE 41 ENTERPRISES: VIRTUAL REALITY MARKET, BY DEVICE TYPE, 2024–2029 (USD MILLION)
TABLE 42 ENTERPRISES: VIRTUAL REALITY MARKET, BY OFFERING, 2020–2023 (USD MILLION)
TABLE 43 ENTERPRISES: VIRTUAL REALITY MARKET, BY OFFERING, 2024–2029 (USD MILLION)
TABLE 44 ENTERPRISES: VIRTUAL REALITY MARKET, BY TECHNOLOGY, 2020–2023 (USD MILLION)
TABLE 45 ENTERPRISES: VIRTUAL REALITY MARKET, BY TECHNOLOGY, 2024–2029 (USD MILLION)
TABLE 46 HEALTHCARE: VIRTUAL REALITY MARKET, BY REGION, 2020–2023 (USD MILLION)
TABLE 47 HEALTHCARE: VIRTUAL REALITY MARKET, BY REGION, 2024–2029 (USD MILLION)
TABLE 48 HEALTHCARE: VIRTUAL REALITY MARKET, BY DEVICE TYPE, 2020–2023 (USD MILLION)
TABLE 49 HEALTHCARE: VIRTUAL REALITY MARKET, BY DEVICE TYPE, 2024–2029 (USD MILLION)
TABLE 50 HEALTHCARE: VIRTUAL REALITY MARKET, BY OFFERING, 2020–2023 (USD MILLION)
TABLE 51 HEALTHCARE VIRTUAL REALITY MARKET, BY OFFERING, 2024–2029 (USD MILLION)
TABLE 52 HEALTHCARE: VIRTUAL REALITY MARKET, BY TECHNOLOGY, 2020–2023 (USD MILLION)
TABLE 53 HEALTHCARE: VIRTUAL REALITY MARKET, BY TECHNOLOGY, 2024–2029 (USD MILLION)
TABLE 54 AEROSPACE & DEFENSE: VIRTUAL REALITY MARKET, BY REGION, 2020–2023 (USD MILLION)
TABLE 55 AEROSPACE & DEFENSE: VIRTUAL REALITY MARKET, BY REGION, 2024–2029 (USD MILLION)
TABLE 56 AEROSPACE & DEFENSE: VIRTUAL REALITY MARKET, BY DEVICE TYPE, 2020–2023 (USD MILLION)
TABLE 57 AEROSPACE & DEFENSE: VIRTUAL REALITY MARKET, BY DEVICE TYPE, 2024–2029 (USD MILLION)
TABLE 58 AEROSPACE & DEFENSE: VIRTUAL REALITY MARKET, BY OFFERING, 2020–2023 (USD MILLION)
TABLE 59 AEROSPACE & DEFENSE: VIRTUAL REALITY MARKET, BY OFFERING, 2024–2029 (USD MILLION)
TABLE 60 AEROSPACE & DEFENSE: VIRTUAL REALITY MARKET, BY TECHNOLOGY, 2020–2023 (USD MILLION)
TABLE 61 AEROSPACE & DEFENSE: VIRTUAL REALITY MARKET, BY TECHNOLOGY, 2024–2029 (USD MILLION)
TABLE 62 OTHER APPLICATIONS: VIRTUAL REALITY MARKET, BY REGION, 2020–2023 (USD MILLION)
TABLE 63 OTHER APPLICATIONS: VIRTUAL REALITY MARKET, BY REGION, 2024–2029 (USD MILLION)
TABLE 64 OTHER APPLICATIONS: VIRTUAL REALITY MARKET, BY DEVICE TYPE, 2020–2023 (USD MILLION)
TABLE 65 OTHER APPLICATIONS: VIRTUAL REALITY MARKET, BY DEVICE TYPE, 2024–2029 (USD MILLION)
TABLE 66 OTHER APPLICATIONS: VIRTUAL REALITY MARKET, BY OFFERING, 2020–2023 (USD MILLION)
TABLE 67 OTHER APPLICATIONS: VIRTUAL REALITY MARKET, BY OFFERING, 2024–2029 (USD MILLION)
TABLE 68 OTHER APPLICATIONS: VIRTUAL REALITY MARKET, BY TECHNOLOGY, 2020–2023 (USD MILLION)
TABLE 69 OTHER APPLICATIONS: VIRTUAL REALITY MARKET, BY TECHNOLOGY, 2024–2029 (USD MILLION)
TABLE 70 VIRTUAL REALITY MARKET, BY DEVICE TYPE, 2020–2023 (USD MILLION)
TABLE 71 VIRTUAL REALITY MARKET, BY DEVICE TYPE, 2024–2029 (USD MILLION)
TABLE 72 VIRTUAL REALITY MARKET, BY DEVICE TYPE, 2020–2023 (THOUSAND UNITS)
TABLE 73 VIRTUAL REALITY MARKET, BY DEVICE TYPE, 2024–2029 (THOUSAND UNITS)
TABLE 74 HEAD-MOUNTED DISPLAYS: VIRTUAL REALITY MARKET, BY COMPONENT, 2020–2023 (USD MILLION)
TABLE 75 HEAD-MOUNTED DISPLAYS: VIRTUAL REALITY MARKET, BY COMPONENT, 2024–2029 (USD MILLION)
TABLE 76 HEAD-MOUNTED DISPLAYS: VIRTUAL REALITY MARKET, BY APPLICATION, 2020–2023 (USD MILLION)
TABLE 77 HEAD-MOUNTED DISPLAYS: VIRTUAL REALITY MARKET, BY APPLICATION, 2024–2029 (USD MILLION)
TABLE 78 GESTURE-TRACKING DEVICES: VIRTUAL REALITY MARKET, BY COMPONENT, 2020–2023 (USD MILLION)
TABLE 79 GESTURE-TRACKING DEVICES: VIRTUAL REALITY MARKET, BY COMPONENT, 2024–2029 (USD MILLION)
TABLE 80 GESTURE-TRACKING DEVICES: VIRTUAL REALITY MARKET, BY APPLICATION, 2020–2023 (USD MILLION)
TABLE 81 GESTURE-TRACKING DEVICES: VIRTUAL REALITY MARKET, BY APPLICATION, 2024–2029 (USD MILLION)
TABLE 82 PROJECTORS & DISPLAY WALLS: VIRTUAL REALITY MARKET, BY COMPONENT, 2020–2023 (USD MILLION)
TABLE 83 PROJECTORS & DISPLAY WALLS: VIRTUAL REALITY MARKET, BY COMPONENT, 2024–2029 (USD MILLION)
TABLE 84 PROJECTORS & DISPLAY WALLS: VIRTUAL REALITY MARKET, BY APPLICATION, 2020–2023 (USD MILLION)
TABLE 85 PROJECTORS & DISPLAY WALLS: VIRTUAL REALITY MARKET, BY APPLICATION, 2024–2029 (USD MILLION)
TABLE 86 VIRTUAL REALITY MARKET, BY OFFERING, 2020–2023 (USD MILLION)
TABLE 87 VIRTUAL REALITY MARKET, BY OFFERING, 2024–2029 (USD MILLION)
TABLE 88 HARDWARE: VIRTUAL REALITY MARKET, BY COMPONENT, 2020–2023 (USD MILLION)
TABLE 89 HARDWARE: VIRTUAL REALITY MARKET, BY COMPONENT, 2024–2029 (USD MILLION)
TABLE 90 SENSORS: VIRTUAL REALITY MARKET, BY DEVICE TYPE, 2020–2023 (USD MILLION)
TABLE 91 SENSORS: VIRTUAL REALITY MARKET, BY DEVICE TYPE, 2024–2029 (USD MILLION)
TABLE 92 SEMICONDUCTOR COMPONENTS: VIRTUAL REALITY MARKET, BY DEVICE TYPE, 2020–2023 (USD MILLION)
TABLE 93 SEMICONDUCTOR COMPONENTS: VIRTUAL REALITY MARKET, BY DEVICE TYPE, 2024–2029 (USD MILLION)
TABLE 94 DISPLAY & PROJECTORS: VIRTUAL REALITY MARKET, BY DEVICE TYPE, 2020–2023 (USD MILLION)
TABLE 95 DISPLAY & PROJECTORS: VIRTUAL REALITY MARKET, BY DEVICE TYPE, 2024–2029 (USD MILLION)
TABLE 96 POSITION TRACKERS: VIRTUAL REALITY MARKET, BY DEVICE TYPE, 2020–2023 (USD MILLION)
TABLE 97 POSITION TRACKERS: VIRTUAL REALITY MARKET, BY DEVICE TYPE, 2024–2029 (USD MILLION)
TABLE 98 CAMERAS: VIRTUAL REALITY MARKET, BY DEVICE TYPE, 2020–2023 (USD MILLION)
TABLE 99 CAMERAS: VIRTUAL REALITY MARKET, BY DEVICE TYPE, 2024–2029 (USD MILLION)
TABLE 100 OTHER COMPONENTS: VIRTUAL REALITY MARKET, BY DEVICE TYPE, 2020–2023 (USD MILLION)
TABLE 101 OTHER COMPONENTS: VIRTUAL REALITY MARKET, BY DEVICE TYPE, 2024–2029 (USD MILLION)
TABLE 102 HARDWARE: VIRTUAL REALITY MARKET, BY APPLICATION, 2020–2023 (USD MILLION)
TABLE 103 HARDWARE: VIRTUAL REALITY MARKET, BY APPLICATION, 2024–2029 (USD MILLION)
TABLE 104 SOFTWARE: VIRTUAL REALITY MARKET, BY APPLICATION, 2020–2023 (USD MILLION)
TABLE 105 SOFTWARE: VIRTUAL REALITY MARKET, BY APPLICATION, 2024–2029 (USD MILLION)
TABLE 106 VIRTUAL REALITY MARKET, BY TECHNOLOGY, 2020–2023 (USD MILLION)
TABLE 107 VIRTUAL REALITY MARKET, BY TECHNOLOGY, 2024–2029 (USD MILLION)
TABLE 108 VIRTUAL REALITY MARKET, BY REGION, 2020–2023 (USD MILLION)
TABLE 109 VIRTUAL REALITY MARKET, BY REGION, 2024–2029 (USD MILLION)
TABLE 110 NORTH AMERICA: VIRTUAL REALITY MARKET, BY COUNTRY, 2020–2023 (USD MILLION)
TABLE 111 NORTH AMERICA: VIRTUAL REALITY MARKET, BY COUNTRY, 2024–2029 (USD MILLION)
TABLE 112 NORTH AMERICA: VIRTUAL REALITY MARKET, BY APPLICATION, 2020–2023 (USD MILLION)
TABLE 113 NORTH AMERICA: VIRTUAL REALITY MARKET, BY APPLICATION, 2024–2029 (USD MILLION)
TABLE 114 EUROPE: VIRTUAL REALITY MARKET, BY COUNTRY, 2020–2023 (USD MILLION)
TABLE 115 EUROPE: VIRTUAL REALITY MARKET, BY COUNTRY, 2024–2029 (USD MILLION)
TABLE 116 EUROPE: VIRTUAL REALITY MARKET, BY APPLICATION, 2020–2023 (USD MILLION)
TABLE 117 EUROPE: VIRTUAL REALITY MARKET, BY APPLICATION, 2024–2029 (USD MILLION)
TABLE 118 ASIA PACIFIC: VIRTUAL REALITY MARKET, BY COUNTRY, 2020–2023 (USD MILLION)
TABLE 119 ASIA PACIFIC: VIRTUAL REALITY MARKET, BY COUNTRY, 2024–2029 (USD MILLION)
TABLE 120 ASIA PACIFIC: VIRTUAL REALITY MARKET, BY APPLICATION, 2020–2023 (USD MILLION)
TABLE 121 ASIA PACIFIC: VIRTUAL REALITY MARKET, BY APPLICATION, 2024–2029 (USD MILLION)
TABLE 122 ROW: VIRTUAL REALITY MARKET, BY SUBREGION, 2020–2023 (USD MILLION)
TABLE 123 ROW: VIRTUAL REALITY MARKET, BY SUBREGION, 2024–2029 (USD MILLION)
TABLE 124 ROW: VIRTUAL REALITY MARKET, BY APPLICATION, 2020–2023 (USD MILLION)
TABLE 125 ROW: VIRTUAL REALITY MARKET, BY APPLICATION, 2024–2029 (USD MILLION)
TABLE 126 MIDDLE EAST & AFRICA: VIRTUAL REALITY MARKET, BY COUNTRY, 2020–2023 (USD MILLION)
TABLE 127 MIDDLE EAST & AFRICA: VIRTUAL REALITY MARKET, BY REGION, 2024–2029 (USD MILLION)
TABLE 128 OVERVIEW OF STRATEGIES ADOPTED BY KEY PLAYERS
TABLE 129 VIRTUAL REALITY MARKET: DEGREE OF COMPETITION, 2023
TABLE 130 VIRTUAL REALITY MARKET: TECHNOLOGY FOOTPRINT
TABLE 131 VIRTUAL REALITY MARKET: OFFERING FOOTPRINT
TABLE 132 VIRTUAL REALITY MARKET: DEVICE TYPE FOOTPRINT
TABLE 133 VIRTUAL REALITY MARKET: APPLICATION FOOTPRINT
TABLE 134 VIRTUAL REALITY MARKET: REGIONAL FOOTPRINT
TABLE 135 VIRTUAL REALITY MARKET: LIST OF KEY START-UPS/SMES
TABLE 136 VIRTUAL REALITY MARKET: COMPETITIVE BENCHMARKING OF KEY START-UPS/SMES
TABLE 137 VIRTUAL REALITY MARKET: PRODUCT LAUNCHES, 2020–2023
TABLE 138 VIRTUAL REALITY MARKET: DEALS, 2020–2023
TABLE 139 SONY: BUSINESS OVERVIEW
TABLE 140 SONY: PRODUCTS/SOLUTIONS/SERVICES OFFERED
TABLE 141 SONY: PRODUCT LAUNCHES AND ENHANCEMENTS
TABLE 142 SAMSUNG ELECTRONICS CO., LTD.: BUSINESS OVERVIEW
TABLE 143 SAMSUNG ELECTRONICS CO., LTD.: PRODUCTS/SOLUTIONS/SERVICES OFFERED
TABLE 144 MICROSOFT: BUSINESS OVERVIEW
TABLE 145 MICROSOFT: PRODUCTS/SOLUTIONS/SERVICES OFFERED
TABLE 146 MICROSOFT: DEALS
TABLE 147 META: BUSINESS OVERVIEW
TABLE 148 META: PRODUCTS/SOLUTIONS/SERVICES OFFERED
TABLE 149 META: PRODUCT LAUNCHES AND ENHANCEMENTS
TABLE 150 META: DEALS
TABLE 151 HTC CORPORATION: BUSINESS OVERVIEW
TABLE 152 HTC CORPORATION: PRODUCTS/SOLUTIONS/SERVICES OFFERED
TABLE 153 HTC CORPORATION: PRODUCT LAUNCHES AND ENHANCEMENTS
TABLE 154 BARCO: BUSINESS OVERVIEW
TABLE 155 BARCO: PRODUCTS/SOLUTIONS/SERVICES OFFERED
TABLE 156 BARCO: DEALS
TABLE 157 PICO IMMERSIVE PTE. LTD.: BUSINESS OVERVIEW
TABLE 158 PICO IMMERSIVE PTE.LTD.: PRODUCTS/SOLUTIONS/SERVICES OFFERED
TABLE 159 PICO IMMERSIVE PTE.LTD.: PRODUCT LAUNCHES AND ENHANCEMENTS
TABLE 160 CYBERGLOVE SYSTEMS INC.: BUSINESS OVERVIEW
TABLE 161 CYBERGLOVE SYSTEMS INC.: PRODUCTS/SOLUTIONS/SERVICES OFFERED
TABLE 162 UNITY TECHNOLOGIES: BUSINESS OVERVIEW
TABLE 163 UNITY TECHNOLOGIES: PRODUCTS/SOLUTIONS/SERVICES OFFERED
TABLE 164 PENUMBRA, INC.: BUSINESS OVERVIEW
TABLE 165 PENUMBRA, INC.: PRODUCTS/SOLUTIONS/SERVICES OFFERED
TABLE 166 PENUMBRA, INC.: PRODUCT LAUNCHES AND ENHANCEMENTS
TABLE 167 PENUMBRA, INC.: DEALS
TABLE 168 DPVR: BUSINESS OVERVIEW
TABLE 169 DPVR: PRODUCTS/SOLUTIONS/SERVICES OFFERED
TABLE 170 DPVR: PRODUCT LAUNCHES AND ENHANCEMENTS
TABLE 171 DPVR: DEALS
 
 
LIST OF FIGURES (67 FIGURES)
 
FIGURE 1 MARKET SEGMENTATION
FIGURE 2 VIRTUAL REALITY MARKET: RESEARCH DESIGN
FIGURE 3 VIRTUAL REALITY MARKET: RESEARCH APPROACH
FIGURE 4 REVENUE GENERATED FROM SALES OF VIRTUAL REALITY SOLUTIONS
FIGURE 5 VIRTUAL REALITY MARKET: REVENUE ANALYSIS OF SONY
FIGURE 6 VIRTUAL REALITY MARKET: SUPPLY-SIDE ANALYSIS
FIGURE 7 VIRTUAL REALITY MARKET: BOTTOM-UP APPROACH
FIGURE 8 VIRTUAL REALITY MARKET: TOP-DOWN APPROACH
FIGURE 9 VIRTUAL REALITY MARKET: DATA TRIANGULATION
FIGURE 10 VIRTUAL REALITY MARKET, 2020–2029 (USD MILLION)
FIGURE 11 HARDWARE SEGMENT TO WITNESS HIGHER CAGR DURING FORECAST PERIOD
FIGURE 12 GESTURE-TRACKING DEVICES SEGMENT TO RECORD HIGHEST CAGR DURING FORECAST PERIOD
FIGURE 13 HEALTHCARE SEGMENT TO RECORD HIGHEST CAGR DURING FORECAST PERIOD
FIGURE 14 ASIA PACIFIC TO RECORD HIGHEST CAGR DURING FORECAST PERIOD
FIGURE 15 CONTINUOUS TECHNOLOGICAL ADVANCEMENTS IN VARIOUS SECTORS AND GROWING PENETRATION OF METAVERSE TO DRIVE MARKET
FIGURE 16 DISPLAY & PROJECTORS SEGMENT TO RECORD HIGHEST CAGR DURING FORECAST PERIOD
FIGURE 17 HEALTHCARE SEGMENT TO REGISTER HIGHEST CAGR DURING FORECAST PERIOD
FIGURE 18 COMMERCIAL SEGMENT TO RECORD HIGHEST CAGR DURING FORECAST PERIOD
FIGURE 19 GESTURE-TRACKING DEVICES SEGMENT TO WITNESS HIGHEST CAGR DURING FORECAST PERIOD
FIGURE 20 ASIA PACIFIC TO HOLD LARGEST MARKET SHARE IN 2029
FIGURE 21 CHINA TO RECORD HIGHEST CAGR DURING FORECAST PERIOD
FIGURE 22 VIRTUAL REALITY MARKET: DRIVERS, RESTRAINTS, OPPORTUNITIES, AND CHALLENGES
FIGURE 23 VIRTUAL REALITY MARKET: IMPACT OF DRIVERS
FIGURE 24 VIRTUAL REALITY MARKET: IMPACT OF RESTRAINTS
FIGURE 25 VIRTUAL REALITY MARKET: IMPACT OF OPPORTUNITIES
FIGURE 26 VIRTUAL REALITY MARKET: IMPACT OF CHALLENGES
FIGURE 27 TRENDS/DISRUPTIONS IMPACTING CUSTOMERS’ BUSINESSES
FIGURE 28 AVERAGE SELLING PRICE TREND FOR TOP PLAYERS, BY HEAD-MOUNTED DISPLAY
FIGURE 29 VIRTUAL REALITY MARKET: VALUE CHAIN ANALYSIS
FIGURE 30 KEY PLAYERS IN VIRTUAL REALITY MARKET ECOSYSTEM
FIGURE 31 INVESTMENT AND FUNDING SCENARIO
FIGURE 32 LIST OF MAJOR PATENTS FOR VIRTUAL REALITY, 2013–2023
FIGURE 33 REGIONAL ANALYSIS OF PATENTS, 2013–2023
FIGURE 34 IMPORT DATA FOR HS CODE 9504-COMPLIANT PRODUCTS, BY COUNTRY, 2019–2023 (USD MILLION)
FIGURE 35 EXPORT DATA FOR HS CODE 9504-COMPLIANT PRODUCTS, BY COUNTRY, 2019–2023 (USD MILLION)
FIGURE 36 PORTER’S FIVE FORCES’ ANALYSIS: VIRTUAL REALITY MARKET
FIGURE 37 INFLUENCE OF STAKEHOLDERS ON BUYING PROCESS, BY OFFERING
FIGURE 38 KEY BUYING CRITERIA, BY APPLICATION
FIGURE 39 CONSUMERS SEGMENT TO ACCOUNT FOR LARGEST MARKET DURING FORECAST PERIOD
FIGURE 40 HEAD-MOUNTED DISPLAYS SEGMENT FOR CONSUMERS TO ACCOUNT FOR LARGEST MARKET DURING FORECAST PERIOD
FIGURE 41 HEAD-MOUNTED DISPLAYS SEGMENT TO HOLD LARGEST MARKET DURING FORECAST PERIOD
FIGURE 42 DISPLAY & PROJECTORS SEGMENT FOR HEAD-MOUNTED DISPLAYS TO GROW AT HIGHEST CAGR DURING FORECAST PERIOD
FIGURE 43 DISPLAY & PROJECTORS SEGMENT FOR GESTURE-TRACKING DEVICES TO GROW AT HIGHEST CAGR DURING FORECAST PERIOD
FIGURE 44 DISPLAY & PROJECTORS SEGMENT FOR PROJECTORS & DISPLAY WALLS TO GROW AT HIGHEST CAGR DURING FORECAST PERIOD
FIGURE 45 SOFTWARE SEGMENT TO CAPTURE LARGER MARKET DURING FORECAST PERIOD
FIGURE 46 DISPLAY & PROJECTORS FOR HARDWARE SEGMENT TO CAPTURE LARGEST MARKET DURING FORECAST PERIOD
FIGURE 47 SEMI & FULLY IMMERSIVE SEGMENT TO CAPTURE LARGER MARKET DURING FORECAST PERIOD
FIGURE 48 NORTH AMERICA ACCOUNTED FOR LARGEST MARKET IN 2023
FIGURE 49 NORTH AMERICA: VIRTUAL REALITY MARKET SNAPSHOT
FIGURE 50 EUROPE: VIRTUAL REALITY MARKET SNAPSHOT
FIGURE 51 ASIA PACIFIC: VIRTUAL REALITY MARKET SNAPSHOT
FIGURE 52 VIRTUAL REALITY MARKET SHARE ANALYSIS, 2023
FIGURE 53 VIRTUAL REALITY MARKET: REVENUE ANALYSIS OF TOP PLAYERS, 2019–2023
FIGURE 54 COMPANY VALUATION AND FINANCIAL METRICS: VIRTUAL REALITY MARKET
FIGURE 55 FINANCIAL METRICS (EV/EBITDA), 2023
FIGURE 56 BRAND COMPARISON
FIGURE 57 VIRTUAL REALITY MARKET: COMPANY EVALUATION MATRIX FOR KEY PLAYERS, 2023
FIGURE 58 VIRTUAL REALITY MARKET: OVERALL COMPANY FOOTPRINT
FIGURE 59 VIRTUAL REALITY MARKET: COMPANY EVALUATION MATRIX FOR START-UPS/SMES, 2023
FIGURE 60 SONY: COMPANY SNAPSHOT
FIGURE 61 SAMSUNG ELECTRONICS CO., LTD.: COMPANY SNAPSHOT
FIGURE 62 MICROSOFT: COMPANY SNAPSHOT
FIGURE 63 META: COMPANY SNAPSHOT
FIGURE 64 HTC CORPORATION: COMPANY SNAPSHOT
FIGURE 65 BARCO: COMPANY SNAPSHOT
FIGURE 66 UNITY TECHNOLOGIES: COMPANY SNAPSHOT
FIGURE 67 PENUMBRA, INC.: COMPANY SNAPSHOT


The study involved four major activities in estimating the size of the virtual reality market. Exhaustive secondary research has been carried out to collect information on the market, the peer markets, and the parent market. Both top-down and bottom-up approaches have been employed to estimate the total market size. Market breakdown and data triangulation methods have also been used to estimate the market for segments and subsegments.

Secondary Research

Revenues of companies offering virtual reality systems have been obtained from the secondary data available through paid and unpaid sources. The revenues have also been derived by analyzing the product portfolio of key companies, and these companies have been rated according to the performance and quality of their products.

In the secondary research process, various sources have been referred to for identifying and collecting information for this study on the virtual reality market. Secondary sources considered for this research study include government sources, corporate filings, and trade, business, and professional associations. Secondary data has been collected and analyzed to arrive at the overall market size, which has been further validated through primary research.    

Secondary research has been mainly used to obtain key information about the supply chain of virtual reality systems to identify key players based on their products and prevailing industry trends in the virtual reality market by technology, type, product type, end-user industry, and region. Secondary research also helped obtain market information- and technology-oriented key developments undertaken by market players to expand their presence and increase their market share.  

Primary Research

Extensive primary research has been conducted after understanding and analyzing the current scenario of the virtual reality market through secondary research. Several primary interviews have been conducted with the key opinion leaders from the demand and supply sides across four main regions—North America, Europe, Asia Pacific, and the Rest of Europe. Approximately 25% of the primary interviews were conducted with the demand-side respondents, while approximately 75% were conducted with the supply-side respondents. The primary data has been collected through questionnaires, emails, and telephone interviews.

After interacting with industry experts, brief sessions were conducted with highly experienced independent consultants to reinforce the findings from our primary. This, along with the in-house subject matter experts’ opinions, has led us to the findings as described in the remainder of this report. The breakdown of primary respondents is as follows:

Virtual Reality Market
 Size, and Share

To know about the assumptions considered for the study, download the pdf brochure

Market Size Estimation

The bottom-up procedure has been employed to arrive at the overall size of the virtual reality market.

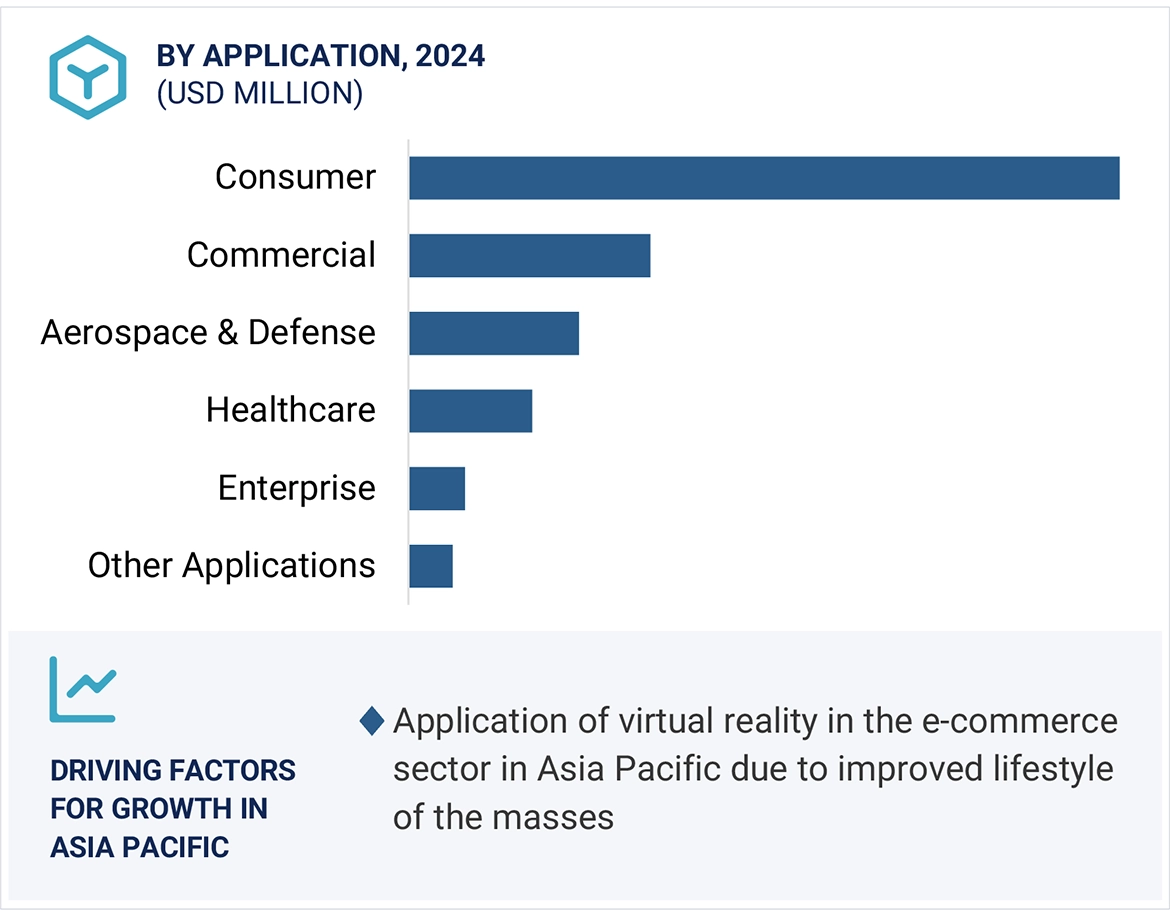
  • Identifying application wherein virtual reality systems are deployed or are expected to use
  • Analyzing major providers of virtual reality equipment’s and original equipment manufacturers (OEMs), as well as studying their portfolios and understanding different technologies used
  • Analyzing the average selling price of virtual reality systems powered by different technologies
  • Arriving at the market estimates by analyzing the revenue of companies and then combining these figures to arrive at the market size
  • Studying various paid and unpaid sources, such as annual reports, press releases, white papers, and databases, to gather the required information
  • Tracking the ongoing developments and identifying the upcoming developments in the market that include investments, research and development activities, product launches, contracts, collaborations, and partnerships undertaken, and forecasting the market size based on these developments
  • Carrying out multiple discussions with key opinion leaders to understand the types of virtual reality products, services, and software designed and developed, thereby analyzing the break-up of the scope of work carried out by the major companies in the virtual reality market
  • Arriving at the market estimates by analyzing the revenue generated by key companies providing virtual reality products on the basis of their locations (countries) and then combining the market size for each country to get the market estimate by region
  • Verifying and crosschecking the estimates at every level by discussing with key opinion leaders, including CXOs, directors, and operation managers, and then finally with the domain experts at MarketsandMarkets
  • Studying various paid and unpaid sources of information, such as annual reports, press releases, white papers, and databases

Virtual Reality Market
 Size, and Bottom-up Approach

The top-down approach has been used to estimate and validate the total size of the virtual reality market.

  • Focusing on top-line investments and expenditures being made in the ecosystems of various applications
  • Calculating the market size, considering revenues from major players through the cost of virtual reality systems
  • Segmenting each application of the virtual reality system in each region and deriving the global market size based on the region
  • Acquiring and analyzing information related to revenues generated by players through their crucial product offerings
  • Conducting multiple on-field discussions with key opinion leaders involved in developing various virtual reality solutions
  • Estimating geographical splits by using secondary sources on the basis of various factors, such as the number of players in a specific country and region, types of virtual reality products/solutions, and levels of services offered across several application

Virtual Reality Market
 Size, and Top-Down Approach

Data Triangulation

After arriving at the overall market size-using the market size estimation processes as explained above-the market has been split into several segments and subsegments. To complete the entire market engineering process and arrive at the exact statistics of each market segment and subsegment, data triangulation and market breakdown procedures have been employed, wherever applicable. The data has been triangulated by studying various factors and trends from the demand and supply sides in the virtual reality market.

Market Definition

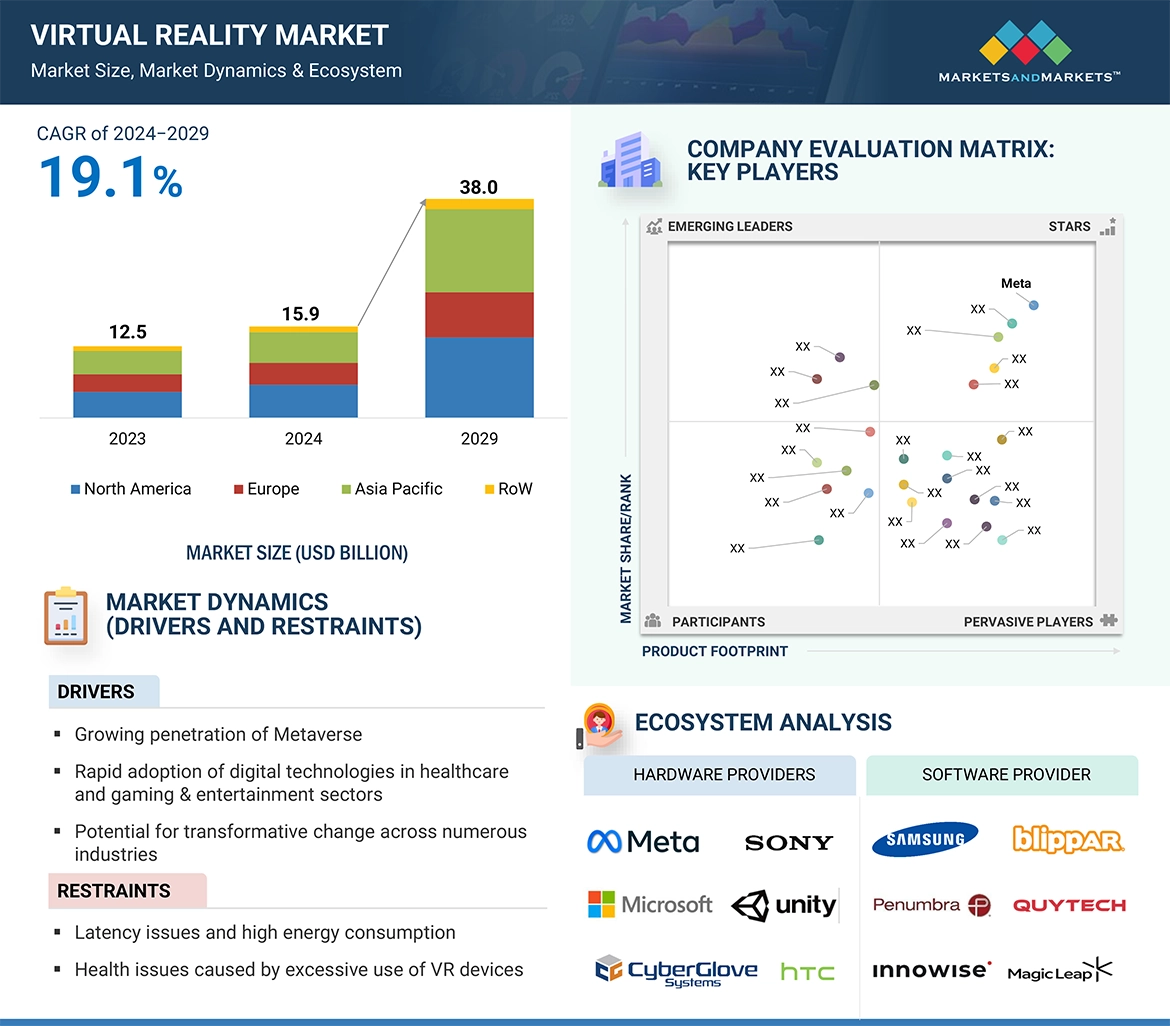
Virtual Reality (VR) is a simulated experience that employs 3D near-eye displays and pose tracking to give the user an immersive feel of a virtual world. It creates simulated environments that can be similar to or entirely different from the real world, with applications in entertainment, education, healthcare, and marketing These environments are designed to be immersive and interactive, allowing users to feel like they are truly present within the virtual world. VR typically utilizes headsets with near-eye displays and tracking mechanisms to create a sense of movement and position within the simulation. It can also incorporate other sensory elements like sound and haptics to further enhance the experience.

Key Stakeholders

  •  Raw material and manufacturing equipment suppliers
  • Semiconductor foundries
  • Original equipment manufacturers (OEMs)
  • Augmented reality and virtual reality device manufacturers
  • Original design manufacturers (ODMs) and OEM technology solution providers
  • Research organizations
  • Technology standard organizations, forums, alliances, and associations
  • Technology investors
  • Governments, financial institutions, and investment communities
  • Analysts and strategic business planners

Report Objectives

  • To describe and forecast the size of the virtual reality market, by technology, offering device type, application, and region, in terms of value
  • To describe and forecast the market size of various segments across four key regions—North America, Europe, Asia Pacific, and Rest of the World (RoW), in terms of value
  • To forecast the size of the virtual reality market by device type, in terms of volume
  • To provide detailed information regarding the drivers, restraints, opportunities, and challenges influencing the growth of the virtual reality market 
  • To analyze the virtual reality value chain and ecosystem, along with the average selling price of virtual reality systems
  • To strategically analyze the regulatory landscape, tariff, standards, patents, Porter’s five forces, import and export scenarios, trade values, and case studies pertaining to the market under study
  • To strategically analyze micromarkets1 with regard to individual growth trends, prospects, and contributions to the overall market
  • To analyze opportunities in the market for stakeholders by identifying high-growth segments
  • To provide details of the competitive landscape for market leaders
  • To analyze strategies such as product launches, expansion, collaborations, acquisitions, partnerships, and expansions adopted by players in the virtual reality market
  • To profile key players in the virtual reality market and comprehensively analyze their market ranking based on their revenue, market share, and core competencies2

Available customizations:

With the given market data, MarketsandMarkets offers customizations according to the specific requirements of companies. The following customization options are available for the report:

  • Detailed analysis and profiling of additional market players based on various blocks of the supply chain
Custom Market Research Services

We will customize the research for you, in case the report listed above does not meet with your exact requirements. Our custom research will comprehensively cover the business information you require to help you arrive at strategic and profitable business decisions.

Request Customization
Report Code
SE 3528
Published ON
May, 2024
Choose License Type
BUY NOW
  • SHARE
X
Request Customization
Speak to Analyst
Speak to Analyst
OR FACE-TO-FACE MEETING
PERSONALIZE THIS RESEARCH
  • Triangulate with your Own Data
  • Get Data as per your Format and Definition
  • Gain a Deeper Dive on a Specific Application, Geography, Customer or Competitor
  • Any level of Personalization
REQUEST A FREE CUSTOMIZATION
LET US HELP YOU!
  • What are the Known and Unknown Adjacencies Impacting the Virtual Reality (VR) Market
  • What will your New Revenue Sources be?
  • Who will be your Top Customer; what will make them switch?
  • Defend your Market Share or Win Competitors
  • Get a Scorecard for Target Partners
CUSTOMIZED WORKSHOP REQUEST
  • Call Us
  • +1-888-600-6441 (Corporate office hours)
  • +1-888-600-6441 (US/Can toll free)
  • +44-800-368-9399 (UK office hours)
CONNECT WITH US
ABOUT TRUST ONLINE
©2024 MarketsandMarkets Research Private Ltd. All rights reserved
DMCA.com Protection Status
Website Feedback