Event Management Software Market

Event Management Software Market by Component (Software (Event Registration and Ticketing, Content Management) and Services), Deployment Mode, Organization Size, End User and Region - Global Forecast to 2026

Report Code: TC 2797 Feb, 2022, by marketsandmarkets.com

Event Management Software Market Overview, Industry Share and Forecast

The global Event Management Software Market size as per revenue was worth approximately $7.0 billion in 2021 and is anticipated to reach over $14.1 billion by the end of 2026, at a CAGR of 14.9%.

Accelerated adoption of virtual events due to COVID-19, rise in demand to manage large volumes of data and automate event management tasks, compelling need to save time and money with real-time data analysis, increase in demand to capture actionable business insights from events, and growth in the use of social media for event marketing are expected to be the major factors driving the growth of the market.

Event Management Software Market

To know about the assumptions considered for the study, Request for Free Sample Report

Event Management Software Market Growth Dynamics

Driver: Increasing adoption of advanced data analytics solutions

Advanced analytics is a comprehensive set of analytical techniques and methods designed for helping event management companies discover trends and patterns, solve problems, and accurately predict the future and drive change using data-driven and fact-based information. They help enterprises by offering sophisticated algorithms and analytical techniques, which assist in effective decision-making. These tools help event management companies with average skills to explore data and enjoy the advantages of augmented analytics with guidance and recommendations for getting better and clearer results.

Restraint: High initial cost associated with event management softwarep

With the launch of advanced products in the market, new technologies need more investments in research & development (R&D). There is a tremendous amount of pressure in the IT industry to develop new and better products, such as drones, Virtual Reality (VR) systems, and impressive advancements in automation technology. All of these products require new parts, coupled with intense R&D. There is a sizable investment that goes into product development, which helps enterprises add new technologies and features. Great event management solutions may come at a hefty price and powerful features. But if organizations only have a small event, the ROI may be compromised, and the software proves costly.

Opportunity: Gamification of events to engage a larger audience

Gamification is the process of creating game-like systems around content, whether that be by creating teams, rewarding points for tasks, or tracking completion. Organizations across industries are focusing on gamification to create high-quality experiences through events. Event organizers are using gamification as a tool to boost attendees’ engagement. Event gamification enables organizers to attain event goals, while it also enables them to create a fun-filled memorable experience for event attendees. It works on the basis of accessing the emotions of attendees and offers various benefits, including creating a relaxed atmosphere, boosting attendees’ confidence, making communication easy and effective, and generating a feeling of common purpose. The event organizers use various gamification methods, including social media engagement, Question and Answer (Q&A) engagement, networking games, social programs, and teamwork games.

Challenge: Wide gap between organizers’ offerings and attendees’ needs

Attendees have smart devices at their disposal to stay updated in the digital era. However, most organizers approach attendees through established communication channels, such as email marketing and social media marketing. Event planners face challenges in communicating and collaborating with stakeholders, such as customers, attendees, third-party event managers, event marketers, and sponsors. Event management platforms that facilitate cross-collaboration and enhance reporting competencies can aid the event planners in efficiently providing useful information to stakeholders.

By Organization Size, Small and Medium-sized Enterprises segment to have the higher growth during the forecast period

Under Organization Size, the Small and Medium-sized Enterprises segment is expected to have the highest growth rate during the forecast period. Organizations with less than 1,000 employees are categorized as SMEs. The increased competitive market scenario and brand marketing have encouraged SMEs to invest in event management software and services to reach out to more prospects and participants and effectively host events for their business growth.

By End User, the Event Organizers and Planners segment to have the highest market size during the forecast period

Among End Users, the Event Organizers and Planners segment to have the highest share. Event organizers and planners help organizations develop and plan events for their clients. The events include creating effective invitations, managing registrations, organizing housing and travel preferences, collecting online payments, and viewing reports in real-time.

By Region, Asia Pacific to record the highest growth during the forecast period

Asia Pacific is one of the fastest-developing regions globally, making the region highly profitable for the event management software market. It is expected to be the fastest-growing market in the global Event Management Software market, owing to the rapid technological adoption in countries such as China and India. Government initiatives to promote the digital infrastructure are responsible for driving the adoption of event management solutions in the region. The region consists of a broad customer base for many industries, resulting in the need for brand marketing activities to reach out to potential clients. Event management software are becoming more popular in Asia Pacific due to the growing internet penetration and fierce competition between companies and organizations expanding their businesses in the region.

Event Management Software Market   by Region

To know about the assumptions considered for the study, download the pdf brochure

Key Market Players

The report includes the study of key players offering event management software and services. The major vendors in the Event Management Software Market include Cvent (US), Aventri (US), Eventbrite (US), Ungerboeck (US), Hopin (UK), XING Events (Germany), Bizzabo (US), Certain (US), RainFocus (US), and ACTIVE Network (US). These players have adopted various strategies to grow in the global Event Management Software Market.

The study includes an in-depth competitive analysis of these key players in the Event Management Software Market with their company profiles, recent developments, and key market strategies.

Get online access to the report on the World's First Market Intelligence Cloud

  • Easy to Download Historical Data & Forecast Numbers
  • Company Analysis Dashboard for high growth potential opportunities
  • Research Analyst Access for customization & queries
  • Competitor Analysis with Interactive dashboard
  • Latest News, Updates & Trend analysis
Request Sample

Scope of the Report

Report Metrics

Details

Market Size Valued in 2021

USD 7.0 billion

Revenue Forecast Size Value in 2026

USD 14.1 billion

Growth Rate

14.9% CAGR

Market Segmentation

Component, Deployment Mode, Organization Size, End User, and Region

Market size available for years

2017-2026

Base year considered

2020

Forecast period

2021-2026

Forecast units

Value (USD Million)

Regions covered

North America, Europe, Asia Pacific, Middle East & Africa, and Latin America

Vendors Covered

Cvent(US), Aventri(US), Eventbrite(US), Ungerboeck(US), Hopin (UK), XING Events (Germany), Bizzabo (US), Certain (US), RainFocus (US), ACTIVE Network (US), Eventzilla (US), Meeting Evolution (US), EventMobi (Canada), Zoho (India), Regpack (US), EventBooking (US), Bitrix24 (US), Arlo (UK), webMOBI (US), Tripleseat (US), Hubilo (US), Circa (US), Hubb (US), Accelevents (US), Glue Up (US), idloom (Belgium), Eventdex (US), Event Temple (Canada), Whova (US), and Airmeet (US)

This research report categorizes the Event Management Software market to forecast revenues and analyze trends in each of the following subsegments:

By Component:

  • Software
    • Event Planning Software
    • Venue Management Software
    • Event Registration And Ticketing Software
    • Event Marketing Software
    • Analytics And Reporting Software
    • Onsite Technology
    • Content Management Software
    • Visitor Management Software
    • Other Software
  • Services
    • Managed Services
    • Professional Services
      • Consulting
      • Deployment and Integration
      • Support and Maintenance

By Deployment Mode:

  • Cloud
  • On-premises

By Organization Size:

  • Small and Medium-sized Enterprises
  • Large Enterprises

By End User:

  • Event Organizers and Planners
  • Corporate
  • Government
  • Education
  • Other End Users

By Region:

  • North America
    • United States
    • Canada
  • Europe
    • United Kingdom
    • Germany
    • France
    • Rest of Europe
  • Asia Pacific
    • China
    • Japan
    • Australia & New Zealand
    • Rest of Asia Pacific
  • Middle East & Africa
    • United Arab Emirates
    • Kingdom of Saudi Arabia
    • South Africa
    • Rest of Middle East & Africa
  • Latin America
    • Brazil
    • Mexico
    • Rest of Latin America

Recent Developments:

  • In January 2022, Aventri merged with MeetingPlay, an innovative solution provider for in-person, virtual, and hybrid events. The new event software powerhouse would combine the strengths of both companies to offer a complete full-service solution for meetings and events of all sizes.
  • In December 2021, Cvent merged with Dragoneer Growth Opportunities Corp. II., a special purpose acquisition company. The merger would provide Cvent with USD 801 million, which would enable the company to accelerate product innovation, increase research & development, reduce debt, and expand its share in the market.
  • In November 2021, Ungerboeck acquired Priava, a cloud-based venue and event management system with a wide portfolio of global customers. The acquisition enabled Ungerboeck to expand its presence internationally in Australia, New Zealand, and the UK.
  • In June 2021, Hopin acquired Boomset to become an all-in-one event management platform that now offered onsite capabilities for hybrid and in-person events. With the acquisition, Hopin would expand its event product offering, providing essential onsite event management tools.
  • In November 2020, Eventbrite acquired ToneDen, a self-servicing social marketing platform. The acquisition enabled creators to attract and grow audiences. It allowed the creators to encourage and engage ticket buyers.

Frequently Asked Questions (FAQ):

To speak to our analyst for a discussion on the above findings, click Speak to Analyst


TABLE OF CONTENTS

1 INTRODUCTION (Page No. - 28)
    1.1 INTRODUCTION TO COVID-19
    1.2 COVID-19 HEALTH ASSESSMENT
           FIGURE 1 COVID-19: GLOBAL PROPAGATION
           FIGURE 2 COVID-19 PROPAGATION: SELECT COUNTRIES
    1.3 COVID-19 ECONOMIC ASSESSMENT
           FIGURE 3 REVISED GROSS DOMESTIC PRODUCT FORECASTS FOR SELECT G20 COUNTRIES IN 2020
           1.3.1 COVID-19 ECONOMIC IMPACT—SCENARIO ASSESSMENT
                    FIGURE 4 CRITERIA IMPACTING GLOBAL ECONOMY
                    FIGURE 5 SCENARIOS IN TERMS OF RECOVERY OF GLOBAL ECONOMY
    1.4 OBJECTIVES OF THE STUDY
    1.5 MARKET DEFINITION
           1.5.1 INCLUSIONS AND EXCLUSIONS
    1.6 MARKET SCOPE
           1.6.1 MARKET SEGMENTATION
           1.6.2 REGIONS COVERED
           1.6.3 YEARS CONSIDERED
    1.7 CURRENCY
           TABLE 1 USD EXCHANGE RATE, 2017–2019
    1.8 STAKEHOLDERS
    1.9 SUMMARY OF CHANGES

2 RESEARCH METHODOLOGY (Page No. - 39)
    2.1 RESEARCH DATA
           FIGURE 6 EVENT MANAGEMENT SOFTWARE MARKET: RESEARCH DESIGN
           2.1.1 SECONDARY DATA
           2.1.2 PRIMARY DATA
                    2.1.2.1 Breakup of primary profiles
                               FIGURE 7 BREAKUP OF PRIMARY INTERVIEWS: BY COMPANY TYPE, DESIGNATION, AND REGION
                    2.1.2.2 Key industry insights
    2.2 DATA TRIANGULATION
    2.3 MARKET SIZE ESTIMATION
           FIGURE 8 EVENT MANAGEMENT SOFTWARE MARKET: TOP-DOWN AND BOTTOM-UP APPROACHES
           FIGURE 9 MARKET SIZE ESTIMATION METHODOLOGY – APPROACH 1 (SUPPLY SIDE): REVENUE OF SERVICES FROM VENDORS
           FIGURE 10 MARKET SIZE ESTIMATION METHODOLOGY: BOTTOM-UP APPROACH (SUPPLY SIDE): COLLECTIVE REVENUE OF VENDORS
           FIGURE 11 MARKET SIZE ESTIMATION METHODOLOGY - (SUPPLY SIDE): CAGR PROJECTIONS FROM SUPPLY SIDE
           FIGURE 12 MARKET SIZE ESTIMATION METHODOLOGY ? APPROACH 2 (BOTTOM-UP): REVENUE GENERATED BY VENDORS FROM EACH APPLICATION
           FIGURE 13 MARKET SIZE ESTIMATION METHODOLOGY - APPROACH 2 (DEMAND SIDE): REVENUE GENERATED FROM END USERS (2/2)
    2.4 MARKET FORECAST
           TABLE 2 FACTOR ANALYSIS
    2.5 RESEARCH ASSUMPTIONS
    2.6 LIMITATIONS OF THE STUDY

3 EXECUTIVE SUMMARY (Page No. - 52)
    FIGURE 14 EVENT MANAGEMENT SOFTWARE MARKET, 2018–2026 (USD MILLION)
    FIGURE 15 FASTEST-GROWING SEGMENTS IN THE MARKET, 2021–2026
    FIGURE 16 PROFESSIONAL SERVICE SEGMENT TO BE THE LARGER MARKET DURING THE FORECAST PERIOD
    FIGURE 17 ON-PREMISE DEPLOYMENT TO HAVE A HIGHER MARKET SHARE DURING THE FORECAST PERIOD
    FIGURE 18 LARGE ENTERPRISES TO ACCOUNT FOR A LARGER MARKET SIZE DURING THE FORECAST PERIOD
    FIGURE 19 TOP END USERS IN THE MARKET
    FIGURE 20 MARKET: REGIONAL SNAPSHOT

4 PREMIUM INSIGHTS (Page No. - 58)
    4.1 OVERVIEW OF THE EVENT MANAGEMENT SOFTWARE MARKET
           FIGURE 21 GROWING DEMAND FOR EVENT MANAGEMENT SOFTWARE SOLUTIONS WOULD TACKLE HIGH DEMAND FROM EVENT ORGANIZERS AND PLANNERS
    4.2 MARKET, BY COMPONENT
           FIGURE 22 SOFTWARE TO ACCOUNT FOR A LARGER MARKET SHARE DURING THE FORECAST PERIOD
    4.3 EVENT MANAGEMENT SOFTWARE PROFESSIONAL SERVICES MARKET, BY TYPE
           FIGURE 23 THE SUPPORT AND MAINTENANCE SEGMENT TO BE THE LARGEST MARKET DURING THE FORECAST PERIOD
    4.4 MARKET, BY DEPLOYMENT MODE
           FIGURE 24 ON-PREMISES DEPLOYMENT TO ACCOUNT FOR A LARGER MARKET SHARE DURING THE FORECAST PERIOD
    4.5 MARKET, BY ORGANIZATION SIZE
           FIGURE 25 LARGE ENTERPRISE SEGMENT TO ACCOUNT FOR A LARGER MARKET SHARE DURING THE FORECAST PERIOD
    4.6 MARKET, BY END USER
           FIGURE 26 EVENT ORGANIZERS AND PLANNERS SEGMENT TO ACCOUNT FOR THE LARGEST MARKET SHARE DURING THE FORECAST PERIOD
    4.7 MARKET: REGIONAL SCENARIO
           FIGURE 27 ASIA PACIFIC TO EMERGE AS THE BEST MARKET FOR INVESTMENTS IN THE NEXT FIVE YEARS

5 MARKET OVERVIEW AND INDUSTRY TRENDS (Page No. - 62)
    5.1 INTRODUCTION
    5.2 MARKET DYNAMICS
           FIGURE 28 DRIVERS, RESTRAINTS, OPPORTUNITIES, AND CHALLENGES: EVENT MANAGEMENT SOFTWARE MARKET
           5.2.1 DRIVERS
                    5.2.1.1 COVID-19: A catalyst to accelerate the adoption of virtual events
                               FIGURE 29 THE PANDEMIC DRIVES VIRTUAL MEETINGS
                               FIGURE 30 RESPONDENTS WANT TO USE TECHNOLOGY TO ENHANCE VIRTUAL MEETINGS
                    5.2.1.2 Rise in demand to manage large volumes of data and automate event management tasks
                    5.2.1.3 Compelling need to save time and money with real-time data analysis
                               FIGURE 31 MAJOR BENEFITS DRIVING MARKET
                    5.2.1.4 Increase in demand to capture actionable business insights from events
                    5.2.1.5 Growth in the use of social media for event marketing
                               FIGURE 32 SOCIAL MEDIA IS MOST COMMONLY USED FOR PRE-EVENT ENGAGEMENT
                               FIGURE 33 FACEBOOK IS THE MOST POPULAR SOCIAL MEDIA CHANNEL FOR EVENT PLANNERS
           5.2.2 RESTRAINTS
                    5.2.2.1 Difficulty in integrating event management software with business systems
                    5.2.2.2 High initial cost associated with event management software
           5.2.3 OPPORTUNITIES
                    5.2.3.1 Gamification of events to engage a larger audience
                    5.2.3.2 Growth in inclination toward adoption of AI and ML in event management
           5.2.4 CHALLENGES
                    5.2.4.1 Wide gap between organizers’ offerings and attendees’ needs
                    5.2.4.2 Lack of awareness of event management software
    5.3 CASE STUDY ANALYSIS
           5.3.1 CASE STUDY 1: NEC CORPORATION SHOWCASING PROVEN SAAS SOLUTIONS TO CUSTOMERS THROUGH VIRTUAL EVENTS ON THE CVENT PLATFORM
           5.3.2 CASE STUDY 2: HLB DESIGNED A VIRTUAL EVENT WITH AVENTRI VIRTUAL EVENT PLATFORM
           5.3.3 CASE STUDY 3: GLASSDOOR USED HOPIN FOR ITS FIRST FULLY VIRTUAL SALES KICKOFF
           5.3.4 CASE STUDY 4: ACRONIS SCALES THEIR HYBRID EVENT STRATEGY WITH BIZZABO
    5.4 PORTER’S FIVE FORCES ANALYSIS
           TABLE 3 PORTER’S FIVE FORCES ANALYSIS: EVENT MANAGEMENT SOFTWARE MARKET
           FIGURE 34 PORTER’S FIVE FORCES ANALYSIS: MARKET
           5.4.1 THREAT OF NEW ENTRANTS
           5.4.2 THREAT OF SUBSTITUTES
           5.4.3 BARGAINING POWER OF SUPPLIERS
           5.4.4 BARGAINING POWER OF BUYERS
           5.4.5 INTENSITY OF COMPETITIVE RIVALRY
    5.5 COVID-19-DRIVEN MARKET DYNAMICS
           5.5.1 DRIVERS AND OPPORTUNITIES
           5.5.2 RESTRAINTS AND CHALLENGES
    5.6 TECHNOLOGICAL OUTLOOK
           5.6.1 CLOUD/SOFTWARE AS A SERVICE
           5.6.2 ARTIFICIAL INTELLIGENCE AND MACHINE LEARNING
           5.6.3 ANALYTICS
           5.6.4 AUGMENTED REALITY AND VIRTUAL REALITY
           5.6.5 INTERNET OF THINGS
    5.7 PRICING ANALYSIS
           TABLE 4 EVENT MANAGEMENT SOFTWARE MARKET: PRICING LEVELS
           FIGURE 35 AVERAGE SELLING PRICING OF EVENT MANAGEMENT SOFTWARE VENDORS FOR TOP APPLICATIONS
    5.8 SUPPLY CHAIN ANALYSIS
           FIGURE 36 MARKET: SUPPLY CHAIN
    5.9 ECOSYSTEM
           FIGURE 37 MARKET: ECOSYSTEM
    5.10 REGULATORY IMPLICATIONS AND INDUSTRY STANDARDS
           5.10.1 NORTH AMERICA
           5.10.2 EUROPE
           5.10.3 ASIA PACIFIC
           5.10.4 MIDDLE EAST AND AFRICA
           5.10.5 LATIN AMERICA
    5.11 PATENT ANALYSIS
           TABLE 5 TOP 10 PATENT OWNERS (US)
           FIGURE 38 TOP 10 COMPANIES WITH HIGHEST NUMBER OF PATENTS
    5.12 KEY CONFERENCES & EVENTS
           TABLE 6 MARKET: DETAILED LIST OF CONFERENCES & EVENTS, 2022–2023
    5.13 TRENDS/DISRUPTIONS IMPACTING BUYERS
           FIGURE 39 MARKET: TRENDS/DISRUPTIONS IMPACTING BUYERS

6 EVENT MANAGEMENT SOFTWARE MARKET, BY COMPONENT (Page No. - 89)
    6.1 INTRODUCTION
           FIGURE 40 SERVICES TO GROW AT A HIGHER CAGR DURING THE FORECAST PERIOD
           TABLE 7 MARKET, BY COMPONENT, 2017–2020 (USD MILLION)
           TABLE 8 MARKET, BY COMPONENT, 2021–2026 (USD MILLION)
           TABLE 9 COMPONENT: MARKET, BY REGION, 2017–2020 (USD MILLION)
           TABLE 10 COMPONENT: MARKET, BY REGION, 2021–2026 (USD MILLION)
    6.2 SOFTWARE
           6.2.1 SOFTWARE: MARKET DRIVERS
           6.2.2 SOFTWARE: COVID-19 IMPACT
                    TABLE 11 MARKET IN ACADEMIC INSTITUTIONS, BY REGION, 2017–2020 (USD MILLION)
                    TABLE 12 MARKET IN ACADEMIC INSTITUTIONS, BY REGION, 2021–2026 (USD MILLION)
           6.2.3 EVENT PLANNING SOFTWARE
           6.2.4 VENUE MANAGEMENT SOFTWARE
           6.2.5 EVENT REGISTRATION AND TICKETING SOFTWARE
           6.2.6 EVENT MARKETING SOFTWARE
           6.2.7 ANALYTICS AND REPORTING SOFTWARE
           6.2.8 ONSITE TECHNOLOGY
           6.2.9 CONTENT MANAGEMENT SOFTWARE
           6.2.10 VISITOR MANAGEMENT SOFTWARE
           6.2.11 OTHER SOFTWARE
    6.3 SERVICES
           FIGURE 41 MANAGED SERVICES ESTIMATED TO GROW AT A HIGHER CAGR DURING THE FORECAST PERIOD
           6.3.1 SERVICES: EVENT MANAGEMENT SOFTWARE MARKET DRIVERS
           6.3.2 SERVICES: COVID-19 IMPACT
                    TABLE 13 EVENT MANAGEMENT SOFTWARE SERVICES MARKET, BY TYPE, 2017–2020 (USD MILLION)
                    TABLE 14 EVENT MANAGEMENT SOFTWARE SERVICES MARKET, BY TYPE, 2021–2026 (USD MILLION)
                    TABLE 15 EVENT MANAGEMENT SOFTWARE SERVICES MARKET, BY REGION, 2017–2020 (USD MILLION)
                    TABLE 16 EVENT MANAGEMENT SOFTWARE SERVICES MARKET, BY REGION, 2021–2026 (USD MILLION)
           6.3.3 PROFESSIONAL SERVICES
                    FIGURE 42 SUPPORT AND MAINTENANCE TO GROW AT THE HIGHEST CAGR DURING THE FORECAST PERIOD
                    TABLE 17 EVENT MANAGEMENT SOFTWARE PROFESSIONAL SERVICES MARKET, BY TYPE, 2017–2020 (USD MILLION)
                    TABLE 18 EVENT MANAGEMENT SOFTWARE PROFESSIONAL SERVICES MARKET, BY TYPE, 2021–2026 (USD MILLION)
                    TABLE 19 EVENT MANAGEMENT SOFTWARE PROFESSIONAL SERVICES MARKET, BY REGION, 2017–2020 (USD MILLION)
                    TABLE 20 EVENT MANAGEMENT SOFTWARE PROFESSIONAL SERVICES MARKET, BY REGION, 2021–2026 (USD MILLION)
                    6.3.3.1 Consulting
                               TABLE 21 EVENT MANAGEMENT SOFTWARE CONSULTING SERVICES MARKET, BY REGION, 2017–2020 (USD MILLION)
                               TABLE 22 EVENT MANAGEMENT SOFTWARE CONSULTING SERVICES MARKET, BY REGION, 2021–2026 (USD MILLION)
                    6.3.3.2 Deployment and Integration
                               TABLE 23 EVENT MANAGEMENT SOFTWARE DEPLOYMENT AND INTEGRATION SERVICES MARKET, BY REGION, 2017–2020 (USD MILLION)
                               TABLE 24 EVENT MANAGEMENT SOFTWARE DEPLOYMENT AND INTEGRATION SERVICES MARKET, BY REGION, 2021–2026 (USD MILLION)
                    6.3.3.3 Support and maintenance
                               TABLE 25 EVENT MANAGEMENT SOFTWARE SUPPORT AND MAINTENANCE MARKET, BY REGION, 2017–2020 (USD MILLION)
                               TABLE 26 EVENT MANAGEMENT SOFTWARE SUPPORT AND MAINTENANCE MARKET, BY REGION, 2021–2026 (USD MILLION)
           6.3.4 MANAGED SERVICES
                    TABLE 27 EVENT MANAGEMENT SOFTWARE MANAGED SERVICES MARKET, BY REGION, 2017–2020 (USD MILLION)
                    TABLE 28 EVENT MANAGEMENT SOFTWARE MANAGED SERVICES MARKET, BY REGION, 2021–2026 (USD MILLION)

7 EVENT MANAGEMENT SOFTWARE MARKET, BY DEPLOYMENT MODE (Page No. - 103)
    7.1 INTRODUCTION
           FIGURE 43 CLOUD DEPLOYMENT TO GROW AT A HIGHER CAGR DURING THE FORECAST PERIOD
           TABLE 29 MARKET, BY DEPLOYMENT MODE, 2017–2020 (USD MILLION)
           TABLE 30 MARKET, BY DEPLOYMENT MODE, 2021–2026 (USD MILLION)
           TABLE 31 DEPLOYMENT MODE: MARKET, BY REGION, 2017–2020 (USD MILLION)
           TABLE 32 DEPLOYMENT MODE: MARKET, BY REGION, 2021–2026 (USD MILLION)
    7.2 CLOUD
           7.2.1 CLOUD: MARKET DRIVERS
           7.2.2 CLOUD: COVID-19 IMPACT
                    TABLE 33 CLOUD MARKET, BY REGION, 2017–2020 (USD MILLION)
                    TABLE 34 CLOUD MARKET, BY REGION, 2021–2026 (USD MILLION)
    7.3 ON-PREMISES
           7.3.1 ON-PREMISES: MARKET DRIVERS
           7.3.2 ON-PREMISES: COVID-19 IMPACT
                    TABLE 35 ON-PREMISES MARKET, BY REGION, 2017–2020 (USD MILLION)
                    TABLE 36 ON-PREMISES MARKET, BY REGION, 2021–2026 (USD MILLION)

8 EVENT MANAGEMENT SOFTWARE MARKET, BY ORGANIZATION SIZE (Page No. - 109)
    8.1 INTRODUCTION
           FIGURE 44 SMALL AND MEDIUM-SIZED ENTERPRISES ESTIMATED TO GROW AT A HIGHER CAGR DURING THE FORECAST PERIOD
           TABLE 37 MARKET, BY ORGANIZATION SIZE, 2017–2020 (USD MILLION)
           TABLE 38 MARKET, BY ORGANIZATION SIZE, 2021–2026 (USD MILLION)
           TABLE 39 ORGANIZATION SIZE: MARKET, BY REGION, 2017–2020 (USD MILLION)
           TABLE 40 ORGANIZATION SIZE: MARKET, BY REGION, 2021–2026 (USD MILLION)
    8.2 SMALL AND MEDIUM-SIZED ENTERPRISES
           8.2.1 SMALL AND MEDIUM-SIZED ENTERPRISES: MARKET DRIVERS
           8.2.2 SMALL AND MEDIUM-SIZED ENTERPRISES: COVID-19 IMPACT
                    TABLE 41 MARKET IN SMALL AND MEDIUM-SIZED ENTERPRISES, BY REGION, 2017–2020 (USD MILLION)
                    TABLE 42 MARKET IN SMALL AND MEDIUM-SIZED ENTERPRISES, BY REGION, 2021–2026 (USD MILLION)
    8.3 LARGE ENTERPRISES
           8.3.1 LARGE ENTERPRISES: MARKET DRIVERS
           8.3.2 LARGE ENTERPRISES: COVID-19 IMPACT
                    TABLE 43 MARKET IN LARGE ENTERPRISES, BY REGION, 2017–2020 (USD MILLION)
                    TABLE 44 MARKET IN LARGE ENTERPRISES, BY REGION, 2021–2026 (USD MILLION)

9 EVENT MANAGEMENT SOFTWARE MARKET, BY END USER (Page No. - 115)
    9.1 INTRODUCTION
           FIGURE 45 EVENT ORGANIZERS AND PLANNERS SEGMENT TO GROW AT THE HIGHEST CAGR DURING THE FORECAST PERIOD
           TABLE 45 MARKET, BY END USER, 2017–2020 (USD MILLION)
           TABLE 46 MARKET, BY END USER, 2021–2026 (USD MILLION)
           TABLE 47 END USER: MARKET, BY REGION, 2017–2020 (USD MILLION)
           TABLE 48 END USER: MARKET, BY REGION, 2021–2026 (USD MILLION)
    9.2 EVENT ORGANIZERS AND PLANNERS
           9.2.1 EVENT ORGANIZERS AND PLANNERS: MARKET DRIVERS
           9.2.2 EVENT ORGANIZERS AND PLANNERS: COVID-19 IMPACT
                    TABLE 49 EVENT ORGANIZERS AND PLANNERS MARKET, BY REGION, 2017–2020 (USD MILLION)
                    TABLE 50 EVENT ORGANIZERS AND PLANNERS MARKET, BY REGION, 2021–2026 (USD MILLION)
    9.3 CORPORATE
           9.3.1 CORPORATE: MARKET DRIVERS
           9.3.2 CORPORATE: COVID-19 IMPACT
                    TABLE 51 CORPORATE END USERS MARKET, BY REGION, 2017–2020 (USD MILLION)
                    TABLE 52 CORPORATE END USERS MARKET, BY REGION, 2021–2026 (USD MILLION)
    9.4 GOVERNMENT
           9.4.1 GOVERNMENT: EVENT MANAGEMENT SOFTWARE MARKET DRIVERS
           9.4.2 GOVERNMENT: COVID-19 IMPACT
                    TABLE 53 GOVERNMENT END USERS MARKET, BY REGION, 2017–2020 (USD MILLION)
                    TABLE 54 GOVERNMENT END USERS MARKET, BY REGION, 2021–2026 (USD MILLION)
    9.5 EDUCATION
           9.5.1 EDUCATION: MARKET DRIVERS
           9.5.2 EDUCATION: COVID-19 IMPACT
                    TABLE 55 EDUCATIONAL END USERS MARKET, BY REGION, 2017–2020 (USD MILLION)
                    TABLE 56 EDUCATIONAL END USERS MARKET, BY REGION, 2021–2026 (USD MILLION)
    9.6 OTHER END USERS
           9.6.1 OTHER END USERS: MARKET DRIVERS
           9.6.2 OTHER END USERS: COVID-19 IMPACT
                    TABLE 57 OTHER END USERS MARKET, BY REGION, 2017–2020 (USD MILLION)
                    TABLE 58 OTHER END USERS MARKET, BY REGION, 2021–2026 (USD MILLION)

10 EVENT MANAGEMENT SOFTWARE MARKET, BY REGION (Page No. - 124)
     10.1 INTRODUCTION
             FIGURE 46 NORTH AMERICA TO LEAD THE MARKET FROM 2021 TO 2026
             FIGURE 47 ASIA PACIFIC TO GROW AT THE HIGHEST CAGR DURING THE FORECAST PERIOD
             TABLE 59 MARKET, BY REGION, 2017–2020 (USD MILLION)
             TABLE 60 MARKET, BY REGION, 2021–2026 (USD MILLION)
     10.2 NORTH AMERICA
             10.2.1 NORTH AMERICA: MARKET DRIVERS
             10.2.2 NORTH AMERICA: COVID-19 IMPACT
                        FIGURE 48 NORTH AMERICA: MARKET SNAPSHOT
                        TABLE 61 NORTH AMERICA: MARKET, BY COMPONENT, 2017–2020 (USD MILLION)
                        TABLE 62 NORTH AMERICA: MARKET, BY COMPONENT, 2021–2026 (USD MILLION)
                        TABLE 63 NORTH AMERICA: EVENT MANAGEMENT SOFTWARE SERVICES MARKET, BY TYPE, 2017–2020 (USD MILLION)
                        TABLE 64 NORTH AMERICA: EVENT MANAGEMENT SOFTWARE SERVICES MARKET, BY TYPE, 2021–2026 (USD MILLION)
                        TABLE 65 NORTH AMERICA: EVENT MANAGEMENT SOFTWARE PROFESSIONAL SERVICES MARKET, BY TYPE, 2017–2020 (USD MILLION)
                        TABLE 66 NORTH AMERICA: EVENT MANAGEMENT SOFTWARE PROFESSIONAL SERVICES MARKET, BY TYPE, 2021–2026 (USD MILLION)
                        TABLE 67 NORTH AMERICA: EVENT MANAGEMENT SOFTWARE MARKET, BY DEPLOYMENT MODE, 2017–2020 (USD MILLION)
                        TABLE 68 NORTH AMERICA: MARKET, BY DEPLOYMENT MODE, 2021–2026 (USD MILLION)
                        TABLE 69 NORTH AMERICA: MARKET, BY ORGANIZATION SIZE, 2017–2020 (USD MILLION)
                        TABLE 70 NORTH AMERICA: MARKET, BY ORGANIZATION SIZE, 2021–2026 (USD MILLION)
                        TABLE 71 NORTH AMERICA: MARKET, BY END USER, 2017–2020 (USD MILLION)
                        TABLE 72 NORTH AMERICA: MARKET, BY END USER, 2021–2026 (USD MILLION)
                        TABLE 73 NORTH AMERICA: MARKET, BY COUNTRY, 2017–2020 (USD MILLION)
                        TABLE 74 NORTH AMERICA: MARKET, BY COUNTRY, 2021–2026 (USD MILLION)
             10.2.3 UNITED STATES
                        TABLE 75 UNITED STATES: EVENT MANAGEMENT SOFTWARE MARKET, BY COMPONENT, 2017–2020 (USD MILLION)
                        TABLE 76 UNITED STATES: MARKET, BY COMPONENT, 2021–2026 (USD MILLION)
                        TABLE 77 UNITED STATES: MARKET, BY DEPLOYMENT MODE, 2017–2020 (USD MILLION)
                        TABLE 78 UNITED STATES: MARKET, BY DEPLOYMENT MODE, 2021–2026 (USD MILLION)
                        TABLE 79 UNITED STATES: MARKET, BY ORGANIZATION SIZE, 2017–2020 (USD MILLION)
                        TABLE 80 UNITED STATES: MARKET, BY ORGANIZATION SIZE, 2021–2026 (USD MILLION)
             10.2.4 CANADA
                        TABLE 81 CANADA: EVENT MANAGEMENT SOFTWARE MARKET, BY COMPONENT, 2017–2020 (USD MILLION)
                        TABLE 82 CANADA: MARKET, BY COMPONENT, 2021–2026 (USD MILLION)
                        TABLE 83 CANADA: MARKET, BY DEPLOYMENT MODE, 2017–2020 (USD MILLION)
                        TABLE 84 CANADA: MARKET, BY DEPLOYMENT MODE, 2021–2026 (USD MILLION)
                        TABLE 85 CANADA: MARKET, BY ORGANIZATION SIZE, 2017–2020 (USD MILLION)
                        TABLE 86 CANADA: MARKET, BY ORGANIZATION SIZE, 2021–2026 (USD MILLION)
     10.3 EUROPE
             10.3.1 EUROPE: EVENT MANAGEMENT SOFTWARE MARKET DRIVERS
             10.3.2 EUROPE: COVID-19 IMPACT
                        TABLE 87 EUROPE: MARKET, BY COMPONENT, 2017–2020 (USD MILLION)
                        TABLE 88 EUROPE: MARKET, BY COMPONENT, 2021–2026 (USD MILLION)
                        TABLE 89 EUROPE: EVENT MANAGEMENT SOFTWARE SERVICES MARKET, BY TYPE, 2017–2020 (USD MILLION)
                        TABLE 90 EUROPE: EVENT MANAGEMENT SOFTWARE SERVICES MARKET, BY TYPE, 2021–2026 (USD MILLION)
                        TABLE 91 EUROPE: EVENT MANAGEMENT SOFTWARE PROFESSIONAL SERVICES MARKET, BY TYPE, 2017–2020 (USD MILLION)
                        TABLE 92 EUROPE: EVENT MANAGEMENT SOFTWARE PROFESSIONAL SERVICES MARKET, BY TYPE, 2021–2026 (USD MILLION)
                        TABLE 93 EUROPE: EVENT MANAGEMENT SOFTWARE MARKET, BY DEPLOYMENT MODE, 2017–2020 (USD MILLION)
                        TABLE 94 EUROPE:MARKET, BY DEPLOYMENT MODE, 2021–2026 (USD MILLION)
                        TABLE 95 EUROPE: MARKET, BY ORGANIZATION SIZE, 2017–2020 (USD MILLION)
                        TABLE 96 EUROPE: MARKET, BY ORGANIZATION SIZE, 2021–2026 (USD MILLION)
                        TABLE 97 EUROPE: MARKET, BY END USER, 2017–2020 (USD MILLION)
                        TABLE 98 EUROPE: MARKET, BY END USER, 2021–2026 (USD MILLION)
                        TABLE 99 EUROPE: MARKET, BY COUNTRY, 2017–2020 (USD MILLION)
                        TABLE 100 EUROPE: MARKET, BY COUNTRY, 2021–2026 (USD MILLION)
             10.3.3 UNITED KINGDOM
                        TABLE 101 UNITED KINGDOM: EVENT MANAGEMENT SOFTWARE MARKET, BY COMPONENT, 2017–2020 (USD MILLION)
                        TABLE 102 UNITED KINGDOM: MARKET, BY COMPONENT, 2021–2026 (USD MILLION)
                        TABLE 103 UNITED KINGDOM: MARKET, BY DEPLOYMENT MODE, 2017–2020 (USD MILLION)
                        TABLE 104 UNITED KINGDOM: MARKET, BY DEPLOYMENT MODE, 2021–2026 (USD MILLION)
                        TABLE 105 UNITED KINGDOM: MARKET, BY ORGANIZATION SIZE, 2017–2020 (USD MILLION)
                        TABLE 106 UNITED KINGDOM: MARKET, BY ORGANIZATION SIZE, 2021–2026 (USD MILLION)
             10.3.4 GERMANY
                        TABLE 107 GERMANY: MARKET, BY COMPONENT, 2017–2020 (USD MILLION)
                        TABLE 108 GERMANY: MARKET, BY COMPONENT, 2021–2026 (USD MILLION)
                        TABLE 109 GERMANY: MARKET, BY DEPLOYMENT MODE, 2017–2020 (USD MILLION)
                        TABLE 110 GERMANY: MARKET, BY DEPLOYMENT MODE, 2021–2026 (USD MILLION)
                        TABLE 111 GERMANY: MARKET, BY ORGANIZATION SIZE, 2017–2020 (USD MILLION)
                        TABLE 112 GERMANY: MARKET, BY ORGANIZATION SIZE, 2021–2026 (USD MILLION)
             10.3.5 FRANCE
                        TABLE 113 FRANCE: EVENT MANAGEMENT SOFTWARE MARKET, BY COMPONENT, 2017–2020 (USD MILLION)
                        TABLE 114 FRANCE: MARKET, BY COMPONENT, 2021–2026 (USD MILLION)
                        TABLE 115 FRANCE: MARKET, BY DEPLOYMENT MODE, 2017–2020 (USD MILLION)
                        TABLE 116 FRANCE: MARKET, BY DEPLOYMENT MODE, 2021–2026 (USD MILLION)
                        TABLE 117 FRANCE: MARKET, BY ORGANIZATION SIZE, 2017–2020 (USD MILLION)
                        TABLE 118 FRANCE: MARKET, BY ORGANIZATION SIZE, 2021–2026 (USD MILLION)
             10.3.6 REST OF EUROPE
                        TABLE 119 REST OF EUROPE: MARKET, BY COMPONENT, 2017–2020 (USD MILLION)
                        TABLE 120 REST OF EUROPE: MARKET, BY COMPONENT, 2021–2026 (USD MILLION)
                        TABLE 121 REST OF EUROPE: MARKET, BY DEPLOYMENT MODE, 2017–2020 (USD MILLION)
                        TABLE 122 REST OF EUROPE: MARKET, BY DEPLOYMENT MODE, 2021–2026 (USD MILLION)
                        TABLE 123 REST OF EUROPE: MARKET, BY ORGANIZATION SIZE, 2017–2020 (USD MILLION)
                        TABLE 124 REST OF EUROPE: MARKET, BY ORGANIZATION SIZE, 2021–2026 (USD MILLION)
     10.4 ASIA PACIFIC
             10.4.1 ASIA PACIFIC: EVENT MANAGEMENT SOFTWARE MARKET DRIVERS
             10.4.2 ASIA PACIFIC: COVID-19 IMPACT
                        FIGURE 49 ASIA PACIFIC: MARKET SNAPSHOT
                        TABLE 125 ASIA PACIFIC: MARKET, BY COMPONENT, 2017–2020 (USD MILLION)
                        TABLE 126 ASIA PACIFIC: MARKET, BY COMPONENT, 2021–2026 (USD MILLION)
                        TABLE 127 ASIA PACIFIC: EVENT MANAGEMENT SOFTWARE SERVICES MARKET, BY TYPE, 2017–2020 (USD MILLION)
                        TABLE 128 ASIA PACIFIC: EVENT MANAGEMENT SOFTWARE SERVICES MARKET, BY TYPE, 2021–2026 (USD MILLION)
                        TABLE 129 ASIA PACIFIC: EVENT MANAGEMENT SOFTWARE PROFESSIONAL SERVICES MARKET, BY TYPE, 2017–2020 (USD MILLION)
                        TABLE 130 ASIA PACIFIC: EVENT MANAGEMENT SOFTWARE PROFESSIONAL SERVICES MARKET, BY TYPE, 2021–2026 (USD MILLION)
                        TABLE 131 ASIA PACIFIC: EVENT MANAGEMENT SOFTWARE MARKET, BY DEPLOYMENT MODE, 2017–2020 (USD MILLION)
                        TABLE 132 ASIA PACIFIC: MARKET, BY DEPLOYMENT MODE, 2021–2026 (USD MILLION)
                        TABLE 133 ASIA PACIFIC: MARKET, BY ORGANIZATION SIZE, 2017–2020 (USD MILLION)
                        TABLE 134 ASIA PACIFIC: MARKET, BY ORGANIZATION SIZE, 2021–2026 (USD MILLION)
                        TABLE 135 ASIA PACIFIC: MARKET, BY END USER, 2017–2020 (USD MILLION)
                        TABLE 136 ASIA PACIFIC: MARKET, BY END USER, 2021–2026 (USD MILLION)
                        TABLE 137 ASIA PACIFIC: MARKET, BY COUNTRY/REGION, 2017–2020 (USD MILLION)
                        TABLE 138 ASIA PACIFIC: MARKET, BY COUNTRY/REGION, 2021–2026 (USD MILLION)
             10.4.3 CHINA
                        TABLE 139 CHINA: EVENT MANAGEMENT SOFTWARE MARKET, BY COMPONENT, 2017–2020 (USD MILLION)
                        TABLE 140 CHINA: MARKET, BY COMPONENT, 2021–2026 (USD MILLION)
                        TABLE 141 CHINA: MARKET, BY DEPLOYMENT MODE, 2017–2020 (USD MILLION)
                        TABLE 142 CHINA: MARKET, BY DEPLOYMENT MODE, 2021–2026 (USD MILLION)
                        TABLE 143 CHINA: MARKET, BY ORGANIZATION SIZE, 2017–2020 (USD MILLION)
                        TABLE 144 CHINA: MARKET, BY ORGANIZATION SIZE, 2021–2026 (USD MILLION)
             10.4.4 JAPAN
                        TABLE 145 JAPAN: EVENT MANAGEMENT SOFTWARE MARKET, BY COMPONENT, 2017–2020 (USD MILLION)
                        TABLE 146 JAPAN: MARKET, BY COMPONENT, 2021–2026 (USD MILLION)
                        TABLE 147 JAPAN: MARKET, BY DEPLOYMENT MODE, 2017–2020 (USD MILLION)
                        TABLE 148 JAPAN: MARKET, BY DEPLOYMENT MODE, 2021–2026 (USD MILLION)
                        TABLE 149 JAPAN: MARKET, BY ORGANIZATION SIZE, 2017–2020 (USD MILLION)
                        TABLE 150 JAPAN: MARKET, BY ORGANIZATION SIZE, 2021–2026 (USD MILLION)
             10.4.5 AUSTRALIA & NEW ZEALAND
                        TABLE 151 AUSTRALIA & NEW ZEALAND: MARKET, BY COMPONENT, 2017–2020 (USD MILLION)
                        TABLE 152 AUSTRALIA & NEW ZEALAND: MARKET, BY COMPONENT, 2021–2026 (USD MILLION)
                        TABLE 153 AUSTRALIA & NEW ZEALAND: MARKET, BY DEPLOYMENT MODE, 2017–2020 (USD MILLION)
                        TABLE 154 AUSTRALIA & NEW ZEALAND: MARKET, BY DEPLOYMENT MODE, 2021–2026 (USD MILLION)
                        TABLE 155 AUSTRALIA & NEW ZEALAND: MARKET, BY ORGANIZATION SIZE, 2017–2020 (USD MILLION)
                        TABLE 156 AUSTRALIA & NEW ZEALAND: MARKET, BY ORGANIZATION SIZE, 2021–2026 (USD MILLION)
             10.4.6 REST OF ASIA PACIFIC
                        TABLE 157 REST OF ASIA PACIFIC: EVENT MANAGEMENT SOFTWARE MARKET, BY COMPONENT, 2017–2020 (USD MILLION)
                        TABLE 158 REST OF ASIA PACIFIC: MARKET, BY COMPONENT, 2021–2026 (USD MILLION)
                        TABLE 159 REST OF ASIA PACIFIC: MARKET, BY DEPLOYMENT MODE, 2017–2020 (USD MILLION)
                        TABLE 160 REST OF ASIA PACIFIC: MARKET, BY DEPLOYMENT MODE, 2021–2026 (USD MILLION)
                        TABLE 161 REST OF ASIA PACIFIC: MARKET, BY ORGANIZATION SIZE, 2017–2020 (USD MILLION)
                        TABLE 162 REST OF ASIA PACIFIC: WARE MARKET, BY ORGANIZATION SIZE, 2021–2026 (USD MILLION)
     10.5 MIDDLE EAST & AFRICA
             10.5.1 MIDDLE EAST & AFRICA: EVENT MANAGEMENT SOFTWARE MARKET DRIVERS
             10.5.2 MIDDLE EAST & AFRICA: COVID-19 IMPACT
                        TABLE 163 MIDDLE EAST & AFRICA: MARKET, BY COMPONENT, 2017–2020 (USD MILLION)
                        TABLE 164 MIDDLE EAST & AFRICA: MARKET, BY COMPONENT, 2021–2026 (USD MILLION)
                        TABLE 165 MIDDLE EAST & AFRICA: EVENT MANAGEMENT SOFTWARE SERVICES MARKET, BY TYPE, 2017–2020 (USD MILLION)
                        TABLE 166 MIDDLE EAST & AFRICA: EVENT MANAGEMENT SOFTWARE SERVICES MARKET, BY TYPE, 2021–2026 (USD MILLION)
                        TABLE 167 MIDDLE EAST & AFRICA: EVENT MANAGEMENT SOFTWARE PROFESSIONAL SERVICES MARKET, BY TYPE, 2017–2020 (USD MILLION)
                        TABLE 168 MIDDLE EAST & AFRICA: EVENT MANAGEMENT SOFTWARE PROFESSIONAL SERVICES MARKET, BY TYPE, 2021–2026 (USD MILLION)
                        TABLE 169 MIDDLE EAST & AFRICA: EVENT MANAGEMENT SOFTWARE MARKET, BY DEPLOYMENT MODE, 2017–2020 (USD MILLION)
                        TABLE 170 MIDDLE EAST & AFRICA: MARKET, BY DEPLOYMENT MODE, 2021–2026 (USD MILLION)
                        TABLE 171 MIDDLE EAST & AFRICA: MARKET, BY ORGANIZATION SIZE, 2017–2020 (USD MILLION)
                        TABLE 172 MIDDLE EAST & AFRICA: MARKET, BY ORGANIZATION SIZE, 2021–2026 (USD MILLION)
                        TABLE 173 MIDDLE EAST & AFRICA: MARKET, BY END USER, 2017–2020 (USD MILLION)
                        TABLE 174 MIDDLE EAST & AFRICA: MARKET, BY END USER, 2021–2026 (USD MILLION)
                        TABLE 175 MIDDLE EAST & AFRICA: MARKET, BY COUNTRY, 2017–2020 (USD MILLION)
                        TABLE 176 MIDDLE EAST & AFRICA: MARKET, BY COUNTRY, 2021–2026 (USD MILLION)
             10.5.3 UNITED ARAB EMIRATES
                        TABLE 177 UNITED ARAB EMIRATES: EVENT MANAGEMENT SOFTWARE MARKET, BY COMPONENT, 2017–2020 (USD MILLION)
                        TABLE 178 UNITED ARAB EMIRATES: MARKET, BY COMPONENT, 2021–2026 (USD MILLION)
                        TABLE 179 UNITED ARAB EMIRATES: MARKET, BY DEPLOYMENT MODE, 2017–2020 (USD MILLION)
                        TABLE 180 UNITED ARAB EMIRATES: MARKET, BY DEPLOYMENT MODE, 2021–2026 (USD MILLION)
                        TABLE 181 UNITED ARAB EMIRATES: MARKET, BY ORGANIZATION SIZE, 2017–2020 (USD MILLION)
                        TABLE 182 UNITED ARAB EMIRATES: MARKET, BY ORGANIZATION SIZE, 2021–2026 (USD MILLION)
             10.5.4 KINGDOM OF SAUDI ARABIA
                        TABLE 183 KINGDOM OF SAUDI ARABIA: EVENT MANAGEMENT SOFTWARE MARKET, BY COMPONENT, 2017–2020 (USD MILLION)
                        TABLE 184 KINGDOM OF SAUDI ARABIA: MARKET, BY COMPONENT, 2021–2026 (USD MILLION)
                        TABLE 185 KINGDOM OF SAUDI ARABIA: MARKET, BY DEPLOYMENT MODE, 2017–2020 (USD MILLION)
                        TABLE 186 KINGDOM OF SAUDI ARABIA: MARKET, BY DEPLOYMENT MODE, 2021–2026 (USD MILLION)
                        TABLE 187 KINGDOM OF SAUDI ARABIA: MARKET, BY ORGANIZATION SIZE, 2017–2020 (USD MILLION)
                        TABLE 188 KINGDOM OF SAUDI ARABIA: MARKET, BY ORGANIZATION SIZE, 2021–2026 (USD MILLION)
             10.5.5 SOUTH AFRICA
                        TABLE 189 SOUTH AFRICA: EVENT MANAGEMENT SOFTWARE MARKET, BY COMPONENT, 2017–2020 (USD MILLION)
                        TABLE 190 SOUTH AFRICA: MARKET, BY COMPONENT, 2021–2026 (USD MILLION)
                        TABLE 191 SOUTH AFRICA: MARKET, BY DEPLOYMENT MODE, 2017–2020 (USD MILLION)
                        TABLE 192 SOUTH AFRICA: MARKET, BY DEPLOYMENT MODE, 2021–2026 (USD MILLION)
                        TABLE 193 SOUTH AFRICA: MARKET, BY ORGANIZATION SIZE, 2017–2020 (USD MILLION)
                        TABLE 194 SOUTH AFRICA: MARKET, BY ORGANIZATION SIZE, 2021–2026 (USD MILLION)
             10.5.6 REST OF THE MIDDLE EAST & AFRICA
                        TABLE 195 REST OF THE MIDDLE EAST & AFRICA: EVENT MANAGEMENT SOFTWARE MARKET, BY COMPONENT, 2017–2020 (USD MILLION)
                        TABLE 196 REST OF THE MIDDLE EAST & AFRICA: MARKET, BY COMPONENT, 2021–2026 (USD MILLION)
                        TABLE 197 REST OF MIDDLE EAST & AFRICA: MARKET, BY DEPLOYMENT MODE, 2017–2020 (USD MILLION)
                        TABLE 198 REST OF THE MIDDLE EAST & AFRICA: MARKET, BY DEPLOYMENT MODE, 2021–2026 (USD MILLION)
                        TABLE 199 REST OF THE MIDDLE EAST & AFRICA: MARKET, BY ORGANIZATION SIZE, 2017–2020 (USD MILLION)
                        TABLE 200 REST OF THE MIDDLE EAST & AFRICA: MARKET, BY ORGANIZATION SIZE, 2021–2026 (USD MILLION)
     10.6 LATIN AMERICA
             10.6.1 LATIN AMERICA: EVENT MANAGEMENT SOFTWARE MARKET DRIVERS
             10.6.2 LATIN AMERICA: COVID-19 IMPACT
                        TABLE 201 LATIN AMERICA: MARKET, BY COMPONENT, 2017–2020 (USD MILLION)
                        TABLE 202 LATIN AMERICA: MARKET, BY COMPONENT, 2021–2026 (USD MILLION)
                        TABLE 203 LATIN AMERICA: EVENT MANAGEMENT SOFTWARE SERVICES MARKET, BY TYPE, 2017–2020 (USD MILLION)
                        TABLE 204 LATIN AMERICA: EVENT MANAGEMENT SOFTWARE SERVICES MARKET, BY TYPE, 2021–2026 (USD MILLION)
                        TABLE 205 LATIN AMERICA: EVENT MANAGEMENT SOFTWARE PROFESSIONAL SERVICES MARKET, BY TYPE, 2017–2020 (USD MILLION)
                        TABLE 206 LATIN AMERICA: EVENT MANAGEMENT SOFTWARE PROFESSIONAL SERVICES MARKET, BY TYPE, 2021–2026 (USD MILLION)
                        TABLE 207 LATIN AMERICA: EVENT MANAGEMENT SOFTWARE MARKET, BY DEPLOYMENT MODE, 2017–2020 (USD MILLION)
                        TABLE 208 LATIN AMERICA: MARKET, BY DEPLOYMENT MODE, 2021–2026 (USD MILLION)
                        TABLE 209 LATIN AMERICA: MARKET, BY ORGANIZATION SIZE, 2017–2020 (USD MILLION)
                        TABLE 210 LATIN AMERICA: MARKET, BY ORGANIZATION SIZE, 2021–2026 (USD MILLION)
                        TABLE 211 LATIN AMERICA: MARKET, BY END USER, 2017–2020 (USD MILLION)
                        TABLE 212 LATIN AMERICA: MARKET, BY END USER, 2021–2026 (USD MILLION)
                        TABLE 213 LATIN AMERICA: MARKET, BY COUNTRY, 2017–2020 (USD MILLION)
                        TABLE 214 LATIN AMERICA: MARKET, BY COUNTRY, 2021–2026 (USD MILLION)
             10.6.3 BRAZIL
                        TABLE 215 BRAZIL: EVENT MANAGEMENT SOFTWARE MARKET, BY COMPONENT, 2017–2020 (USD MILLION)
                        TABLE 216 BRAZIL: MARKET, BY COMPONENT, 2021–2026 (USD MILLION)
                        TABLE 217 BRAZIL: MARKET, BY DEPLOYMENT MODE, 2017–2020 (USD MILLION)
                        TABLE 218 BRAZIL: MARKET, BY DEPLOYMENT MODE, 2021–2026 (USD MILLION)
                        TABLE 219 BRAZIL: MARKET, BY ORGANIZATION SIZE, 2017–2020 (USD MILLION)
                        TABLE 220 BRAZIL: MARKET, BY ORGANIZATION SIZE, 2021–2026 (USD MILLION)
             10.6.4 MEXICO
                        TABLE 221 MEXICO: EVENT MANAGEMENT SOFTWARE MARKET, BY COMPONENT, 2017–2020 (USD MILLION)
                        TABLE 222 MEXICO: MARKET, BY COMPONENT, 2021–2026 (USD MILLION)
                        TABLE 223 MEXICO: MARKET, BY DEPLOYMENT MODE, 2017–2020 (USD MILLION)
                        TABLE 224 MEXICO: MARKET, BY DEPLOYMENT MODE, 2021–2026 (USD MILLION)
                        TABLE 225 MEXICO: MARKET, BY ORGANIZATION SIZE, 2017–2020 (USD MILLION)
                        TABLE 226 MEXICO: MARKET, BY ORGANIZATION SIZE, 2021–2026 (USD MILLION)
             10.6.5 REST OF LATIN AMERICA
                        TABLE 227 REST OF LATIN AMERICA: EVENT MANAGEMENT SOFTWARE MARKET, BY COMPONENT, 2017–2020 (USD MILLION)
                        TABLE 228 REST OF LATIN AMERICA: MARKET, BY COMPONENT, 2021–2026 (USD MILLION)
                        TABLE 229 REST OF LATIN AMERICA: MARKET, BY DEPLOYMENT MODE, 2017–2020 (USD MILLION)
                        TABLE 230 REST OF LATIN AMERICA: MARKET, BY DEPLOYMENT MODE, 2021–2026 (USD MILLION)
                        TABLE 231 REST OF LATIN AMERICA: MARKET, BY ORGANIZATION SIZE, 2017–2020 (USD MILLION)
                        TABLE 232 REST OF LATIN AMERICA: MARKET, BY ORGANIZATION SIZE, 2021–2026 (USD MILLION)

11 COMPETITIVE LANDSCAPE (Page No. - 185)
     11.1 OVERVIEW
     11.2 MARKET EVALUATION FRAMEWORK
             FIGURE 50 MARKET EVALUATION FRAMEWORK, 2019–2021
     11.3 KEY PLAYER STRATEGIES/RIGHT TO WIN
             TABLE 233 OVERVIEW OF STRATEGIES ADOPTED BY KEY EVENT MANAGEMENT SOFTWARE VENDORS
     11.4 REVENUE ANALYSIS
             FIGURE 51 HISTORICAL THREE-YEAR REVENUE ANALYSIS OF LEADING PLAYERS, 2019–2021 (USD BILLION)
     11.5 MARKET SHARE ANALYSIS
             FIGURE 52 EVENT MANAGEMENT SOFTWARE MARKET: MARKET SHARE ANALYSIS, 2021
             TABLE 234 MARKET: DEGREE OF COMPETITION
     11.6 COMPANY EVALUATION QUADRANT
             TABLE 235 COMPANY EVALUATION QUADRANT: CRITERIA
             11.6.1 STARS
             11.6.2 EMERGING LEADERS
             11.6.3 PERVASIVE PLAYERS
             11.6.4 PARTICIPANTS
                        FIGURE 53 MARKET, KEY COMPANY EVALUATION MATRIX, 2021
             11.6.5 COMPANY PRODUCT FOOTPRINT ANALYSIS
                        TABLE 236 COMPANY PRODUCT FOOTPRINT
                        TABLE 237 COMPANY APPLICATION FOOTPRINT
                        TABLE 238 COMPANY INDUSTRY FOOTPRINT
                        TABLE 239 COMPANY REGION FOOTPRINT
     11.7 RANKING OF KEY PLAYERS
             FIGURE 54 RANKING OF KEY PLAYERS IN THE EVENT MANAGEMENT SOFTWARE MARKET, 2021
     11.8 STARTUP/SME EVALUATION MATRIX
             FIGURE 55 STARTUP/SME EVALUATION MATRIX: CRITERIA WEIGHTAGE
             11.8.1 PROGRESSIVE COMPANIES
             11.8.2 RESPONSIVE COMPANIES
             11.8.3 DYNAMIC COMPANIES
             11.8.4 STARTING BLOCKS
                        FIGURE 56 MARKET (GLOBAL) STARTUP/SME COMPANY EVALUATION MATRIX, 2021
             11.8.5 COMPETITIVE BENCHMARKING
                        TABLE 240 EVENT MANAGEMENT MARKET: DETAILED LIST OF KEY STARTUP/SMES
                        TABLE 241 EVENT MANAGEMENT SOFTWARE MARKET: COMPETITIVE BENCHMARKING OF KEY PLAYERS (STARTUPS/SMES)
     11.9 KEY MARKET DEVELOPMENTS
             11.9.1 PRODUCT LAUNCHES & ENHANCEMENTS
                        TABLE 242 PRODUCT LAUNCHES & ENHANCEMENTS, 2020–2021
             11.9.2 DEALS
                        TABLE 243 DEALS, 2019–2022
             11.9.3 OTHERS
                        TABLE 244 OTHERS, 2020–2021

12 COMPANY PROFILES (Page No. - 208)
     12.1 INTRODUCTION
     12.2 KEY PLAYERS
(Business Overview, Products, Solutions & Services, Key Insights, Recent Developments, Response to COVID-19, MnM View)* 
             12.2.1 CVENT
                        TABLE 245 CVENT: BUSINESS OVERVIEW
                        TABLE 246 CVENT: PRODUCTS/SOLUTIONS/SERVICES OFFERED
                        TABLE 247 CVENT: NEW SOLUTION/SERVICE LAUNCHES
                        TABLE 248 CVENT: DEALS
                        TABLE 249 CVENT: OTHERS
             12.2.2 AVENTRI
                        TABLE 250 AVENTRI: BUSINESS OVERVIEW
                        TABLE 251 AVENTRI: PRODUCTS/SOLUTIONS/SERVICES OFFERED
                        TABLE 252 AVENTRI: NEW SOLUTION/SERVICE LAUNCHES
                        TABLE 253 AVENTRI: DEALS
             12.2.3 EVENTBRITE
                        TABLE 254 EVENTBRITE: BUSINESS OVERVIEW
                        FIGURE 57 EVENTBRITE: COMPANY SNAPSHOT
                        TABLE 255 EVENTBRITE: PRODUCTS/SOLUTIONS/SERVICES OFFERED
                        TABLE 256 EVENTBRITE: NEW SOLUTION/SERVICE LAUNCHES
                        TABLE 257 EVENTBRITE: DEALS
             12.2.4 UNGERBOECK
                        TABLE 258 UNGERBOECK: BUSINESS OVERVIEW
                        TABLE 259 UNGERBOECK: PRODUCTS/SOLUTIONS/SERVICES OFFERED
                        TABLE 260 UNGERBOECK: DEALS
             12.2.5 HOPIN
                        TABLE 261 HOPIN: BUSINESS OVERVIEW
                        TABLE 262 HOPIN: PRODUCTS/SOLUTIONS/SERVICES OFFERED
                        TABLE 263 HOPIN: DEALS
                        TABLE 264 HOPIN: OTHERS
             12.2.6 XING EVENTS
                        TABLE 265 XING EVENTS: BUSINESS OVERVIEW
                        TABLE 266 XING EVENTS: PRODUCTS/SOLUTIONS/SERVICES OFFERED
                        TABLE 267 XING EVENTS: NEW SOLUTION/SERVICE LAUNCHES
             12.2.7 BIZZABO
                        TABLE 268 BIZZABO: BUSINESS OVERVIEW
                        TABLE 269 BIZZABO: PRODUCTS/SOLUTIONS/SERVICES OFFERED
                        TABLE 270 BIZZABO: NEW SOLUTION/SERVICE LAUNCHES
                        TABLE 271 BIZZABO: DEALS
                        TABLE 272 BIZZABO: OTHERS
             12.2.8 CERTAIN
                        TABLE 273 CERTAIN: BUSINESS OVERVIEW
                        TABLE 274 CERTAIN: PRODUCTS/SOLUTIONS/SERVICES OFFERED
                        TABLE 275 CERTAIN: NEW SOLUTION/SERVICE LAUNCHES
                        TABLE 276 CERTAIN: DEALS
             12.2.9 RAINFOCUS
                        TABLE 277 RAINFOCUS: BUSINESS OVERVIEW
                        TABLE 278 RAINFOCUS: PRODUCTS/SOLUTIONS/SERVICES OFFERED
                        TABLE 279 RAINFOCUS: NEW SOLUTION/SERVICE LAUNCHES
                        TABLE 280 RAINFOCUS: DEALS
             12.2.10 ACTIVE NETWORK
                        TABLE 281 ACTIVE NETWORK: BUSINESS OVERVIEW
                        TABLE 282 ACTIVE NETWORK: PRODUCTS/SOLUTIONS/SERVICES OFFERED
             12.2.11 EVENTZILLA
             12.2.12 MEETING EVOLUTION
             12.2.13 EVENTMOBI
             12.2.14 ZOHO
             12.2.15 REGPACK
             12.2.16 EVENTBOOKING
             12.2.17 BITRIX24
             12.2.18 ARLO
             12.2.19 WEBMOBI
             12.2.20 TRIPLSEAT
*Details on Business Overview, Products, Solutions & Services, Key Insights, Recent Developments, Rsponse to COVID-19, MnM View might not be captured in case of unlisted companies. 
     12.3 OTHER PLAYERS
             12.3.1 HUBILO
             12.3.2 CIRCA
             12.3.3 HUBB
             12.3.4 ACCELEVENTS
             12.3.5 GLUE UP
             12.3.6 IDLOOM
             12.3.7 EVENTDEX
             12.3.8 EVENT TEMPLE
             12.3.9 WHOVA
             12.3.10 AIRMEET

13 ADJACENT MARKETS (Page No. - 250)
     13.1 INTRODUCTION TO ADJACENT MARKETS
             TABLE 283 ADJACENT MARKETS AND FORECASTS
     13.2 LIMITATIONS
     13.3 EVENT MANAGEMENT SOFTWARE MARKET ECOSYSTEM AND ADJACENT MARKETS
     13.4 CONTRACT MANAGEMENT SOFTWARE MARKET
             13.4.1 CONTRACT MANAGEMENT SOFTWARE MARKET, BY COMPONENT
                        TABLE 284 CONTRACT MANAGEMENT SOFTWARE MARKET, BY COMPONENT, 2017–2024 (USD MILLION)
             13.4.2 CONTRACT MANAGEMENT SOFTWARE MARKET, BY ORGANIZATION SIZE
                        TABLE 285 CONTRACT MANAGEMENT SOFTWARE MARKET, BY ORGANIZATION SIZE, 2017–2024 (USD MILLION)
             13.4.3 CONTRACT MANAGEMENT SOFTWARE MARKET, BY DEPLOYMENT TYPE
                        TABLE 286 CONTRACT MANAGEMENT SOFTWARE MARKET, BY DEPLOYMENT TYPE, 2017–2024 (USD MILLION)
             13.4.4 CONTRACT MANAGEMENT SOFTWARE MARKET, BY BUSINESS FUNCTION
                        TABLE 287 CONTRACT MANAGEMENT SOFTWARE MARKET, BY BUSINESS FUNCTION, 2017–2024 (USD MILLION)
             13.4.5 CONTRACT MANAGEMENT SOFTWARE MARKET, BY VERTICAL
                        TABLE 288 CONTRACT MANAGEMENT SOFTWARE MARKET, BY VERTICAL, 2017–2024 (USD MILLION)
             13.4.6 CONTRACT MANAGEMENT SOFTWARE MARKET, BY REGION
                        TABLE 289 CONTRACT MANAGEMENT SOFTWARE MARKET, BY REGION, 2017–2024 (USD MILLION)
     13.5 WEB CONTENT MANAGEMENT MARKET
             13.5.1 WEB CONTENT MANAGEMENT MARKET, BY COMPONENT
                        TABLE 290 WEB CONTENT MANAGEMENT MARKET, BY COMPONENT, 2016–2020 (USD MILLION)
                        TABLE 291 WEB CONTENT MANAGEMENT MARKET, BY COMPONENT, 2021–2026 (USD MILLION)
             13.5.2 WEB CONTENT MANAGEMENT MARKET, BY ORGANIZATION SIZE
                        TABLE 292 WEB CONTENT MANAGEMENT MARKET, BY ORGANIZATION SIZE, 2016–2020 (USD MILLION)
                        TABLE 293 WEB CONTENT MANAGEMENT MARKET, BY ORGANIZATION SIZE, 2021–2026 (USD MILLION)
             13.5.3 WEB CONTENT MANAGEMENT MARKET, BY DEPLOYMENT MODE
                        TABLE 294 WEB CONTENT MANAGEMENT MARKET, BY DEPLOYMENT MODE, 2016–2020 (USD MILLION)
                        TABLE 295 WEB CONTENT MANAGEMENT MARKET, BY DEPLOYMENT MODE, 2021–2026 (USD MILLION)
             13.5.4 WEB CONTENT MANAGEMENT MARKET, BY APPLICATION
                        TABLE 296 WEB CONTENT MANAGEMENT MARKET, BY APPLICATION, 2016–2020 (USD MILLION)
                        TABLE 297 WEB CONTENT MANAGEMENT MARKET, BY APPLICATION, 2021–2026 (USD MILLION)
             13.5.5 WEB CONTENT MANAGEMENT MARKET, BY VERTICAL
                        TABLE 298 WEB CONTENT MANAGEMENT MARKET, BY VERTICAL, 2016–2020 (USD MILLION)
                        TABLE 299 WEB CONTENT MANAGEMENT MARKET, BY VERTICAL, 2021–2026 (USD MILLION)
             13.5.6 WEB CONTENT MANAGEMENT MARKET, BY REGION
                        TABLE 300 WEB CONTENT MANAGEMENT MARKET, BY REGION, 2016–2020 (USD MILLION)
                        TABLE 301 WEB CONTENT MANAGEMENT MARKET, BY REGION, 2021–2026 (USD MILLION)

14 APPENDIX (Page No. - 259)
     14.1 DISCUSSION GUIDE
     14.2 KNOWLEDGE STORE: MARKETSANDMARKETS’ SUBSCRIPTION PORTAL
     14.3 AVAILABLE CUSTOMIZATIONS
     14.4 RELATED REPORTS
     14.5 AUTHOR DETAILS

The study involved four major activities in estimating the current size of the Event Management Software market. Exhaustive secondary research was done to collect information on the lending industry. The next step was to validate these findings, assumptions, and sizing with industry experts across the value chain using primary research. Both top-down and bottom-up approaches were employed to estimate the total market size. After that, the market breakup and data triangulation procedures were used to estimate the market size of the segments and sub segments of the Event Management Software market.

Secondary Research

The market size of the companies offering event management software solutions and services was arrived at based on the secondary data available through paid and unpaid sources and by analyzing the product portfolios of major companies in the ecosystem and rating the companies based on their product capabilities and business strategies. In the secondary research process, various sources were referred to for identifying and collecting information for the study. Secondary sources included annual reports; press releases and investor presentations of companies; product data sheets, white papers, journals, and certified publications; and articles from recognized authors, government websites, directories, and databases.

Primary Research

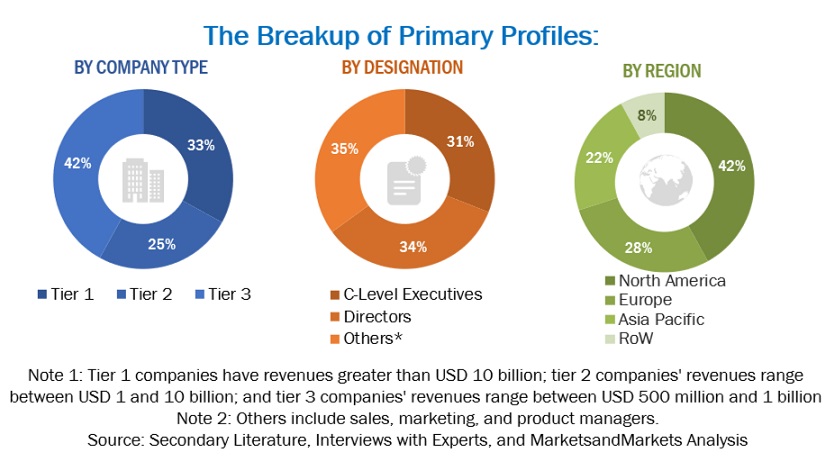
In the primary research process, various primary sources from both supply and demand sides were interviewed to obtain qualitative and quantitative information on the market. The primary sources from the supply side included various industry experts, such as Chief Experience Officers (CXOs), Vice Presidents (VPs), directors from business development, marketing, and product development/innovation teams, and related key executives from event management software vendors, managed event management software providers, industry associations, independent consultants, and key opinion leaders.

Primary interviews have been conducted to gather insights, such as market statistics, latest trends disrupting the market, new use cases implemented, data of revenue collected from the products and services, market breakups, market size estimations, market forecasting, and data triangulation. Primary research also helped understand the various trends related to the technology, application, deployment model, and region. Stakeholders from the demand side, such as Chief Information Officers (CIOs), Chief Technology Officers (CTOs), and Chief Security Officers (CSOs), and installation teams, of governments/end users using event management software solutions, project teams were interviewed to understand the buyer’s perspective on the suppliers, products, service providers, and their current use of solutions, which would affect the overall event management software market.

Event Management Software Market   Size, and Share

To know about the assumptions considered for the study, download the pdf brochure

Market Size Estimation

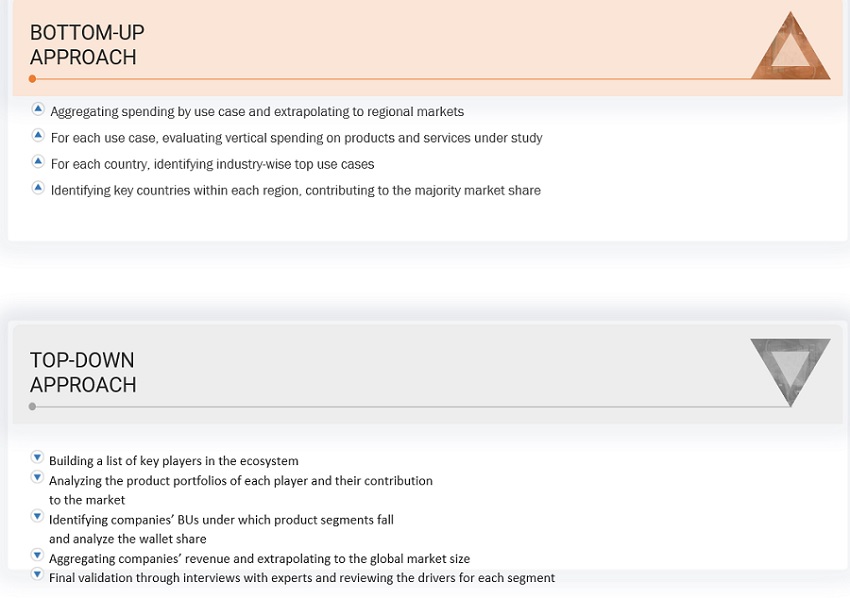
The top-down and bottom-up approaches were used to estimate and validate the size of the Event Management Software market and various other dependent sub-markets in the overall market.

In the top-down approach, an exhaustive list of all vendors offering solutions and services in the event management software market was prepared. The revenue contribution of all vendors in the market was estimated through annual reports, press releases, funding, investor presentations, paid databases, and primary interviews. Both types of vendors that offer event management software as a standalone solution, as well as an integrated solution in event management software offerings, were considered for the evaluation of the market size. Each vendor was evaluated based on its product/solution offerings, services, functions, deployment models, organization size, and end users. The aggregate of all companies’ revenue was extrapolated to reach the overall market size. Each subsegment was studied and analyzed for its market size and regional penetration. The markets were triangulated through both primary and secondary research. The primary procedure included extensive interviews for key insights from industry leaders, such as CEOs, VPs, directors, and marketing executives. These market numbers were further triangulated with the existing MarketsandMarkets’ repository for validation.

In the bottom-up approach, the adoption trend of event management software solutions and services among different verticals in key countries with respect to the regions that contribute to most of the market share was identified. For cross-validation, the adoption trend of solutions, along with different use cases, with respect to their business segments, has been identified and extrapolated. Weightage has been given to the use cases identified in the different application areas for the calculation.

Data Triangulation

After arriving at the overall market size using the market size estimation processes as explained above, the market was split into several segments and subsegments. The data triangulation and market breakup procedures were employed, wherever applicable, to complete the overall market engineering process and arrive at the exact statistics of each market segment and subsegment. The data was triangulated by studying various factors and trends from both the demand and supply sides.

Report Objectives

  • To describe and forecast the global event management software market based on components, deployment modes, organization sizes, end users, and regions.
  • To forecast the market size of the five major regional segments: North America, Europe, Asia Pacific (APAC), the Middle East & Africa (MEA), and Latin America.
  • To strategically analyze the market subsegments with respect to individual growth trends, prospects, and contribution to the total market.
  • To provide detailed information related to the major factors influencing the growth of the market (drivers, restraints, opportunities, and challenges).
  • To analyze the impact of COVID-19 on components, deployment modes, organization sizes, end users, and regions across the globe.
  • To analyze the opportunities in the market for stakeholders and provide details of their competitive landscape for major players.
  • To comprehensively analyze the core competencies of the key players.
  • To track and analyze competitive developments, such as mergers and acquisitions, new product developments, and partnerships and collaborations in the market.

Venue Management Software Market & Its impact on Event Management Software Market:

Venue Management Software is specifically designed to manage the operations of a venue or facility, such as a convention center, stadium, or concert hall. It helps venue managers with tasks like scheduling events, managing reservations, coordinating staff, and tracking inventory. Venue Management Software can also provide data and analytics about venue usage, revenue, and occupancy.

The impact of Venue Management Software on the Event Management Software market is significant. Event Management Software helps event planners plan, organize, and execute events, regardless of the venue. Event planners often use Venue Management Software to search for and book venues that meet their event requirements, such as capacity, location, and availability. Venue Management Software streamlines the venue booking process, making it easier for event planners to find and secure suitable venues for their events.

In addition, many Venue Management Software solutions include basic Event Management features, such as online booking and event scheduling, while many Event Management Software solutions include Venue Management features, such as floorplan management and equipment tracking. This integration between the two markets provides a comprehensive solution for event organizers, improving the efficiency of the event planning and execution process.

Futuristic Growth Use-Cases of Venue Management Software market:

The Venue Management Software market is evolving rapidly and is poised for significant growth in the coming years. Here are some futuristic growth use-cases of the Venue Management Software market:

  1. Smart Venues: The rise of smart venues, equipped with the latest technologies such as IoT, AI, and AR/VR, is expected to drive the growth of the Venue Management Software market.
  2. Sustainability: As sustainability becomes increasingly important, Venue Management Software can be used to manage and reduce the environmental impact of events.
  3. Safety and Security: With the rise of cybersecurity threats and other safety concerns, Venue Management Software can be used to enhance security and safety measures.
  4. Personalization: Personalization is becoming increasingly important in the events industry. Venue Management Software can be used to gather data on attendees' preferences and behaviors, which can be used to personalize the event experience.
  5. Hybrid and Virtual Events: With the rise of hybrid and virtual events, Venue Management Software can be used to manage and integrate digital technologies such as live streaming, video conferencing, and virtual reality.

Some of the top players in the Venue Management Software Market are Eventbrite, Cvent, Ungerboeck, ArtifaxEvent, EventPro, Aventri, Tripleseat, Priava, Gather, Skedda, EventBooking, and Bizzabo.

New Business Opportunities in Venue Management Software Market:

The Venue Management Software market is constantly evolving, and new business opportunities are emerging as the industry grows and changes. Here are some new business opportunities in the Venue Management Software market:

  1. Mobile Applications: There is a growing demand for mobile applications that allow attendees to access information about events, purchase tickets, and interact with event organizers. Companies can develop and market mobile applications that integrate with Venue Management Software, providing attendees with a seamless and personalized experience.
  2. IoT and Smart Venues: As smart venues become more popular, there is an opportunity for companies to develop and market solutions that integrate with Venue Management Software. These solutions can enable venues to monitor and control their facilities, optimize energy usage, and provide a better experience for attendees.
  3. Virtual and Hybrid Events: With the rise of virtual and hybrid events, there is an opportunity for companies to develop and market software solutions that enable event organizers to manage these types of events. This can include software that integrates with Venue Management Software, providing a seamless experience for both in-person and virtual attendees.
  4. Sustainability: As sustainability becomes increasingly important in the events industry, there is an opportunity for companies to develop and market software solutions that enable venues to manage and reduce their environmental impact. This can include software that integrates with Venue Management Software, providing venues with real-time data on energy usage and waste management.
  5. Analytics and Insights: There is a growing demand for analytics and insights that enable event organizers to understand attendee behavior and preferences. Companies can develop and market software solutions that integrate with Venue Management Software, providing event organizers with valuable data and insights.

Industries Getting Impacted in the future by Venue Management Software market:

The Venue Management Software market has the potential to impact various industries in the future. Here are some examples of industries that could be impacted:

  1. Event Management: The Venue Management Software market has already had a significant impact on the event management industry.
  2. Sports and Recreation: Sports facilities and recreation centers can benefit from Venue Management Software by streamlining the booking and scheduling process, managing staff and resources, and tracking finances.
  3. Hospitality: Hotels, resorts, and other hospitality businesses can use Venue Management Software to manage event spaces, book events, and track financials.
  4. Education: Schools and universities can benefit from Venue Management Software by managing event spaces, scheduling events, and tracking finances.
  5. Government: Government entities can use Venue Management Software to manage event spaces, schedule events, and track finances.
  6. Arts and Culture: Arts and cultural institutions, such as museums and theaters, can use Venue Management Software to manage event spaces, schedule events, and track finances.

Future Venue Management Software Market Trends:

Here are some trends that may shape the future of venue management software:

  1. Increased adoption of cloud-based solutions: As more and more businesses move their operations to the cloud, venue management software vendors are also offering cloud-based solutions to meet the demand for remote access, scalability, and cost-effectiveness.
  2. Integration with other software solutions: Venue management software is increasingly being integrated with other software solutions such as CRM, accounting, and marketing automation systems to streamline operations, improve customer experience, and provide real-time insights.
  3. Emphasis on mobile functionality: Venue management software providers are focusing on making their solutions mobile-friendly, allowing staff to access information, manage events, and communicate with customers from anywhere.
  4. Use of AI and automation: The use of AI and automation in venue management software can help automate tasks such as scheduling, reporting, and data analysis, freeing up staff time to focus on more strategic tasks.
  5. Increased focus on data security and compliance: With the increasing amount of sensitive data being collected and stored in venue management software, there is a growing need for strong data security measures and compliance with regulations such as GDPR and CCPA.

Available Customizations

Along with the market data, MarketsandMarkets offers customizations as per the company’s specific needs. The following customization options are available for the report:

Product Analysis

  • Product Matrix which gives a detailed comparison of the product portfolio of each company

Company Information

  • Detailed analysis and profiling of additional market players (up to 5)

Geographic Analysis

  • Further breakup of the Asia Pacific market into countries contributing 75% to the regional market size
  • Further breakup of the North American market into countries contributing 75% to the regional market size
  • Further breakup of the Latin American market into countries contributing 75% to the regional market size
  • Further breakup of the Middle Eastern & African market into countries contributing 75% to the regional market size
  • Further breakup of the European market into countries contributing 75% to the regional market size
Custom Market Research Services

We will customize the research for you, in case the report listed above does not meet with your exact requirements. Our custom research will comprehensively cover the business information you require to help you arrive at strategic and profitable business decisions.

Request Customization

Instant Answers with GPT - Ask Now!

Ask real questions. Get complete answers !
Report Code
TC 2797
Published ON
Feb, 2022
Choose License Type
BUY NOW
  • SHARE
X
Request Customization
Speak to Analyst
Speak to Analyst
OR FACE-TO-FACE MEETING
PERSONALIZE THIS RESEARCH
  • Triangulate with your Own Data
  • Get Data as per your Format and Definition
  • Gain a Deeper Dive on a Specific Application, Geography, Customer or Competitor
  • Any level of Personalization
REQUEST A FREE CUSTOMIZATION
LET US HELP YOU!
  • What are the Known and Unknown Adjacencies Impacting the Event Management Software Market
  • What will your New Revenue Sources be?
  • Who will be your Top Customer; what will make them switch?
  • Defend your Market Share or Win Competitors
  • Get a Scorecard for Target Partners
CUSTOMIZED WORKSHOP REQUEST
+1-888-600-6441
  • Call Us
  • +1-888-600-6441 (Corporate office hours)
  • +1-888-600-6441 (US/Can toll free)
  • +44-800-368-9399 (UK office hours)
CONNECT WITH US
ABOUT TRUST ONLINE
©2024 MarketsandMarkets Research Private Ltd. All rights reserved
DMCA.com Protection Status Website Feedback