Enterprise Content Management Market by Offering (Solutions (Document Management, Case Management, Record Management, Imaging & Capturing)), Business Function (Sales & Marketing, Accounting & Legal, Procurement & SCM) - Global Forecast to 2029
[354 Pages Report] The global enterprise content management market will grow from USD 47.6 billion in 2024 to USD 78.4 billion by 2029 at a compounded annual growth rate (CAGR) of 10.5% during the forecast period.
The growth of enterprise content management (ECM) is significantly enhanced by the integration of advanced technologies such as business process management (BPM), 5G, automation, natural language processing (NLP), and cloud computing. BPM complements ECM by streamlining and automating complex workflows, ensuring that content management processes are efficient and aligned with business goals. This integration allows for better resource allocation, faster decision-making, and improved compliance management. The advent of 5G technology further amplifies ECM capabilities by providing high-speed connectivity, enabling real-time data processing, and facilitating seamless access to content from any location. This is particularly beneficial for industries that require instantaneous data access and collaboration, such as healthcare, finance, and manufacturing.
Moreover, automation and NLP are transforming ECM by automating routine tasks and enhancing data extraction and analysis. Automation tools reduce manual effort in document handling, indexing, and retrieval, thereby increasing operational efficiency and reducing errors. NLP enables ECM systems to understand and process human language, improving the accuracy of information categorization and search capabilities. This technology is instrumental in managing large volumes of unstructured data, such as emails and social media content. Lastly, cloud computing is another critical driver of ECM growth, offering scalable storage solutions and ensuring that content is accessible, secure, and backed up. Cloud-based ECM solutions support remote work and global collaboration by allowing users to access and share documents from anywhere. Together, these technologies are propelling the evolution of ECM, making it a more powerful tool for enhancing productivity, ensuring compliance, and driving innovation across various sectors.
To know about the assumptions considered for the study, Request for Free Sample Report
To know about the assumptions considered for the study, download the pdf brochure
Enterprise Content Management Market Dynamics
Driver: Increased need for compliance and audit management to enhance corporate governance
The enterprise content management market is witnessing a significant surge in the demand for compliance and audit management solutions, driven by the increased emphasis on corporate governance. Companies face mounting pressure to adhere to regulatory standards and demonstrate transparency in their operations. As a result, there is a growing need for ECM solutions that offer robust compliance features, enabling organizations to manage and track regulatory requirements effectively. In today's business landscape, regulatory compliance is no longer just a box to check—it's a critical component of corporate governance. Non-compliance can lead to severe penalties, reputational damage, and legal consequences. Therefore, businesses invest in ECM systems that provide comprehensive audit trails, document management capabilities, and automated compliance workflows.
Moreover, enhanced compliance and audit management ensure adherence to regulatory mandates and contribute to improved information governance. By centralizing document storage, enforcing access controls, and facilitating secure collaboration, ECM solutions empower organizations to maintain data integrity and mitigate risks associated with non-compliance. Overall, the increased need for compliance and audit management solutions drives the growth of the enterprise content management market as businesses prioritize robust governance frameworks to navigate an increasingly complex regulatory environment.
Restraint: Misunderstandings regarding data security and privacy risks
Misunderstandings surrounding data security and privacy risks significantly restrain the enterprise content management market. These misconceptions often stem from a lack of awareness or misinformation about the potential threats associated with storing and managing sensitive data. Organizations may need to pay more attention to the likelihood and severity of data breaches, leading them to allocate insufficient resources toward implementing robust ECM solutions.
Another aspect of this restraint is the tendency to overlook the regulatory implications of data security and privacy. Many businesses may need to fully grasp the legal requirements and compliance standards governing the protection of sensitive information. As a result, they may fail to prioritize adequate measures for ensuring compliance with relevant regulations, putting them at risk of penalties and reputational damage in the event of a breach. In summary, misunderstandings regarding data security and privacy risks hinder the implementation of effective ECM solutions. Addressing these misconceptions requires heightened awareness, education, and a proactive approach to data governance to mitigate the associated risks effectively.
Opportunity: Increasing adoption of big data analytics revolutionizing next-gen ECM for improved decision-making
The increasing adoption of big data analytics presents a significant opportunity for the enterprise content management market as organizations seek to leverage data-driven insights for enhanced decision-making. By harnessing advanced analytics techniques, businesses can extract valuable intelligence from vast unstructured content, including documents, emails, and multimedia files. This wealth of information enables them to gain deeper insights into customer behavior, market trends, and operational efficiencies, empowering more informed and strategic decision-making processes.
Moreover, integrating big data analytics with ECM systems enables the development of next-generation solutions that offer enhanced capabilities for managing, analyzing, and extracting actionable insights from diverse data sources. These advanced ECM platforms leverage ML algorithms and NLP techniques to automate content classification, sentiment analysis, and predictive analytics, thereby streamlining decision-making processes across the organization. By harnessing the power of big data analytics, businesses can unlock new opportunities for innovation, competitiveness, and growth in the ever-evolving digital landscape.
Challenge: Lack of skilled workforce and poor management in creating user adoption processes
The enterprise content management market faces challenges from a lack of skilled workforce and inadequate management practices in driving user adoption processes. With the rapid evolution of ECM technologies, there is a growing demand for professionals proficient in ECM implementation, administration, and customization. However, many organizations need help finding individuals with the necessary skills and expertise to deploy and manage ECM solutions effectively. This shortage of skilled workers hampers the successful implementation and utilization of ECM systems, leading to delays, inefficiencies, and underutilization of valuable resources.
Furthermore, poor management practices in creating user adoption processes pose a significant challenge for ECM initiatives. Achieving widespread user acceptance and engagement is essential for the success of ECM projects, yet many organizations need to implement effective strategies for driving user adoption. Inadequate training, communication, and change management efforts can result in resistance to new ECM technologies and workflows, hindering their integration into daily business operations. Overcoming these challenges requires organizations to prioritize investment in training and development programs, establish clear communication channels, and change management protocols to foster a culture of user adoption and collaboration around ECM initiatives.
Enterprise Content Management Market Ecosystem
Based on the vertical, the retail & consumer goods vertical is expected to dominate the market during the forecast period.
Based on the vertical, the enterprise content management market is segmented into BFSI, retail & consumer goods, IT & ITeS, telecommunications, healthcare & life sciences, manufacturing, energy & utilities, media & entertainment, government & public sector, and other verticals. Retail & consumer goods are expected to hold the largest market share during the forecast period. ECM is pivotal in managing vast digital content, including product information, marketing collateral, and customer data in the retail and consumer goods vertical. ECM streamlines content creation, approval processes, and distribution workflows, ensuring consistent and accurate product information across multiple channels, such as websites, mobile apps, and physical stores. It enhances collaboration among merchandising, marketing, and sales teams, facilitating quicker decision-making and time-to-market for new products. Additionally, ECM supports regulatory compliance by managing documentation related to product safety standards, supply chain transparency, and consumer data privacy regulations such as GDPR. Overall, ECM in retail and consumer goods optimizes operational efficiency, enhances customer experiences, and enables organizations to stay competitive in the fast-paced market.
Based on the organization's size, the SME segment is expected to have the highest CAGR growth rate during the forecast period.
The enterprise content management market by organization size is segmented into large enterprises and SMEs. As per the organization size, the SME segment is expected to hold the highest CAGR during the forecast period. ECM managers are the ones who make SMEs use their digital content and information more efficiently by helping them manage and turn it into their advantage. ECM solutions make SMEs' digital assets management, such as documents, data, and other digital assets, more organized, stored, and retrieved to share as needed. By establishing ECM systems, SMEs can automate their core business functions, facilitate effective collaboration among members, and increase organizational productivity accordingly. Through document management, workflow automation, version control, and document security, ECM solutions for SMEs give businesses the means to deal with the organization's content during its lifecycle.
Furthermore, the ECM services often integrate functions such as implementation, customization, training, and ongoing help, which help SMEs fully exploit their ECM systems' capabilities. The businesses SMEs, in particular, can benefit from significant savings in lowering operations costs, maximizing efficiency, reducing manual tasks, reducing error risk, and compliance with industry rules and regulations with ECM solutions and services. Via ECM, SMEs can grow into productive, scalable, and thriving organizations in the digital business ecosystem.
Based on the business function, human resources will dominate the market during the forecast period.
The enterprise content management market is segmented into human resources, sales & marketing, accounting & legal, procurement & supply chain management, and other business functions based on the business function. Human resources are expected to hold the largest market share during the forecast period. At the level of HR business operations, ECM plays a significant role in HR processes organization, productivity enhancement, and compliance with regulatory bodies' requirements. ECM solutions allow HR departments to measure the lifecycle of documents while helping them manage all employee-related documents, such as resumes, applications, contracts, employee performance evaluations, and training material. Through ECM systems, reliable repositories for all HR-related documentation are provided. This simplifies document management processes by putting the necessary documents right at the fingertips of the HR professional so that they can effortlessly search, access, and retrieve employee-related information quickly and accurately. Besides that, ECM solutions automate workflow management processes, which are tasks such as employee onboarding, performance assessment, and training. This leads to less manual tasks. In addition, ECM solutions simplify the functions of the HR departments for security and meeting regulatory requirements by helping in the secure storage and management of sensitive employee data, enforcing retention policies, and providing audit trails for tracking document access and changes. Overall, ECM solutions are a great asset to the HR departments. Their productivity improvements, cost-cutting, and risk mitigation help HR focus on strategic HR initiatives and benefit the organization.
The US market contributes the largest share of North America's enterprise content management market.
North America is expected to lead the enterprise content management market in 2024. The US is estimated to account for the largest market share in North America in 2024, the enterprise content management market, and the trend is expected to continue until 2029. ECM solutions and services play a crucial role in the US region, helping organizations efficiently manage, store, and secure their digital content. These solutions streamline document management, record management, digital asset management, and workflow automation processes, ensuring regulatory compliance and improving collaboration and productivity. With the increasing volume of digital content generated by businesses, the demand for ECM solutions has been steadily growing, particularly in healthcare, finance, government, and manufacturing industries.
Key companies operating in the US enterprise content management market include IBM Corporation, OpenText Corporation, Microsoft Corporation, Oracle Corporation, and Hyland Software. These companies offer a wide range of ECM solutions and services, catering to the diverse needs of organizations across different industries. With the growing importance of efficient content management and the increasing digitization of businesses, the ECM market in the US is expected to continue its growth trajectory in the coming years.
Enterprise Content Management Companies
The enterprise content management market is dominated by a few globally established players such as Microsoft (US), OpenText (US), Box (US), Hyland (US), IBM (US), Adobe (US), Xerox (US), Atlassian (Australia), KYOCERA (JAPAN), and Oracle (US) among others, are the key vendors that secured enterprise content management contracts in last few years. Local participants only have local experience, while these vendors can add global processes and execution expertise. Customers are likelier to try new things in the enterprise content management market because of their higher discretionary budgets, ease of access to information, and quick adoption of technical items.
Want to explore hidden markets that can drive new revenue in Enterprise Content Management Market?
Scope of the Report
Want to explore hidden markets that can drive new revenue in Enterprise Content Management Market?
Report Metrics |
Details |
Market size available for years |
2019–2029 |
Base year considered |
2023 |
Forecast period |
2024–2029 |
Forecast units |
Value (USD Million/Billion) |
Segments Covered |
Offering, Organization Size, Business Function, Deployment Mode, and Vertical |
Geographies Covered |
North America, Europe, Asia Pacific, Middle East Africa, and Latin America |
List of Companies in Enterprise Content Management |
Some of the significant enterprise content management market vendors are Microsoft (US), OpenText (Canada), Box (US), Hyland (US), IBM (US), Adobe (US), Xerox (US), Atlassian (Australia), KYOCERA Corporation (Japan), and Oracle (US). |
This research report categorizes the enterprise content management market based on offering, organization size, business function, deployment mode, vertical, and region.
Based on the Offering:
-
Solution
- Document Management
- Case Management
- Record Management
- Imaging & Capturing
- Web & Mobile Content Management
- Digital Asset Management
- Collaborative Content Management
- eDiscovery
- Other Solutions
-
Services
-
Professional Services
- Deployment & Integration
- Training & Consulting
- Support & Maintenance
-
Managed Services
- Content Analytics & Reporting
- Managed Print & Output Services
- Content Migration Services
-
Professional Services
Based on the Business Function:
- Human Resources
- Sales & Marketing
- Accounting & Legal
- Procurement & Supply Chain Management
- Other Business Functions
Based on the Deployment Mode:
- Cloud
- On-premises
Based on the Organization Size:
- Large Enterprises
- SMEs
Based on the Vertical:
- BFSI
- Retail & Consumer Goods
- IT & ITeS
- Telecommunications
- Healthcare & Life Sciences
- Manufacturing
- Energy & Utilities
- Media & Entertainment
- Government & Public Sector
- Other Verticals
Based on the Region:
-
North America
- US
- Canada
-
Europe
- UK
- Germany
- France
- Italy
- Rest of Europe
-
Asia Pacific
- China
- Japan
- Australia & New Zealand
- Rest of Asia Pacific
-
Middle East & Africa
-
Gulf Cooperation Councils (GCC)
- Kingdom of Saudi Arabia
- United Arab Emirates
- Rest of GCC Countries
- South Africa
- Rest of the Middle East Africa
-
Gulf Cooperation Councils (GCC)
-
Latin America
- Brazil
- Mexico
- Rest of Latin America
Recent Developments:
- In April 2024, Hyland, a leading global provider of intelligent content solutions, launched Hyland Experience Automate (Hx Automate). This service is one of the first available from the next-generation, cloud-based platform, Hyland Experience (Hx). This new service is compatible with existing Hyland platforms, allowing customers to leverage the latest innovation from Hyland Experience while maximizing the value of their current solutions.
- In April 2024, Box announced its collaboration with Bulletproof, an award-winning independent global brand agency, which selected Box as its single centralized cloud platform to manage content and production work. Bulletproof is deploying Box across the organization to eliminate on-premise servers and facilitate secure collaboration with clients and partners.
- In February 2024, Microsoft announced its collaboration with SysKit, a company dedicated to simplifying management and governance in Microsoft 365, and announced the availability of Syskit Point on Microsoft AppSource. This integration underscores SysKit Point's commitment to providing seamless experiences for Office 365 users, empowering them with robust tools to optimize their governance, security, and compliance efforts within the Microsoft environment.
- In January 2024, Oracle's content management enabled users to export and import repository content. The Export Jobs and Import Jobs pages would allow users to track new jobs.
- In January 2024, Datamax extended its strategic partnership with KYOCERA. This partnership further bolsters Datamax's ability to adhere to its tagline, "Relevant Technology. Raving Results."
Frequently Asked Questions (FAQ):
What is enterprise content management?
Enterprise Content Management (ECM) is a comprehensive approach to managing the digital content lifecycle within an organization, encompassing creation, capture, storage, retrieval, and distribution. It uses specialized software and strategies to organize, secure, and leverage content assets, including documents, images, videos, and other digital files. ECM aims to improve business processes by providing centralized access to information, facilitating user collaboration, and ensuring compliance with regulatory requirements. It enables organizations to streamline workflows, reduce operational costs, mitigate risks, and enhance decision-making by effectively managing and utilizing their content resources.
Which country was the early adopter of enterprise content management?
The US was at the initial stage of adopting enterprise content management.
Which are the key vendors exploring enterprise content management?
Some of the significant vendors offering enterprise content management worldwide include Microsoft (US), OpenText (Canada), Box (US), Hyland (US), IBM (US), Adobe (US), Xerox (US), Atlassian (Australia), KYOCERA Corporation (Japan), and Oracle (US).
What is the total CAGR recorded for the enterprise content management market from 2024 to 2029?
The enterprise content management market will record a CAGR of 10.5% from 2024 to 2029.
Who are vital clients adopting the enterprise content management market?
- Training and consulting service providers
- Information Technology (IT) infrastructure providers
- ECM solutions providers
- ECM service providers
- Government organizations and standardization bodies
- Regional associations
- ECM vendors
- Value-added resellers and distributors
To speak to our analyst for a discussion on the above findings, click Speak to Analyst
Exclusive indicates content/data unique to MarketsandMarkets and not available with any competitors.
- 5.1 INTRODUCTION
-
5.2 MARKET DYNAMICSDRIVERS- Increased need for compliance and audit management to enhance corporate governance- Growing need to enhance content security and optimize business processes with automated workflows- Better backup and disaster recovery- Compelling need to drive CSR with green business practicesRESTRAINTS- Misconceptions regarding data security and privacy risks- Challenges regarding stringent government rules and regulationsOPPORTUNITIES- Increasing adoption of big data analytics revolutionizing next-gen ECM for improved decision-making- Rising trend of AI-integrated ECM- Growing inclination toward RPACHALLENGES- Lack of skilled workforce and poor management in creating user adoption processes- Complexities in integrating and implementing ECM into existing applications
-
5.3 CASE STUDY ANALYSISLEGAL AID WESTERN AUSTRALIA IMPROVED INFORMATION FLOW BY DEPLOYING OPENTEXT EXTENDED ECMPOWERSOUTH ENERGY COOPERATIVE USED IBM DATACAP TO CAPTURE ALL INBOUND DOCUMENTSDEPARTMENT OF CONSERVATION, NEW ZEALAND, ENABLED SEARCHING AND SHARING DOCUMENTS THROUGH ORACLE CONTENT MANAGEMENT CLOUD SERVICEMITANI STREAMLINED QA PROCESSES AND REDUCED POTENTIAL FOR ERRORS BY INTEGRATING M-FILES INTELLIGENT INFORMATION MANAGEMENT SYSTEMSMITSUBISHI ELECTRIC POWER PRODUCTS DROVE NORTH AMERICAN ENERGY, RAIL TRANSPORTATION, AND LARGE-SCALE VIDEO DISPLAY MARKETS THROUGH AGILITY CMS
- 5.4 ECOSYSTEM ANALYSIS
- 5.5 VALUE CHAIN ANALYSIS
-
5.6 PRICING ANALYSISAVERAGE SELLING PRICE TREND OF KEY PLAYERS, BY SOLUTIONAVERAGE SELLING PRICE TREND OF KEY PLAYERS, BY ORGANIZATION SIZE
- 5.7 PATENT ANALYSIS
-
5.8 TECHNOLOGY ANALYSISKEY TECHNOLOGIES- Cloud computing- Natural Language Processing (NLP)- Data analyticsCOMPLEMENTARY TECHNOLOGIES- AI & automation- BlockchainADJACENT TECHNOLOGIES- 5G technology- Business Process Management (BPM)
-
5.9 REGULATORY LANDSCAPEREGULATORY BODIES, GOVERNMENT AGENCIES, AND OTHER ORGANIZATIONSREGULATIONS, BY REGION- North America- Europe- Asia Pacific- Middle East & South Africa- Latin AmericaREGULATORY IMPLICATIONS AND INDUSTRY STANDARDS- General Data Protection Regulation (GDPR)- SEC Rule 17a-4- ISO/IEC 27001- System and Organization Controls 2 type II compliance- Financial Industry Regulatory Authority (FINRA)- Freedom of Information Act (FOIA)- Health Insurance Portability and Accountability Act (HIPAA)
-
5.10 PORTER’S FIVE FORCES’ ANALYSISTHREAT OF NEW ENTRANTSTHREAT OF SUBSTITUTESBARGAINING POWER OF SUPPLIERSBARGAINING POWER OF BUYERSINTENSITY OF COMPETITIVE RIVALRY
- 5.11 KEY CONFERENCES AND EVENTS
- 5.12 TRENDS/DISRUPTIONS IMPACTING CUSTOMERS’ BUSINESSES
-
5.13 KEY STAKEHOLDERS AND BUYING CRITERIAKEY STAKEHOLDERS IN BUYING PROCESS
- 5.14 BUYING CRITERIA
-
5.15 BUSINESS MODEL ANALYSISPARTNERSHIP & INTEGRATION MODELOPEN-SOURCE ECM SOLUTIONSON-PREMISES SOFTWARE MODEL
- 5.16 INVESTMENT AND FUNDING SCENARIO
- 5.17 FUTURE OF ENTERPRISE CONTENT MANAGEMENT
-
6.1 INTRODUCTIONOFFERINGS: ENTERPRISE CONTENT MANAGEMENT DATA TYPES- Structured data- Unstructured dataOFFERINGS: ENTERPRISE CONTENT MANAGEMENT COMPONENTSOFFERINGS: ENTERPRISE CONTENT MANAGEMENT MARKET DRIVERS
-
6.2 SOLUTIONSDOCUMENT MANAGEMENT- Rising focus on storing, accessing, managing, controlling, and tracking digital documents to drive market- Document capture & imaging- Document storage & repository management- Document retrieval & version control- Document collaboration & sharing- Document workflow & automationCASE MANAGEMENT- Need to increase productivity and ensure continuity with complete view of information to create demand for case management solutions- Case creation & initiation- Case workflow & task management- Case communication & collaborationRECORD MANAGEMENT- Enterprise records management to eliminate missing values, inconsistent data types, and redundant data- Record storage & repository management- Record retrieval & access control- Record audit & compliance- Record retentionIMAGING & CAPTURING- Document imaging & capturing solutions to capture, store, and process enterprise content and deliver them to automate and control content-related processes- Imaging processing & enhancement- Image capture & scanning- Image storage & repository managementWEB & MOBILE CONTENT MANAGEMENT- Web and mobile CMSs to help organizations shorten content creation and publishing process- Web content authoring- Content delivery & distribution- Mobile content managementDIGITAL ASSET MANAGEMENT- Digital asset management software to facilitate easy storage, collaboration, and management of digital assets- Asset storage & organization- Asset search & retrieval- Asset preview & collaborationCOLLABORATIVE CONTENT MANAGEMENT- Collaborative content management to help share documents, smoothen communication, and improve teamwork- Version control & document management- Document sharing & co-authoring- Compliance & securityEDISCOVERY- eDiscovery to simplify mining of electronically stored information and find relevant information faster and using fewer resources- Data identification & collection- Data processing & analysis- Search & retrieval capabilitiesOTHER SOLUTIONS
-
6.3 SERVICESPROFESSIONAL SERVICES- Professional services to assist organizations with implementation, customization, and optimization of their ECM solutions- Training & consulting- Support & maintenance- Deployment & integrationMANAGED SERVICES- Growing concern over lowering labor costs and eliminating cost of hiring and training new IT staff to drive market- Content analytics & reporting- Managed print & output services- Content migration services
-
7.1 INTRODUCTIONBUSINESS FUNCTIONS: ENTERPRISE CONTENT MANAGEMENT MARKET DRIVERS
-
7.2 HUMAN RESOURCESENTERPRISE CONTENT MANAGEMENT SOLUTIONS TO HELP HUMAN RESOURCES DEPARTMENTS MEASURE LIFE CYCLE OF DOCUMENTS AND MANAGE ALL EMPLOYEE-RELATED DOCUMENTSEMPLOYEE RECORDS MANAGEMENTRECRUITMENT & ONBOARDINGPERFORMANCE MANAGEMENTOTHER HUMAN RESOURCE BUSINESS FUNCTIONS
-
7.3 SALES & MARKETINGENTERPRISE CONTENT MANAGEMENT APPLICATIONS TO HELP OPTIMIZE MARKETING AND SALES DISTRIBUTION ACTIVITIES BY PROVIDING UNCOMPLICATED AND HASSLE-FREE SOLUTIONSPRODUCT INFORMATION MANAGEMENT (PIM)LEAD & OPPORTUNITY MANAGEMENTCUSTOMER ENGAGEMENT & COMMUNICATIONOTHER SALES & MARKETING BUSINESS FUNCTIONS
-
7.4 ACCOUNTING & LEGALENTERPRISE CONTENT MANAGEMENT SYSTEMS TO AUTOMATIZE FINANCIAL PROCESSES, ACHIEVE EFFICIENCY AND COST REDUCTION, AND PREVENT COMPLIANCE RISKSFINANCIAL DOCUMENT MANAGEMENTFINANCIAL REPORTING & COMPLIANCELITIGATION & CASE MANAGEMENTOTHER ACCOUNTING & LEGAL BUSINESS FUNCTIONS
-
7.5 PROCUREMENT & SUPPLY CHAIN MANAGEMENTCUSTOMIZED ENTERPRISE CONTENT MANAGEMENT SOLUTIONS TO HELP OPTIMIZE SUPPLY CHAIN ACTIVITIES AND IMPROVE DEMAND FORECASTS BY CORRELATING HISTORICAL DATAPURCHASE ORDER & INVOICE MANAGEMENTINVENTORY & LOGISTICS MANAGEMENTQUALITY & COMPLIANCE MANAGEMENTOTHER PROCUREMENT & SUPPLY CHAIN MANAGEMENT BUSINESS FUNCTIONS
- 7.6 OTHER BUSINESS FUNCTIONS
-
8.1 INTRODUCTIONDEPLOYMENT MODES: ENTERPRISE CONTENT MANAGEMENT MARKET DRIVERS
-
8.2 CLOUDCOST-EFFECTIVENESS, EASY ACCESS, AND SCALABILITY TO BOOST ADOPTION OF CLOUD ENTERPRISE CONTENT MANAGEMENT SOLUTIONS
-
8.3 ON-PREMISESRISING FOCUS ON SECURITY AND COMPLIANCE TO FUEL DEMAND FOR ON-PREMISES ECM SOLUTIONS
-
9.1 INTRODUCTIONORGANIZATION SIZES: ENTERPRISE CONTENT MANAGEMENT MARKET DRIVERS
-
9.2 SMALL AND MEDIUM-SIZED ENTERPRISESNEED TO AUTOMATE CORE BUSINESS FUNCTIONS, FACILITATE EFFECTIVE COLLABORATION, AND INCREASE ORGANIZATIONAL PRODUCTIVITY TO PROPEL MARKET
-
9.3 LARGE ENTERPRISESECM SOLUTIONS TO STREAMLINE BUSINESS PROCESSES, IMPROVE COLLABORATION AMONG TEAMS, AND ENSURE COMPLIANCE WITH REGULATORY REQUIREMENTS
-
10.1 INTRODUCTIONVERTICALS: ENTERPRISE CONTENT MANAGEMENT MARKET DRIVERS
-
10.2 BFSIENTERPRISE CONTENT MANAGEMENT SOLUTIONS TO ENABLE FAST RETRIEVAL OF INFORMATION, BETTER DECISION-MAKING PROCESSES, DATA SECURITY, AND COMPLIANCE WITH REGULATIONSBFSI: USE CASES- Regulatory document management- Digital customer onboarding- Loan document management
-
10.3 IT & ITESNEED TO MANAGE IT SERVICE DELIVERY AND ENHANCE CUSTOMER EXPERIENCE TO PROPEL MARKETIT & ITES: USE CASES- IT operations documentation & support- IT training & certification- Vendor contracts and procurement documents
-
10.4 HEALTHCARE & LIFE SCIENCESGROWING NEED TO LEVERAGE DATA TO CONTROL FRAUD, ENHANCE PATIENT EXPERIENCE, AND OFFER PERSONALIZED TREATMENT IN REAL TIME TO DRIVE MARKETHEALTHCARE & LIFE SCIENCES: USE CASES- Medical imaging & diagnostic data- EHR & medical documentation- Research data & clinical trials
-
10.5 MANUFACTURINGDEMAND FOR AUTOMATING WORKFLOWS FOR PROCURE-TO-PAY, PRODUCT LIFE CYCLE MANAGEMENT, AND ORDER-TO-CASH PROCESSES TO DRIVE MARKETMANUFACTURING: USE CASES- Product documentation & design- Quality assurance & compliance- Employee training & safety
-
10.6 GOVERNMENT & PUBLIC SECTORNEED TO ACCESS GOVERNMENT DATA FROM ANY DEVICE OR LOCATION SECURELY TO SPUR MARKET GROWTHGOVERNMENT & PUBLIC SECTOR: USE CASES- Regulatory compliance & policy management- Public services & citizen engagement- Data security & privacy
-
10.7 TELECOMMUNICATIONSNEED TO MANAGE INNOVATION, CUSTOMER SERVICE, INFRASTRUCTURE SETUP, AND HUMAN RESOURCES TO FOSTER MARKET GROWTHTELECOMMUNICATIONS: USE CASES- Network & infrastructure management- Regulatory compliance & reporting- Training material & certification
-
10.8 MEDIA & ENTERTAINMENTGROWING NEED TO STORE MASSIVE VOLUMES OF DIGITAL DATA AND ENSURE ENHANCED WORKFLOW TO PROPEL MARKETMEDIA & ENTERTAINMENT: USE CASES- Content production & collaboration- Rights & licensing management- Content distribution & monetization
-
10.9 RETAIL & CONSUMER GOODSENTERPRISE CONTENT MANAGEMENT SOLUTIONS TO SEAMLESSLY INTEGRATE AND DIGITALIZE INFORMATION AND SERVE AS CENTRAL REPOSITORYRETAIL & CONSUMER GOODS: USE CASES- Product management- Inventory & supply chain management- CRM
-
10.10 ENERGY & UTILITIESRISING NEED TO MANAGE LARGE VOLUMES OF MISSION-CRITICAL CONTENT IN REAL TIME TO FOSTER MARKET GROWTHENERGY & UTILITIES: USE CASES- Asset management- Data analytics & reporting- Project & construction management
- 10.11 OTHER VERTICALS
- 11.1 INTRODUCTION
-
11.2 NORTH AMERICANORTH AMERICA: ENTERPRISE CONTENT MANAGEMENT MARKET DRIVERSNORTH AMERICA: RECESSION IMPACTUS- Presence of major ECM providers and increasing generation of digital content to drive marketCANADA- Increased adoption of cloud-based technologies and data compliance practices to boost market growth
-
11.3 EUROPEEUROPE: ENTERPRISE CONTENT MANAGEMENT MARKET DRIVERSEUROPE: RECESSION IMPACTUK- Need to enhance performance and increase operational efficiency to fuel demand for ECM solutionsGERMANY- Government initiatives to promote and support digital transformation by adopting innovative technologies to propel marketFRANCE- Government’s investment in digitalization and focus on digital experience and infrastructure development to spur market growthITALY- Significant investments and practical & innovative strategies to boost demand for ECM solutionsREST OF EUROPE
-
11.4 ASIA PACIFICASIA PACIFIC: ENTERPRISE CONTENT MANAGEMENT MARKET DRIVERSASIA PACIFIC: RECESSION IMPACTCHINA- Increased adoption of new technologies and rapid evolution in consumer behavior to accelerate market growthJAPAN- Rising investment in cloud and ECM solutions and presence of technologically advanced manufacturing companies to foster market growthAUSTRALIA & NEW ZEALAND- Growing instances of ransomware and DDoS attacks and demand for secure content management to fuel demand for ECM solutionsREST OF ASIA PACIFIC
-
11.5 MIDDLE EAST & AFRICAMIDDLE EAST & AFRICA: ENTERPRISE CONTENT MANAGEMENT MARKET DRIVERSMIDDLE EAST & AFRICA: RECESSION IMPACTGULF COOPERATION COUNCIL COUNTRIES- Rapid digitization of businesses and government services to fuel demand for ECM solutions- KSA- UAE- Rest of GCC countriesSOUTH AFRICA- Need for records management and document management and implementation of ‘Inclusive Digital Transformation’ initiative to drive marketREST OF MIDDLE EAST & AFRICA
-
11.6 LATIN AMERICALATIN AMERICA: ENTERPRISE CONTENT MANAGEMENT MARKET DRIVERSLATIN AMERICA: RECESSION IMPACTBRAZIL- Rapid digital transformation initiatives and need to strengthen digital security to fuel demand for ECM solutionsMEXICO- Availability of technical expertise, high adoption rate of IoT, and proximity to US to boost demand for ECM solutionsREST OF LATIN AMERICA
- 12.1 OVERVIEW
- 12.2 KEY PLAYER STRATEGIES/RIGHT TO WIN
- 12.3 MARKET SHARE ANALYSIS
- 12.4 BRAND/PRODUCT COMPARISON
- 12.5 REVENUE ANALYSIS
-
12.6 COMPANY EVALUATION MATRIX: KEY PLAYERSSTARSEMERGING LEADERSPERVASIVE PLAYERSPARTICIPANTSCOMPANY FOOTPRINT: KEY PLAYERS, 2023
-
12.7 COMPANY EVALUATION MATRIX: START-UPS/SMESPROGRESSIVE COMPANIESRESPONSIVE COMPANIESDYNAMIC COMPANIESSTARTING BLOCKSCOMPETITIVE BENCHMARKING: START-UPS/SMES, 2023
- 12.8 COMPANY VALUATION AND FINANCIAL METRICS
-
12.9 COMPETITIVE SCENARIO AND TRENDSPRODUCT LAUNCHES AND ENHANCEMENTSDEALS
- 13.1 INTRODUCTION
-
13.2 MAJOR PLAYERSMICROSOFT- Business overview- Products/Solutions/Services offered- Recent developments- MnM viewOPENTEXT- Business overview- Products/Solutions/Services offered- Recent developments- MnM viewBOX- Business overview- Products/Solutions/Services offered- Recent developments- MnM viewHYLAND- Business overview- Products/Solutions/Services offered- Recent developments- MnM viewIBM- Business overview- Products/Solutions/Services offered- Recent developments- MnM viewADOBE- Business overview- Products/Solutions/Services offered- Recent developmentsXEROX- Business overview- Products/Solutions/Services offered- Recent developmentsATLASSIAN- Business overview- Products/Solutions/Services offered- Recent developmentsKYOCERA CORPORATION- Business overview- Products/Solutions/Services offered- Recent developmentsORACLE- Business overview- Products/Solutions/Services offered- Recent developments
-
13.3 OTHER PLAYERSIMANAGELASERFICHENEWGEN SOFTWARE TECHNOLOGIESASCEND SOFTWAREM-FILESDOCUWAREOBJECTIVEFABASOFTSER GROUPGRM INFORMATION MANAGEMENTDOMA TECHNOLOGIESSQUARE 9 SOFTWORKSSYSTEMWAREVEEVADOCSENDAODOCSEPHESOFTPAPER ALTERNATIVE SOLUTIONSDMACQ SOFTWAREFILECLOUDRIPCORDSHELFPANDADOCTEMPLAFY
-
14.1 INTRODUCTIONRELATED MARKETSLIMITATIONS
- 14.2 WEB CONTENT MANAGEMENT MARKET
- 14.3 CLOUD ENTERPRISE CONTENT MANAGEMENT MARKET
- 15.1 DISCUSSION GUIDE
- 15.2 KNOWLEDGESTORE: MARKETSANDMARKETS’ SUBSCRIPTION PORTAL
- 15.3 CUSTOMIZATION OPTIONS
- 15.4 RELATED REPORTS
- 15.5 AUTHOR DETAILS
- TABLE 1 USD EXCHANGE RATES, 2018–2023
- TABLE 2 FACTOR ANALYSIS
- TABLE 3 INDICATIVE PRICING ANALYSIS OF ENTERPRISE CONTENT MANAGEMENT MARKET, BY SOLUTION
- TABLE 4 INDICATIVE PRICING ANALYSIS OF KEY VENDORS IN ENTERPRISE CONTENT MANAGEMENT MARKET, BY ORGANIZATION SIZE
- TABLE 5 TOP 10 PATENT APPLICANTS IN ENTERPRISE CONTENT MANAGEMENT MARKET
- TABLE 6 LIST OF MAJOR PATENTS
- TABLE 7 NORTH AMERICA: REGULATORY BODIES, GOVERNMENT AGENCIES, AND OTHER ORGANIZATIONS
- TABLE 8 EUROPE: REGULATORY BODIES, GOVERNMENT AGENCIES, AND OTHER ORGANIZATIONS
- TABLE 9 ASIA PACIFIC: REGULATORY BODIES, GOVERNMENT AGENCIES, AND OTHER ORGANIZATIONS
- TABLE 10 REST OF THE WORLD: REGULATORY BODIES, GOVERNMENT AGENCIES, AND OTHER ORGANIZATIONS
- TABLE 11 PORTER’S FIVE FORCES’ IMPACT ON ENTERPRISE CONTENT MANAGEMENT MARKET
- TABLE 12 MARKET: KEY CONFERENCES AND EVENTS, 2024–2025
- TABLE 13 INFLUENCE OF STAKEHOLDERS ON BUYING PROCESS FOR TOP THREE VERTICALS
- TABLE 14 KEY BUYING CRITERIA FOR TOP THREE VERTICALS
- TABLE 15 MARKET, BY OFFERING, 2019–2023 (USD MILLION)
- TABLE 16 ENTERPRISE CONTENT MANAGEMENT MARKET, BY OFFERING, 2024–2029 (USD MILLION)
- TABLE 17 MARKET, BY SOLUTION, 2019–2023 (USD MILLION)
- TABLE 18 MARKET, BY SOLUTION, 2024–2029 (USD MILLION)
- TABLE 19 SOLUTIONS: MARKET, BY REGION, 2019–2023 (USD MILLION)
- TABLE 20 SOLUTIONS: MARKET, BY REGION, 2024–2029 (USD MILLION)
- TABLE 21 DOCUMENT MANAGEMENT: MARKET, BY REGION, 2019–2023 (USD MILLION)
- TABLE 22 DOCUMENT MANAGEMENT: MARKET, BY REGION, 2024–2029 (USD MILLION)
- TABLE 23 CASE MANAGEMENT: MARKET, BY REGION, 2019–2023 (USD MILLION)
- TABLE 24 CASE MANAGEMENT: MARKET, BY REGION, 2024–2029 (USD MILLION)
- TABLE 25 RECORD MANAGEMENT: MARKET, BY REGION, 2019–2023 (USD MILLION)
- TABLE 26 RECORD MANAGEMENT: MARKET, BY REGION, 2024–2029 (USD MILLION)
- TABLE 27 IMAGING & CAPTURING: MARKET, BY REGION, 2019–2023 (USD MILLION)
- TABLE 28 IMAGING & CAPTURING: ENTERPRISE CONTENT MANAGEMENT MARKET, BY REGION, 2024–2029 (USD MILLION)
- TABLE 29 WEB & MOBILE CONTENT MANAGEMENT: MARKET, BY REGION, 2019–2023 (USD MILLION)
- TABLE 30 WEB & MOBILE CONTENT MANAGEMENT: MARKET, BY REGION, 2024–2029 (USD MILLION)
- TABLE 31 DIGITAL ASSET MANAGEMENT: MARKET, BY REGION, 2019–2023 (USD MILLION)
- TABLE 32 DIGITAL ASSET MANAGEMENT: MARKET, BY REGION, 2024–2029 (USD MILLION)
- TABLE 33 COLLABORATIVE CONTENT MANAGEMENT: MARKET, BY REGION, 2019–2023 (USD MILLION)
- TABLE 34 COLLABORATIVE CONTENT MANAGEMENT: MARKET, BY REGION, 2024–2029 (USD MILLION)
- TABLE 35 EDISCOVERY: MARKET, BY REGION, 2019–2023 (USD MILLION)
- TABLE 36 EDISCOVERY: MARKET, BY REGION, 2024–2029 (USD MILLION)
- TABLE 37 OTHER SOLUTIONS: MARKET, BY REGION, 2019–2023 (USD MILLION)
- TABLE 38 OTHER SOLUTIONS: MARKET, BY REGION, 2024–2029 (USD MILLION)
- TABLE 39 MARKET, BY SERVICE, 2019–2023 (USD MILLION)
- TABLE 40 MARKET, BY SERVICE, 2024–2029 (USD MILLION)
- TABLE 41 SERVICES: MARKET, BY REGION, 2019–2023 (USD MILLION)
- TABLE 42 SERVICES: ENTERPRISE CONTENT MANAGEMENT MARKET, BY REGION, 2024–2029 (USD MILLION)
- TABLE 43 MARKET, BY PROFESSIONAL SERVICE, 2019–2023 (USD MILLION)
- TABLE 44 MARKET, BY PROFESSIONAL SERVICE, 2024–2029 (USD MILLION)
- TABLE 45 PROFESSIONAL SERVICES: MARKET, BY REGION, 2019–2023 (USD MILLION)
- TABLE 46 PROFESSIONAL SERVICES: MARKET, BY REGION, 2024–2029 (USD MILLION)
- TABLE 47 TRAINING & CONSULTING: MARKET, BY REGION, 2019–2023 (USD MILLION)
- TABLE 48 TRAINING & CONSULTING: MARKET, BY REGION, 2024–2029 (USD MILLION)
- TABLE 49 SUPPORT & MAINTENANCE: MARKET, BY REGION, 2019–2023 (USD MILLION)
- TABLE 50 SUPPORT & MAINTENANCE: MARKET, BY REGION, 2024–2029 (USD MILLION)
- TABLE 51 DEPLOYMENT & INTEGRATION: MARKET, BY REGION, 2019–2023 (USD MILLION)
- TABLE 52 DEPLOYMENT & INTEGRATION: MARKET, BY REGION, 2024–2029 (USD MILLION)
- TABLE 53 MANAGED SERVICES: MARKET, BY REGION, 2019–2023 (USD MILLION)
- TABLE 54 MANAGED SERVICES: ENTERPRISE CONTENT MANAGEMENT MARKET, BY REGION, 2024–2029 (USD MILLION)
- TABLE 55 MARKET, BY BUSINESS FUNCTION, 2019–2023 (USD MILLION)
- TABLE 56 MARKET, BY BUSINESS FUNCTION, 2024–2029 (USD MILLION)
- TABLE 57 HUMAN RESOURCES: MARKET, BY REGION, 2019–2023 (USD MILLION)
- TABLE 58 HUMAN RESOURCES: MARKET, BY REGION, 2024–2029 (USD MILLION)
- TABLE 59 SALES & MARKETING: MARKET, BY REGION, 2019–2023 (USD MILLION)
- TABLE 60 SALES & MARKETING: MARKET, BY REGION, 2024–2029 (USD MILLION)
- TABLE 61 ACCOUNTING & LEGAL: MARKET, BY REGION, 2019–2023 (USD MILLION)
- TABLE 62 ACCOUNTING & LEGAL: MARKET, BY REGION, 2024–2029 (USD MILLION)
- TABLE 63 PROCUREMENT & SUPPLY CHAIN MANAGEMENT: MARKET, BY REGION, 2019–2023 (USD MILLION)
- TABLE 64 PROCUREMENT & SUPPLY CHAIN MANAGEMENT: MARKET, BY REGION, 2024–2029 (USD MILLION)
- TABLE 65 OTHER BUSINESS FUNCTIONS: MARKET, BY REGION, 2019–2023 (USD MILLION)
- TABLE 66 OTHER BUSINESS FUNCTIONS: MARKET, BY REGION, 2024–2029 (USD MILLION)
- TABLE 67 MARKET, BY DEPLOYMENT MODE, 2019–2023 (USD MILLION)
- TABLE 68 MARKET, BY DEPLOYMENT MODE, 2024–2029 (USD MILLION)
- TABLE 69 CLOUD: ENTERPRISE CONTENT MANAGEMENT MARKET, BY REGION, 2019–2023 (USD MILLION)
- TABLE 70 CLOUD: MARKET, BY REGION, 2024–2029 (USD MILLION)
- TABLE 71 ON-PREMISES: MARKET, BY REGION, 2019–2023 (USD MILLION)
- TABLE 72 ON-PREMISES: MARKET, BY REGION, 2024–2029 (USD MILLION)
- TABLE 73 MARKET, BY ORGANIZATION SIZE, 2019–2023 (USD MILLION)
- TABLE 74 MARKET, BY ORGANIZATION SIZE, 2024–2029 (USD MILLION)
- TABLE 75 SMALL AND MEDIUM-SIZED ENTERPRISES: MARKET, BY REGION, 2019–2023 (USD MILLION)
- TABLE 76 SMALL AND MEDIUM-SIZED ENTERPRISES: MARKET, BY REGION, 2024–2029 (USD MILLION)
- TABLE 77 LARGE ENTERPRISES: MARKET, BY REGION, 2019–2023 (USD MILLION)
- TABLE 78 LARGE ENTERPRISES: MARKET, BY REGION, 2024–2029 (USD MILLION)
- TABLE 79 MARKET, BY VERTICAL, 2019–2023 (USD MILLION)
- TABLE 80 MARKET, BY VERTICAL, 2024–2029 (USD MILLION)
- TABLE 81 BFSI: ENTERPRISE CONTENT MANAGEMENT MARKET, BY REGION, 2019–2023 (USD MILLION)
- TABLE 82 BFSI: MARKET, BY REGION, 2024–2029 (USD MILLION)
- TABLE 83 IT & ITES: MARKET, BY REGION, 2019–2023 (USD MILLION)
- TABLE 84 IT & ITES: MARKET, BY REGION, 2024–2029 (USD MILLION)
- TABLE 85 HEALTHCARE & LIFE SCIENCES: MARKET, BY REGION, 2019–2023 (USD MILLION)
- TABLE 86 HEALTHCARE & LIFE SCIENCES: MARKET, BY REGION, 2024–2029 (USD MILLION)
- TABLE 87 MANUFACTURING: MARKET, BY REGION, 2019–2023 (USD MILLION)
- TABLE 88 MANUFACTURING: MARKET, BY REGION, 2024–2029 (USD MILLION)
- TABLE 89 GOVERNMENT & PUBLIC SECTOR: MARKET, BY REGION, 2019–2023 (USD MILLION)
- TABLE 90 GOVERNMENT & PUBLIC SECTOR: MARKET, BY REGION, 2024–2029 (USD MILLION)
- TABLE 91 TELECOMMUNICATIONS: MARKET, BY REGION, 2019–2023 (USD MILLION)
- TABLE 92 TELECOMMUNICATIONS: MARKET, BY REGION, 2024–2029 (USD MILLION)
- TABLE 93 MEDIA & ENTERTAINMENT: MARKET, BY REGION, 2019–2023 (USD MILLION)
- TABLE 94 MEDIA & ENTERTAINMENT: MARKET, BY REGION, 2024–2029 (USD MILLION)
- TABLE 95 RETAIL & CONSUMER GOODS: ENTERPRISE CONTENT MANAGEMENT MARKET, BY REGION, 2019–2023 (USD MILLION)
- TABLE 96 RETAIL & CONSUMER GOODS: MARKET, BY REGION, 2024–2029 (USD MILLION)
- TABLE 97 ENERGY & UTILITIES: MARKET, BY REGION, 2019–2023 (USD MILLION)
- TABLE 98 ENERGY & UTILITIES: MARKET, BY REGION, 2024–2029 (USD MILLION)
- TABLE 99 OTHER VERTICALS: MARKET, BY REGION, 2019–2023 (USD MILLION)
- TABLE 100 OTHER VERTICALS: MARKET, BY REGION, 2024–2029 (USD MILLION)
- TABLE 101 MARKET, BY REGION, 2019–2023 (USD MILLION)
- TABLE 102 MARKET, BY REGION, 2024–2029 (USD MILLION)
- TABLE 103 NORTH AMERICA: MARKET, BY OFFERING, 2019–2023 (USD MILLION)
- TABLE 104 NORTH AMERICA: MARKET, BY OFFERING, 2024–2029 (USD MILLION)
- TABLE 105 NORTH AMERICA: MARKET, BY SOLUTION, 2019–2023 (USD MILLION)
- TABLE 106 NORTH AMERICA: MARKET, BY SOLUTION, 2024–2029 (USD MILLION)
- TABLE 107 NORTH AMERICA: MARKET, BY SERVICE, 2019–2023 (USD MILLION)
- TABLE 108 NORTH AMERICA: MARKET, BY SERVICE, 2024–2029 (USD MILLION)
- TABLE 109 NORTH AMERICA: MARKET, BY PROFESSIONAL SERVICE, 2019–2023 (USD MILLION)
- TABLE 110 NORTH AMERICA: MARKET, BY PROFESSIONAL SERVICE, 2024–2029 (USD MILLION)
- TABLE 111 NORTH AMERICA: MARKET, BY BUSINESS FUNCTION, 2019–2023 (USD MILLION)
- TABLE 112 NORTH AMERICA: MARKET, BY BUSINESS FUNCTION, 2024–2029 (USD MILLION)
- TABLE 113 NORTH AMERICA: MARKET, BY ORGANIZATION SIZE, 2019–2023 (USD MILLION)
- TABLE 114 NORTH AMERICA: ENTERPRISE CONTENT MANAGEMENT MARKET, BY ORGANIZATION SIZE, 2024–2029 (USD MILLION)
- TABLE 115 NORTH AMERICA: MARKET, BY DEPLOYMENT MODE, 2019–2023 (USD MILLION)
- TABLE 116 NORTH AMERICA: MARKET, BY DEPLOYMENT MODE, 2024–2029 (USD MILLION)
- TABLE 117 NORTH AMERICA: MARKET, BY VERTICAL, 2019–2023 (USD MILLION)
- TABLE 118 NORTH AMERICA: MARKET, BY VERTICAL, 2024–2029 (USD MILLION)
- TABLE 119 NORTH AMERICA: MARKET, BY COUNTRY, 2019–2023 (USD MILLION)
- TABLE 120 NORTH AMERICA: MARKET, BY COUNTRY, 2024–2029 (USD MILLION)
- TABLE 121 US: MARKET, BY ORGANIZATION SIZE, 2019–2023 (USD MILLION)
- TABLE 122 US: MARKET, BY ORGANIZATION SIZE, 2024–2029 (USD MILLION)
- TABLE 123 US: MARKET, BY DEPLOYMENT MODE, 2019–2023 (USD MILLION)
- TABLE 124 US: MARKET, BY DEPLOYMENT MODE, 2024–2029 (USD MILLION)
- TABLE 125 CANADA: MARKET, BY ORGANIZATION SIZE, 2019–2023 (USD MILLION)
- TABLE 126 CANADA: MARKET, BY ORGANIZATION SIZE, 2024–2029 (USD MILLION)
- TABLE 127 CANADA: MARKET, BY DEPLOYMENT MODE, 2019–2023 (USD MILLION)
- TABLE 128 CANADA: ENTERPRISE CONTENT MANAGEMENT MARKET, BY DEPLOYMENT MODE, 2024–2029 (USD MILLION)
- TABLE 129 EUROPE: MARKET, BY OFFERING, 2019–2023 (USD MILLION)
- TABLE 130 EUROPE: MARKET, BY OFFERING, 2024–2029 (USD MILLION)
- TABLE 131 EUROPE: MARKET, BY SOLUTION, 2019–2023 (USD MILLION)
- TABLE 132 EUROPE: MARKET, BY SOLUTION, 2024–2029 (USD MILLION)
- TABLE 133 EUROPE: MARKET, BY SERVICE, 2019–2023 (USD MILLION)
- TABLE 134 EUROPE: MARKET, BY SERVICE, 2024–2029 (USD MILLION)
- TABLE 135 EUROPE: MARKET, BY PROFESSIONAL SERVICE, 2019–2023 (USD MILLION)
- TABLE 136 EUROPE: MARKET, BY PROFESSIONAL SERVICE, 2024–2029 (USD MILLION)
- TABLE 137 EUROPE: MARKET, BY BUSINESS FUNCTION, 2019–2023 (USD MILLION)
- TABLE 138 EUROPE: ENTERPRISE CONTENT MANAGEMENT MARKET, BY BUSINESS FUNCTION, 2024–2029 (USD MILLION)
- TABLE 139 EUROPE: MARKET, BY ORGANIZATION SIZE, 2019–2023 (USD MILLION)
- TABLE 140 EUROPE: MARKET, BY ORGANIZATION SIZE, 2024–2029 (USD MILLION)
- TABLE 141 EUROPE: MARKET, BY DEPLOYMENT MODE, 2019–2023 (USD MILLION)
- TABLE 142 EUROPE: MARKET, BY DEPLOYMENT MODE, 2024–2029 (USD MILLION)
- TABLE 143 EUROPE: MARKET, BY VERTICAL, 2019–2023 (USD MILLION)
- TABLE 144 EUROPE: MARKET, BY VERTICAL, 2024–2029 (USD MILLION)
- TABLE 145 EUROPE: MARKET, BY COUNTRY, 2019–2023 (USD MILLION)
- TABLE 146 EUROPE: MARKET, BY COUNTRY, 2024–2029 (USD MILLION)
- TABLE 147 UK: MARKET, BY ORGANIZATION SIZE, 2019–2023 (USD MILLION)
- TABLE 148 UK: MARKET, BY ORGANIZATION SIZE, 2024–2029 (USD MILLION)
- TABLE 149 UK: MARKET, BY DEPLOYMENT MODE, 2019–2023 (USD MILLION)
- TABLE 150 UK: MARKET, BY DEPLOYMENT MODE, 2024–2029 (USD MILLION)
- TABLE 151 GERMANY: ENTERPRISE CONTENT MANAGEMENT MARKET, BY ORGANIZATION SIZE, 2019–2023 (USD MILLION)
- TABLE 152 GERMANY: MARKET, BY ORGANIZATION SIZE, 2024–2029 (USD MILLION)
- TABLE 153 GERMANY: MARKET, BY DEPLOYMENT MODE, 2019–2023 (USD MILLION)
- TABLE 154 GERMANY: MARKET, BY DEPLOYMENT MODE, 2024–2029 (USD MILLION)
- TABLE 155 FRANCE: MARKET, BY ORGANIZATION SIZE, 2019–2023 (USD MILLION)
- TABLE 156 FRANCE: MARKET, BY ORGANIZATION SIZE, 2024–2029 (USD MILLION)
- TABLE 157 FRANCE: MARKET, BY DEPLOYMENT MODE, 2019–2023 (USD MILLION)
- TABLE 158 FRANCE: MARKET, BY DEPLOYMENT MODE, 2024–2029 (USD MILLION)
- TABLE 159 ITALY: MARKET, BY ORGANIZATION SIZE, 2019–2023 (USD MILLION)
- TABLE 160 ITALY: MARKET, BY ORGANIZATION SIZE, 2024–2029 (USD MILLION)
- TABLE 161 ITALY: MARKET, BY DEPLOYMENT MODE, 2019–2023 (USD MILLION)
- TABLE 162 ITALY: MARKET, BY DEPLOYMENT MODE, 2024–2029 (USD MILLION)
- TABLE 163 REST OF EUROPE: MARKET, BY ORGANIZATION SIZE, 2019–2023 (USD MILLION)
- TABLE 164 REST OF EUROPE: MARKET, BY ORGANIZATION SIZE, 2024–2029 (USD MILLION)
- TABLE 165 REST OF EUROPE: MARKET, BY DEPLOYMENT MODE, 2019–2023 (USD MILLION)
- TABLE 166 REST OF EUROPE: MARKET, BY DEPLOYMENT MODE, 2024–2029 (USD MILLION)
- TABLE 167 ASIA PACIFIC: ENTERPRISE CONTENT MANAGEMENT MARKET, BY OFFERING, 2019–2023 (USD MILLION)
- TABLE 168 ASIA PACIFIC: MARKET, BY OFFERING, 2024–2029 (USD MILLION)
- TABLE 169 ASIA PACIFIC: MARKET, BY SOLUTION, 2019–2023 (USD MILLION)
- TABLE 170 ASIA PACIFIC: MARKET, BY SOLUTION, 2024–2029 (USD MILLION)
- TABLE 171 ASIA PACIFIC: MARKET, BY SERVICE, 2019–2023 (USD MILLION)
- TABLE 172 ASIA PACIFIC: MARKET, BY SERVICE, 2024–2029 (USD MILLION)
- TABLE 173 ASIA PACIFIC: MARKET, BY PROFESSIONAL SERVICE, 2019–2023 (USD MILLION)
- TABLE 174 ASIA PACIFIC: MARKET, BY PROFESSIONAL SERVICE, 2024–2029 (USD MILLION)
- TABLE 175 ASIA PACIFIC: MARKET, BY BUSINESS FUNCTION, 2019–2023 (USD MILLION)
- TABLE 176 ASIA PACIFIC: MARKET, BY BUSINESS FUNCTION, 2024–2029 (USD MILLION)
- TABLE 177 ASIA PACIFIC: MARKET, BY ORGANIZATION SIZE, 2019–2023 (USD MILLION)
- TABLE 178 ASIA PACIFIC: MARKET, BY ORGANIZATION SIZE, 2024–2029 (USD MILLION)
- TABLE 179 ASIA PACIFIC: MARKET, BY DEPLOYMENT MODE, 2019–2023 (USD MILLION)
- TABLE 180 ASIA PACIFIC: ENTERPRISE CONTENT MANAGEMENT MARKET, BY DEPLOYMENT MODE, 2024–2029 (USD MILLION)
- TABLE 181 ASIA PACIFIC: MARKET, BY VERTICAL, 2019–2023 (USD MILLION)
- TABLE 182 ASIA PACIFIC: MARKET, BY VERTICAL, 2024–2029 (USD MILLION)
- TABLE 183 ASIA PACIFIC: MARKET, BY COUNTRY, 2019–2023 (USD MILLION)
- TABLE 184 ASIA PACIFIC: MARKET, BY COUNTRY, 2024–2029 (USD MILLION)
- TABLE 185 CHINA: MARKET, BY ORGANIZATION SIZE, 2019–2023 (USD MILLION)
- TABLE 186 CHINA: MARKET, BY ORGANIZATION SIZE, 2024–2029 (USD MILLION)
- TABLE 187 CHINA: MARKET, BY DEPLOYMENT MODE, 2019–2023 (USD MILLION)
- TABLE 188 CHINA: MARKET, BY DEPLOYMENT MODE, 2024–2029 (USD MILLION)
- TABLE 189 JAPAN: MARKET, BY ORGANIZATION SIZE, 2019–2023 (USD MILLION)
- TABLE 190 JAPAN: MARKET, BY ORGANIZATION SIZE, 2024–2029 (USD MILLION)
- TABLE 191 JAPAN: MARKET, BY DEPLOYMENT MODE, 2019–2023 (USD MILLION)
- TABLE 192 JAPAN: MARKET, BY DEPLOYMENT MODE, 2024–2029 (USD MILLION)
- TABLE 193 AUSTRALIA & NEW ZEALAND: MARKET, BY ORGANIZATION SIZE, 2019–2023 (USD MILLION)
- TABLE 194 AUSTRALIA & NEW ZEALAND: MARKET, BY ORGANIZATION SIZE, 2024–2029 (USD MILLION)
- TABLE 195 AUSTRALIA & NEW ZEALAND: MARKET, BY DEPLOYMENT MODE, 2019–2023 (USD MILLION)
- TABLE 196 AUSTRALIA & NEW ZEALAND: MARKET, BY DEPLOYMENT MODE, 2024–2029 (USD MILLION)
- TABLE 197 REST OF ASIA PACIFIC: MARKET, BY ORGANIZATION SIZE, 2019–2023 (USD MILLION)
- TABLE 198 REST OF ASIA PACIFIC: MARKET, BY ORGANIZATION SIZE, 2024–2029 (USD MILLION)
- TABLE 199 REST OF ASIA PACIFIC: MARKET, BY DEPLOYMENT MODE, 2019–2023 (USD MILLION)
- TABLE 200 REST OF ASIA PACIFIC: MARKET, BY DEPLOYMENT MODE, 2024–2029 (USD MILLION)
- TABLE 201 MIDDLE EAST & AFRICA: MARKET, BY OFFERING, 2019–2023 (USD MILLION)
- TABLE 202 MIDDLE EAST & AFRICA: ENTERPRISE CONTENT MANAGEMENT MARKET, BY OFFERING, 2024–2029 (USD MILLION)
- TABLE 203 MIDDLE EAST & AFRICA: MARKET, BY SOLUTION, 2019–2023 (USD MILLION)
- TABLE 204 MIDDLE EAST & AFRICA: MARKET, BY SOLUTION, 2024–2029 (USD MILLION)
- TABLE 205 MIDDLE EAST & AFRICA: MARKET, BY SERVICE, 2019–2023 (USD MILLION)
- TABLE 206 MIDDLE EAST & AFRICA: MARKET, BY SERVICE, 2024–2029 (USD MILLION)
- TABLE 207 MIDDLE EAST & AFRICA: MARKET, BY PROFESSIONAL SERVICE, 2019–2023 (USD MILLION)
- TABLE 208 MIDDLE EAST & AFRICA: MARKET, BY PROFESSIONAL SERVICE, 2024–2029 (USD MILLION)
- TABLE 209 MIDDLE EAST & AFRICA: MARKET, BY BUSINESS FUNCTION, 2019–2023 (USD MILLION)
- TABLE 210 MIDDLE EAST & AFRICA: MARKET, BY BUSINESS FUNCTION, 2024–2029 (USD MILLION)
- TABLE 211 MIDDLE EAST & AFRICA: MARKET, BY ORGANIZATION SIZE, 2019–2023 (USD MILLION)
- TABLE 212 MIDDLE EAST & AFRICA: MARKET, BY ORGANIZATION SIZE, 2024–2029 (USD MILLION)
- TABLE 213 MIDDLE EAST & AFRICA: MARKET, BY DEPLOYMENT MODE, 2019–2023 (USD MILLION)
- TABLE 214 MIDDLE EAST & AFRICA: MARKET, BY DEPLOYMENT MODE, 2024–2029 (USD MILLION)
- TABLE 215 MIDDLE EAST & AFRICA: MARKET, BY VERTICAL, 2019–2023 (USD MILLION)
- TABLE 216 MIDDLE EAST & AFRICA: MARKET, BY VERTICAL, 2024–2029 (USD MILLION)
- TABLE 217 MIDDLE EAST & AFRICA: MARKET, BY SUBREGION, 2019–2023 (USD MILLION)
- TABLE 218 MIDDLE EAST & AFRICA: MARKET, BY SUBREGION, 2024–2029 (USD MILLION)
- TABLE 219 GULF COOPERATION COUNCIL COUNTRIES: MARKET, BY COUNTRY, 2019–2023 (USD MILLION)
- TABLE 220 GULF COOPERATION COUNCIL COUNTRIES: MARKET, BY COUNTRY, 2024–2029 (USD MILLION)
- TABLE 221 GULF COOPERATION COUNCIL COUNTRIES: MARKET, BY ORGANIZATION SIZE, 2019–2023 (USD MILLION)
- TABLE 222 GULF COOPERATION COUNCIL COUNTRIES: MARKET, BY ORGANIZATION SIZE, 2024–2029 (USD MILLION)
- TABLE 223 GULF COOPERATION COUNCIL COUNTRIES: MARKET, BY DEPLOYMENT MODE, 2019–2023 (USD MILLION)
- TABLE 224 GULF COOPERATION COUNCIL COUNTRIES: MARKET, BY DEPLOYMENT MODE, 2024–2029 (USD MILLION)
- TABLE 225 SOUTH AFRICA: ENTERPRISE CONTENT MANAGEMENT MARKET, BY ORGANIZATION SIZE, 2019–2023 (USD MILLION)
- TABLE 226 SOUTH AFRICA: MARKET, BY ORGANIZATION SIZE, 2024–2029 (USD MILLION)
- TABLE 227 SOUTH AFRICA: MARKET, BY DEPLOYMENT MODE, 2019–2023 (USD MILLION)
- TABLE 228 SOUTH AFRICA: MARKET, BY DEPLOYMENT MODE, 2024–2029 (USD MILLION)
- TABLE 229 REST OF MIDDLE EAST & AFRICA: MARKET, BY ORGANIZATION SIZE, 2019–2023 (USD MILLION)
- TABLE 230 REST OF MIDDLE EAST & AFRICA: MARKET, BY ORGANIZATION SIZE, 2024–2029 (USD MILLION)
- TABLE 231 REST OF MIDDLE EAST & AFRICA: MARKET, BY DEPLOYMENT MODE, 2019–2023 (USD MILLION)
- TABLE 232 REST OF MIDDLE EAST & AFRICA: MARKET, BY DEPLOYMENT MODE, 2024–2029 (USD MILLION)
- TABLE 233 LATIN AMERICA: MARKET, BY OFFERING, 2019–2023 (USD MILLION)
- TABLE 234 LATIN AMERICA: MARKET, BY OFFERING, 2024–2029 (USD MILLION)
- TABLE 235 LATIN AMERICA: MARKET, BY SOLUTION, 2019–2023 (USD MILLION)
- TABLE 236 LATIN AMERICA: MARKET, BY SOLUTION, 2024–2029 (USD MILLION)
- TABLE 237 LATIN AMERICA: MARKET, BY SERVICE, 2019–2023 (USD MILLION)
- TABLE 238 LATIN AMERICA: MARKET, BY SERVICE, 2024–2029 (USD MILLION)
- TABLE 239 LATIN AMERICA: MARKET, BY PROFESSIONAL SERVICE, 2019–2023 (USD MILLION)
- TABLE 240 LATIN AMERICA: MARKET, BY PROFESSIONAL SERVICE, 2024–2029 (USD MILLION)
- TABLE 241 LATIN AMERICA: MARKET, BY BUSINESS FUNCTION, 2019–2023 (USD MILLION)
- TABLE 242 LATIN AMERICA: MARKET, BY BUSINESS FUNCTION, 2024–2029 (USD MILLION)
- TABLE 243 LATIN AMERICA: MARKET, BY ORGANIZATION SIZE, 2019–2023 (USD MILLION)
- TABLE 244 LATIN AMERICA: MARKET, BY ORGANIZATION SIZE, 2024–2029 (USD MILLION)
- TABLE 245 LATIN AMERICA: MARKET, BY DEPLOYMENT MODE, 2019–2023 (USD MILLION)
- TABLE 246 LATIN AMERICA: MARKET, BY DEPLOYMENT MODE, 2024–2029 (USD MILLION)
- TABLE 247 LATIN AMERICA: MARKET, BY VERTICAL, 2019–2023 (USD MILLION)
- TABLE 248 LATIN AMERICA: MARKET, BY VERTICAL, 2024–2029 (USD MILLION)
- TABLE 249 LATIN AMERICA: MARKET, BY COUNTRY, 2019–2023 (USD MILLION)
- TABLE 250 LATIN AMERICA: MARKET, BY COUNTRY, 2024–2029 (USD MILLION)
- TABLE 251 BRAZIL: ENTERPRISE CONTENT MANAGEMENT MARKET, BY ORGANIZATION SIZE, 2019–2023 (USD MILLION)
- TABLE 252 BRAZIL: MARKET, BY ORGANIZATION SIZE, 2024–2029 (USD MILLION)
- TABLE 253 BRAZIL: MARKET, BY DEPLOYMENT MODE, 2019–2023 (USD MILLION)
- TABLE 254 BRAZIL: MARKET, BY DEPLOYMENT MODE, 2024–2029 (USD MILLION)
- TABLE 255 MEXICO: MARKET, BY ORGANIZATION SIZE, 2019–2023 (USD MILLION)
- TABLE 256 MEXICO: MARKET, BY ORGANIZATION SIZE, 2024–2029 (USD MILLION)
- TABLE 257 MEXICO: MARKET, BY DEPLOYMENT MODE, 2019–2023 (USD MILLION)
- TABLE 258 MEXICO: MARKET, BY DEPLOYMENT MODE, 2024–2029 (USD MILLION)
- TABLE 259 REST OF LATIN AMERICA: MARKET, BY ORGANIZATION SIZE, 2019–2023 (USD MILLION)
- TABLE 260 REST OF LATIN AMERICA: MARKET, BY ORGANIZATION SIZE, 2024–2029 (USD MILLION)
- TABLE 261 REST OF LATIN AMERICA: MARKET, BY DEPLOYMENT MODE, 2019–2023 (USD MILLION)
- TABLE 262 REST OF LATIN AMERICA: MARKET, BY DEPLOYMENT MODE, 2024–2029 (USD MILLION)
- TABLE 263 MARKET: DEGREE OF COMPETITION
- TABLE 264 MARKET: REGIONAL FOOTPRINT
- TABLE 265 MARKET: OFFERING FOOTPRINT
- TABLE 266 MARKET: BUSINESS FUNCTION FOOTPRINT
- TABLE 267 MARKET: ORGANIZATION SIZE FOOTPRINT
- TABLE 268 MARKET: DEPLOYMENT MODE FOOTPRINT
- TABLE 269 MARKET: VERTICAL FOOTPRINT
- TABLE 270 MARKET: KEY START-UPS/SMES, 2023
- TABLE 271 MARKET: COMPETITIVE BENCHMARKING OF KEY START-UPS/SMES, 2023
- TABLE 272 MARKET: PRODUCT LAUNCHES AND ENHANCEMENTS, APRIL 2024–FEBRUARY 2021
- TABLE 273 MARKET: DEALS, APRIL 2024–JANUARY 2021
- TABLE 274 MICROSOFT: BUSINESS OVERVIEW
- TABLE 275 MICROSOFT: PRODUCTS/SOLUTIONS/SERVICES OFFERED
- TABLE 276 MICROSOFT: PRODUCT ENHANCEMENTS
- TABLE 277 MICROSOFT: DEALS
- TABLE 278 OPENTEXT: BUSINESS OVERVIEW
- TABLE 279 OPENTEXT: PRODUCTS/SOLUTIONS/SERVICES OFFERED
- TABLE 280 OPENTEXT: PRODUCT LAUNCHES AND ENHANCEMENTS
- TABLE 281 OPENTEXT: DEALS
- TABLE 282 BOX: BUSINESS OVERVIEW
- TABLE 283 BOX: PRODUCTS/SOLUTIONS/SERVICES OFFERED
- TABLE 284 BOX: PRODUCT LAUNCHES AND ENHANCEMENTS
- TABLE 285 BOX: DEALS
- TABLE 286 HYLAND: BUSINESS OVERVIEW
- TABLE 287 HYLAND: PRODUCTS/SOLUTIONS/SERVICES OFFERED
- TABLE 288 HYLAND: PRODUCT LAUNCHES AND ENHANCEMENTS
- TABLE 289 HYLAND: DEALS
- TABLE 290 IBM: BUSINESS OVERVIEW
- TABLE 291 IBM: PRODUCTS/SOLUTIONS/SERVICES OFFERED
- TABLE 292 IBM: PRODUCT ENHANCEMENTS
- TABLE 293 IBM: DEALS
- TABLE 294 ADOBE: BUSINESS OVERVIEW
- TABLE 295 ADOBE: PRODUCTS/SOLUTIONS/SERVICES OFFERED
- TABLE 296 ADOBE: PRODUCT LAUNCHES AND ENHANCEMENTS
- TABLE 297 ADOBE: DEALS
- TABLE 298 XEROX: BUSINESS OVERVIEW
- TABLE 299 XEROX: PRODUCTS/SOLUTIONS/SERVICES OFFERED
- TABLE 300 XEROX: PRODUCT LAUNCHES
- TABLE 301 XEROX: DEALS
- TABLE 302 ATLASSIAN: BUSINESS OVERVIEW
- TABLE 303 ATLASSIAN: PRODUCTS/SOLUTIONS/SERVICES OFFERED
- TABLE 304 ATLASSIAN: PRODUCT ENHANCEMENTS
- TABLE 305 ATLASSIAN: DEALS
- TABLE 306 KYOCERA CORPORATION: BUSINESS OVERVIEW
- TABLE 307 KYOCERA CORPORATION: PRODUCTS/SOLUTIONS/SERVICES OFFERED
- TABLE 308 KYOCERA CORPORATION: DEALS
- TABLE 309 ORACLE: BUSINESS OVERVIEW
- TABLE 310 ORACLE: PRODUCTS/SOLUTIONS/SERVICES OFFERED
- TABLE 311 ORACLE: PRODUCT ENHANCEMENTS
- TABLE 312 ORACLE: DEALS
- TABLE 313 WEB CONTENT MANAGEMENT MARKET SIZE, BY ORGANIZATION SIZE, 2016–2020 (USD MILLION)
- TABLE 314 WEB CONTENT MANAGEMENT MARKET SIZE, BY ORGANIZATION SIZE, 2021–2026 (USD MILLION)
- TABLE 315 LARGE ENTERPRISES: WEB CONTENT MANAGEMENT MARKET SIZE, BY REGION, 2016–2020 (USD MILLION)
- TABLE 316 LARGE ENTERPRISES: WEB CONTENT MANAGEMENT MARKET SIZE, BY REGION, 2021–2026 (USD MILLION)
- TABLE 317 SMALL AND MEDIUM-SIZED ENTERPRISES: WEB CONTENT MANAGEMENT MARKET SIZE, BY REGION, 2016–2020 (USD MILLION)
- TABLE 318 SMALL AND MEDIUM-SIZED ENTERPRISES: WEB CONTENT MANAGEMENT MARKET SIZE, BY REGION, 2021–2026 (USD MILLION)
- TABLE 319 CLOUD MARKET SIZE, BY DEPLOYMENT MODEL, 2015–2022 (USD MILLION)
- TABLE 320 PUBLIC CLOUD: CLOUD MARKET SIZE, BY REGION, 2015–2022 (USD MILLION)
- TABLE 321 PRIVATE CLOUD: CLOUD MARKET SIZE, BY REGION, 2015–2022 (USD MILLION)
- TABLE 322 HYBRID CLOUD: CLOUD MARKET SIZE, BY REGION, 2015–2022 (USD MILLION)
- FIGURE 1 MARKET: RESEARCH DESIGN
- FIGURE 2 ENTERPRISE CONTENT MANAGEMENT MARKET: DATA TRIANGULATION
- FIGURE 3 MARKET: TOP-DOWN AND BOTTOM-UP APPROACHES
- FIGURE 4 MARKET SIZE ESTIMATION METHODOLOGY: TOP-DOWN APPROACH
- FIGURE 5 MARKET SIZE ESTIMATION METHODOLOGY: BOTTOM-UP APPROACH
- FIGURE 6 ENTERPRISE CONTENT MANAGEMENT MARKET: RESEARCH FLOW
- FIGURE 7 MARKET SIZE ESTIMATION METHODOLOGY: SUPPLY-SIDE ANALYSIS
- FIGURE 8 MARKET SIZE ESTIMATION METHODOLOGY: BOTTOM-UP APPROACH FROM SUPPLY SIDE - COLLECTIVE REVENUE OF VENDORS
- FIGURE 9 BOTTOM-UP APPROACH FROM SUPPLY SIDE: COLLECTIVE REVENUE OF VENDORS
- FIGURE 10 MARKET: DEMAND-SIDE APPROACH
- FIGURE 11 ENTERPRISE CONTENT MANAGEMENT MARKET SNAPSHOT, 2021–2029
- FIGURE 12 TOP MARKET SEGMENTS IN TERMS OF GROWTH RATE
- FIGURE 13 NORTH AMERICA TO ACCOUNT FOR LARGEST MARKET SHARE DURING FORECAST PERIOD
- FIGURE 14 RISING DEMAND TO PROVIDE ACCURATE REAL-TIME DATA AND INCREASING DIGITIZATION TO DRIVE MARKET
- FIGURE 15 SOLUTIONS SEGMENT TO ACCOUNT FOR LARGER MARKET SHARE DURING FORECAST PERIOD
- FIGURE 16 WEB & MOBILE CONTENT MANAGEMENT SEGMENT TO ACCOUNT FOR LARGEST MARKET SHARE IN 2029
- FIGURE 17 PROFESSIONAL SERVICES SEGMENT TO ACCOUNT FOR LARGER MARKET SHARE DURING FORECAST PERIOD
- FIGURE 18 DEPLOYMENT & INTEGRATION SEGMENT TO ACCOUNT FOR LARGEST MARKET SHARE DURING FORECAST PERIOD
- FIGURE 19 HUMAN RESOURCES SEGMENT TO ACCOUNT FOR LARGEST MARKET SHARE DURING FORECAST PERIOD
- FIGURE 20 ON-PREMISES SEGMENT TO ACCOUNT FOR LARGER MARKET SHARE DURING FORECAST PERIOD
- FIGURE 21 LARGE ENTERPRISES SEGMENT TO ACCOUNT FOR LARGER MARKET SHARE DURING FORECAST PERIOD
- FIGURE 22 RETAIL & CONSUMER GOODS SEGMENT TO ACCOUNT FOR LARGEST MARKET SHARE IN 2029
- FIGURE 23 ASIA PACIFIC TO EMERGE AS BEST MARKET FOR INVESTMENTS IN NEXT FIVE YEARS
- FIGURE 24 DRIVERS, RESTRAINTS, OPPORTUNITIES, AND CHALLENGES: ENTERPRISE CONTENT MANAGEMENT MARKET
- FIGURE 25 KEY PLAYERS IN ECOSYSTEM
- FIGURE 26 MARKET: VALUE CHAIN ANALYSIS
- FIGURE 27 NUMBER OF PATENTS PUBLISHED, 2013–2023
- FIGURE 28 TOP 10 PATENT APPLICANTS (GLOBAL) IN 2023
- FIGURE 29 PORTER’S FIVE FORCES’ ANALYSIS: ENTERPRISE CONTENT MANAGEMENT MARKET
- FIGURE 30 MARKET: TRENDS/DISRUPTIONS IMPACTING CUSTOMERS’ BUSINESSES
- FIGURE 31 INFLUENCE OF STAKEHOLDERS ON BUYING PROCESS FOR TOP THREE VERTICALS
- FIGURE 32 KEY BUYING CRITERIA FOR TOP THREE VERTICALS
- FIGURE 33 ENTERPRISE CONTENT MANAGEMENT MARKET: NUMBER OF INVESTORS AND FUNDING ROUNDS, 2023
- FIGURE 34 SERVICES SEGMENT TO GROW AT HIGHER CAGR DURING FORECAST PERIOD
- FIGURE 35 WEB & MOBILE CONTENT MANAGEMENT SEGMENT TO GROW AT HIGHEST CAGR DURING FORECAST PERIOD
- FIGURE 36 MANAGED SERVICES SEGMENT TO GROW AT HIGHER CAGR DURING FORECAST PERIOD
- FIGURE 37 DEPLOYMENT & INTEGRATION SEGMENT TO ACCOUNT FOR HIGHEST CAGR DURING FORECAST PERIOD
- FIGURE 38 HUMAN RESOURCES SEGMENT TO REGISTER HIGHEST CAGR DURING FORECAST PERIOD
- FIGURE 39 CLOUD SEGMENT TO REGISTER HIGHER CAGR DURING FORECAST PERIOD
- FIGURE 40 SMALL AND MEDIUM-SIZED ENTERPRISES SEGMENT TO REGISTER HIGHER CAGR DURING FORECAST PERIOD
- FIGURE 41 BFSI SEGMENT TO ACCOUNT FOR LARGEST MARKET SHARE IN 2024
- FIGURE 42 NORTH AMERICA TO ACCOUNT FOR LARGEST MARKET DURING FORECAST PERIOD
- FIGURE 43 NORTH AMERICA: MARKET SNAPSHOT
- FIGURE 44 ASIA PACIFIC: MARKET SNAPSHOT
- FIGURE 45 OVERVIEW OF STRATEGIES ADOPTED BY KEY VENDORS
- FIGURE 46 ENTERPRISE CONTENT MANAGEMENT MARKET: MARKET SHARE ANALYSIS
- FIGURE 47 BRAND/PRODUCT COMPARISON
- FIGURE 48 TOP 5 PLAYERS DOMINATING MARKET IN LAST 5 YEARS
- FIGURE 49 COMPANY EVALUATION MATRIX (KEY PLAYERS): CRITERIA WEIGHTAGE
- FIGURE 50 MARKET: COMPANY EVALUATION MATRIX (KEY PLAYERS), 2023
- FIGURE 51 MARKET: OVERALL COMPANY FOOTPRINT
- FIGURE 52 ENTERPRISE CONTENT MANAGEMENT MARKET: COMPANY EVALUATION MATRIX (START-UPS/SMES), 2023
- FIGURE 53 COMPANY VALUATION AND FINANCIAL METRICS
- FIGURE 54 YEAR-TO-DATE (YTD) PRICE TOTAL RETURN AND 5-YEAR STOCK BETA OF KEY VENDORS
- FIGURE 55 MICROSOFT: COMPANY SNAPSHOT
- FIGURE 56 OPENTEXT: COMPANY SNAPSHOT
- FIGURE 57 BOX: COMPANY SNAPSHOT
- FIGURE 58 IBM: COMPANY SNAPSHOT
- FIGURE 59 ADOBE: COMPANY SNAPSHOT
- FIGURE 60 XEROX: COMPANY SNAPSHOT
- FIGURE 61 ATLASSIAN: COMPANY SNAPSHOT
- FIGURE 62 KYOCERA CORPORATION: COMPANY SNAPSHOT
- FIGURE 63 ORACLE: COMPANY SNAPSHOT
The study comprised four main activities to estimate the enterprise content management market size. We conducted significant secondary research to gather data on the market, the competing market, and the parent market. The following stage involved conducting primary research to confirm these conclusions and hypotheses and sizing with industry experts throughout the value chain. The overall market size was evaluated using a blend of top-down and bottom-up approach methodologies. After that, we estimated the market sizes of the various enterprise content management market segments using the market breakup and data triangulation techniques.
Secondary Research
The size of companies offering enterprise content management markets and services was determined based on secondary data from paid and unpaid sources. It was also arrived at by analyzing the product portfolios of major companies and rating the companies based on their performance and quality.
In the secondary research process, various sources were referred to identify and collect information for this study. Secondary sources included annual reports, press releases, and investor presentations of companies; white papers, journals, and certified publications; and articles from recognized authors, directories, and databases. The data was also collected from other secondary sources, such as journals, government websites, blogs, and vendors' websites. Additionally, the spending of various countries on the ECM market was extracted from the respective sources. Secondary research was mainly used to obtain the critical information related to the industry's value chain and supply chain to identify the key players based on solutions, services, market classification, and segmentation according to components of the major players, industry trends related to components, users, and regions, and the key developments from both market- and technology-oriented perspectives.
Primary Research
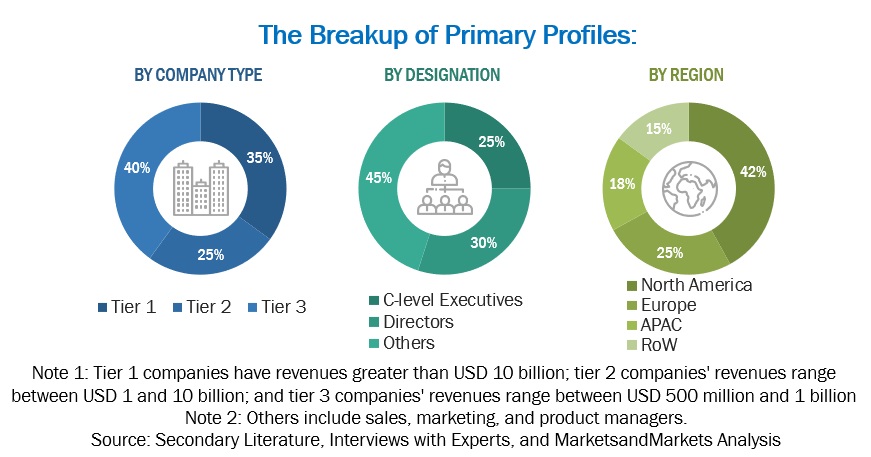
In the primary research process, various primary sources from both the supply and demand sides of the enterprise content management market were interviewed to obtain qualitative and quantitative information for this study. The primary sources from the supply side included industry experts, such as Chief Executive Officers (CEOs), Vice Presidents (VPs), marketing directors, technology and innovation directors, and related key executives from vendors providing enterprise content management offerings; associated service providers; and is operating in the targeted countries. all possible parameters that affect the market covered in this research study have been accounted for, viewed in extensive detail, verified through primary research, and analyzed to arrive at the final quantitative and qualitative data.
After the complete market engineering process (including calculations for market statistics, market breakup, market size estimations, market forecasting, and data triangulation), extensive primary research was conducted to gather information and verify and validate the critical numbers arrived at. The primary research also helped identify and validate the segmentation, industry trends, key players, competitive landscape, and market dynamics, such as drivers, restraints, opportunities, challenges, and key strategies. In the complete market engineering process, the bottom-up approach and several data triangulation methods were extensively used to perform market estimation and market forecasting for the overall market segments and subsegments listed in this report. An extensive qualitative and quantitative analysis of the complete market engineering process was performed to list the key information/insights throughout the report.
To know about the assumptions considered for the study, download the pdf brochure
Market Size Estimation
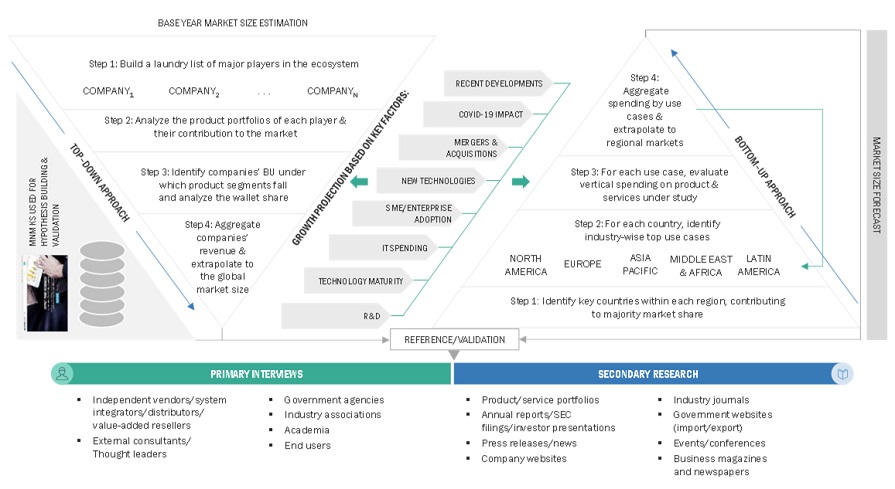
The enterprise content management market and related submarkets were estimated and forecasted using top-down and bottom-up methodologies. The bottom-up method was used to determine the market's overall size, using the revenues and product offerings of the major market players. This research ascertained and validated the precise value of the total parent market size through data triangulation techniques and primary interview validation. Next, using percentage splits of the market segments, the overall market size was utilized in the top-down approach to estimate the size of other individual markets.
Top Down and Bottom Up Approach of Enterprise Content Management Market.
To know about the assumptions considered for the study, Request for Free Sample Report
The research methodology used to estimate the market size included the following:
- Primary and secondary research was utilized to determine the revenue contributions of the major market participants in each country after secondary research helped identify them.
- Throughout the process, critical insights were obtained by conducting in-depth interviews with industry professionals, including directors, CEOs, VPs, and marketing executives, and by reading the annual and financial reports of the top firms in the market.
- Primary sources were used to verify all percentage splits and breakups, which were calculated using secondary sources.
Data Triangulation
The market was divided into several segments and subsegments using the previously described market size estimation procedures once the overall market size was determined. When required, market breakdown and data triangulation procedures were employed to complete the market engineering process and specify the exact figures for every market segment and subsegment. The data was triangulated by examining several variables and patterns from government entities' supply and demand sides.
Market Definition
MarketsandMarkets defines Enterprise Content Management (ECM) as a systematic approach to managing an organization's entire information lifecycle. It involves capturing, storing, managing, and delivering content and documents related to organizational processes. ECM aims to organize, categorize, and secure content, making it easily accessible to authorized users. It encompasses document management, web content management, records management, digital asset management, and workflow management. ECM improves an organization's collaboration, efficiency, and compliance by centralizing content management.
Key Stakeholders
- Training and consulting service providers
- Information Technology (IT) infrastructure providers
- ECM solutions providers
- ECM service providers
- Government organizations and standardization bodies
- Regional associations
- ECM vendors
- Value-added resellers and distributors
Report Objectives
- To define, describe, and forecast the enterprise content management (ECM) market based on offering, business function, deployment mode, organization size, vertical, and region.
- To provide detailed information about the significant factors, such as drivers, opportunities, restraints, and challenges, influencing the growth of the market
- To analyze the opportunities in the market for stakeholders by identifying the high-growth segments of the market
- To forecast the market size concerning five main regions — North America, Europe, Asia Pacific, the Middle East & Africa, and Latin America
- To analyze the subsegments of the market concerning individual growth trends, prospects, and contributions to the overall market
- To profile the market's key players and analyze their size and core competencies comprehensively.
- To track and analyze the competitive developments, such as product enhancements, product launches, acquisitions, partnerships, and collaborations, in the enterprise content management market globally
Available Customizations
MarketsandMarkets provides customizations based on the company's unique requirements using market data. The following customization options are available for the report:
Product Analysis
- The product matrix provides a detailed comparison of each company's product portfolio.
Geographic Analysis
- Further breakup of the enterprise content management market
Company Information
- Detailed analysis and profiling of five additional market players
Growth opportunities and latent adjacency in Enterprise Content Management Market