Diesel Generator Market

Diesel Generator Market by Application (Standby Power, Peak Shaving, Prime & Continuous Power), End-User (Commercial, Industrial, Residential), Design (Stationary, Portable), Power Rating & Region - Global Forecast to 2029

Report Code: EP 3939 Apr, 2024, by marketsandmarkets.com

[316 Pages Report] The global diesel generator market is forecast to reach USD 23.4 billion by 2029 from an estimated USD 17.9 billion in 2024, at a CAGR of 5.4% during the forecast period (2024-2029). The diesel generator market is expanding due to the increasing demand for reliable backup power sources in regions prone to frequent power outages has bolstered the adoption of diesel generators, industries and businesses are increasingly relying on diesel generators to ensure uninterrupted operations, particularly in sectors where power stability is critical, such as healthcare and telecommunications and the portability and versatility of diesel generators make them a popular choice for remote locations or construction sites where grid connectivity may be limited or non-existent.

Diesel Generator Market

To know about the assumptions considered for the study, Request for Free Sample Report

Diesel Generator Market

To know about the assumptions considered for the study, download the pdf brochure

Diesel Generator Market Dynamics

Driver: Growing demand for uninterrupted & reliable power supply.

Due to the undeniable importance of a consistent and uninterrupted power supply in fostering the prosperity of contemporary societies, the reliance on electricity has become increasingly apparent. In today's digital economy, which operates round the clock, electricity serves as a linchpin across various sectors, from sustaining critical medical equipment in hospitals to facilitating remote work and virtual meetings. The recent challenges precipitated by the Covid-19 pandemic have only reinforced the pivotal role electricity plays in our daily lives.

As outlined in the IEA World Energy Outlook, the proportion of electricity in final energy consumption has steadily climbed from 15% in 2000 to 20% today, with projections indicating a further increase to 24% by 2040 if current trends persist. In alignment with the objectives of the Paris Agreement, the Sustainable Development Scenario emphasizes the potential for enhanced electrification across diverse sectors, foreseeing electricity accounting for 31% of final energy consumption by 2040. This trajectory underscores the escalating demand for electricity as a cleaner and more sustainable energy option. Against this backdrop of mounting electricity demand, diesel generators emerge as pivotal components in ensuring reliability during power grid outages or disturbances. As industries, commercial entities, and residential communities endeavor to mitigate the repercussions of electricity disruptions and sustain operational continuity, the reliance on diesel generators is poised to grow. This evolving trend underscores the indispensable role diesel generators play in furnishing backup power solutions and addressing the evolving energy requisites of modern societies.

Restraint: Rapidly growing renewable energy technology.

The growth of renewable energy technologies has been propelled by various factors, including escalating concerns over supply disruptions and the volatility of fossil fuel prices. Globally, energy consumers are increasingly embracing on-site renewable energy systems and transitioning towards electrified technologies across diverse sectors. For instance, the buildings sector witnessed a significant surge in heat pump installations in 2022, marking a notable 10% increase over the previous year, with Europe experiencing a particularly remarkable 38% growth. Similarly, the attractiveness of rooftop solar installations surged amid the rise in fossil fuel prices. In energy-intensive industries, worries about energy expenses and security drove a notable 21% uptick in corporate power purchase agreements (PPAs) in 2022. Renewable-powered industrial parks gained traction for providing insulation against energy price fluctuations and supply interruptions. Moreover, the transport sector grappled with rising energy costs, resulting in doubled energy bills for many public transport operators in Europe, although those with existing PPAs experienced more stable costs. The electrification of road transport continued its upward trajectory, witnessing unprecedented investment in electric vehicles and associated charging infrastructure, particularly in Asia. Several Asian nations implemented bans on internal combustion engine vehicles, further stimulating demand for electric alternatives. In agriculture, there's a discernible shift towards self-sufficiency and additional income generation through the adoption of renewable energy solutions like agrivoltaics, geothermal, and bioenergy. Solar water pumps, prevalent in the Asia Pacific region, have significantly enhanced agricultural productivity. As renewable energy technologies continue their expansion, there could be a potential impact on the demand for diesel generators. The increasing affordability and appeal of renewable energy alternatives may lead to a downturn in diesel generator demand, particularly in sectors such as buildings, industry, transport, and agriculture, where renewable energy solutions offer cost savings, energy security, and environmental advantages.

Opportunities: urbanization and industrialization.

During a special meeting, the President of the United Nations Economic and Social Council (ECOSOC) underscored the critical role of infrastructure, industrialization, and innovation in global poverty eradication efforts. Emphasizing the importance of Sustainable Development Goal 9 (SDG 9) focusing on these aspects, ECOSOC President Frederick Shava emphasized the necessity of prioritizing these goals in national, regional, and global policymaking. Urbanization presents a significant opportunity for industrial and infrastructure development, with the projected doubling of the population in emerging market cities by 2030, leading to an addition of two billion people to urban areas. However, this rapid urbanization also brings challenges, including the requirement for resilient infrastructure and industrialization in rural areas. Diesel generators can play a crucial role in addressing the energy needs of rapidly expanding urban centers and industrial hubs. As cities grow and industries flourish, the demand for reliable and uninterrupted power supply rises. Diesel generators offer a dependable backup power solution, ensuring continuous electricity supply during grid outages or fluctuations.

According to estimates by the UN Economic Commission for Africa (UN-ECA), Africa needs approximately USD 93 billion over the next three years to upgrade its infrastructure. Diesel generators can contribute to closing the infrastructure gap by providing reliable power for industrial operations, urban infrastructure, and rural electrification initiatives. Furthermore, diesel generators can support sustainable industrialization by offering affordable and clean energy solutions. As the international community commits to supporting infrastructure development and sustainable industrialization, diesel generators emerge as a viable option to meet the increasing energy demands of urbanization and industrial expansion.

Challenges: Stringent government regulations

According to the Renewables 2023 Global Status Report, the year 2022 witnessed a global expansion of climate commitments, with 10 countries revising their Nationally Determined Contributions (NDCs) to align with emissions reduction targets under the Paris Agreement. However, out of the 193 countries that have signed agreements, only 25 have set goals for achieving net-zero emissions. Climate policies enacted by various nations are focused on decarbonizing energy usage across diverse sectors, albeit with progress varying by region. In 2022, approximately 80 new renewable energy policies were introduced worldwide, primarily in the form of fiscal or financial incentives. These policies were implemented across 49 countries, with the majority concentrated in Europe, Latin America, and Asia.

Within the buildings sector, policies supporting the adoption of renewables, such as rooftop solar and geothermal heat pumps, were in place in 52 countries, featuring both fiscal and regulatory incentives. In the industry sector, 19 countries implemented policies incentivizing or mandating the use of renewables, primarily through renewable energy mandates and fiscal incentives. Notably, the European Union's Carbon Border Adjustment Agreement (CBAM) introduced a carbon tax on imports to EU member countries, expected to accelerate global industrial sector decarbonization. In the transport sector, 61 countries had renewable energy mandates or enabling policies, predominantly focusing on biofuel blending mandates and setting targets or bans on internal combustion engine vehicles. Regarding agriculture, 14 countries established targets and policies for renewables, primarily for solar-powered irrigation and agrivoltaics. These climate policies and renewable energy targets adopted by various countries could have implications for the market. As countries prioritize the adoption of renewable energy and enact policies to decarbonize different sectors, there may be a decrease in demand for diesel generators, particularly in industries and sectors where renewable energy alternatives are encouraged or mandated. Additionally, the transition towards renewable energy sources may result in a shift away from fossil fuel-based power generation, which could impact the market for diesel generators.

Diesel Generator Market Ecosystem

Leading companies in this market include well-established, financially secure producers of diesel generator products. These corporations have been long operating in the market and have a differentiated product portfolio, modern manufacturing technologies, and robust sales and marketing networks. Major companies in this market include Caterpillar (US), Cummins Inc.(US), Rolls-Royce plc (UK), Mitsubishi Heavy Industries, Ltd. (Japan) , Generac Power Systems, Inc (US).

Top Companies in Diesel Generator Market

The commercial segment is expected to be the second largest market by end user during the forecast period.

By end user, the diesel generator market is divided into industrial, commercial and residential. The commercial segment is expected to be the second largest in the diesel generator market Due to its versatility and widespread applications, its growth is attributed to increasing demand from sectors such as hospitality, healthcare, and retail, driven by the need for reliable backup power to ensure uninterrupted operations and data integrity.

By power rating, 51 to 280 kW is expected to be the largest segment during the forecast period.

The 51 to 280 kW segment is expected to be the largest in the diesel generator market due to its increasing usage in utility plants, distributed generating facilities, and large commercial or industrial settings, the 51 to 280 kW segment emerges as the largest in the diesel generator market. Its growth is fueled by burgeoning economies in developing regions like Asia Pacific and the Middle East & Africa, where expanding industrial sectors and unreliable grids necessitate primary or backup power solutions. Infrastructure development initiatives, exemplified by the launch of USD 1.7 billion worth of national highway projects in Patna, Hajipur, and Bihar, further contribute to market expansion. Additionally, the demand for generators within this segment is propelled by various construction activities, including single houses, smaller roads, low-rise apartments, and temporary construction jobs, which require electric tools and equipment consuming 51-280 kW of electricity. Governments worldwide are also implementing infrastructure-related policies to attract foreign investments, such as India's significant FDIs in the construction development and infrastructure sectors.

“Asia pacific”: The largest in the diesel generator market.

Asia Pacific is the largest region in the diesel generator market owing to a region experiencing a boom in industrial activity and urban growth. This translates to a surging demand for reliable power sources, especially for factories and commercial buildings that can't afford downtime during outages, thus providing a prospect for the market. Moreover, Pacific emerging nations in Asia- have undeveloped electrical infrastructure. As a result, there are frequent blackouts and an unstable supply of electricity, this serves as an opportunity for the diesel generator market. The size of the diesel generator market is greatly influenced by China, a prominent participant in the region. The need for dependable backup power is fueled by the nation's continuous infrastructure projects, rising manufacturing base, and developing commercial sector and diesel generators are frequently used to meet this demand. Furthermore, Diesel fuel is widely accessible throughout most of Asia-Pacific, making it a convenient option for powering generators. This is especially important in remote areas where access to other fuel sources might be limited.

North American Diesel Generator Market Size, and Share

Key Market Players

The diesel generator market is dominated by a few major players that have a wide regional presence. The major players in the diesel generator market are Caterpillar (US), Cummins Inc. (US), Rolls-Royce plc (UK), Mitsubishi Heavy Industries, Ltd. (Japan), Generac Power Systems, Inc (US). Between 2020 and 2024, strategies such as product launches, contracts, agreements, partnerships, collaborations, alliances, acquisitions, and expansions are followed by these companies to capture a larger share of the market.

Get online access to the report on the World's First Market Intelligence Cloud

  • Easy to Download Historical Data & Forecast Numbers
  • Company Analysis Dashboard for high growth potential opportunities
  • Research Analyst Access for customization & queries
  • Competitor Analysis with Interactive dashboard
  • Latest News, Updates & Trend analysis
Request Sample

Scope of the Report

Report Metric

Details

Market size available for years

2021–2029

Base year considered

2023

Forecast period

2024–2029

Forecast units

Value (USD)

Segments Covered

Power rating, design, end-user, application, and region

Geographies covered

Asia Pacific, North America, Europe, Middle East & Africa, and South America

Companies covered

Caterpillar (US), Cummins Inc., (US), Rolls-Royce plc (UK), Mitsubishi Heavy Industries, Ltd. (Japan), Generac Power Systems, Inc. (US), Wärtsilä (Finland), YANMAR (US), Kohler Co. (US), Man Energy Solutions (Germany), Atlas Copco (Sweden), Weichai Holding Group Co.,Ltd. (China), Denyo Co.,Ltd (Japan), Pronk Machinery B.V. (Netherlands), Kirloskar (India), Aksa Power Generation (Türkiye), Aggreko (UK), Kubota Corporation (Japan), Ashok leyland (India), Doosan (South Korea), JCB (UK), FG Wilson (UK),Anglo Belgian Corporation NV (Belgium),Yamaha Motor Co., Ltd. (Japan),Hyundai Power Products (South Korea),Mahindra Powerol (India)

This research report categorizes the market by vertical, offering, technology, source, and region

On the basis of power rating, the diesel generator market has been segmented as follows:
  • Up to 50 kW
  • 51 – 280 kW
  • 281 – 500 kW
  • 501 – 2,000 kw
  • Above 2,000 kW
On the basis of design, the diesel generator market has been segmented as follows:
  • Stationary
  • Portable
On the basis of application, the diesel generator market has been segmented as follows:
  • Commercial
  • Industrial
  • Residential
On the basis of source, the diesel generator market has been segmented as follows:
  • Standby power
  • Peak Shaving
  • Prime & Continuous Power
On the basis of region, the diesel generator market has been segmented as follows:
  • Asia Pacific
  • Europe
  • North America
  • Middle East & Africa
  • South America

Recent Developments

  • In January 2024, Explore Plant and Transport Solutions has made a significant investment exceeding £6 million in acquiring a fleet of over 100 JCB machines. This Worksop, Nottinghamshire-based specialist in haulage and plant hire services has received delivery of various new models, including JCB Loadall telescopic handlers, site dumpers, generators, and, notably, JCB midi and X Series excavators for the first time.
  • In May 2023, Anglo Belgian Corporation (ABC) disclosed the signing of a contract with FRERK Aggregatebau GmbH based in Schweringen, Germany. The agreement entails the supply of seven generating sets powered by +5000 HP V16 engines. These medium speed gensets will be packaged by FRERK Aggregatebau GmbH into modular 15x4m super silenced containers, ensuring a dependable energy source for Germany's largest Salt Mining Company across four distinct sites.
  • In February 2023, Caterpillar Inc. has introduced the Cat XQ330 mobile diesel generator set, presenting a fresh power option for standby and prime power uses that adhere to U.S. EPA Tier 4 Final emission standards. Propelled by a proficient Cat C9.3 Tier 4 Final compliant engine, it incorporates the Cat NOx Reduction System for enhanced efficiency.
  • In July 2020, Rolls-Royce bolsters its expansion prospects through the purchase of Kinolt, a Belgian expert in dynamic uninterruptible power supply. Kinolt joins Rolls-Royce's Power Systems business unit and aligns with its MTU product and solutions brand. This acquisition bolsters Rolls-Royce's standing in safety-critical sectors and fills gaps in its power supply product range.

Frequently Asked Questions (FAQ):

To speak to our analyst for a discussion on the above findings, click Speak to Analyst

TABLE OF CONTENTS
 
1 INTRODUCTION (Page No. - 45)
    1.1 STUDY OBJECTIVES 
    1.2 MARKET DEFINITION 
           1.2.1 INCLUSIONS AND EXCLUSIONS
                    TABLE 1 DIESEL GENERATOR MARKET: INCLUSIONS AND EXCLUSIONS, BY POWER RATING
                    TABLE 2 MARKET: INCLUSIONS AND EXCLUSIONS, BY DESIGN
                    TABLE 3 MARKET: INCLUSIONS AND EXCLUSIONS, BY APPLICATION
                    TABLE 4 MARKET: INCLUSIONS AND EXCLUSIONS, BY END USER
    1.3 STUDY SCOPE 
           1.3.1 MARKETS COVERED
           1.3.2 REGIONAL SCOPE
           1.3.3 YEARS CONSIDERED
    1.4 UNITS CONSIDERED 
    1.5 CURRENCY CONSIDERED 
    1.6 LIMITATIONS 
    1.7 STAKEHOLDERS 
    1.8 IMPACT OF RECESSION 
 
2 RESEARCH METHODOLOGY (Page No. - 51)
    2.1 RESEARCH DATA 
           FIGURE 1 DIESEL GENERATOR MARKET: RESEARCH DESIGN
    2.2 MARKET BREAKDOWN AND DATA TRIANGULATION 
           FIGURE 2 DATA TRIANGULATION
           2.2.1 SECONDARY DATA
                    FIGURE 3 KEY DATA FROM SECONDARY SOURCES
           2.2.2 PRIMARY DATA
                    FIGURE 4 KEY INDUSTRY INSIGHTS
                    2.2.2.1 Breakdown of primaries
                               FIGURE 5 BREAKDOWN OF PRIMARIES
    2.3 MARKET SCOPE 
           FIGURE 6 MAIN METRICS CONSIDERED TO ANALYZE TRENDS AND ASSESS DEMAND FOR DIESEL GENERATORS
    2.4 MARKET SIZE ESTIMATION 
           2.4.1 BOTTOM-UP APPROACH
                    FIGURE 7 DIESEL GENERATOR MARKET SIZE ESTIMATION METHODOLOGY: BOTTOM-UP APPROACH
           2.4.2 TOP-DOWN APPROACH
                    FIGURE 8 MARKET SIZE ESTIMATION METHODOLOGY: TOP-DOWN APPROACH
           2.4.3 DEMAND-SIDE ANALYSIS
                    2.4.3.1 Country-level analysis
                    2.4.3.2 Demand-side assumptions
                    2.4.3.3 Demand-side calculations
           2.4.4 SUPPLY-SIDE ANALYSIS
                    FIGURE 9 KEY STEPS CONSIDERED TO ASSESS SUPPLY OF DIESEL GENERATORS
                    FIGURE 10 MARKET: SUPPLY-SIDE ANALYSIS
                    2.4.4.1 Supply-side assumptions
                    2.4.4.2 Supply-side calculations
           2.4.5 FORECAST ASSUMPTIONS
    2.5 RESEARCH ASSUMPTIONS 
           FIGURE 11 FOR CALCULATING EACH SEGMENT’S SIZE, THE MOST IMMEDIATE PARENT MARKET SIZE HAS BEEN USED TO IMPLEMENT THE TOP-DOWN PROCEDURE.
    2.6 RESEARCH LIMITATIONS 
    2.7 RISK ASSESSMENT 
    2.8 IMPACT OF RECESSION 
 
3 EXECUTIVE SUMMARY (Page No. - 64)
    TABLE 5 DIESEL GENERATOR MARKET SNAPSHOT 
    FIGURE 12 ASIA PACIFIC TO DOMINATE MARKET IN 2024 
    FIGURE 13 UP TO 50 KW SEGMENT TO EXHIBIT HIGHEST CAGR IN MARKET DURING FORECAST PERIOD 
    FIGURE 14 STANDBY POWER SEGMENT TO LEAD DIESEL GENERATOR MARKET DURING FORECAST PERIOD 
    FIGURE 15 INDUSTRIAL SEGMENT TO CAPTURE LARGEST SHARE OF DIESEL GENERATOR MARKET IN 2029 
    FIGURE 16 STATIONARY SEGMENT TO HOLD LARGER DIESEL GENERATOR MARKET SHARE IN 2024 
 
4 PREMIUM INSIGHTS (Page No. - 68)
    4.1 ATTRACTIVE OPPORTUNITIES FOR PLAYERS IN DIESEL GENERATOR MARKET 
           FIGURE 17 GROWING NEED FOR UNINTERRUPTED AND RELIABLE POWER SUPPLY TO FUEL DEMAND
    4.2 DIESEL GENERATOR MARKET IN ASIA PACIFIC, BY END USER AND COUNTRY 
           FIGURE 18 INDUSTRIAL SEGMENT AND CHINA HELD LARGEST SHARES OF MARKET IN ASIA PACIFIC IN 2023
    4.3 DIESEL GENERATOR MARKET, BY APPLICATION 
           FIGURE 19 STANDBY POWER SEGMENT TO DOMINATE MARKET IN 2029
    4.4 DIESEL GENERATOR MARKET, BY POWER RATING 
           FIGURE 20 51–280 KW SEGMENT TO DOMINATE MARKET IN 2029
    4.5 DIESEL GENERATOR MARKET, BY DESIGN 
           FIGURE 21 STATIONARY SEGMENT TO LEAD MARKET IN 2029
    4.6 DIESEL GENERATOR MARKET, BY END USER 
           FIGURE 22 INDUSTRIAL SEGMENT TO HOLD LARGEST DIESEL GENERATOR MARKET SHARE IN 2029
 
5 MARKET OVERVIEW (Page No. - 71)
    5.1 INTRODUCTION 
    5.2 MARKET DYNAMICS 
           FIGURE 23 DIESEL GENERATOR MARKET: DRIVERS, RESTRAINTS, OPPORTUNITIES, AND CHALLENGES
           5.2.1 DRIVERS
                    5.2.1.1 Increased demand for uninterrupted and reliable power supply
                               FIGURE 24 GLOBAL SHARE OF ENERGY CONSUMPTION IN SUSTAINABLE DEVELOPMENT SCENARIO, BY FUEL TYPE, 2000–2040 (UNIT %)
                    5.2.1.2 Rising power outages
           5.2.2 RESTRAINTS
                    5.2.2.1 Increased adoption of renewable energy systems
                               FIGURE 25 ELECTRICITY AND RENEWABLE ELECTRICITY SHARES OF TFEC, BY SECTOR/INDUSTRY, 2010 VS. 2020
                    5.2.2.2 High maintenance and operating costs
           5.2.3 OPPORTUNITIES
                    5.2.3.1 Rising urbanization and industrialization
                    5.2.3.2 Growing electrification of rural and remote areas in developing countries
                               FIGURE 26 NUMBER OF PEOPLE WITHOUT ACCESS TO ELECTRICITY, BY REGION, 2010–2023
           5.2.4 CHALLENGES
                    5.2.4.1 Implementation of stringent regulations by governments to achieve net-zero emissions
                    5.2.4.2 Rising investments by utilities in transmission and distribution (T&D) systems
                               FIGURE 27 ANNUAL SPENDING ON ELECTRIC TRANSMISSION SYSTEMS BY MAJOR US UTILITIES, 2000–2019
    5.3 TRENDS/DISRUPTIONS IMPACTING CUSTOMERS’ BUSINESSES 
           FIGURE 28 TRENDS/DISRUPTIONS IMPACTING CUSTOMERS’ BUSINESSES
    5.4 PRICING ANALYSIS 
           5.4.1 AVERAGE SELLING PRICE (ASP) OF DIESEL GENERATORS OFFERED BY THREE KEY PLAYERS, BY POWER RATING
                    FIGURE 29 AVERAGE SELLING PRICE (ASP) OF DIESEL GENERATORS OFFERED BY THREE KEY PLAYERS, BY POWER RATING (USD)
                    TABLE 6 AVERAGE SELLING PRICE (ASP) OF DIESEL GENERATORS OFFERED BY THREE KEY PLAYERS, BY POWER RATING (USD)
           5.4.2 AVERAGE SELLING PRICE (ASP) OF DIESEL GENERATORS, BY REGION
                    TABLE 7 AVERAGE SELLING PRICE (ASP) OF DIESEL GENERATORS, BY REGION, 2021–2023 (USD/UNIT)
                    FIGURE 30 AVERAGE SELLING PRICE (ASP) OF DIESEL GENERATORS, BY REGION, 2021–2023 (USD/UNIT)
    5.5 VALUE CHAIN ANALYSIS 
           FIGURE 31 DIESEL GENERATOR MARKET: VALUE CHAIN ANALYSIS
           5.5.1 RAW MATERIAL/COMPONENT MANUFACTURERS/SUPPLIERS
           5.5.2 DIESEL GENERATOR MANUFACTURERS/ASSEMBLERS
           5.5.3 DISTRIBUTORS/RESELLERS
           5.5.4 END USERS
           5.5.5 AFTER-SALES SERVICE PROVIDERS
    5.6 ECOSYSTEM ANALYSIS 
           TABLE 8 ROLES OF COMPANIES IN DIESEL GENERATOR ECOSYSTEM
           FIGURE 32 MARKET: ECOSYSTEM ANALYSIS
    5.7 TECHNOLOGY ANALYSIS 
           5.7.1 KEY TECHNOLOGY
                    5.7.1.1 Common rail direct fuel injection (CRDI) technology
           5.7.2 ADJACENT TECHNOLOGY
                    5.7.2.1 Hybrid power system
    5.8 PATENT ANALYSIS 
           FIGURE 33 INNOVATIONS AND PATENT REGISTRATIONS PERTAINING TO DIESEL GENERATORS, 2019–2023
           5.8.1 LIST OF MAJOR PATENTS
                    TABLE 9 LIST OF PATENTS RELATED TO DIESEL GENERATORS, 2019–2023
    5.9 TRADE ANALYSIS 
           5.9.1 IMPORT SCENARIO FOR HS CODE 850211
                    TABLE 10 IMPORT DATA FOR HS CODE 850211-COMPLIANT PRODUCTS, BY COUNTRY, 2020–2022 (USD THOUSAND)
                    FIGURE 34 IMPORT AND EXPORT DATA FOR HS CODE 850211-COMPLIANT PRODUCTS, 2020–2022 (USD THOUSAND)
           5.9.2 EXPORT SCENARIO FOR HS CODE 850211
                    TABLE 11 EXPORT DATA FOR HS CODE 850211-COMPLIANT PRODUCTS, BY COUNTRY, 2020–2022 (USD THOUSAND)
           5.9.3 IMPORT SCENARIO FOR HS CODE 850212
                    TABLE 12 IMPORT DATA FOR HS CODE 850212-COMPLIANT PRODUCTS, BY COUNTRY, 2020–2022 (USD THOUSAND)
                    FIGURE 35 IMPORT AND EXPORT DATA FOR HS CODE 850212-COMPLIANT PRODUCTS, 2020–2022 (USD THOUSAND)
           5.9.4 EXPORT SCENARIO FOR HS CODE 850212
                    TABLE 13 EXPORT DATA FOR HS CODE 850212-COMPLIANT PRODUCTS, BY COUNTRY, 2020–2022 (USD THOUSAND)
           5.9.5 IMPORT SCENARIO FOR HS CODE 850213
                    TABLE 14 IMPORT DATA FOR HS CODE 850213-COMPLIANT PRODUCTS, BY COUNTRY, 2020–2022 (USD THOUSAND)
                    FIGURE 36 IMPORT AND EXPORT DATA FOR HS CODE 850213-COMPLIANT PRODUCTS, BY COUNTRY, 2020–2022 (USD THOUSAND)
           5.9.6 EXPORT SCENARIO FOR HS CODE 850213
                    TABLE 15 EXPORT DATA FOR HS CODE 850213-COMPLIANT PRODUCTS, BY COUNTRY, 2020–2022 (USD THOUSAND)
    5.10 KEY CONFERENCES AND EVENTS, 2024–2025 
           TABLE 16 DIESEL GENERATOR MARKET: LIST OF KEY CONFERENCES AND EVENTS, 2024–2025
    5.11 TARIFFS, STANDARDS, AND REGULATORY LANDSCAPE 
           5.11.1 TARIFF RELATED TO DIESEL GENERATORS
                    TABLE 17 IMPORT TARIFF RELATED TO HS 850211-COMPLIANT PRODUCTS IN 2022
           5.11.2 REGULATORY BODIES, GOVERNMENT AGENCIES, AND OTHER ORGANIZATIONS
                    TABLE 18 NORTH AMERICA: LIST OF REGULATORY BODIES, GOVERNMENT AGENCIES, AND OTHER ORGANIZATIONS
                    TABLE 19 EUROPE: LIST OF REGULATORY BODIES, GOVERNMENT AGENCIES, AND OTHER ORGANIZATIONS
                    TABLE 20 ASIA PACIFIC: LIST OF REGULATORY BODIES, GOVERNMENT AGENCIES, AND OTHER ORGANIZATIONS
                    TABLE 21 ROW: LIST OF REGULATORY BODIES, GOVERNMENT AGENCIES, AND OTHER ORGANIZATIONS
                    TABLE 22 GLOBAL: LIST OF REGULATORY BODIES, GOVERNMENT AGENCIES, AND OTHER ORGANIZATIONS
           5.11.3 STANDARDS
                    TABLE 23 NORTH AMERICA: STANDARDS
                    TABLE 24 ASIA PACIFIC: STANDARDS
                    TABLE 25 EUROPE: STANDARDS
                    TABLE 26 SOUTH AMERICA: STANDARDS
                    TABLE 27 GLOBAL: STANDARDS
    5.12 PORTER’S FIVE FORCES ANALYSIS 
                    FIGURE 37 DIESEL GENERATOR MARKET: PORTER’S FIVE FORCES ANALYSIS
                    TABLE 28 DIESEL GENERATORS MARKET: PORTER’S FIVE FORCES ANALYSIS
           5.12.1 THREAT OF NEW ENTRANTS
           5.12.2 BARGAINING POWER OF SUPPLIERS
           5.12.3 BARGAINING POWER OF BUYERS
           5.12.4 THREAT OF SUBSTITUTES
           5.12.5 INTENSITY OF COMPETITIVE RIVALRY
    5.13 CASE STUDY ANALYSIS 
           5.13.1 VACCINE DISTRIBUTION CENTER COLLABORATED WITH GENERAC INDUSTRIAL POWER TO ADDRESS CRITICAL BACKUP POWER NEEDS
           5.13.2 VERA CRUZ CITY HOSPITAL COLLABORATED WITH INTEGGRAL SISTEMAS DE ENERGIA TO INSTALL DIESEL GENERATORS FOR BACKUP POWER
           5.13.3 SKANSKA CONTACTED FG WILSON AND BELLS CONTROL EQUIPMENT LTD. TO INSTALL THREE FG WILSON 2,500 KVA DIESEL GENERATOR SETS AT HERON TOWER
    5.14 KEY STAKEHOLDERS AND BUYING CRITERIA 
           5.14.1 KEY STAKEHOLDERS IN BUYING PROCESS
                    FIGURE 38 INFLUENCE OF STAKEHOLDERS ON BUYING PROCESS, BY END USER
                    TABLE 29 INFLUENCE OF STAKEHOLDERS ON BUYING PROCESS, BY END USER (%)
           5.14.2 BUYING CRITERIA
                    FIGURE 39 KEY BUYING CRITERIA, BY END USER
                    TABLE 30 KEY BUYING CRITERIA, BY END USER
    5.15 INVESTMENT AND FUNDING SCENARIO 
                    FIGURE 40 INVESTMENT AND FUNDING SCENARIO, 2019–2023 (USD MILLION)
 
6 DIESEL GENERATOR MARKET, BY DESIGN (Page No. - 109)
    6.1 INTRODUCTION 
           FIGURE 41 MARKET, BY DESIGN, 2023
           TABLE 31 MARKET, BY DESIGN, 2021–2023 (USD MILLION)
           TABLE 32 DIESEL GENERATOR MARKET, BY DESIGN, 2024–2029 (USD MILLION)
    6.2 STATIONARY 
           6.2.1 HIGH RELIABILITY, DURABILITY, AND LONG-TERM PERFORMANCE TO DRIVE DEMAND
                    TABLE 33 STATIONARY: DIESEL GENERATOR MARKET, BY REGION, 2021–2023 (USD MILLION)
                    TABLE 34 STATIONARY: MARKET, BY REGION, 2024–2029 (USD MILLION)
    6.3 PORTABLE 
           6.3.1 PORTABILITY, EFFICIENCY, AND ROBUSTNESS TO FUEL DEMAND
                    TABLE 35 PORTABLE: DIESEL GENERATORS MARKET, BY REGION, 2021–2023 (USD MILLION)
                    TABLE 36 PORTABLE: MARKET, BY REGION, 2024–2029 (USD MILLION)
 
7 DIESEL GENERATOR MARKET, BY APPLICATION (Page No. - 113)
    7.1 INTRODUCTION 
           FIGURE 42 MARKET, BY APPLICATION, 2023
           TABLE 37 MARKET, BY APPLICATION, 2021–2023 (USD MILLION)
           TABLE 38 DIESEL GENERATOR MARKET, BY APPLICATION, 2024–2029 (USD MILLION)
    7.2 STANDBY POWER 
           7.2.1 INCREASING PARTNERSHIPS AMONG COMPANIES OFFERING STANDBY DIESEL GENERATORS TO DRIVE MARKET
                    TABLE 39 STANDBY POWER: DIESEL GENERATOR MARKET, BY REGION, 2021–2023 (USD MILLION)
                    TABLE 40 STANDBY POWER: MARKET, BY REGION, 2024–2029 (USD MILLION)
    7.3 PEAK SHAVING 
           7.3.1 IMPROVED POWER QUALITY, REDUCED CARBON EMISSIONS, INCREASED OPERATIONAL RELIABILITY, AND ENERGY EFFICIENCY TO DRIVE DEMAND
                    TABLE 41 PEAK SHAVING: MARKET, BY REGION, 2021–2023 (USD MILLION)
                    TABLE 42 PEAK SHAVING: MARKET, BY REGION, 2024–2029 (USD MILLION)
    7.4 PRIME & CONTINUOUS POWER 
           7.4.1 RISING USE OF PRIME & CONTINUOUS GENERATORS IN REMOTE LOCATIONS OR HARD-TO-ACCESS AREAS TO DRIVE MARKET
                    TABLE 43 PRIME & CONTINUOUS POWER: POWER DIESEL GENERATORS MARKET, BY REGION, 2021–2023 (USD MILLION)
                    TABLE 44 PRIME & CONTINUOUS POWER: POWER MARKET, BY REGION, 2024–2029 (USD MILLION)
 
8 DIESEL GENERATOR MARKET, BY POWER RATING (Page No. - 119)
    8.1 INTRODUCTION 
           FIGURE 43 MARKET, BY POWER RATING, 2023
           TABLE 45 DIESEL GENERATOR MARKET, BY POWER RATING, 2021–2023 (USD MILLION)
           TABLE 46 MARKET, BY POWER RATING, 2024–2029 (USD MILLION)
           TABLE 47 MARKET, BY POWER RATING, 2021–2023 (THOUSAND UNITS)
           TABLE 48 MARKET, BY POWER RATING, 2024–2029 (THOUSAND UNITS)
    8.2 UP TO 50 KW 
           8.2.1 INCREASING DEMAND FROM SMALL-SCALE BUSINESSES AND HOMEOWNERS TO BOOST MARKET GROWTH
                    TABLE 49 UP TO 50 KW: DIESEL GENERATOR MARKET, BY REGION, 2021–2023 (USD MILLION)
                    TABLE 50 UP TO 50 KW: MARKET, BY REGION, 2024–2029 (USD MILLION)
    8.3 51–280 KW 
           8.3.1 GROWING USE AT REMOTE CONSTRUCTION SITES AND IN TELECOM, MINING, AND SMALL OIL & GAS PROJECTS TO DRIVE MARKET
                    TABLE 51 51–280 KW: MARKET, BY REGION, 2021–2023 (USD MILLION)
                    TABLE 52 51–280 KW: MARKET, BY REGION, 2024–2029 (USD MILLION)
    8.4 281–500 KW 
           8.4.1 RISING DEMAND IN OIL & GAS AND MINING INDUSTRIES TO FUEL MARKET GROWTH
                    TABLE 53 281–500 KW: MARKET, BY REGION, 2021–2023 (USD MILLION)
                    TABLE 54 281–500 KW: MARKET, BY REGION, 2024–2029 (USD MILLION)
    8.5 501–2,000 KW 
           8.5.1 RISING DEPLOYMENT IN CHEMICALS AND PETROCHEMICALS INDUSTRIES AND COMMERCIAL SECTOR TO CREATE LUCRATIVE OPPORTUNITIES FOR MARKET PLAYERS
                    TABLE 55 501–2,000 KW: MARKET, BY REGION, 2021–2023 (USD MILLION)
                    TABLE 56 501–2,000 KW: MARKET, BY REGION, 2024–2029 (USD MILLION)
    8.6 ABOVE 2,000 KW 
           8.6.1 GROWING NEED FOR UNINTERRUPTED POWER SUPPLY IN MARINE INDUSTRY TO DRIVE DEMAND
                    TABLE 57 ABOVE 2,000 KW: MARKET, BY REGION, 2021–2023 (USD MILLION)
                    TABLE 58 ABOVE 2,000 KW: MARKET, BY REGION, 2024–2029 (USD MILLION)
 
9 DIESEL GENERATOR MARKET, BY END USER (Page No. - 128)
    9.1 INTRODUCTION 
           FIGURE 44 MARKET, BY END USER, 2023
           TABLE 59 DIESEL GENERATOR MARKET, BY END USER, 2021–2023 (USD MILLION)
           TABLE 60 MARKET, BY END USER, 2024–2029 (USD MILLION)
    9.2 INDUSTRIAL 
           TABLE 61 INDUSTRIAL: DIESEL GENERATOR MARKET, BY REGION, 2021–2023 (USD MILLION)
           TABLE 62 INDUSTRIAL: MARKET, BY REGION, 2024–2029 (USD MILLION)
           TABLE 63 INDUSTRIAL: MARKET, BY END USER, 2021–2023 (USD MILLION)
           TABLE 64 INDUSTRIAL: MARKET, BY END USER, 2024–2029 (USD MILLION)
           9.2.1 UTILITIES/POWER GENERATION
                    9.2.1.1 Rising use of diesel generators by utilities in emergencies for generating electricity to drive market
                               TABLE 65 UTILITIES/POWER GENERATION: DIESEL GENERATOR MARKET, BY REGION, 2021–2023 (USD MILLION)
                               TABLE 66 UTILITIES/POWER GENERATION: MARKET, BY REGION, 2024–2029 (USD MILLION)
           9.2.2 OIL & GAS
                    9.2.2.1 Growing use of diesel generators during drilling and digging activities to drive market
                               TABLE 67 OIL & GAS: DIESEL GENERATORS MARKET, BY REGION, 2021–2023 (USD MILLION)
                               TABLE 68 OIL & GAS: MARKET, BY REGION, 2024–2029 (USD MILLION)
           9.2.3 CONSTRUCTION
                    9.2.3.1 Low maintenance and operational costs to drive demand
                               TABLE 69 CONSTRUCTION: MARKET, BY REGION, 2021–2023 (USD MILLION)
                               TABLE 70 CONSTRUCTION: MARKET, BY REGION, 2024–2029 (USD MILLION)
           9.2.4 MANUFACTURING
                    9.2.4.1 Capability to deliver uninterrupted power to manufacturing units during grid failure and voltage fluctuations to fuel demand
                               TABLE 71 MANUFACTURING: DIESEL GENERATORS MARKET, BY REGION, 2021–2023 (USD MILLION)
                               TABLE 72 MANUFACTURING: MARKET, BY REGION, 2024–2029 (USD MILLION)
           9.2.5 MINING & METALS
                    9.2.5.1 Lack of access to power grids to fuel demand
                               TABLE 73 MINING & METALS: MARKET, BY REGION, 2021–2023 (USD MILLION)
                               TABLE 74 MINING & METALS: MARKET, BY REGION, 2024–2029 (USD MILLION)
           9.2.6 MARINE
                    9.2.6.1 Low fuel consumption, high thermal efficiency, and adaptability to various conditions to drive demand
                               TABLE 75 MARINE: MARKET, BY REGION, 2021–2023 (USD MILLION)
                               TABLE 76 MARINE: MARKET, BY REGION, 2024–2029 (USD MILLION)
           9.2.7 OTHER INDUSTRIAL END USERS
                    TABLE 77 OTHER INDUSTRIAL END USERS: MARKET, BY REGION, 2021–2023 (USD MILLION)
                    TABLE 78 OTHER INDUSTRIAL END USERS: MARKET, BY REGION, 2024–2029 (USD MILLION)
    9.3 COMMERCIAL 
           TABLE 79 COMMERCIAL: DIESEL GENERATOR MARKET, BY REGION, 2021–2023 (USD MILLION)
           TABLE 80 COMMERCIAL: MARKET, BY REGION, 2024–2029 (USD MILLION)
           TABLE 81 COMMERCIAL: MARKET, BY END USER, 2021–2023 (USD MILLION)
           TABLE 82 COMMERCIAL: MARKET, BY END USER, 2024–2029 (USD MILLION)
           9.3.1 IT & TELECOM
                    9.3.1.1 Requirement for uninterrupted power supply to drive demand
                               TABLE 83 IT & TELECOM: DIESEL GENERATORS MARKET, BY REGION, 2021–2023 (USD MILLION)
                               TABLE 84 IT & TELECOM: MARKET, BY REGION, 2024–2029 (USD MILLION)
           9.3.2 HEALTHCARE
                    9.3.2.1 Stringent regulations related to hospital backup generators outlined by several organizations to drive demand
                               TABLE 85 HEALTHCARE: MARKET, BY REGION, 2021–2023 (USD MILLION)
                               TABLE 86 HEALTHCARE: MARKET, BY REGION, 2024–2029 (USD MILLION)
           9.3.3 OTHER COMMERCIAL END USERS
                    TABLE 87 OTHER COMMERCIAL END USERS: MARKET, BY REGION, 2021–2023 (USD MILLION)
                    TABLE 88 OTHER COMMERCIAL END USERS: MARKET, BY REGION, 2024–2029 (USD MILLION)
    9.4 RESIDENTIAL 
           9.4.1 INCREASING DEMAND FOR DIESEL GENERATORS IN AREAS PRONE TO FREQUENT BLACKOUTS TO DRIVE MARKET
                    TABLE 89 RESIDENTIAL: MARKET, BY REGION, 2021–2023 (USD MILLION)
                    TABLE 90 RESIDENTIAL: MARKET, BY REGION, 2024–2029 (USD MILLION)
 
10 DIESEL GENERATOR MARKET, BY REGION (Page No. - 145)
     10.1 INTRODUCTION 
               FIGURE 45 NORTH AMERICA TO REGISTER HIGHEST CAGR IN DIESEL GENERATORS MARKET DURING FORECAST PERIOD
               FIGURE 46 MARKET, BY REGION, 2023
               TABLE 91 DIESEL GENERATOR MARKET, BY REGION, 2021–2023 (USD MILLION)
               TABLE 92 MARKET, BY REGION, 2024–2029 (USD MILLION)
               TABLE 93 MARKET, BY REGION, 2021–2023 (THOUSAND UNITS)
               TABLE 94 MARKET, BY REGION, 2024–2029 (THOUSAND UNITS)
     10.2 NORTH AMERICA 
             10.2.1 IMPACT OF RECESSION ON MARKET IN NORTH AMERICA
                       FIGURE 47 NORTH AMERICA: MARKET SNAPSHOT
                       TABLE 95 NORTH AMERICA: DIESEL GENERATOR MARKET, BY POWER RATING, 2021–2023 (USD MILLION)
                       TABLE 96 NORTH AMERICA: MARKET, BY POWER RATING, 2024–2029 (USD MILLION)
                       TABLE 97 NORTH AMERICA: MARKET, BY DESIGN, 2021–2023 (USD MILLION)
                       TABLE 98 NORTH AMERICA: MARKET, BY DESIGN, 2024–2029 (USD MILLION)
                       TABLE 99 NORTH AMERICA: MARKET, BY APPLICATION, 2021–2023 (USD MILLION)
                       TABLE 100 NORTH AMERICA: MARKET, BY APPLICATION, 2024–2029 (USD MILLION)
                       TABLE 101 NORTH AMERICA: MARKET, BY END USER, 2021–2023 (USD MILLION)
                       TABLE 102 NORTH AMERICA: MARKET, BY END USER, 2024–2029 (USD MILLION)
                       TABLE 103 NORTH AMERICA: MARKET FOR INDUSTRIAL, BY END USER, 2021–2023 (USD MILLION)
                       TABLE 104 NORTH AMERICA: MARKET FOR INDUSTRIAL, BY END USER, 2024–2029 (USD MILLION)
                       TABLE 105 NORTH AMERICA: MARKET FOR COMMERCIAL, BY END USER, 2021–2023 (USD MILLION)
                       TABLE 106 NORTH AMERICA: MARKET FOR COMMERCIAL, BY END USER, 2024–2029 (USD MILLION)
                       TABLE 107 NORTH AMERICA: MARKET, BY COUNTRY, 2021–2023 (USD MILLION)
                       TABLE 108 NORTH AMERICA: MARKET, BY COUNTRY, 2024–2029 (USD MILLION)
             10.2.2 US
                                   10.2.2.1 Growing industrialization to drive demand
                                   TABLE 109 US: DIESEL GENERATOR MARKET, BY END USER, 2021–2023 (USD MILLION)
                                   TABLE 110 US: MARKET, BY END USER, 2024–2029 (USD MILLION)
                                   TABLE 111 US: MARKET FOR INDUSTRIAL, BY END USER, 2021–2023 (USD MILLION)
                                   TABLE 112 US: MARKET FOR INDUSTRIAL, BY END USER, 2024–2029 (USD MILLION)
                                   TABLE 113 US: MARKET FOR COMMERCIAL, BY END USER, 2021–2023 (USD MILLION)
                                   TABLE 114 US: MARKET FOR COMMERCIAL, BY END USER, 2024–2029 (USD MILLION)
             10.2.3 CANADA
                       10.2.3.1 Increasing offshore oil discoveries and oil & gas projects to propel demand
                                   TABLE 115 CANADA: DIESEL GENERATOR MARKET, BY END USER, 2021–2023 (USD MILLION)
                                   TABLE 116 CANADA: MARKET, BY END USER, 2024–2029 (USD MILLION)
                                   TABLE 117 CANADA: MARKET FOR INDUSTRIAL, BY END USER, 2021–2023 (USD MILLION)
                                   TABLE 118 CANADA: MARKET FOR INDUSTRIAL, BY END USER, 2024–2029 (USD MILLION)
                                   TABLE 119 CANADA: MARKET FOR COMMERCIAL, BY END USER, 2021–2023 (USD MILLION)
                                   TABLE 120 CANADA: MARKET FOR COMMERCIAL, BY END USER, 2024–2029 (USD MILLION)
             10.2.4 MEXICO
                       10.2.4.1 Expanding mining and oil & gas industries to drive demand
                                   TABLE 121 MEXICO: DIESEL GENERATOR MARKET, BY END USER, 2021–2023 (USD MILLION)
                                   TABLE 122 MEXICO: MARKET, BY END USER, 2024–2029 (USD MILLION)
                                   TABLE 123 MEXICO: MARKET FOR INDUSTRIAL, BY END USER, 2021–2023 (USD MILLION)
                                   TABLE 124 MEXICO: MARKET FOR INDUSTRIAL, BY END USER, 2024–2029 (USD MILLION)
                                   TABLE 125 MEXICO: MARKET FOR COMMERCIAL, BY END USER, 2021–2023 (USD MILLION)
                                   TABLE 126 MEXICO: MARKET FOR COMMERCIAL, BY END USER, 2024–2029 (USD MILLION)
     10.3 EUROPE 
             10.3.1 IMPACT OF RECESSION ON MARKET IN EUROPE
                       TABLE 127 EUROPE: DIESEL GENERATOR MARKET, BY POWER RATING, 2021–2023 (USD MILLION)
                       TABLE 128 EUROPE: MARKET, BY POWER RATING, 2024–2029 (USD MILLION)
                       TABLE 129 EUROPE: MARKET, BY DESIGN, 2021–2023 (USD MILLION)
                       TABLE 130 EUROPE: MARKET, BY DESIGN, 2024–2029 (USD MILLION)
                       TABLE 131 EUROPE: MARKET, BY APPLICATION, 2021–2023 (USD MILLION)
                       TABLE 132 EUROPE: MARKET, BY APPLICATION, 2024–2029 (USD MILLION)
                       TABLE 133 EUROPE: MARKET, BY END USER, 2021–2023 (USD MILLION)
                       TABLE 134 EUROPE: MARKET, BY END USER, 2024–2029 (USD MILLION)
                       TABLE 135 EUROPE: MARKET FOR INDUSTRIAL, END USER, 2021–2023 (USD MILLION)
                       TABLE 136 EUROPE: MARKET FOR INDUSTRIAL, END USER, 2024–2029 (USD MILLION)
                       TABLE 137 EUROPE: MARKET FOR COMMERCIAL, END USER, 2021–2023 (USD MILLION)
                       TABLE 138 EUROPE: MARKET FOR COMMERCIAL, END USER, 2024–2029 (USD MILLION)
                       TABLE 139 EUROPE: MARKET, BY COUNTRY, 2021–2023 (USD MILLION)
                       TABLE 140 EUROPE: GENERATOR SALES MARKET, BY COUNTRY, 2024–2029 (USD MILLION)
             10.3.2 RUSSIA
                       10.3.2.1 Increasing investments in oil & gas projects to drive demand
                                   TABLE 141 RUSSIA: DIESEL GENERATOR MARKET, BY END USER, 2021–2023 (USD MILLION)
                                   TABLE 142 RUSSIA: MARKET, BY END USER, 2024–2029 (USD MILLION)
                                   TABLE 143 RUSSIA: MARKET FOR INDUSTRIAL, BY END USER, 2021–2023 (USD MILLION)
                                   TABLE 144 RUSSIA: MARKET FOR INDUSTRIAL, BY END USER, 2024–2029 (USD MILLION)
                                   TABLE 145 RUSSIA: MARKET FOR COMMERCIAL, BY END USER, 2021–2023 (USD MILLION)
                                   TABLE 146 RUSSIA: MARKET FOR COMMERCIAL, BY END USER, 2024–2029 (USD MILLION)
             10.3.3 UK
                       10.3.3.1 Increasing power demand from data centers and construction sites to fuel market growth
                                   TABLE 147 UK: DIESEL GENERATOR MARKET, BY END USER, 2021–2023 (USD MILLION)
                                   TABLE 148 UK: MARKET, BY END USER, 2024–2029 (USD MILLION)
                                   TABLE 149 UK: MARKET FOR INDUSTRIAL, END USER, 2021–2023 (USD MILLION)
                                   TABLE 150 UK: MARKET FOR INDUSTRIAL, END USER, 2024–2029 (USD MILLION)
                                   TABLE 151 UK: MARKET FOR COMMERCIAL, END USER, 2021–2023 (USD MILLION)
                                   TABLE 152 UK: MARKET FOR COMMERCIAL, END USER, 2024–2029 (USD MILLION)
             10.3.4 GERMANY
                       10.3.4.1 Rising expenditure on infrastructure development and expansion of data centers to drive demand
                                   TABLE 153 GERMANY: DIESEL GENERATOR MARKET, BY END USER, 2021–2023 (USD MILLION)
                                   TABLE 154 GERMANY: MARKET, BY END USER, 2024–2029 (USD MILLION)
                                   TABLE 155 GERMANY: MARKET FOR INDUSTRIAL, END USER, 2021–2023 (USD MILLION)
                                   TABLE 156 GERMANY: MARKET FOR INDUSTRIAL, END USER, 2024–2029 (USD MILLION)
                                   TABLE 157 GERMANY: MARKET FOR COMMERCIAL, END USER, 2021–2023 (USD MILLION)
                                   TABLE 158 GERMANY: MARKET FOR COMMERCIAL, END USER, 2024–2029 (USD MILLION)
             10.3.5 FRANCE
                       10.3.5.1 Increasing power demand and rising investments in manufacturing sector to fuel market growth
                                   TABLE 159 FRANCE: DIESEL GENERATOR MARKET, BY END USER, 2021–2023 (USD MILLION)
                                   TABLE 160 FRANCE: MARKET, BY END USER, 2024–2029 (USD MILLION)
                                   TABLE 161 FRANCE: MARKET FOR INDUSTRIAL, END USER, 2021–2023 (USD MILLION)
                                   TABLE 162 FRANCE: MARKET FOR INDUSTRIAL, END USER, 2024–2029 (USD MILLION)
                                   TABLE 163 FRANCE: MARKET FOR COMMERCIAL, END USER, 2021–2023 (USD MILLION)
                                   TABLE 164 FRANCE: MARKET FOR COMMERCIAL, END USER, 2024–2029 (USD MILLION)
             10.3.6 REST OF EUROPE
                       TABLE 165 REST OF EUROPE: DIESEL GENERATOR MARKET, BY END USER, 2021–2023 (USD MILLION)
                       TABLE 166 REST OF EUROPE: MARKET, BY END USER, 2024–2029 (USD MILLION)
                       TABLE 167 REST OF EUROPE: MARKET FOR INDUSTRIAL, BY END USER, 2021–2023 (USD MILLION)
                       TABLE 168 REST OF EUROPE: MARKET FOR INDUSTRIAL, BY END USER, 2024–2029 (USD MILLION)
                       TABLE 169 REST OF EUROPE: MARKET FOR COMMERCIAL, BY END USER, 2021–2023 (USD MILLION)
                       TABLE 170 REST OF EUROPE: MARKET FOR COMMERCIAL, BY END USER, 2024–2029 (USD MILLION)
     10.4 SOUTH AMERICA 
             10.4.1 IMPACT OF RECESSION ON MARKET IN SOUTH AMERICA
                       TABLE 171 SOUTH AMERICA: DIESEL GENERATOR MARKET, BY POWER RATING, 2021–2023 (USD MILLION)
                       TABLE 172 SOUTH AMERICA: MARKET, BY POWER RATING, 2024–2029 (USD MILLION)
                       TABLE 173 SOUTH AMERICA: MARKET, BY DESIGN, 2021–2023 (USD MILLION)
                       TABLE 174 SOUTH AMERICA: MARKET, BY DESIGN, 2024–2029 (USD MILLION)
                       TABLE 175 SOUTH AMERICA: MARKET, BY APPLICATION, 2021–2023 (USD MILLION)
                       TABLE 176 SOUTH AMERICA: MARKET, BY APPLICATION, 2024–2029 (USD MILLION)
                       TABLE 177 SOUTH AMERICA: MARKET, BY END USER, 2021–2023 (USD MILLION)
                       TABLE 178 SOUTH AMERICA: MARKET, BY END USER, 2024–2029 (USD MILLION)
                       TABLE 179 SOUTH AMERICA: MARKET FOR INDUSTRIAL, END USER, 2021–2023 (USD MILLION)
                       TABLE 180 SOUTH AMERICA: MARKET FOR INDUSTRIAL, END USER, 2024–2029 (USD MILLION)
                       TABLE 181 SOUTH AMERICA: MARKET FOR COMMERCIAL, END USER, 2021–2023 (USD MILLION)
                       TABLE 182 SOUTH AMERICA: MARKET FOR COMMERCIAL, END USER, 2024–2029 (USD MILLION)
                       TABLE 183 SOUTH AMERICA: MARKET, BY COUNTRY, 2021–2023 (USD MILLION)
                       TABLE 184 SOUTH AMERICA: MARKET, BY COUNTRY, 2024–2029 (USD MILLION)
             10.4.2 BRAZIL
                       10.4.2.1 Growing adoption in transportation and construction sectors to drive market
                                   TABLE 185 BRAZIL: DIESEL GENERATOR MARKET, BY END USER, 2021–2023 (USD MILLION)
                                   TABLE 186 BRAZIL: MARKET, BY END USER, 2024–2029 (USD MILLION)
                                   TABLE 187 BRAZIL: MARKET FOR INDUSTRIAL, END USER, 2021–2023 (USD MILLION)
                                   TABLE 188 BRAZIL: MARKET FOR INDUSTRIAL, END USER, 2024–2029 (USD MILLION)
                                   TABLE 189 BRAZIL: MARKET FOR COMMERCIAL, END USER, 2021–2023 (USD MILLION)
                                   TABLE 190 BRAZIL: MARKET FOR COMMERCIAL, END USER, 2024–2029 (USD MILLION)
             10.4.3 ARGENTINA
                       10.4.3.1 Government-led efforts to increase fuel supply to drive demand
                                   TABLE 191 ARGENTINA: DIESEL GENERATOR MARKET, BY END USER, 2021–2023 (USD MILLION)
                                   TABLE 192 ARGENTINA: MARKET, BY END USER, 2024–2029 (USD MILLION)
                                   TABLE 193 ARGENTINA: MARKET FOR INDUSTRIAL, END USER, 2021–2023 (USD MILLION)
                                   TABLE 194 ARGENTINA: MARKET FOR INDUSTRIAL, END USER, 2024–2029 (USD MILLION)
                                   TABLE 195 ARGENTINA: MARKET FOR COMMERCIAL, END USER, 2021–2023 (USD MILLION)
                                   TABLE 196 ARGENTINA: MARKET FOR COMMERCIAL, END USER, 2024–2029 (USD MILLION)
             10.4.4 REST OF SOUTH AMERICA
                       TABLE 197 REST OF SOUTH AMERICA: DIESEL GENERATOR MARKET, BY END USER, 2021–2023 (USD MILLION)
                       TABLE 198 REST OF SOUTH AMERICA: MARKET, BY END USER, 2024–2029 (USD MILLION)
                       TABLE 199 REST OF SOUTH AMERICA: MARKET FOR INDUSTRIAL, END USER, 2021–2023 (USD MILLION)
                       TABLE 200 REST OF SOUTH AMERICA: MARKET FOR INDUSTRIAL, END USER, 2024–2029 (USD MILLION)
                       TABLE 201 REST OF SOUTH AMERICA: MARKET FOR COMMERCIAL, END USER, 2021–2023 (USD MILLION)
                       TABLE 202 REST OF SOUTH AMERICA: MARKET FOR COMMERCIAL, END USER, 2024–2029 (USD MILLION)
     10.5 ASIA PACIFIC 
             10.5.1 IMPACT OF RECESSION ON MARKET IN ASIA PACIFIC
                       FIGURE 48 ASIA PACIFIC: MARKET SNAPSHOT
                       TABLE 203 ASIA PACIFIC: DIESEL GENERATOR MARKET, BY POWER RATING, 2021–2023 (USD MILLION)
                       TABLE 204 ASIA PACIFIC: MARKET, BY POWER RATING, 2024–2029 (USD MILLION)
                       TABLE 205 ASIA PACIFIC: MARKET, BY DESIGN, 2021–2023 (USD MILLION)
                       TABLE 206 ASIA PACIFIC: MARKET, BY DESIGN, 2024–2029 (USD MILLION)
                       TABLE 207 ASIA PACIFIC: MARKET, BY APPLICATION, 2021–2023 (USD MILLION)
                       TABLE 208 ASIA PACIFIC: MARKET, BY APPLICATION, 2024–2029 (USD MILLION)
                       TABLE 209 ASIA PACIFIC: MARKET, BY END USER, 2021–2023 (USD MILLION)
                       TABLE 210 ASIA PACIFIC: MARKET, BY END USER, 2024–2029 (USD MILLION)
                       TABLE 211 ASIA PACIFIC: MARKET FOR INDUSTRIAL, BY END USER, 2021–2023 (USD MILLION)
                       TABLE 212 ASIA PACIFIC: MARKET FOR INDUSTRIAL, BY END USER, 2024–2029 (USD MILLION)
                       TABLE 213 ASIA PACIFIC: MARKET FOR COMMERCIAL, BY END USER, 2021–2023 (USD MILLION)
                       TABLE 214 ASIA PACIFIC: MARKET FOR COMMERCIAL, BY END USER, 2024–2029 (USD MILLION)
                       TABLE 215 ASIA PACIFIC: MARKET, BY COUNTRY, 2021–2023 (USD MILLION)
                       TABLE 216 ASIA PACIFIC: MARKET, BY COUNTRY, 2024–2029 (USD MILLION)
             10.5.2 CHINA
                       10.5.2.1 Increasing power demand to drive market
                                   TABLE 217 CHINA: DIESEL GENERATOR MARKET, BY END USER, 2021–2023 (USD MILLION)
                                   TABLE 218 CHINA: MARKET, BY END USER, 2024–2029 (USD MILLION)
                                   TABLE 219 CHINA: MARKET FOR INDUSTRIAL, BY END USER, 2021–2023 (USD MILLION)
                                   TABLE 220 CHINA: MARKET FOR INDUSTRIAL, BY END USER, 2024–2029 (USD MILLION)
                                   TABLE 221 CHINA: MARKET FOR COMMERCIAL, BY END USER, 2021–2023 (USD MILLION)
                                   TABLE 222 CHINA: MARKET FOR COMMERCIAL, BY END USER, 2024–2029 (USD MILLION)
             10.5.3 INDIA
                       10.5.3.1 Rising investments in data centers to fuel demand
                                   TABLE 223 INDIA: DIESEL GENERATOR MARKET, BY END USER, 2021–2023 (USD MILLION)
                                   TABLE 224 INDIA: MARKET, BY END USER, 2024–2029 (USD MILLION)
                                   TABLE 225 INDIA: MARKET FOR INDUSTRIAL, BY END USER, 2021–2023 (USD MILLION)
                                   TABLE 226 INDIA: MARKET FOR INDUSTRIAL, BY END USER, 2024–2029 (USD MILLION)
                                   TABLE 227 INDIA: MARKET FOR COMMERCIAL, BY END USER, 2021–2023 (USD MILLION)
                                   TABLE 228 INDIA: MARKET FOR COMMERCIAL, BY END USER, 2024–2029 (USD MILLION)
             10.5.4 JAPAN
                       10.5.4.1 Increasing occurrences of natural disasters to fuel demand
                                   TABLE 229 JAPAN: DIESEL GENERATOR MARKET, BY END USER, 2021–2023 (USD MILLION)
                                   TABLE 230 JAPAN: MARKET, BY END USER, 2024–2029 (USD MILLION)
                                   TABLE 231 JAPAN: MARKET FOR INDUSTRIAL, BY END USER, 2021–2023 (USD MILLION)
                                   TABLE 232 JAPAN: MARKET FOR INDUSTRIAL, BY END USER, 2024–2029 (USD MILLION)
                                   TABLE 233 JAPAN: MARKET FOR COMMERCIAL, BY END USER, 2021–2023 (USD MILLION)
                                   TABLE 234 JAPAN: MARKET FOR COMMERCIAL, BY END USER, 2024–2029 (USD MILLION)
             10.5.5 SOUTH KOREA
                       10.5.5.1 Growing need for steady and uninterrupted power supply in manufacturing sector to drive demand
                                   TABLE 235 SOUTH KOREA: DIESEL GENERATOR MARKET, BY END USER, 2021–2023 (USD MILLION)
                                   TABLE 236 SOUTH KOREA: MARKET, BY END USER, 2024–2029 (USD MILLION)
                                   TABLE 237 SOUTH KOREA: MARKET FOR INDUSTRIAL, BY END USER, 2021–2023 (USD MILLION)
                                   TABLE 238 SOUTH KOREA: MARKET FOR INDUSTRIAL, BY END USER, 2024–2029 (USD MILLION)
                                   TABLE 239 SOUTH KOREA: MARKET FOR COMMERCIAL, BY END USER, 2021–2023 (USD MILLION)
                                   TABLE 240 SOUTH KOREA: MARKET FOR COMMERCIAL, BY END USER, 2024–2029 (USD MILLION)
             10.5.6 AUSTRALIA
                       10.5.6.1 Expanding mining industry and dependence on diesel generators to drive market
                                   TABLE 241 AUSTRALIA: DIESEL GENERATOR MARKET, BY END USER, 2021–2023 (USD MILLION)
                                   TABLE 242 AUSTRALIA: MARKET, BY END USER, 2024–2029 (USD MILLION)
                                   TABLE 243 AUSTRALIA: MARKET FOR INDUSTRIAL, BY END USER, 2021–2023 (USD MILLION)
                                   TABLE 244 AUSTRALIA: MARKET FOR INDUSTRIAL, BY END USER, 2024–2029 (USD MILLION)
                                   TABLE 245 AUSTRALIA: MARKET FOR COMMERCIAL, BY END USER, 2021–2023 (USD MILLION)
                                   TABLE 246 AUSTRALIA: MARKET FOR COMMERCIAL, BY END USER, 2024–2029 (USD MILLION)
             10.5.7 REST OF ASIA PACIFIC
                       TABLE 247 REST OF ASIA PACIFIC: DIESEL GENERATOR MARKET, BY END USER, 2021–2023 (USD MILLION)
                       TABLE 248 REST OF ASIA PACIFIC: MARKET, BY END USER, 2024–2029 (USD MILLION)
                       TABLE 249 REST OF ASIA PACIFIC: MARKET FOR INDUSTRIAL, BY END USER, 2021–2023 (USD MILLION)
                       TABLE 250 REST OF ASIA PACIFIC: MARKET FOR INDUSTRIAL, BY END USER, 2024–2029 (USD MILLION)
                       TABLE 251 REST OF ASIA PACIFIC: MARKET FOR COMMERCIAL, BY END USER, 2021–2023 (USD MILLION)
                       TABLE 252 REST OF ASIA PACIFIC: MARKET FOR COMMERCIAL, BY END USER, 2024–2029 (USD MILLION)
     10.6 MIDDLE EAST & AFRICA 
             10.6.1 IMPACT OF RECESSION ON MARKET IN MIDDLE EAST & AFRICA
                       TABLE 253 MIDDLE EAST & AFRICA: DIESEL GENERATOR MARKET, BY POWER RATING, 2021–2023 (USD MILLION)
                       TABLE 254 MIDDLE EAST & AFRICA: MARKET, BY POWER RATING, 2024–2029 (USD MILLION)
                       TABLE 255 MIDDLE EAST & AFRICA: MARKET, BY DESIGN, 2021–2023 (USD MILLION)
                       TABLE 256 MIDDLE EAST & AFRICA: MARKET, BY DESIGN, 2024–2029 (USD MILLION)
                       TABLE 257 MIDDLE EAST & AFRICA: MARKET, BY APPLICATION, 2021–2023 (USD MILLION)
                       TABLE 258 MIDDLE EAST & AFRICA: MARKET, BY APPLICATION, 2024–2029 (USD MILLION)
                       TABLE 259 MIDDLE EAST & AFRICA: MARKET, BY END USER, 2021–2023 (USD MILLION)
                       TABLE 260 MIDDLE EAST & AFRICA: MARKET, BY END USER, 2024–2029 (USD MILLION)
                       TABLE 261 MIDDLE EAST & AFRICA: MARKET FOR INDUSTRIAL, BY END USER, 2021–2023 (USD MILLION)
                       TABLE 262 MIDDLE EAST & AFRICA: MARKET FOR INDUSTRIAL, BY END USER, 2024–2029 (USD MILLION)
                       TABLE 263 MIDDLE EAST & AFRICA: MARKET, BY COMMERCIAL, 2021–2023 (USD MILLION)
                       TABLE 264 MIDDLE EAST & AFRICA: MARKET FOR COMMERCIAL, BY END USER, 2024–2029 (USD MILLION)
                       TABLE 265 MIDDLE EAST & AFRICA: MARKET, BY COUNTRY, 2021–2023 (USD MILLION)
                       TABLE 266 MIDDLE EAST & AFRICA: MARKET, BY COUNTRY, 2024–2029 (USD MILLION)
             10.6.2 GCC COUNTRIES
                       10.6.2.1 Launch of new diesel generators with enhanced power capability to boost market growth
                                   TABLE 267 GCC COUNTRIES: DIESEL GENERATOR MARKET, BY END USER, 2021–2023 (USD MILLION)
                                   TABLE 268 GCC COUNTRIES: MARKET, BY END USER, 2024–2029 (USD MILLION)
                                   TABLE 269 GCC COUNTRIES: MARKET FOR INDUSTRIAL, BY END USER, 2021–2023 (USD MILLION)
                                   TABLE 270 GCC COUNTRIES: MARKET FOR INDUSTRIAL, BY END USER, 2024–2029 (USD MILLION)
                                   TABLE 271 GCC COUNTRIES: MARKET FOR COMMERCIAL, BY END USER, 2021–2023 (USD MILLION)
                                   TABLE 272 GCC COUNTRIES: MARKET FOR COMMERCIAL, BY END USER, 2024–2029 (USD MILLION)
                                   TABLE 273 GCC COUNTRIES: MARKET, BY COUNTRY, 2021–2023 (USD MILLION)
                                   TABLE 274 GCC COUNTRIES: MARKET, BY COUNTRY, 2024–2029 (USD MILLION)
                       10.6.2.2 SAUDI ARABIA
                                   10.6.2.2.1 Growing power demand and low supply to boost market growth
                                   TABLE 275 SAUDI ARABIA: DIESEL GENERATOR MARKET, BY END USER, 2021–2023 (USD MILLION)
                                   TABLE 276 SAUDI ARABIA: MARKET, BY END USER, 2024–2029 (USD MILLION)
                                   TABLE 277 SAUDI ARABIA: MARKET FOR INDUSTRIAL, BY END USER, 2021–2023 (USD MILLION)
                                   TABLE 278 SAUDI ARABIA: MARKET FOR INDUSTRIAL, BY END USER, 2024–2029 (USD MILLION)
                                   TABLE 279 SAUDI ARABIA: MARKET FOR COMMERCIAL, BY END USER, 2021–2023 (USD MILLION)
                                   TABLE 280 SAUDI ARABIA: MARKET FOR COMMERCIAL, BY END USER, 2024–2029 (USD MILLION)
                       10.6.2.3 UAE
                                   10.6.2.3.1 Growing energy consumption to drive demand
                                   TABLE 281 UAE: DIESEL GENERATOR MARKET, BY END USER, 2021–2023 (USD MILLION)
                                   TABLE 282 UAE: MARKET, BY END USER, 2024–2029 (USD MILLION)
                                   TABLE 283 UAE: MARKET FOR INDUSTRIAL, BY END USER, 2021–2023 (USD MILLION)
                                   TABLE 284 UAE: MARKET FOR INDUSTRIAL, BY END USER, 2024–2029 (USD MILLION)
                                   TABLE 285 UAE: MARKET FOR COMMERCIAL, BY END USER, 2021–2023 (USD MILLION)
                                   TABLE 286 UAE: MARKET FOR COMMERCIAL, BY END USER, 2024–2029 (USD MILLION)
                       10.6.2.4 Rest of GCC countries
                                   TABLE 287 REST OF GCC COUNTRIES: DIESEL GENERATOR MARKET, BY END USER, 2021–2023 (USD MILLION)
                                   TABLE 288 REST OF GCC COUNTRIES: MARKET, BY END USER, 2024–2029 (USD MILLION)
                                   TABLE 289 REST OF GCC COUNTRIES: MARKET FOR INDUSTRIAL, BY END USER, 2021–2023 (USD MILLION)
                                   TABLE 290 REST OF GCC COUNTRIES: MARKET FOR INDUSTRIAL, BY END USER, 2024–2029 (USD MILLION)
                                   TABLE 291 REST OF GCC COUNTRIES: MARKET FOR COMMERCIAL, BY END USER, 2021–2023 (USD MILLION)
                                   TABLE 292 REST OF GCC COUNTRIES: MARKET FOR COMMERCIAL, BY END USER, 2024–2029 (USD MILLION)
             10.6.3 ALGERIA
                       10.6.3.1 Growing demand for diesel generators in oil & gas industry to drive market
                                   TABLE 293 ALGERIA: DIESEL GENERATOR MARKET, BY END USER, 2021–2023 (USD MILLION)
                                   TABLE 294 ALGERIA: MARKET, BY END USER, 2024–2029 (USD MILLION)
                                   TABLE 295 ALGERIA: MARKET FOR INDUSTRIAL, BY END USER, 2021–2023 (USD MILLION)
                                   TABLE 296 ALGERIA: MARKET FOR INDUSTRIAL, BY END USER, 2024–2029 (USD MILLION)
                                   TABLE 297 ALGERIA: MARKET FOR COMMERCIAL, BY END USER, 2021–2023 (USD MILLION)
                                   TABLE 298 ALGERIA: MARKET FOR COMMERCIAL, BY END USER, 2024–2029 (USD MILLION)
             10.6.4 NIGERIA
                       10.6.4.1 Increasing investments in telecommunications industry to prevent prolonged power outages to drive demand
                                   TABLE 299 NIGERIA: DIESEL GENERATOR MARKET, BY END USER, 2021–2023 (USD MILLION)
                                   TABLE 300 NIGERIA: MARKET, BY END USER, 2024–2029 (USD MILLION)
                                   TABLE 301 NIGERIA: MARKET FOR INDUSTRIAL, BY END USER, 2021–2023 (USD MILLION)
                                   TABLE 302 NIGERIA: MARKET FOR INDUSTRIAL, BY END USER, 2024–2029 (USD MILLION)
                                   TABLE 303 NIGERIA: MARKET FOR COMMERCIAL, BY END USER, 2021–2023 (USD MILLION)
                                   TABLE 304 NIGERIA: MARKET FOR COMMERCIAL, BY END USER, 2024–2029 (USD MILLION)
             10.6.5 SOUTH AFRICA
                       10.6.5.1 Low diesel prices to fuel demand
                                   TABLE 305 SOUTH AFRICA: DIESEL GENERATOR MARKET, BY END USER, 2021–2023 (USD MILLION)
                                   TABLE 306 SOUTH AFRICA: MARKET, BY END USER, 2024–2029 (USD MILLION)
                                   TABLE 307 SOUTH AFRICA: MARKET FOR INDUSTRIAL, BY END USER, 2021–2023 (USD MILLION)
                                   TABLE 308 SOUTH AFRICA: MARKET FOR INDUSTRIAL, BY END USER, 2024–2029 (USD MILLION)
                                   TABLE 309 SOUTH AFRICA: MARKET FOR COMMERCIAL, BY END USER, 2021–2023 (USD MILLION)
                                   TABLE 310 SOUTH AFRICA: MARKET FOR COMMERCIAL, BY END USER, 2024–2029 (USD MILLION)
             10.6.6 REST OF MIDDLE EAST
                       TABLE 311 REST OF MIDDLE EAST: DIESEL GENERATOR MARKET, BY END USER, 2021–2023 (USD MILLION)
                       TABLE 312 REST OF MIDDLE EAST: MARKET, BY END USER, 2024–2029 (USD MILLION)
                       TABLE 313 REST OF MIDDLE EAST: MARKET FOR INDUSTRIAL, BY END USER, 2021–2023 (USD MILLION)
                       TABLE 314 REST OF MIDDLE EAST: MARKET FOR INDUSTRIAL, BY END USER, 2024–2029 (USD MILLION)
                       TABLE 315 REST OF MIDDLE EAST: MARKET FOR COMMERCIAL, BY END USER, 2021–2023 (USD MILLION)
                       TABLE 316 REST OF MIDDLE EAST: MARKET FOR COMMERCIAL, BY END USER, 2024–2029 (USD MILLION)
 
11 COMPETITIVE LANDSCAPE (Page No. - 237)
     11.1 OVERVIEW 
     11.2 STRATEGIES ADOPTED BY KEY PLAYERS, 2021–2023 
               TABLE 317 MARKET: OVERVIEW OF STRATEGIES ADOPTED BY KEY PLAYERS, 2021–2023
     11.3 MARKET SHARE ANALYSIS, 2023 
               FIGURE 49 DIESEL GENERATOR MARKET SHARE ANALYSIS, 2023
               TABLE 318 MARKET: DEGREE OF COMPETITION, 2023
               FIGURE 50 INDUSTRY CONCENTRATION, 2023
     11.4 REVENUE ANALYSIS OF TOP FIVE PLAYERS, 2018–2022 
               FIGURE 51 REVENUE ANALYSIS OF FIVE KEY PLAYERS, 2018–2022
     11.5 COMPANY EVALUATION MATRIX: KEY PLAYERS, 2023 
             11.5.1 STARS
             11.5.2 EMERGING LEADERS
             11.5.3 PERVASIVE PLAYERS
             11.5.4 PARTICIPANTS
                       FIGURE 52 MARKET: COMPANY EVALUATION MATRIX (KEY PLAYERS), 2023
             11.5.5 COMPANY FOOTPRINT: KEY PLAYERS, 2023
                       11.5.5.1 Overall footprint
                                   FIGURE 53 DIESEL GENERATORS MARKET: COMPANY OVERALL FOOTPRINT
                       11.5.5.2 Design footprint
                                   TABLE 319 MARKET: COMPANY DESIGN FOOTPRINT
                       11.5.5.3 Region footprint
                                   TABLE 320 MARKET: COMPANY REGION FOOTPRINT
                       11.5.5.4 Power rating footprint
                                   TABLE 321 MARKET: COMPANY POWER RATING FOOTPRINT
                       11.5.5.5 Application footprint
                                   TABLE 322 MARKET: COMPANY APPLICATION FOOTPRINT
                       11.5.5.6 End user footprint
                                   TABLE 323 MARKET: COMPANY END USER FOOTPRINT
     11.6 COMPANY EVALUATION MATRIX: STARTUPS/SMES, 2023 
             11.6.1 PROGRESSIVE COMPANIES
             11.6.2 RESPONSIVE COMPANIES
             11.6.3 DYNAMIC COMPANIES
             11.6.4 STARTING BLOCKS
                       FIGURE 54 DIESEL GENERATOR MARKET: COMPANY EVALUATION MATRIX (STARTUPS/SMES), 2023
             11.6.5 COMPETITIVE BENCHMARKING: STARTUPS/SMES, 2023
                       11.6.5.1 List of key startups/SMEs
                                   TABLE 324 MARKET: LIST OF KEY STARTUPS/SMES
                       11.6.5.2 Competitive benchmarking of key startups/SMEs
                                   TABLE 325 MARKET: COMPETITIVE BENCHMARKING OF KEY STARTUPS/SMES
     11.7 COMPETITIVE SCENARIOS AND TRENDS 
             11.7.1 PRODUCT LAUNCHES
                       TABLE 326 MARKET: PRODUCT LAUNCHES, NOVEMBER 2021–NOVEMBER 2023
             11.7.2 DEALS
                       TABLE 327 MARKET: DEALS, JULY 2020–MAY 2023
             11.7.3 OTHERS
                       TABLE 328 MARKET: OTHERS, AUGUST 2020–MARCH 2023
     11.8 COMPANY VALUATION AND FINANCIAL METRICS 
               FIGURE 55 MARKET: COMPANY FINANCIAL METRICS, 2024
               FIGURE 56 MARKET: COMPANY VALUATION, 2024
     11.9 BRAND/PRODUCT COMPARISON 
               FIGURE 57 MARKET: BRAND/PRODUCT COMPARISON
 
12 COMPANY PROFILES (Page No. - 258)
     12.1 KEY PLAYERS 
(Business Overview, Products Offered, Recent Developments, and MnM View (Key strengths/Right to Win, Strategic Choices Made, and Weaknesses and Competitive Threats))*
             12.1.1 CATERPILLAR
                       TABLE 329 CATERPILLAR: COMPANY OVERVIEW
                       FIGURE 58 CATERPILLAR: COMPANY SNAPSHOT
                       TABLE 330 CATERPILLAR: PRODUCTS/SOLUTIONS/SERVICES OFFERED
                       TABLE 331 CATERPILLAR: PRODUCT LAUNCHES
             12.1.2 CUMMINS INC.
                       TABLE 332 CUMMINS INC.: COMPANY OVERVIEW
                       FIGURE 59 CUMMINS INC.: COMPANY SNAPSHOT
                       TABLE 333 CUMMINS INC.: PRODUCTS/SOLUTIONS/SERVICES OFFERED
                       TABLE 334 CUMMINS INC.: PRODUCT LAUNCHES
             12.1.3 GENERAC POWER SYSTEMS, INC.
                       TABLE 335 GENERAC POWER SYSTEMS, INC.: COMPANY OVERVIEW
                       FIGURE 60 GENERAC POWER SYSTEMS, INC.: COMPANY SNAPSHOT
                       TABLE 336 GENERAC POWER SYSTEMS, INC.: PRODUCTS/SOLUTIONS/SERVICES OFFERED
             12.1.4 ROLLS-ROYCE PLC
                       TABLE 337 ROLLS-ROYCE PLC: COMPANY OVERVIEW
                       FIGURE 61 ROLLS-ROYCE PLC: COMPANY SNAPSHOT
                       TABLE 338 ROLLS-ROYCE PLC: PRODUCTS/SOLUTIONS/SERVICES OFFERED
                       TABLE 339 ROLLS-ROYCE PLC: DEALS
                       TABLE 340 ROLLS-ROYCE PLC: OTHERS
             12.1.5 MITSUBISHI HEAVY INDUSTRIES, LTD.
                       TABLE 341 MITSUBISHI HEAVY INDUSTRIES, LTD.: COMPANY OVERVIEW
                       FIGURE 62 MITSUBISHI HEAVY INDUSTRIES, LTD.: COMPANY SNAPSHOT
                       TABLE 342 MITSUBISHI HEAVY INDUSTRIES, LTD.: PRODUCTS/SOLUTIONS/SERVICES OFFERED
                       TABLE 343 MITSUBISHI HEAVY INDUSTRIES, LTD.: PRODUCT LAUNCHES
                       TABLE 344 MITSUBISHI HEAVY INDUSTRIES, LTD.: DEALS
             12.1.6 AGGREKO
                       TABLE 345 AGGREKO: COMPANY OVERVIEW
                       TABLE 346 AGGREKO: PRODUCTS/SOLUTIONS/SERVICES OFFERED
                       TABLE 347 AGGREKO: PRODUCT LAUNCHES
                       TABLE 348 AGGREKO: OTHERS
             12.1.7 KOHLER CO.
                       TABLE 349 KOHLER CO.: COMPANY OVERVIEW
                       TABLE 350 KOHLER CO.: PRODUCTS/SOLUTIONS/SERVICES OFFERED
             12.1.8 WÄRTSILÄ
                       TABLE 351 WÄRTSILÄ: COMPANY OVERVIEW
                       FIGURE 63 WÄRTSILÄ: COMPANY SNAPSHOT
                       TABLE 352 WÄRTSILÄ: PRODUCTS/SOLUTIONS/SERVICES OFFERED
             12.1.9 ATLAS COPCO AB
                       TABLE 353 ATLAS COPCO AB: COMPANY OVERVIEW
                       FIGURE 64 ATLAS COPCO AB: COMPANY SNAPSHOT
                       TABLE 354 ATLAS COPCO AB: PRODUCTS/SOLUTIONS/SERVICES OFFERED
                       TABLE 355 ATLAS COPCO AB: PRODUCT LAUNCHES
                       TABLE 356 ATLAS COPCO AB: OTHERS
             12.1.10 WEICHAI HOLDING GROUP CO., LTD.
                                   TABLE 357 WEICHAI HOLDING GROUP CO., LTD.: COMPANY OVERVIEW
                                   FIGURE 65 WEICHAI HOLDING GROUP CO., LTD.: COMPANY SNAPSHOT
                                   TABLE 358 WEICHAI HOLDING GROUP CO., LTD.: PRODUCTS/SOLUTIONS/SERVICES OFFERED
             12.1.11 YAMAHA MOTOR CO., LTD.
                                   TABLE 359 YAMAHA MOTOR CO., LTD.: COMPANY OVERVIEW
                                   FIGURE 66 YAMAHA MOTOR CO., LTD.: COMPANY SNAPSHOT
                                   TABLE 360 YAMAHA MOTOR CO., LTD.: PRODUCTS/SOLUTIONS/SERVICES OFFERED
             12.1.12 HYUNDAI POWER PRODUCTS
                                   TABLE 361 HYUNDAI POWER PRODUCTS: COMPANY OVERVIEW
                                   TABLE 362 HYUNDAI POWER PRODUCTS: PRODUCTS/SOLUTIONS/SERVICES OFFERED
             12.1.13 MAHINDRA POWEROL
                                   TABLE 363 MAHINDRA POWEROL: COMPANY OVERVIEW
                                   TABLE 364 MAHINDRA POWEROL: PRODUCTS/SOLUTIONS/SERVICES OFFERED
             12.1.14 ANGLO BELGIAN CORPORATION NV
                                   TABLE 365 ANGLO BELGIAN CORPORATION NV: COMPANY OVERVIEW
                                   TABLE 366 ANGLO BELGIAN CORPORATION NV: PRODUCTS/SOLUTIONS/SERVICES OFFERED
                                   TABLE 367 ANGLO BELGIAN CORPORATION NV: OTHERS
             12.1.15 FG WILSON
                                   TABLE 368 FG WILSON: COMPANY OVERVIEW
                                   TABLE 369 FG WILSON: PRODUCTS/SOLUTIONS/SERVICES OFFERED
             12.1.16 J C BAMFORD EXCAVATORS LTD.
                                   TABLE 370 J C BAMFORD EXCAVATORS LTD.: COMPANY OVERVIEW
                                   TABLE 371 J C BAMFORD EXCAVATORS LTD.: PRODUCTS/SOLUTIONS/SERVICES OFFERED
                                   TABLE 372 J C BAMFORD EXCAVATORS LTD.: OTHERS
             12.1.17 DOOSAN CORPORATION
                                   TABLE 373 DOOSAN CORPORATION: COMPANY OVERVIEW
                                   FIGURE 67 DOOSAN CORPORATION: COMPANY SNAPSHOT
                                   TABLE 374 DOOSAN CORPORATION: PRODUCTS/SOLUTIONS/SERVICES OFFERED
                                   TABLE 375 DOOSAN CORPORATION: EXPANSIONS
             12.1.18 ASHOK LEYLAND
                                   TABLE 376 ASHOK LEYLAND: COMPANY OVERVIEW
                                   FIGURE 68 ASHOK LEYLAND: COMPANY SNAPSHOT
                                   TABLE 377 ASHOK LEYLAND: PRODUCTS/SOLUTIONS/SERVICES OFFERED
             12.1.19 KUBOTA CORPORATION
                                   TABLE 378 KUBOTA CORPORATION: COMPANY OVERVIEW
                                   FIGURE 69 KUBOTA CORPORATION: COMPANY SNAPSHOT
                                   TABLE 379 KUBOTA CORPORATION: PRODUCTS/SOLUTIONS/SERVICES OFFERED
             12.1.20 KIRLOSKAR
                                   TABLE 380 KIRLOSKAR: COMPANY OVERVIEW
                                   FIGURE 70 KIRLOSKAR: COMPANY SNAPSHOT
                                   TABLE 381 KIRLOSKAR: PRODUCTS/SOLUTIONS/SERVICES OFFERED
     12.2 OTHER PLAYERS 
             12.2.1 AKSA POWER GENERATION
             12.2.2 YANMAR HOLDINGS CO., LTD.
             12.2.3 MAN ENERGY SOLUTIONS
             12.2.4 DENYO CO., LTD.
             12.2.5 PRONK MACHINERY B.V.
*Details on Business Overview, Products Offered, Recent Developments, and MnM View (Key strengths/Right to Win, Strategic Choices Made, and Weaknesses and Competitive Threats) might not be captured in case of unlisted companies.
 
13 APPENDIX (Page No. - 308)
     13.1 INSIGHTS FROM INDUSTRY EXPERTS 
     13.2 DISCUSSION GUIDE 
     13.3 CUSTOMIZATION OPTIONS 
     13.4 KNOWLEDGESTORE: MARKETSANDMARKETS’ SUBSCRIPTION PORTAL 
     13.5 RELATED REPORTS 
     13.6 AUTHOR DETAILS 

The study involved major activities in estimating the current size of the diesel generator market. Exhaustive secondary research was done to collect information on the peer and parent markets. The next step was to validate these findings, assumptions, and sizing with industry experts across the value chain through primary research. Both top-down and bottom-up approaches were employed to estimate the complete market size. Thereafter, market breakdown and data triangulation were used to estimate the market size of the segments and subsegments.

Secondary Research

This research study on the diesel generator market involved the use of extensive secondary sources, directories, and databases, such as Hoovers, Bloomberg, Businessweek, Factiva, International Energy Agency, and United States Energy Association, to identify and collect information useful for a technical, market-oriented, and commercial study of the global diesel generator market. The other secondary sources included annual reports of the companies involved in the market, press releases & investor presentations of companies, white papers, certified publications, articles by recognized authors, manufacturer associations, trade directories, and databases.

Primary Research

The diesel generator market comprises several stakeholders such as diesel generator manufacturers, industrial gas supplying companies, manufacturing industries, distributors of diesel generatorand providers in the supply chain. The demand side of this market is characterized by the rising demand for reliable and emergency power supply. The supply side is characterized by rising demand for contracts from the oil & gas sector and mergers & acquisitions among big players. Various primary sources from both the supply and demand sides of the market were interviewed to obtain qualitative and quantitative information.

Following is the breakdown of primary respondents: 
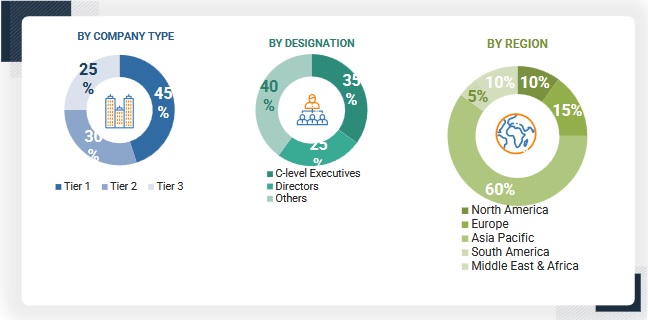
Diesel Generator  Market Size, and Share

To know about the assumptions considered for the study, download the pdf brochure

Market Size Estimation

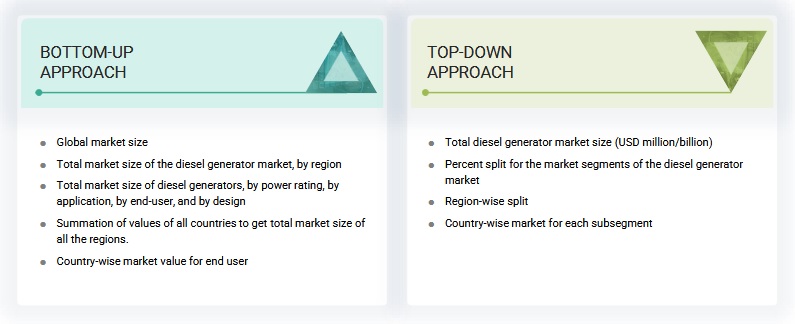
Both top-down and bottom-up approaches were used to estimate and validate the total size of the diesel generator market. These methods were also used extensively to estimate the size of various subsegments in the market. The research methodology used to estimate the market size includes the following:

  • The key players in the industry and market have been identified through extensive secondary research, and their market share in the respective regions has been determined through both secondary and primary research.
  • The industry’s value chain and market size, in terms of value, have been determined through primary and secondary research processes.
  • All percentage shares, splits, and breakdowns have been determined using secondary sources and verified through primaries.

Global Diesel Generator Market Size: Top-down Approach

Diesel Generator  Market Top Down Approach

To know about the assumptions considered for the study, Request for Free Sample Report

Global Diesel Generator Market Size: Bottom-Up Approach

Diesel Generator  Market Bottom Up Approach

Data Triangulation

After arriving at the overall market size from the estimation process explained above, the total market has been split into several segments and subsegments. The complete market engineering process is done to arrive at the exact statistics for all the segments and subsegments, also data triangulation and market breakdown processes have been employed, wherever applicable. The data has been triangulated by examining various factors and trends from both the demand- and supply sides. Along with this, the market has been validated through both the top-down and bottom-up approaches.

Market Definition

A diesel generator is a type of electrical generator that operates using a diesel engine to produce electricity. It consists of a diesel engine, which burns diesel fuel to produce mechanical energy, and an alternator, which converts the mechanical energy into electrical energy. Diesel generators are commonly used as backup power sources in situations where grid power is unavailable or unreliable, such as in remote areas, industrial settings, hospitals, data centers, and residential buildings. They are known for their reliability, durability, and ability to provide continuous power for extended periods of time.

Key Stakeholders

  • Public and Private Electric Utilities
  • Government & Research Organizations
  • Investment Banks
  • Diesel generator manufacturers and providers
  • Industrial gas supplying companies
  • Manufacturing industries
  • R&D laboratories
  • Consulting companies from the energy & power sector
  • Distributors of diesel generator
  • Government and research organizations
  • State and national regulatory authorities

Objectives of the Study

  • To define, describe, analyze, and forecast the size of the global diesel generator market by technology, vertical, source, offering and region, and in terms of value
  • To forecast the market size for five key regions: North America, South America, Europe, Asia Pacific, and Middle East & Africa, along with their key countries
  • To provide detailed information about the key drivers, restraints, opportunities, and challenges influencing the growth of the market
  • To strategically analyze the subsegments with respect to individual growth trends, prospects, and contributions of each segment to the overall market size
  • To analyze market opportunities for stakeholders and the competitive landscape of the market
  • To strategically profile the key players and comprehensively analyze their market shares and core competencies
  • To analyze competitive developments, such as sales contracts, agreements, investments, expansions, new product launches, mergers, partnerships, collaborations, and acquisitions, in the market

Available Customizations:

With the given market data, MarketsandMarkets offers customizations as per the client’s specific needs. The following customization options are available for this report:

Geographic Analysis

  • Further breakdown of region or country-specific analysis

Company Information

  • Detailed analyses and profiling of additional market players (up to 5)
Custom Market Research Services

We will customize the research for you, in case the report listed above does not meet with your exact requirements. Our custom research will comprehensively cover the business information you require to help you arrive at strategic and profitable business decisions.

Request Customization
Report Code
EP 3939
Published ON
Apr, 2024
Choose License Type
BUY NOW
  • SHARE
X
Request Customization
Speak to Analyst
Speak to Analyst
OR FACE-TO-FACE MEETING
PERSONALIZE THIS RESEARCH
  • Triangulate with your Own Data
  • Get Data as per your Format and Definition
  • Gain a Deeper Dive on a Specific Application, Geography, Customer or Competitor
  • Any level of Personalization
REQUEST A FREE CUSTOMIZATION
LET US HELP YOU!
  • What are the Known and Unknown Adjacencies Impacting the Diesel Generator Market
  • What will your New Revenue Sources be?
  • Who will be your Top Customer; what will make them switch?
  • Defend your Market Share or Win Competitors
  • Get a Scorecard for Target Partners
CUSTOMIZED WORKSHOP REQUEST
+1-888-600-6441
  • Call Us
  • +1-888-600-6441 (Corporate office hours)
  • +1-888-600-6441 (US/Can toll free)
  • +44-800-368-9399 (UK office hours)
CONNECT WITH US
ABOUT TRUST ONLINE
©2024 MarketsandMarkets Research Private Ltd. All rights reserved
DMCA.com Protection Status Website Feedback