Cleanroom Technologies Market by Product (HEPA Filters, HVAC, Laminar Air Flow Systems, Safety/Cleaning Consumables, Controls), Type (Standard, Modular (Hardwall, Softwall), Mobile), End User (Pharmaceutical, Biotechnology) - Global Forecast to 2029
The global cleanroom technologies market is projected to grow from USD 8.8 billion in 2024 to USD 12.3 billion by 2029, at a CAGR of 6.9% during the forecast period. The rising need for contamination-free environments in the pharmaceutical, medical device, and semiconductor industries drives the growth of cleanroom technologies. This growth is also supported by technological advancements in filtration systems, air handling units, and monitoring equipment, which make cleanrooms more efficient and cost-effective. Due to strict regulatory requirements, it is crucial to implement cleanroom practices to ensure the safety and quality of products, particularly in the healthcare and pharmaceutical industries.
HEPA filters are essential for removing up to 99.97% of dust particles as small as 0.3 microns from the cleaned environment. These technologies ensure product quality, reduce contamination, and adhere to regulatory standards, fueling the growth of the cleanroom technologies market.
To know about the assumptions considered for the study, Request for Free Sample Report
Attractive Opportunities in Cleanroom Technologies Market
Cleanroom Technologies Market Dynamics
Driver: Increasing demand for biologicals and growth of global biopharmaceutical industry
The biotechnology industry primarily contributes to the growth of the global life science industry. In the past few years, the healthcare industry has seen the emergence of several biological molecules. Moreover, new drug development research is highly focused on biological products. Biologics comprise complex drugs derived from living organisms, such as monoclonal antibodies, gene therapies, and vaccines. Due to their sensitivity, these products require strict contamination control, and a stringent regulatory framework oversees their manufacturing process. Advanced cleanroom technologies are crucial as the biologics sector continues to expand. Cleanrooms are essential for maintaining product quality by controlling microbial contamination and ensuring compliance with the FDA and EMA.
Biologics, particularly, have shown a promising pipeline of new drug developments. Increased attention to regulatory bodies has also led to high-performance cleanroom technologies, including advanced filtration systems, airflow controls, and sterile equipment. Continued application of biologics in personalized medicine and increased biopharmaceutical research activities support the demand for innovative solutions in cleanrooms, thereby driving the global cleanroom technologies market. Since many biologics are delivered through the parenteral route, the slightest contamination in biological product formulation can lead to severe patient consequences. Since many biologics are pathogenic, maintaining aseptic conditions during their manufacturing is essential. Cleanrooms are, therefore, a crucial component in biologics manufacturing.
Restraint: High operational costs associated with cleanrooms
The construction cost of standard cleanrooms for pharmaceutical and medical device manufacturing may range between USD 100 to more than USD 1,500 per square foot. Even though cleanrooms are a final requirement for most industries because they maintain a high level of pollution control, they are usually combined with high operational expenses. Establishing a cleanroom requires considerable capital outlay at its initial stages, mainly in the form of dedicated HVAC systems, filtration units, and controlled environment technologies. Such systems require special design and maintenance to ensure the required cleanliness levels are adhered to, increasing regular maintenance and energy costs.
Energy consumption is significantly increased due to the constant filtration, temperature control, and air pressure maintenance, all of which are highly energy-consuming procedures. The personnel working in cleanrooms need special training, and their clothing is expensive, resulting in significant labor costs. Testing, validation, and regulatory compliance contribute to the high operating costs for such enterprises. Due to the need for significant initial investments in the construction of cleanrooms and high operating expenses in the form of consumables, operating a cleanroom is considered a costly affair in the healthcare industry. This limits the usage of cleanrooms by smaller pharmaceutical and medical device manufacturers. In such cases, smaller manufacturers opt for controlled environments, where one or more physical, chemical, or biological variables are controlled.
Opportunity : Growing focus of pharmaceutical and medical device manufacturers on energy-efficient cleanrooms
Energy-efficient cleanrooms represent a new frontier in long-term commitments by pharmaceutical and medical device manufacturers to sustainability and cost reduction. These industries have high demands for contamination control; however, energy efficiency in cleanroom design saves money and fulfills environmental goals. State-of-the-art cleanroom technology incorporates energy-saving features, from improved HVAC and LED lighting to state-of-the-art filtration technologies to reduce energy consumption without losing the required level of sterility or climate control.
With the increasing popularity of the green operations concept in the healthcare industry, there is a significant opportunity for cleanroom manufacturers and equipment providers to design energy-efficient cleanrooms for healthcare facilities. Implementing energy-efficient HVAC systems and lighting solutions can significantly reduce energy consumption in cleanrooms. Advanced sensors and controls can optimize energy usage based on real-time conditions, ensuring that energy is not wasted.
Companies are targeting innovative technologies, ranging from advanced HVAC systems to low-energy particle filtration and energy recovery units that help save operations costs without altering the environmental footprint. These changes align with global sustainability goals, improving operational efficiency while meeting strict regulatory standards without compromising product quality and safety. The outcome is growing interest in energy-efficient clean rooms as a significant development area for the pharmaceutical and medical device sectors.
Challenge: Customization of cleanroom designs based on customer requirements
Cleanrooms are mostly designed according to customer requirements based on product specifications and customer-specific design requirements. There are no standardized guidelines for cleanroom designs tailored to various application areas or product types. The primary issue in cleanroom technologies is customizing cleanroom design to customer-specific requirements. Every industry, from drugs to biotech and microelectronics to aerospace, has specific standards and procedures that require highly specialized environments. Designing a cleanroom involves considering parameters such as air filtration, humidity control, temperature stability, and contamination control.
Clients may ask for flexibility in layouts, modular parts, or scalability, thus complicating the design process. There is a contradiction in having strict regulatory standards to meet client preferences that are cost-efficient and energy-efficient. The smooth integration of technologies such as automation, monitoring systems, and specific materials may also be necessary in the design process. Creating design specifications and standards that meet user needs through collaboration between cleanroom manufacturers and end users can help address design challenges. Standardizing cleanroom implementation procedures, operational methods, and maintenance and validation procedures can also reduce issues associated with custom cleanroom designs.
Cleanroom Technologies Market Ecosystem Analysis
The cleanroom technologies market ecosystem involves various stakeholders and technologies. Cleanroom equipment manufacturers are Central to the system, supplying HVAC systems, HEPA filters, laminar airflow systems, and other systems. Such systems are essential in the appropriate functioning of controlled environments required by pharmaceuticals, biotechnology, and electronics industries. Other primary players include component suppliers of specialized materials such as filtration membranes, air diffusers, and cleanroom furniture.
Equipment HVAC systems segment to lead cleanroom technologies market during forecast period
Key features of HVAC systems in cleanroom technologies include the strict control over air quality and contamination levels they provide. One primary advantage is providing room temperature, humidity, and air pressure to ensure a stable environment for the pharmaceuticals, electronics, and biotechnology industries. Such cleanroom HVAC systems should be able to filter airborne particles to minimize possible contamination with dust, bacteria, or chemical substances. This is necessary to preserve product integrity and comply with strict industry standards.
Modern air conditioning and heating systems ensure optimal temperature, humidity, and air circulation and even maintain much higher air filtration standards. With increasing regulatory requirements for cleaner manufacturing practices, it is crucial to incorporate advanced HVAC technologies into cleanroom environments. The cleanroom technologies market will likely grow in the coming years because it possesses solid abilities for filtering contaminants and maintaining consistent environmental conditions. Other factors contributing to this growth include the increasing demand for high-quality production processes by the healthcare and electronics industries.
Modular cleanrooms segment to record highest growth during forecast period
Modular cleanroom technologies have several advantages in industries requiring a high level of contamination control, such as pharmaceuticals, electronics, and biotechnology. Modular cleanrooms are prefabricated units that can easily be assembled, disassembled, or expanded. This enables an expedited deployment and a consequent reduction in construction downtime compared to conventional cleanrooms. Moreover, this system is cost-effective since it reduces labor costs and minimizes construction waste by fast-tracking the building process.
Modular cleanrooms offer several advantages, including quicker installation times, cost efficiency, and modularity. Organizations can easily retrofit these cleanrooms to accommodate changes in production requirements or regulatory standards. They are ideal for service industries that prioritize cleanliness, contamination control, and flexibility. Increasing demands for advanced cleanroom technologies further propel overall market growth, with more and more industries realizing the advantages of modular cleanrooms.
End user pharmaceutical industry to dominate cleanroom technologies market during forecast period
The benefits of cleanroom technologies in pharmaceutics include the provision of a clean environment that is clean and clean and controls contamination. This technology prevents contaminants such as dust, microbes, or chemical vapors from contacting sensitive drug manufacturing processes, thus maintaining the sterility of manufactured pharmaceuticals. This is crucial for producing sterile injectable drugs, vaccines, and biologics.
Cleanrooms minimize the number of product defects, ensure conformity with regulators such as the Food and Drug Administration, and increase the overall safety and quality of products. They provide a controlled environment, ensuring low levels of contaminants. With the increasing use of biologics, cell and gene therapies, and personalized medicines, the environment must also be free of contaminants to avoid cross-contamination and ensure product integrity.
Apart from the increasing demand for cleaner and safer production processes, there is a growing need for advanced cleanroom solutions due to expansions in pharmaceutical production capacities, particularly in emerging markets, and the rise in research and development activities. Pharmaceutical companies are investing significantly in state-of-the-art cleanroom infrastructures to meet regulatory demands and strengthen the productive efficiency of the production process. All this has led to strong growth within the cleanroom technologies market.
North America to be fastest growing region during forecast period
Based on region, the cleanroom technologies market is divided into North America, Latin America Europe, Middle East & Africa, and Asia Pacific. Cleanroom technologies have become prominent in North America over the past few years due to the rapid growth of many high-tech industries, such as pharmaceuticals, biotechnology, semiconductors, and medical devices. This has further been driven by regulatory pressures from organizations like the FDA and increased scrutiny of product safety standards. Innovations in cleanroom design, materials, and filtration systems make them more efficient and cost-effective, driving demand.
A strong investment in a region’s research and development and its growing demand for advanced manufacturing processes have compelled manufacturers to focus on controlled environments that ensure quality and conformance. Increasing innovations in cleanroom design, air filtration systems, and contamination control technologies further propel growth into the cleanroom technology market. North America is expected to lead the way in adopting and driving the development of cleanroom technologies as industries continue to prioritize safety and efficiency.
To know about the assumptions considered for the study, download the pdf brochure
Key Market Players
- Exyte AG (Germany)
- Kimberly-Clark Corporation (US)
- Illinois Tool Works, Inc. (US)
- Azbil Corporation (Japan)
- Bouygues Group (France)
- DuPont De Nemours, Inc. (US)
- Ardmac (Ireland)
- Clean Air Products (US)
- Labconco Corporation (US)
- Dynarex Corporation (US)
- Colandis GMBH (Germany)
- ABN Cleanroom Technology (Belgium)
- Clean Rooms International, Inc. (US)
- Terra Universal, Inc. (US)
- Airtech Japan, Ltd. (Japan)
- Taikisha Ltd. (Japan)
- Angstrom Technology (US)
- Octanorm-Vertriebs-GMBH (Germany)
- Camfil (Sweden)
- Parteco SRL (Italy)
- Berkshire Corporation (US)
- Airplan (Spain)
- Clean Air Technology, Inc. (US)
- Weiss Technik (Germany)
Scope of the Market
Report Metric |
Details |
Market size available for years |
2022–2029 |
Base year considered |
2023 |
Forecast period |
2024–2029 |
Forecast units |
Value (USD) |
Segments Covered |
Cleanroom technologies – Procedure Type, Animal type, End user and Region |
Geographies covered |
Asia Pacific, North America, Europe, Latin America, and the Middle East and Africa. |
Geographies covered |
|
Companies covered |
Exyte AG (Germany), Kimberly-Clark Corporation (US), Illinois Tool Works, Inc. (US), Azbil Corporation (Japan), Bouygues Group (France), Dupont De Nemours, Inc. (US), Ardmac (Ireland), Clean Air Products (US), Labconco Corporation (US), Dynarex Corporation (US), Colandis GMBH (Germany), ABN Cleanroom Technology (Belgium), Clean Rooms International, Inc. (US), Terra Universal, Inc. (US), Airtech Japan, Ltd. (Japan), Taikisha Ltd. (Japan), Angstrom Technology (US), Octanorm-Vertriebs-GMBH (Germany), Camfil (Sweden), Parteco SRL (Italy), Berkshire Corporation (US), Airplan (Spain), Clean Air Technology, Inc.(US), Weiss Technik (Germany) and Atlas Environments, Ltd. (UK). |
The research report categorizes the market into the following segments:
The study categorizes the cleanroom technologies market based on by product, type, end user and region
By Product
-
Consumables
-
Safety Consumables
- Gloves
- Apparel
- Other safety consumables
-
Cleaning Consumables
- Wipes
-
Disinfectants
- Alcohols
- Chlorine-based disinfectants
- Quaternary ammonium compounds
- Hypochlorous acid
- Hydrogen peroxide
- Phenolic compounds
- Other cleanroom disinfectants
- Vacuum systems
- Other cleaning consumables
-
Safety Consumables
-
Equipment
- HVAC Systems
- HEPA Filters
- Fan Filter Units
- Laminar Airflow Systems & Biosafety Cabinets
- Pass-Through Cabinets
- Air Diffusers & Showers
- Other Equipment
- Controls
By Type
- Standard Cleanrooms
-
Modular Cleanrooms
- Hardwall Cleanrooms
- Softwall Cleanrooms
- Mobile Cleanrooms
By End User
- Pharmaceutical Industry
- Biotechnology Industry
- Medical Device Manufacturers
- Hospitals
- Other End Users
By Region
-
North America
- US
- Canada
-
Europe
- Germany
- UK
- France
- Italy
- Spain
- Rest of Europe (RoE)
-
Asia Pacific
- Japan
- China
- India
- Australia
- South Korea
- Rest of APAC (RoAPAC)
-
Latin America
- Brazil
- Mexico
- Rest of Latin America (RoLATAM)
-
Middle East & Africa
- GCC Countries
- Rest of Middle East & Africa (RoMEA)
Recent Developments
- In April 2024, Labconco was awarded a national group purchasing agreement with Premier for clinical and laboratory products.
- In March 2024, ABN Cleanroom Technology announced the launch of ABN Labs. This expansion maximizes its capabilities and enhances cleanroom technology offerings in controlled environments.
- In July 2023, Labconco launched the Nexus Horizontal Clean Bench, the first laminar flow hood with complete onboard intelligence.
- In May 2023, Camfil opened a new production plant in Taicang, near Shanghai, China, to meet the growing demand for air filtration solutions in China and the Asia Pacific region.
- In April 2023, ABN Cleanroom Technologies launched Europe’s first ready-to-use low dewpoint cleanroom solution.
Frequently Asked Questions (FAQ):
Which is the largest segment of the cleanroom technologies market by product?
The consumables segment is expected to drive market growth based on product type. The rising demand for consumables in cleanroom technologies is driven by key factors such as the rapidly growing pharmaceuticals, biotechnology, semiconductors, and healthcare industries. These industries require contamination control and cleanroom environments, leading to the need for consumables like gloves, wipes, face masks, gowns, and cleaning agents. These consumables are essential for maintaining stringent hygiene and sterility standards to ensure product safety and quality.
Which is the largest segment of the cleanroom technologies market by type?
The modular cleanroom segment holds the largest share in the cleanroom technologies market, based on type. Modular cleanrooms are easier to customize, expand, or reconfigure as needed, without much hassle and cost. In contrast, traditional cleanrooms are more permanent, making them more difficult and expensive to modify. This is expected to drive the growth of the modular cleanroom segment. .
To speak to our analyst for a discussion on the above findings, click Speak to Analyst
Exclusive indicates content/data unique to MarketsandMarkets and not available with any competitors.
- 5.1 INTRODUCTION
-
5.2 MARKET DYNAMICSMARKET DRIVERS- Increasing demand for biologicals and growth of global biopharmaceutical industry- Pressing need for parenteral and injectable pharmaceutical formulations- Growing demand for miniatured medical devices- Advancements in cleanroom technologies and development of modular-designed cleanrooms- Surge in R&D expenditure in pharmaceutical industriesRESTRAINTS- High operational costs associated with cleanrooms- Stringent regulatory framework and quality check parametersOPPORTUNITIES- Increasing demand for cleanrooms in emerging economies- Growing focus on energy-efficient cleanrooms by pharmaceutical and medical device manufacturersCHALLENGES- Customization of cleanroom designs based on customer requirements
-
5.3 INDUSTRY TRENDSGROWING AWARENESS OF MOBILE CLEANROOMSEMERGENCE OF RENTAL CLEANROOM SERVICES
- 5.4 VALUE CHAIN ANALYSIS
-
5.5 TECHNOLOGY ANALYSISKEY TECHNOLOGIES- Data monitoring solutionsCOMPLEMENTARY TECHNOLOGIES- Automated operations- Dehumidifiers and desiccant systems
-
5.6 PORTER'S FIVE FORCES ANALYSISTHREAT OF NEW ENTRANTSTHREAT OF SUBSTITUTESBARGAINING POWER OF SUPPLIERSBARGAINING POWER OF BUYERSINTENSITY OF COMPETITIVE RIVALRY
-
5.7 KEY STAKEHOLDERS & BUYING CRITERIAKEY STAKEHOLDERS IN BUYING PROCESSBUYING CRITERIA
-
5.8 REGULATORY LANDSCAPENORTH AMERICAEUROPEREGULATORY BODIES, GOVERNMENT AGENCIES, AND OTHER ORGANIZATIONS
-
5.9 PRICING ANALYSISINDICATIVE PRICING LEVELS OF CLEANROOM TECHNOLOGIES, BY PRODUCTAVERAGE SELLING PRICE TREND OF CLEANROOM TECHNOLOGIES, BY PRODUCTINDICATIVE PRICING LEVELS OF KEY PLAYERS, BY EQUIPMENTINDICATIVE PRICING LEVELS, BY REGION
- 5.10 ECOSYSTEM ANALYSIS
-
5.11 PATENT ANALYSISPATENT PUBLICATION TRENDS FOR CLEANROOM TECHNOLOGIESINSIGHTS: JURISDICTION AND TOP APPLICANT ANALYSIS
-
5.12 TRADE ANALYSISIMPORT SCENARIO FOR MEDICAL DEVICES AND CONSUMABLESEXPORT SCENARIO FOR MEDICAL DEVICES AND CONSUMABLES
- 5.13 KEY CONFERENCES & EVENTS IN 2024–2025
- 5.14 UNMET NEEDS/END-USER EXPECTATIONS
- 5.15 IMPACT OF GEN AI IN CLEANROOM TECHNOLOGIES MARKET
-
5.16 CASE STUDY ANALYSISEXYTE GMBH TO DELIVER HIGH-TECH FACILITIES INCLUDING CLEANROOMSKIMBERLY-CLARK CORPORATION TO IMPLEMENT AI IN THEIR MANUFACTURING PROCESSESANGSTROM TECHNOLOGY CORPORATION TO DELIVER ADVANCED HIGH-PERFORMANCE CLEANROOMS
- 5.17 SUPPLY CHAIN ANALYSIS
- 5.18 TRENDS/DISRUPTIONS IMPACTING CUSTOMER BUSINESS
- 5.19 ADJACENT MARKETS FOR CLEANROOM TECHNOLOGIES
- 5.20 INVESTMENT & FUNDING SCENARIO
- 6.1 INTRODUCTION
-
6.2 CONSUMABLESSAFETY CONSUMABLES- Gloves- Apparel- Other safety consumablesCLEANING CONSUMABLES- Wipes- Disinfectants- Vacuum systems- Other cleaning consumables
-
6.3 EQUIPMENTHVAC SYSTEMS- Surging requirement for energy-efficient units to drive marketHEPA FILTERS- Increasing demand for environment-friendly and energy-efficient products to boost marketFAN FILTER UNITS- Pressing need for energy-efficient equipment to drive marketLAMINAR AIRFLOW SYSTEMS & BIOSAFETY CABINETS- High efficiency in reducing airborne particles and pathogens to boost demandAIR DIFFUSERS & SHOWERS- Emergence of technologically advanced air shower systems to drive marketPASS-THROUGH CABINETS- Rising demand for reduced foot traffic and application-specific designs to drive marketOTHER EQUIPMENT
-
6.4 CONTROLSHIGH EFFICIENCY IN MAINTAINING REGULATED FACILITIES TO DRIVE MARKET
- 7.1 INTRODUCTION
-
7.2 STANDARD CLEANROOMSHIGH DEMAND FOR FIXED STRUCTURES AND NEED FOR QUICK ON-SITE CONSTRUCTION TO DRIVE MARKET
-
7.3 MODULAR CLEANROOMSHARDWALL CLEANROOMS- Design-flexibility and easy installation to boost demandSOFTWALL CLEANROOMS- Cost–effectiveness and portability to boost demand
-
7.4 MOBILE CLEANROOMSEASE OF TRANSPORTATION AND FLEXIBILITY TO DRIVE MARKET
- 8.1 INTRODUCTION
-
8.2 PHARMACEUTICAL INDUSTRYPRESSING NEED TO SUBSTITUTE CONVENTIONAL TECHNOLOGIES WITH RESTRICTED ACCESS BARRIER SYSTEMS TO DRIVE MARKET
-
8.3 BIOTECHNOLOGY INDUSTRYWIDE ADOPTION OF RECOMBINANT DNA TECHNOLOGY AND CELL FUSION TO DRIVE MARKET
-
8.4 MEDICAL DEVICE MANUFACTURERSDEVELOPMENT OF IMPLANTABLE & BIODISPERSIBLE DEVICES TO BOOST MARKET
-
8.5 HOSPITALSGROWING INFECTION RATES AND NEED FOR STERILE OPERATING ENVIRONMENT TO DRIVE MARKET
- 8.6 OTHER END USERS
- 9.1 INTRODUCTION
-
9.2 NORTH AMERICAUS- Presence of major market players and the growing demand for smart technologies to drive marketCANADA- Surge in use of cleanrooms in hospitals and strict regulations to drive market
-
9.3 EUROPEGERMANY- Increased pharmaceutical production and R&D expenditure to drive growthFRANCE- Rising focus on clinical research and new drug development to drive marketUK- Stringent government regulations regarding contamination control to boost demandITALY- Increasing focus on expanding drug manufacturing capabilities to drive marketSPAIN- Immense focus on strengthening the healthcare system to drive marketREST OF EUROPE
-
9.4 ASIA PACIFICCHINAINCREASING EFFORTS IN MINIMIZING HAI PREVALENCE TO DRIVE MARKETJAPAN- Presence of prominent residential air purifier players to drive marketINDIA- Increasing government initiatives for healthcare infrastructure to boost marketAUSTRALIA- Growing pharmaceutical and biotechnology sector to drive marketSOUTH KOREA- Rising demand for plastic surgery and aesthetic medicine to drive marketREST OF ASIA PACIFIC
-
9.5 LATIN AMERICABRAZIL- Rising demand for quality treatment and focus on pharmaceutical drug development to drive marketMEXICO- Green building initiatives and rising carbon emissions to drive marketREST OF LATIN AMERICA
-
9.6 MIDDLE EAST & AFRICAEFFORTS TO ENHANCE HEALTHCARE INFRASTRUCTURE TO DRIVE MARKETGCC COUNTRIESREST OF MIDDLE EAST & AFRICA
- 10.1 OVERVIEW
-
10.2 KEY PLAYER STRATEGIES/RIGHT TO WINOVERVIEW OF STRATEGIES ADOPTED BY PLAYERS IN CLEANROOM TECHNOLOGIES MARKET
- 10.3 REVENUE ANALYSIS
- 10.4 MARKET SHARE ANALYSIS
-
10.5 COMPANY EVALUATION MATRIX: KEY PLAYERS, 2023STARSEMERGING LEADERSPERVASIVE PLAYERSPARTICIPANTSCOMPANY FOOTPRINT: KEY PLAYERS, 2023- Company footprint- Product footprint- Type footprint- End user footprint- Region footprint
-
10.6 COMPANY EVALUATION MATRIX: STARTUPS/SMES, 2023PROGRESSIVE COMPANIESDYNAMIC COMPANIESSTARTING BLOCKSRESPONSIVE COMPANIESCOMPETITIVE BENCHMARKING: KEY STARTUPS/SMES, 2023
- 10.7 COMPANY VALUATION & FINANCIAL METRICS
- 10.8 BRAND/PRODUCT COMPARATIVE ANALYSIS
- 10.9 R&D ASSESSMENT OF KEY PLAYERS
-
10.10 COMPETITIVE SCENARIOPRODUCT LAUNCHESDEALSEXPANSIONS
-
11.1 KEY PLAYERSEXYTE GMBH- Business overview- Products offered- Recent developments- MnM viewKIMBERLY-CLARK CORPORATION- Business overview- Products offered- Recent developments- MnM viewILLINOIS TOOL WORKS, INC.- Business overview- Products offered- Recent developments- MnM viewAZBIL CORPORATION- Business overview- Products offered- Recent developments- MnM viewBOUYGUES GROUP- Business overview- Services offered- Recent developments- MnM viewDUPONT DE NEMOURS, INC.- Business overview- Products offered- Recent developmentsTAIKISHA LTD.- Business overview- Products & services offered- Recent developmentsARDMAC- Business overview- Products offered- Recent developmentsCAMFIL- Business overview- Products & services offered- Recent developmentsLABCONCO CORPORATION- Business overview- Products offered- Recent developmentsABN CLEANROOM TECHNOLOGY- Business overview- Products & services offered- Recent developmentsANGSTROM TECHNOLOGY LTD.- Business overview- Products & services offered- Recent developmentsOCTANORM-VERTRIEBS-GMBH- Business overview- Products & services offered- Recent developments
-
11.2 OTHER PLAYERSCLEAN ROOMS INTERNATIONAL, INCTERRA UNIVERSAL, INC.AIRTECH JAPAN, LTD.PARTECO SRLDYNAREX CORPORATIONCOLANDIS GMBHCLEAN AIR PRODUCTSBERKSHIRE CORPORATIONAIRPLANCLEAN AIR TECHNOLOGY, INC.WEISS TECHNIK (A SCHUNK COMPANY)ATLAS ENVIRONMENTS, LTD.
- 12.1 DISCUSSION GUIDE
- 12.2 KNOWLEDGESTORE: MARKETSANDMARKETS’ SUBSCRIPTION PORTAL
- 12.3 CUSTOMIZATION OPTIONS
- 12.4 RELATED REPORTS
- 12.5 AUTHOR DETAILS
- TABLE 1 STANDARD CURRENCY CONVERSION RATES (UNIT OF USD)
- TABLE 2 RISK ASSESSMENT: CLEANROOM TECHNOLOGIES MARKET
- TABLE 3 INDICATIVE LIST OF BIOLOGICS APPROVED BY FDA (2023)
- TABLE 4 PRICING COMPARISON OF TWO CLEANROOM PROJECTS
- TABLE 5 COMPANY EXPANSIONS/PARTNERSHIPS IN EMERGING MARKETS
- TABLE 6 RECENT DEVELOPMENTS IN MOBILE CLEANROOM MARKET
- TABLE 7 INNOVATIONS IN CLEANROOM TECHNOLOGIES
- TABLE 8 PORTER'S FIVE FORCES ANALYSIS: CLEANROOM TECHNOLOGIES MARKET
- TABLE 9 INFLUENCE OF STAKEHOLDERS ON BUYING PROCESS FOR TOP 3 END USERS
- TABLE 10 KEY BUYING CRITERIA FOR TOP 3 END USERS
- TABLE 11 ISO CLASSIFICATION OF CLEANROOMS
- TABLE 12 EU GMP ANNEX 1 CLASSIFICATION FOR CLEANROOMS
- TABLE 13 REGULATORY STANDARDS FOR CLEANROOM TECHNOLOGIES
- TABLE 14 NORTH AMERICA: REGULATORY BODIES, GOVERNMENT AGENCIES, AND OTHER ORGANIZATIONS
- TABLE 15 EUROPE: REGULATORY BODIES, GOVERNMENT AGENCIES, AND OTHER ORGANIZATIONS
- TABLE 16 ASIA PACIFIC: REGULATORY BODIES, GOVERNMENT AGENCIES, AND OTHER ORGANIZATIONS
- TABLE 17 LATIN AMERICA: REGULATORY BODIES, GOVERNMENT AGENCIES, AND OTHER ORGANIZATIONS
- TABLE 18 MIDDLE EAST & AFRICA: REGULATORY BODIES, GOVERNMENT AGENCIES, AND OTHER ORGANIZATIONS
- TABLE 19 INDICATIVE PRICE OF CLEANROOM TECHNOLOGIES, BY PRODUCT
- TABLE 20 INDICATIVE PRICING LEVELS, BY REGION, 2021–2023
- TABLE 21 CLEANROOM TECHNOLOGIES MARKET: ROLE IN ECOSYSTEM
- TABLE 22 LIST OF PATENTS/PATENT APPLICATIONS IN CLEANROOM TECHNOLOGIES MARKET, 2021–2023
- TABLE 23 IMPORT DATA FOR MEDICAL DEVICES AND CONSUMABLES, BY COUNTRY, 2019–2023 (THOUSAND)
- TABLE 24 EXPORT DATA FOR MEDICAL DEVICES AND CONSUMABLES, BY COUNTRY, 2019–2023 (THOUSAND)
- TABLE 25 CLEANROOM TECHNOLOGIES MARKET: DETAILED LIST OF CONFERENCES & EVENTS, 2024–2025
- TABLE 26 CLEANROOM TECHNOLOGIES MARKET, BY PRODUCT, 2022–2029 (USD MILLION)
- TABLE 27 CLEANROOM CONSUMABLES MARKET, BY PRODUCT SUB-TYPE, 2022–2029 (USD MILLION)
- TABLE 28 CLEANROOM CONSUMABLES MARKET, BY COUNTRY, 2022–2029 (USD MILLION)
- TABLE 29 SAFETY CONSUMABLES MARKET, BY PRODUCT SUB-TYPE, 2022–2029 (USD MILLION)
- TABLE 30 SAFETY CONSUMABLES MARKET, BY COUNTRY, 2022–2029 (USD MILLION)
- TABLE 31 GLOVES OFFERED BY MAJOR PLAYERS
- TABLE 32 GLOVES: SAFETY CONSUMABLES MARKET, BY COUNTRY, 2022–2029 (USD MILLION)
- TABLE 33 CLEANROOM APPAREL OFFERED BY MAJOR PLAYERS
- TABLE 34 APPAREL: SAFETY CONSUMABLES MARKET, BY COUNTRY, 2022–2029 (USD MILLION)
- TABLE 35 OTHER SAFETY CONSUMABLES OFFERED BY MAJOR PLAYERS
- TABLE 36 OTHER: SAFETY CONSUMABLES MARKET, BY COUNTRY, 2022–2029 (USD MILLION)
- TABLE 37 CLEANING CONSUMABLES MARKET, BY PRODUCT SUB-TYPE, 2022–2029 (USD MILLION)
- TABLE 38 CLEANING CONSUMABLES MARKET, BY COUNTRY, 2022–2029 (USD MILLION)
- TABLE 39 WIPES OFFERED BY MAJOR PLAYERS
- TABLE 40 WIPES: CLEANING CONSUMABLES MARKET, BY COUNTRY, 2022–2029 (USD MILLION)
- TABLE 41 DISINFECTANTS OFFERED BY MAJOR PLAYERS
- TABLE 42 DISINFECTANTS: CLEANING CONSUMABLES MARKET, BY COUNTRY, 2022–2029 (USD MILLION)
- TABLE 43 DISINFECTANTS: CLEANING CONSUMABLES MARKET, BY PRODUCT SUB-TYPE, 2022–2029 (USD MILLION)
- TABLE 44 ALCOHOL DISINFECTANTS: CLEANING CONSUMABLES MARKET, BY COUNTRY, 2022–2029 (USD MILLION)
- TABLE 45 CHLORINE-BASED DISINFECTANTS: CLEANING CONSUMABLES MARKET, BY COUNTRY, 2022–2029 (USD MILLION)
- TABLE 46 QUATERNARY AMMONIUM COMPOUND DISINFECTANTS: CLEANING CONSUMABLES MARKET, BY COUNTRY, 2022–2029 (USD MILLION)
- TABLE 47 HYPOCHLOROUS ACID DISINFECTANT: CLEANING CONSUMABLES MARKET, BY COUNTRY, 2022–2029 (USD MILLION)
- TABLE 48 HYDROGEN PEROXIDE DISINFECTANTS: CLEANING CONSUMABLES MARKET, BY COUNTRY, 2022–2029 (USD MILLION)
- TABLE 49 PHENOLIC COMPOUND DISINFECTANTS: CLEANING CONSUMABLES MARKET, BY COUNTRY, 2022–2029 (USD MILLION)
- TABLE 50 OTHER CLEANROOM DISINFECTANTS: CLEANING CONSUMABLES MARKET, BY COUNTRY, 2022–2029 (USD MILLION)
- TABLE 51 VACUUM SYSTEMS OFFERED BY MAJOR PLAYERS
- TABLE 52 VACUUM SYSTEMS: CLEANING CONSUMABLES MARKET, BY COUNTRY, 2022–2029 (USD MILLION)
- TABLE 53 OTHER CLEANING CONSUMABLES OFFERED BY MAJOR PLAYERS
- TABLE 54 OTHER CONSUMABLES: CLEANING CONSUMABLES MARKET, BY COUNTRY, 2022–2029 (USD MILLION)
- TABLE 55 CLEANROOM EQUIPMENT MARKET, BY PRODUCT SUB-TYPE, 2022–2029 (USD MILLION)
- TABLE 56 CLEANROOM EQUIPMENT MARKET, BY COUNTRY, 2022–2029 (USD MILLION)
- TABLE 57 HVAC SYSTEMS OFFERED BY MAJOR PLAYERS
- TABLE 58 HVAC SYSTEMS: CLEANROOM EQUIPMENT MARKET, BY COUNTRY, 2022–2029 (USD MILLION)
- TABLE 59 HEPA FILTERS OFFERED BY MAJOR PLAYERS
- TABLE 60 HEPA FILTERS: CLEANROOM EQUIPMENT MARKET, BY COUNTRY, 2022–2029 (USD MILLION)
- TABLE 61 FAN FILTER UNITS OFFERED BY MAJOR PLAYERS
- TABLE 62 FAN FILTER UNITS: CLEANROOM EQUIPMENT MARKET, BY COUNTRY, 2022–2029 (USD MILLION)
- TABLE 63 LAMINAR AIRFLOW SYSTEMS & BIOSAFETY CABINETS OFFERED BY MAJOR PLAYERS
- TABLE 64 LAMINAR AIR FLOW SYSTEMS & BIOSAFETY CABINETS: CLEANROOM EQUIPMENT MARKET, BY COUNTRY, 2022–2029 (USD MILLION)
- TABLE 65 AIR DIFFUSERS & SHOWERS OFFERED BY MAJOR PLAYERS
- TABLE 66 AIR DIFFUSERS & SHOWERS:CLEANROOM EQUIPMENT MARKET, BY COUNTRY, 2022–2029 (USD MILLION)
- TABLE 67 PASS-THROUGH CABINETS OFFERED BY MAJOR PLAYERS
- TABLE 68 PASS-THROUGH CABINETS: CLEANROOM EQUIPMENT MARKET, BY COUNTRY, 2022–2029 (USD MILLION)
- TABLE 69 OTHER EQUIPMENT OFFERED BY MAJOR PLAYERS
- TABLE 70 OTHER EQUIPMENT: CLEANROOM EQUIPMENT MARKET, BY COUNTRY, 2022–2029 (USD MILLION)
- TABLE 71 CLEANROOM CONTROLS MARKET, BY COUNTRY, 2022–2029 (USD MILLION)
- TABLE 72 CLEANROOM TECHNOLOGIES MARKET, BY TYPE, 2022–2029 (USD MILLION)
- TABLE 73 STANDARD: CLEANROOM TECHNOLOGIES MARKET, BY COUNTRY, 2022–2029 (USD MILLION)
- TABLE 74 MODULAR: CLEANROOM TECHNOLOGIES MARKET, BY TYPE, 2022–2029 (USD MILLION)
- TABLE 75 MODULAR: CLEANROOM TECHNOLOGIES MARKET, BY COUNTRY, 2022–2029 (USD MILLION)
- TABLE 76 HARDWALL MODULAR CLEANROOMS: CLEANROOM TECHNOLOGIES MARKET, BY COUNTRY, 2022–2029 (USD MILLION)
- TABLE 77 SOFTWALL MODULAR CLEANROOMS: CLEANROOM TECHNOLOGIES MARKET, BY COUNTRY, 2022–2029 (USD MILLION)
- TABLE 78 MOBILE: CLEANROOM TECHNOLOGIES MARKET, BY COUNTRY, 2022–2029 (USD MILLION)
- TABLE 79 CLEANROOM TECHNOLOGIES MARKET, BY END USER, 2022–2029 (USD MILLION)
- TABLE 80 PHARMACEUTICAL INDUSTRY: CLEANROOM TECHNOLOGIES MARKET, BY COUNTRY, 2022–2029 (USD MILLION)
- TABLE 81 BIOTECHNOLOGY INDUSTRY: CLEANROOM TECHNOLOGIES MARKET, BY COUNTRY, 2022–2029 (USD MILLION)
- TABLE 82 MEDICAL DEVICE MANUFACTURERS: CLEANROOM TECHNOLOGIES MARKET, BY COUNTRY, 2022–2029 (USD MILLION)
- TABLE 83 HOSPITALS: CLEANROOM TECHNOLOGIES MARKET, BY COUNTRY, 2022–2029 (USD MILLION)
- TABLE 84 OTHER END USERS: CLEANROOM TECHNOLOGIES MARKET, BY COUNTRY, 2022–2029 (USD MILLION)
- TABLE 85 CLEANROOM TECHNOLOGIES MARKET, BY REGION, 2022–2029 (USD MILLION)
- TABLE 86 NORTH AMERICA: CLEANROOM TECHNOLOGIES MARKET, BY COUNTRY, 2022–2029 (USD MILLION)
- TABLE 87 NORTH AMERICA: CLEANROOM TECHNOLOGIES MARKET, BY PRODUCT, 2022–2029 (USD MILLION)
- TABLE 88 NORTH AMERICA: CLEANROOM EQUIPMENT MARKET, BY PRODUCT SUB-TYPE, 2022–2029 (USD MILLION)
- TABLE 89 NORTH AMERICA: CLEANROOM CONSUMABLES MARKET, BY PRODUCT SUB-TYPE, 2022–2029 (USD MILLION)
- TABLE 90 NORTH AMERICA: CLEANROOM SAFETY CONSUMABLES MARKET, BY PRODUCT SUB-TYPE, 2022–2029 (USD MILLION)
- TABLE 91 NORTH AMERICA: CLEANROOM CLEANING CONSUMABLES MARKET, BY PRODUCT SUB-TYPE, 2022–2029 (USD MILLION)
- TABLE 92 NORTH AMERICA: CLEANROOM DISINFECTANTS MARKET, BY PRODUCT SUB-TYPE, 2022–2029 (USD MILLION)
- TABLE 93 NORTH AMERICA: CLEANROOM TECHNOLOGIES MARKET, BY TYPE, 2022–2029 (USD MILLION)
- TABLE 94 NORTH AMERICA: CLEANROOM TECHNOLOGIES MARKET, BY MODULAR CLEANROOMS, 2022–2029 (USD MILLION)
- TABLE 95 NORTH AMERICA: CLEANROOM TECHNOLOGIES MARKET, BY END USER, 2022–2029 (USD MILLION)
- TABLE 96 US: CLEANROOM TECHNOLOGIES MARKET, BY PRODUCT, 2022–2029 (USD MILLION)
- TABLE 97 US: CLEANROOM EQUIPMENT MARKET, BY PRODUCT SUB-TYPE, 2022–2029 (USD MILLION)
- TABLE 98 US: CLEANROOM CONSUMABLES MARKET, BY PRODUCT SUB-TYPE, 2022–2029 (USD MILLION)
- TABLE 99 US: CLEANROOM SAFETY CONSUMABLES MARKET, BY PRODUCT SUB-TYPE, 2022–2029 (USD MILLION)
- TABLE 100 US: CLEANROOM CLEANING CONSUMABLES MARKET, BY PRODUCT SUB-TYPE, 2022–2029 (USD MILLION)
- TABLE 101 US: CLEANROOM DISINFECTANTS MARKET, BY PRODUCT SUB-TYPE, 2022–2029 (USD MILLION)
- TABLE 102 US: CLEANROOM TECHNOLOGIES MARKET, BY TYPE, 2022–2029 (USD MILLION)
- TABLE 103 US: CLEANROOM TECHNOLOGIES MARKET, BY MODULAR CLEANROOMS, 2022–2029 (USD MILLION)
- TABLE 104 US: CLEANROOM TECHNOLOGIES MARKET, BY END USER, 2022–2029 (USD MILLION)
- TABLE 105 CANADA: CLEANROOM TECHNOLOGIES MARKET, BY PRODUCT, 2022–2029 (USD MILLION)
- TABLE 106 CANADA: CLEANROOM EQUIPMENT MARKET, BY PRODUCT SUB-TYPE, 2022–2029 (USD MILLION)
- TABLE 107 CANADA: CLEANROOM CONSUMABLES MARKET, BY PRODUCT SUB-TYPE, 2022–2029 (USD MILLION)
- TABLE 108 CANADA: CLEANROOM SAFETY CONSUMABLES MARKET, BY PRODUCT SUB-TYPE, 2022–2029 (USD MILLION)
- TABLE 109 CANADA: CLEANROOM CLEANING CONSUMABLES MARKET, BY PRODUCT SUB-TYPE, 2022–2029 (USD MILLION)
- TABLE 110 CANADA: CLEANROOM DISINFECTANTS MARKET, BY PRODUCT SUB-TYPE, 2022–2029 (USD MILLION)
- TABLE 111 CANADA: CLEANROOM TECHNOLOGIES MARKET, BY TYPE, 2022–2029 (USD MILLION)
- TABLE 112 CANADA: CLEANROOM TECHNOLOGIES MARKET, BY MODULAR CLEANROOMS, 2022–2029 (USD MILLION)
- TABLE 113 CANADA: CLEANROOM TECHNOLOGIES MARKET, BY END USER, 2022–2029 (USD MILLION)
- TABLE 114 EUROPE: CLEANROOM TECHNOLOGIES MARKET, BY COUNTRY, 2022–2029 (USD MILLION)
- TABLE 115 EUROPE: CLEANROOM TECHNOLOGIES MARKET, BY PRODUCT, 2022–2029 (USD MILLION)
- TABLE 116 EUROPE: CLEANROOM EQUIPMENT MARKET, BY PRODUCT SUB-TYPE, 2022–2029 (USD MILLION)
- TABLE 117 EUROPE: CLEANROOM CONSUMABLES MARKET, BY PRODUCT SUB-TYPE, 2022–2029 (USD MILLION)
- TABLE 118 EUROPE: CLEANROOM SAFETY CONSUMABLES MARKET, BY PRODUCT SUB-TYPE, 2022–2029 (USD MILLION)
- TABLE 119 EUROPE: CLEANROOM CLEANING CONSUMABLES MARKET, BY PRODUCT SUB-TYPE, 2022–2029 (USD MILLION)
- TABLE 120 EUROPE: CLEANROOM DISINFECTANTS MARKET, BY PRODUCT SUB-TYPE, 2022–2029 (USD MILLION)
- TABLE 121 EUROPE: CLEANROOM TECHNOLOGIES MARKET, BY TYPE, 2022–2029 (USD MILLION)
- TABLE 122 EUROPE: CLEANROOM TECHNOLOGIES MARKET, BY MODULAR CLEANROOMS, 2022–2029 (USD MILLION)
- TABLE 123 EUROPE: CLEANROOM TECHNOLOGIES MARKET, BY END USER, 2022–2029 (USD MILLION)
- TABLE 124 GERMANY: CLEANROOM TECHNOLOGIES MARKET, BY PRODUCT, 2022–2029 (USD MILLION)
- TABLE 125 GERMANY: CLEANROOM EQUIPMENT MARKET, BY PRODUCT SUB-TYPE, 2022–2029 (USD MILLION)
- TABLE 126 GERMANY: CLEANROOM CONSUMABLES MARKET, BY PRODUCT SUB-TYPE, 2022–2029 (USD MILLION)
- TABLE 127 GERMANY: CLEANROOM SAFETY CONSUMABLES MARKET, BY PRODUCT SUB-TYPE, 2022–2029 (USD MILLION)
- TABLE 128 GERMANY: CLEANROOM CLEANING CONSUMABLES MARKET, BY PRODUCT SUB-TYPE, 2022–2029 (USD MILLION)
- TABLE 129 GERMANY: CLEANROOM DISINFECTANTS MARKET, BY PRODUCT SUB-TYPE, 2022–2029 (USD MILLION)
- TABLE 130 GERMANY: CLEANROOM TECHNOLOGIES MARKET, BY TYPE, 2022–2029 (USD MILLION)
- TABLE 131 GERMANY: CLEANROOM TECHNOLOGIES MARKET, BY MODULAR CLEANROOMS, 2022–2029 (USD MILLION)
- TABLE 132 GERMANY: CLEANROOM TECHNOLOGIES MARKET, BY END USER, 2022–2029 (USD MILLION)
- TABLE 133 FRANCE: CLEANROOM TECHNOLOGIES MARKET, BY PRODUCT, 2022–2029 (USD MILLION)
- TABLE 134 FRANCE: CLEANROOM EQUIPMENT MARKET, BY PRODUCT SUB-TYPE, 2022–2029 (USD MILLION)
- TABLE 135 FRANCE: CLEANROOM CONSUMABLES MARKET, BY PRODUCT SUB-TYPE, 2022–2029 (USD MILLION)
- TABLE 136 FRANCE: CLEANROOM SAFETY CONSUMABLES MARKET, BY PRODUCT SUB-TYPE, 2022–2029 (USD MILLION)
- TABLE 137 FRANCE: CLEANROOM CLEANING CONSUMABLES MARKET, BY PRODUCT SUB-TYPE, 2022–2029 (USD MILLION)
- TABLE 138 FRANCE: CLEANROOM DISINFECTANTS MARKET, BY PRODUCT SUB-TYPE, 2022–2029 (USD MILLION)
- TABLE 139 FRANCE: CLEANROOM TECHNOLOGIES MARKET, BY TYPE, 2022–2029 (USD MILLION)
- TABLE 140 FRANCE: CLEANROOM TECHNOLOGIES MARKET, BY MODULAR CLEANROOMS, 2022–2029 (USD MILLION)
- TABLE 141 FRANCE: CLEANROOM TECHNOLOGIES MARKET, BY END USER, 2022–2029 (USD MILLION)
- TABLE 142 UK: CLEANROOM TECHNOLOGIES MARKET, BY PRODUCT, 2022–2029 (USD MILLION)
- TABLE 143 UK: CLEANROOM EQUIPMENT MARKET, BY PRODUCT SUB-TYPE, 2022–2029 (USD MILLION)
- TABLE 144 UK: CLEANROOM CONSUMABLES MARKET, BY TYPE, 2022–2029 (USD MILLION)
- TABLE 145 UK: CLEANROOM SAFETY CONSUMABLES MARKET, BY PRODUCT SUB-TYPE, 2022–2029 (USD MILLION)
- TABLE 146 UK: CLEANROOM CLEANING CONSUMABLES MARKET, BY PRODUCT SUB-TYPE, 2022–2029 (USD MILLION)
- TABLE 147 UK: CLEANROOM DISINFECTANTS MARKET, BY PRODUCT SUB-TYPE, 2022–2029 (USD MILLION)
- TABLE 148 UK: CLEANROOM TECHNOLOGIES MARKET, BY TYPE, 2022–2029 (USD MILLION)
- TABLE 149 UK: CLEANROOM TECHNOLOGIES MARKET, BY MODULAR CLEANROOMS, 2022–2029 (USD MILLION)
- TABLE 150 UK: CLEANROOM TECHNOLOGIES MARKET, BY END USER, 2022–2029 (USD MILLION)
- TABLE 151 ITALY: CLEANROOM TECHNOLOGIES MARKET, BY PRODUCT, 2022–2029 (USD MILLION)
- TABLE 152 ITALY: CLEANROOM EQUIPMENT MARKET, BY PRODUCT SUB-TYPE, 2022–2029 (USD MILLION)
- TABLE 153 ITALY: CLEANROOM CONSUMABLES MARKET, BY PRODUCT SUB-TYPE, 2022–2029 (USD MILLION)
- TABLE 154 ITALY: CLEANROOM SAFETY CONSUMABLES MARKET, BY PRODUCT SUB-TYPE, 2022–2029 (USD MILLION)
- TABLE 155 ITALY: CLEANROOM CLEANING CONSUMABLES MARKET, BY PRODUCT SUB-TYPE, 2022–2029 (USD MILLION)
- TABLE 156 ITALY: CLEANROOM DISINFECTANTS MARKET, BY PRODUCT SUB-TYPE, 2022–2029 (USD MILLION)
- TABLE 157 ITALY: CLEANROOM TECHNOLOGIES MARKET, BY TYPE, 2022–2029 (USD MILLION)
- TABLE 158 ITALY: CLEANROOM TECHNOLOGIES MARKET, BY MODULAR CLEANROOMS, 2022–2029 (USD MILLION)
- TABLE 159 ITALY: CLEANROOM TECHNOLOGIES MARKET, BY END USER, 2022–2029 (USD MILLION)
- TABLE 160 SPAIN: CLEANROOM TECHNOLOGIES MARKET, BY PRODUCT, 2022–2029 (USD MILLION)
- TABLE 161 SPAIN: CLEANROOM EQUIPMENT MARKET, BY PRODUCT SUB-TYPE, 2022–2029 (USD MILLION)
- TABLE 162 SPAIN: CLEANROOM CONSUMABLES MARKET, BY PRODUCT SUB-TYPE, 2022–2029 (USD MILLION)
- TABLE 163 SPAIN: CLEANROOM SAFETY CONSUMABLES MARKET, BY PRODUCT SUB-TYPE, 2022–2029 (USD MILLION)
- TABLE 164 SPAIN: CLEANROOM CLEANING CONSUMABLES MARKET, BY PRODUCT SUB-TYPE, 2022–2029 (USD MILLION)
- TABLE 165 SPAIN: CLEANROOM DISINFECTANTS MARKET, BY PRODUCT SUB-TYPE, 2022–2029 (USD MILLION)
- TABLE 166 SPAIN: CLEANROOM TECHNOLOGIES MARKET, BY TYPE, 2022–2029 (USD MILLION)
- TABLE 167 SPAIN: CLEANROOM TECHNOLOGIES MARKET, BY MODULAR CLEANROOMS, 2022–2029 (USD MILLION)
- TABLE 168 SPAIN: CLEANROOM TECHNOLOGIES MARKET, BY END USER, 2022–2029 (USD MILLION)
- TABLE 169 REST OF EUROPE: CLEANROOM TECHNOLOGIES MARKET, BY PRODUCT, 2022–2029 (USD MILLION)
- TABLE 170 REST OF EUROPE: CLEANROOM EQUIPMENT MARKET, BY PRODUCT SUB-TYPE, 2022–2029 (USD MILLION)
- TABLE 171 REST OF EUROPE: CLEANROOM CONSUMABLES MARKET, BY PRODUCT SUB-TYPE, 2022–2029 (USD MILLION)
- TABLE 172 REST OF EUROPE: CLEANROOM SAFETY CONSUMABLES MARKET, BY PRODUCT SUB-TYPE, 2022–2029 (USD MILLION)
- TABLE 173 REST OF EUROPE: CLEANROOM CLEANING CONSUMABLES MARKET, BY PRODUCT SUB-TYPE, 2022–2029 (USD MILLION)
- TABLE 174 REST OF EUROPE: CLEANROOM DISINFECTANTS MARKET, BY PRODUCT SUB-TYPE, 2022–2029 (USD MILLION)
- TABLE 175 REST OF EUROPE: CLEANROOM TECHNOLOGIES MARKET, BY TYPE, 2022–2029 (USD MILLION)
- TABLE 176 REST OF EUROPE: CLEANROOM TECHNOLOGIES MARKET, BY MODULAR CLEANROOMS, 2022–2029 (USD MILLION)
- TABLE 177 REST OF EUROPE: CLEANROOM TECHNOLOGIES MARKET, BY END USER, 2022–2029 (USD MILLION)
- TABLE 178 ASIA PACIFIC: CLEANROOM TECHNOLOGIES MARKET, BY COUNTRY, 2022–2029 (USD MILLION)
- TABLE 179 ASIA PACIFIC: CLEANROOM TECHNOLOGIES MARKET, BY PRODUCT, 2022–2029 (USD MILLION)
- TABLE 180 ASIA PACIFIC: CLEANROOM EQUIPMENT MARKET, BY PRODUCT SUB-TYPE, 2022–2029 (USD MILLION)
- TABLE 181 ASIA PACIFIC: CLEANROOM CONSUMABLES MARKET, BY PRODUCT SUB-TYPE, 2022–2029 (USD MILLION)
- TABLE 182 ASIA PACIFIC: CLEANROOM SAFETY CONSUMABLES MARKET, BY PRODUCT SUB-TYPE, 2022–2029 (USD MILLION)
- TABLE 183 ASIA PACIFIC: CLEANROOM CLEANING CONSUMABLES MARKET, BY PRODUCT SUB-TYPE, 2022–2029 (USD MILLION)
- TABLE 184 ASIA PACIFIC: CLEANROOM DISINFECTANTS MARKET, BY PRODUCT SUB-TYPE, 2022–2029 (USD MILLION)
- TABLE 185 ASIA PACIFIC: CLEANROOM TECHNOLOGIES MARKET, BY TYPE, 2022–2029 (USD MILLION)
- TABLE 186 ASIA PACIFIC: CLEANROOM TECHNOLOGIES MARKET, BY MODULAR CLEANROOMS, 2022–2029 (USD MILLION)
- TABLE 187 ASIA PACIFIC: CLEANROOM TECHNOLOGIES MARKET, BY END USER, 2022–2029 (USD MILLION)
- TABLE 188 CHINA: CLEANROOM TECHNOLOGIES MARKET, BY PRODUCT, 2022–2029 (USD MILLION)
- TABLE 189 CHINA: CLEANROOM EQUIPMENT MARKET, BY PRODUCT SUB-TYPE, 2022–2029 (USD MILLION)
- TABLE 190 CHINA: CLEANROOM CONSUMABLES MARKET, BY PRODUCT SUB-TYPE, 2022–2029 (USD MILLION)
- TABLE 191 CHINA: CLEANROOM SAFETY CONSUMABLES MARKET, BY PRODUCT SUB-TYPE, 2022–2029 (USD MILLION)
- TABLE 192 CHINA: CLEANROOM CLEANING CONSUMABLES MARKET, BY PRODUCT SUB-TYPE, 2022–2029 (USD MILLION)
- TABLE 193 CHINA: CLEANROOM DISINFECTANTS MARKET, BY PRODUCT SUB-TYPE, 2022–2029 (USD MILLION)
- TABLE 194 CHINA: CLEANROOM TECHNOLOGIES MARKET, BY TYPE, 2022–2029 (USD MILLION)
- TABLE 195 CHINA: CLEANROOM TECHNOLOGIES MARKET, BY MODULAR CLEANROOMS, 2022–2029 (USD MILLION)
- TABLE 196 CHINA: CLEANROOM TECHNOLOGIES MARKET, BY END USER, 2022–2029 (USD MILLION)
- TABLE 197 JAPAN: CLEANROOM TECHNOLOGIES MARKET, BY PRODUCT, 2022–2029 (USD MILLION)
- TABLE 198 JAPAN: CLEANROOM EQUIPMENT MARKET, BY PRODUCT SUB-TYPE, 2022–2029 (USD MILLION)
- TABLE 199 JAPAN: CLEANROOM CONSUMABLES MARKET, BY PRODUCT SUB-TYPE, 2022–2029 (USD MILLION)
- TABLE 200 JAPAN: CLEANROOM SAFETY CONSUMABLES MARKET, BY PRODUCT SUB-TYPE, 2022–2029 (USD MILLION)
- TABLE 201 JAPAN: CLEANROOM CLEANING CONSUMABLES MARKET, BY PRODUCT SUB-TYPE, 2022–2029 (USD MILLION)
- TABLE 202 JAPAN: CLEANROOM DISINFECTANTS MARKET, BY PRODUCT SUB-TYPE, 2022–2029 (USD MILLION)
- TABLE 203 JAPAN: CLEANROOM TECHNOLOGIES MARKET, BY TYPE, 2022–2029 (USD MILLION)
- TABLE 204 JAPAN: CLEANROOM TECHNOLOGIES MARKET, BY MODULAR CLEANROOMS, 2022–2029 (USD MILLION)
- TABLE 205 JAPAN: CLEANROOM TECHNOLOGIES MARKET, BY END USER, 2022–2029 (USD MILLION)
- TABLE 206 INDIA: CLEANROOM TECHNOLOGIES MARKET, BY PRODUCT, 2022–2029 (USD MILLION)
- TABLE 207 INDIA: CLEANROOM EQUIPMENT MARKET, BY PRODUCT SUB-TYPE, 2022–2029 (USD MILLION)
- TABLE 208 INDIA: CLEANROOM CONSUMABLES MARKET, BY PRODUCT SUB-TYPE, 2022–2029 (USD MILLION)
- TABLE 209 INDIA: CLEANROOM SAFETY CONSUMABLES MARKET, BY PRODUCT SUB-TYPE, 2022–2029 (USD MILLION)
- TABLE 210 INDIA: CLEANROOM CLEANING CONSUMABLES MARKET, BY PRODUCT SUB-TYPE, 2022–2029 (USD MILLION)
- TABLE 211 INDIA: CLEANROOM DISINFECTANTS MARKET, BY PRODUCT SUB-TYPE, 2022–2029 (USD MILLION)
- TABLE 212 INDIA: CLEANROOM TECHNOLOGIES MARKET, BY TYPE, 2022–2029 (USD MILLION)
- TABLE 213 INDIA: CLEANROOM TECHNOLOGIES MARKET, BY MODULAR CLEANROOMS, 2022–2029 (USD MILLION)
- TABLE 214 INDIA: CLEANROOM TECHNOLOGIES MARKET, BY END USER, 2022–2029 (USD MILLION)
- TABLE 215 AUSTRALIA: CLEANROOM TECHNOLOGIES MARKET, BY PRODUCT, 2022–2029 (USD MILLION)
- TABLE 216 AUSTRALIA: CLEANROOM EQUIPMENT MARKET, BY PRODUCT SUB-TYPE, 2022–2029 (USD MILLION)
- TABLE 217 AUSTRALIA: CLEANROOM CONSUMABLES MARKET, BY PRODUCT SUB-TYPE, 2022–2029 (USD MILLION)
- TABLE 218 AUSTRALIA: CLEANROOM SAFETY CONSUMABLES MARKET, BY PRODUCT SUB-TYPE, 2022–2029 (USD MILLION)
- TABLE 219 AUSTRALIA: CLEANROOM CLEANING CONSUMABLES MARKET, BY PRODUCT SUB-TYPE, 2022–2029 (USD MILLION)
- TABLE 220 AUSTRALIA: CLEANROOM DISINFECTANTS MARKET, BY PRODUCT SUB-TYPE, 2022–2029 (USD MILLION)
- TABLE 221 AUSTRALIA: CLEANROOM TECHNOLOGIES MARKET, BY TYPE, 2022–2029 (USD MILLION)
- TABLE 222 AUSTRALIA: CLEANROOM TECHNOLOGIES MARKET, BY MODULAR CLEANROOMS, 2022–2029 (USD MILLION)
- TABLE 223 AUSTRALIA: CLEANROOM TECHNOLOGIES MARKET, BY END USER, 2022–2029 (USD MILLION)
- TABLE 224 SOUTH KOREA: CLEANROOM TECHNOLOGIES MARKET, BY PRODUCT, 2022–2029 (USD MILLION)
- TABLE 225 SOUTH KOREA: CLEANROOM EQUIPMENT MARKET, BY PRODUCT SUB-TYPE, 2022–2029 (USD MILLION)
- TABLE 226 SOUTH KOREA: CLEANROOM CONSUMABLES MARKET, BY PRODUCT SUB-TYPE, 2022–2029 (USD MILLION)
- TABLE 227 SOUTH KOREA: CLEANROOM SAFETY CONSUMABLES MARKET, BY PRODUCT SUB-TYPE, 2022–2029 (USD MILLION)
- TABLE 228 SOUTH KOREA: CLEANROOM CLEANING CONSUMABLES MARKET, BY PRODUCT SUB-TYPE, 2022–2029 (USD MILLION)
- TABLE 229 SOUTH KOREA: CLEANROOM DISINFECTANTS MARKET, BY PRODUCT SUB-TYPE, 2022–2029 (USD MILLION)
- TABLE 230 SOUTH KOREA: CLEANROOM TECHNOLOGIES MARKET, BY TYPE, 2022–2029 (USD MILLION)
- TABLE 231 SOUTH KOREA: CLEANROOM TECHNOLOGIES MARKET, BY MODULAR CLEANROOMS, 2022–2029 (USD MILLION)
- TABLE 232 KOREA: CLEANROOM TECHNOLOGIES MARKET, BY END USER, 2022–2029 (USD MILLION)
- TABLE 233 REST OF ASIA PACIFIC: CLEANROOM TECHNOLOGIES MARKET, BY PRODUCT, 2022–2029 (USD MILLION)
- TABLE 234 REST OF ASIA PACIFIC: CLEANROOM EQUIPMENT MARKET, BY PRODUCT SUB-TYPE, 2022–2029 (USD MILLION)
- TABLE 235 REST OF ASIA PACIFIC: CLEANROOM CONSUMABLES MARKET, BY PRODUCT SUB-TYPE, 2022–2029 (USD MILLION)
- TABLE 236 REST OF ASIA PACIFIC: CLEANROOM SAFETY CONSUMABLES MARKET, BY PRODUCT SUB-TYPE, 2022–2029 (USD MILLION)
- TABLE 237 REST OF ASIA PACIFIC: CLEANROOM CLEANING CONSUMABLES MARKET, BY PRODUCT SUB-TYPE, 2022–2029 (USD MILLION)
- TABLE 238 REST OF ASIA PACIFIC: CLEANROOM DISINFECTANTS MARKET, BY PRODUCT SUB-TYPE, 2022–2029 (USD MILLION)
- TABLE 239 REST OF ASIA PACIFIC: CLEANROOM TECHNOLOGIES MARKET, BY TYPE, 2022–2029 (USD MILLION)
- TABLE 240 REST OF ASIA PACIFIC: CLEANROOM TECHNOLOGIES MARKET, BY MODULAR CLEANROOMS, 2022–2029 (USD MILLION)
- TABLE 241 REST OF ASIA PACIFIC: CLEANROOM TECHNOLOGIES MARKET, BY END USER, 2022–2029 (USD MILLION)
- TABLE 242 LATIN AMERICA: CLEANROOM TECHNOLOGIES MARKET, BY COUNTRY, 2022–2029 (USD MILLION)
- TABLE 243 LATIN AMERICA: CLEANROOM TECHNOLOGIES MARKET, BY PRODUCT, 2022–2029 (USD MILLION)
- TABLE 244 LATIN AMERICA: CLEANROOM EQUIPMENT MARKET, BY PRODUCT SUB-TYPE, 2022–2029 (USD MILLION)
- TABLE 245 LATIN AMERICA: CLEANROOM CONSUMABLES MARKET, BY PRODUCT SUB-TYPE, 2022–2029 (USD MILLION)
- TABLE 246 LATIN AMERICA: CLEANROOM SAFETY CONSUMABLES MARKET, BY PRODUCT SUB-TYPE, 2022–2029 (USD MILLION)
- TABLE 247 LATIN AMERICA: CLEANROOM CLEANING CONSUMABLES MARKET, BY PRODUCT SUB-TYPE, 2022–2029 (USD MILLION)
- TABLE 248 LATIN AMERICA: CLEANROOM DISINFECTANTS MARKET, BY PRODUCT SUB-TYPE, 2022–2029 (USD MILLION)
- TABLE 249 LATIN AMERICA: CLEANROOM TECHNOLOGIES MARKET, BY TYPE, 2022–2029 (USD MILLION)
- TABLE 250 LATIN AMERICA: CLEANROOM TECHNOLOGIES MARKET, BY MODULAR CLEANROOMS, 2022–2029 (USD MILLION)
- TABLE 251 LATIN AMERICA: CLEANROOM TECHNOLOGIES MARKET, BY END USER, 2022–2029 (USD MILLION)
- TABLE 252 BRAZIL: CLEANROOM TECHNOLOGIES MARKET, BY PRODUCT, 2022–2029 (USD MILLION)
- TABLE 253 BRAZIL: CLEANROOM EQUIPMENT MARKET, BY TYPE, 2022–2029 (USD MILLION)
- TABLE 254 BRAZIL: CLEANROOM CONSUMABLES MARKET, BY PRODUCT SUB-TYPE, 2022–2029 (USD MILLION)
- TABLE 255 BRAZIL: CLEANROOM CONSUMABLES MARKET, BY PRODUCT SUB-TYPE, 2022–2029 (USD MILLION)
- TABLE 256 BRAZIL: CLEANROOM SAFETY CONSUMABLES MARKET, BY PRODUCT SUB-TYPE, 2022–2029 (USD MILLION)
- TABLE 257 BRAZIL: CLEANROOM CLEANING CONSUMABLES MARKET, BY PRODUCT SUB-TYPE, 2022–2029 (USD MILLION)
- TABLE 258 BRAZIL: CLEANROOM DISINFECTANTS MARKET, BY PRODUCT SUB-TYPE, 2022–2029 (USD MILLION)
- TABLE 259 BRAZIL: CLEANROOM TECHNOLOGIES MARKET, BY TYPE, 2022–2029 (USD MILLION)
- TABLE 260 BRAZIL: CLEANROOM TECHNOLOGIES MARKET, BY MODULAR CLEANROOMS, 2022–2029 (USD MILLION)
- TABLE 261 BRAZIL: CLEANROOM TECHNOLOGIES MARKET, BY END USER, 2022–2029 (USD MILLION)
- TABLE 262 MEXICO: CLEANROOM TECHNOLOGIES MARKET, BY PRODUCT, 2022–2029 (USD MILLION)
- TABLE 263 MEXICO: CLEANROOM EQUIPMENT MARKET, BY PRODUCT SUB-TYPE, 2022–2029 (USD MILLION)
- TABLE 264 MEXICO: CLEANROOM CONSUMABLES MARKET, BY PRODUCT SUB-TYPE, 2022–2029 (USD MILLION)
- TABLE 265 MEXICO: CLEANROOM SAFETY CONSUMABLES MARKET, BY PRODUCT SUB-TYPE, 2022–2029 (USD MILLION)
- TABLE 266 MEXICO: CLEANROOM CLEANING CONSUMABLES MARKET, BY PRODUCT SUB-TYPE, 2022–2029 (USD MILLION)
- TABLE 267 MEXICO: CLEANROOM DISINFECTANTS MARKET, BY PRODUCT SUB-TYPE, 2022–2029 (USD MILLION)
- TABLE 268 MEXICO: CLEANROOM TECHNOLOGIES MARKET, BY TYPE, 2022–2029 (USD MILLION)
- TABLE 269 MEXICO: CLEANROOM TECHNOLOGIES MARKET, BY MODULAR CLEANROOMS, 2022–2029 (USD MILLION)
- TABLE 270 MEXICO: CLEANROOM TECHNOLOGIES MARKET, BY END USER, 2022–2029 (USD MILLION)
- TABLE 271 REST OF LATIN AMERICA: CLEANROOM TECHNOLOGIES MARKET, BY PRODUCT, 2022–2029 (USD MILLION)
- TABLE 272 REST OF LATIN AMERICA: CLEANROOM EQUIPMENT MARKET, BY PRODUCT SUB-TYPE, 2022–2029 (USD MILLION)
- TABLE 273 REST OF LATIN AMERICA: CLEANROOM CONSUMABLES MARKET, BY PRODUCT SUB-TYPE, 2022–2029 (USD MILLION)
- TABLE 274 REST OF LATIN AMERICA: CLEANROOM SAFETY CONSUMABLES MARKET, BY PRODUCT SUB-TYPE, 2022–2029 (USD MILLION)
- TABLE 275 REST OF LATIN AMERICA: CLEANROOM CLEANING CONSUMABLES MARKET, BY PRODUCT SUB-TYPE, 2022–2029 (USD MILLION)
- TABLE 276 REST OF LATIN AMERICA: CLEANROOM DISINFECTANTS MARKET, BY PRODUCT SUB-TYPE, 2022–2029 (USD MILLION)
- TABLE 277 REST OF LATIN AMERICA: CLEANROOM TECHNOLOGIES MARKET, BY TYPE, 2022–2029 (USD MILLION)
- TABLE 278 REST OF LATIN AMERICA: CLEANROOM TECHNOLOGIES MARKET, BY MODULAR CLEANROOMS, 2022–2029 (USD MILLION)
- TABLE 279 REST OF LATIN AMERICA: CLEANROOM TECHNOLOGIES MARKET, BY END USER, 2022–2029 (USD MILLION)
- TABLE 280 MIDDLE EAST & AFRICA: CLEANROOM TECHNOLOGIES MARKET, BY COUNTRY, 2022–2029 (USD MILLION)
- TABLE 281 MIDDLE EAST & AFRICA: CLEANROOM TECHNOLOGIES MARKET, BY PRODUCT, 2022–2029 (USD MILLION)
- TABLE 282 MIDDLE EAST & AFRICA: CLEANROOM EQUIPMENT MARKET, BY PRODUCT SUB-TYPE, 2022–2029 (USD MILLION)
- TABLE 283 MIDDLE EAST & AFRICA: CLEANROOM CONSUMABLES MARKET, BY PRODUCT SUB-TYPE, 2022–2029 (USD MILLION)
- TABLE 284 MIDDLE EAST & AFRICA: CLEANROOM SAFETY CONSUMABLES MARKET, BY PRODUCT SUB-TYPE, 2022–2029 (USD MILLION)
- TABLE 285 MIDDLE EAST & AFRICA: CLEANROOM CLEANING CONSUMABLES MARKET, BY PRODUCT SUB-TYPE, 2022–2029 (USD MILLION)
- TABLE 286 MIDDLE EAST & AFRICA: CLEANROOM DISINFECTANTS MARKET, BY PRODUCT SUB-TYPE, 2022–2029 (USD MILLION)
- TABLE 287 MIDDLE EAST & AFRICA: CLEANROOM TECHNOLOGIES MARKET, BY TYPE, 2022–2029 (USD MILLION)
- TABLE 288 MIDDLE EAST & AFRICA: CLEANROOM TECHNOLOGIES MARKET, BY MODULAR CLEANROOMS, 2022–2029 (USD MILLION)
- TABLE 289 MIDDLE EAST & AFRICA: CLEANROOM TECHNOLOGIES MARKET, BY END USER, 2022–2029 (USD MILLION)
- TABLE 290 GCC COUNTRIES: CLEANROOM TECHNOLOGIES MARKET, BY PRODUCT, 2022–2029 (USD MILLION)
- TABLE 291 GCC COUNTRIES: CLEANROOM EQUIPMENT MARKET, BY PRODUCT SUB-TYPE, 2022–2029 (USD MILLION)
- TABLE 292 GCC COUNTRIES: CLEANROOM CONSUMABLES MARKET, BY PRODUCT SUB-TYPE, 2022–2029 (USD MILLION)
- TABLE 293 GCC COUNTRIES: CLEANROOM SAFETY CONSUMABLES MARKET, BY PRODUCT SUB-TYPE, 2022–2029 (USD MILLION)
- TABLE 294 GCC COUNTRIES: CLEANROOM CLEANING CONSUMABLES MARKET, BY PRODUCT SUB-TYPE, 2022–2029 (USD MILLION)
- TABLE 295 GCC COUNTRIES: CLEANROOM DISINFECTANTS MARKET, BY PRODUCT SUB-TYPE, 2022–2029 (USD MILLION)
- TABLE 296 GCC COUNTRIES: CLEANROOM TECHNOLOGIES MARKET, BY TYPE, 2022–2029 (USD MILLION)
- TABLE 297 GCC COUNTRIES: CLEANROOM TECHNOLOGIES MARKET, BY MODULAR CLEANROOMS, 2022–2029 (USD MILLION)
- TABLE 298 GCC COUNTRIES: CLEANROOM TECHNOLOGIES MARKET, BY END USER, 2022–2029 (USD MILLION)
- TABLE 299 REST OF MIDDLE EAST & AFRICA: CLEANROOM TECHNOLOGIES MARKET, BY PRODUCT, 2022–2029 (USD MILLION)
- TABLE 300 REST OF MIDDLE EAST & AFRICA: CLEANROOM EQUIPMENT MARKET, BY PRODUCT SUB-TYPE, 2022–2029 (USD MILLION)
- TABLE 301 REST OF MIDDLE EAST & AFRICA: CLEANROOM CONSUMABLES MARKET, BY PRODUCT SUB-TYPE, 2022–2029 (USD MILLION)
- TABLE 302 REST OF MIDDLE EAST & AFRICA: CLEANROOM SAFETY CONSUMABLES MARKET, BY PRODUCT SUB-TYPE, 2022–2029 (USD MILLION)
- TABLE 303 REST OF MIDDLE EAST & AFRICA: CLEANROOM CLEANING CONSUMABLES MARKET, BY PRODUCT SUB-TYPE, 2022–2029 (USD MILLION)
- TABLE 304 REST OF MIDDLE EAST & AFRICA: CLEANROOM DISINFECTANTS MARKET, BY PRODUCT SUB-TYPE, 2022–2029 (USD MILLION)
- TABLE 305 REST OF MIDDLE EAST & AFRICA: CLEANROOM TECHNOLOGIES MARKET, BY TYPE, 2022–2029 (USD MILLION)
- TABLE 306 REST OF MIDDLE EAST & AFRICA: CLEANROOM TECHNOLOGIES MARKET, BY MODULAR CLEANROOMS, 2022–2029 (USD MILLION)
- TABLE 307 REST OF MIDDLE EAST & AFRICA: CLEANROOM TECHNOLOGIES MARKET, BY END USER, 2022–2029 (USD MILLION)
- TABLE 308 CLEANROOM TECHNOLOGIES MARKET: DEGREE OF COMPETITION
- TABLE 309 CLEANROOM TECHNOLOGIES MARKET: PRODUCT FOOTPRINT
- TABLE 310 CLEANROOM TECHNOLOGIES MARKET: TYPE FOOTPRINT
- TABLE 311 CLEANROOM TECHNOLOGIES MARKET: END USER FOOTPRINT
- TABLE 312 CLEANROOM TECHNOLOGIES MARKET: REGION FOOTPRINT
- TABLE 313 CLEANROOM TECHNOLOGIES MARKET: DETAILED LIST OF KEY STARTUPS/SMES
- TABLE 314 CLEANROOM TECHNOLOGIES MARKET: COMPETITIVE BENCHMARKING OF START-UPS/SMES
- TABLE 315 CLEANROOM TECHNOLOGIES MARKET: PRODUCT LAUNCHES, JANUARY 2020–JULY 2024
- TABLE 316 CLEANROOM TECHNOLOGIES MARKET: DEALS, JANUARY 2020–JULY 2024
- TABLE 317 CLEANROOM TECHNOLOGIES MARKET: EXPANSIONS, JANUARY 2020–JULY 2024
- TABLE 318 EXYTE GMBH: COMPANY OVERVIEW
- TABLE 319 EXYTE GMBH: PRODUCTS OFFERED
- TABLE 320 EXYTE GMBH: DEALS, JANUARY 2020–JULY 2024
- TABLE 321 EXYTE GMBH: EXPANSIONS, JANUARY 2020–JULY 2024
- TABLE 322 KIMBERLY-CLARK CORPORATION: COMPANY OVERVIEW
- TABLE 323 KIMBERLY-CLARK CORPORATION: PRODUCTS OFFERED
- TABLE 324 KIMBERLY-CLARK CORPORATION: DEALS, JANUARY 2020–JULY 2024
- TABLE 325 KIMBERLY-CLARK CORPORATION: EXPANSIONS, JANUARY 2020–JULY 2024
- TABLE 326 ILLINOIS TOOL WORKS, INC.: COMPANY OVERVIEW
- TABLE 327 ILLINOIS TOOL WORKS, INC.: PRODUCTS OFFERED
- TABLE 328 ILLINOIS TOOL WORKS, INC.: DEALS, JANUARY 2020–JULY 2024
- TABLE 329 AZBIL CORPORATION: COMPANY OVERVIEW
- TABLE 330 AZBIL CORPORATION: PRODUCTS OFFERED
- TABLE 331 AZBIL CORPORATION: PRODUCT LAUNCHES, JANUARY 2020–JULY 2024
- TABLE 332 AZBIL CORPORATION: DEALS, JANUARY 2020–JULY 2024
- TABLE 333 BOUYGUES GROUP: COMPANY OVERVIEW
- TABLE 334 BOUYGUES GROUP: SERVICES OFFERED
- TABLE 335 BOUYGUES GROUP: DEALS, JANUARY 2020–JULY 2024
- TABLE 336 DUPONT DE NEMOURS, INC.: COMPANY OVERVIEW
- TABLE 337 DUPONT DE NEMOURS, INC.: PRODUCTS OFFERED
- TABLE 338 DUPONT DE NEMOURS, INC.: PRODUCT LAUNCHES, JANUARY 2020–JULY 2024
- TABLE 339 DUPONT DE NEMOURS, INC.: DEALS, JANUARY 2020–JULY 2024
- TABLE 340 TAIKISHA LTD.: COMPANY OVERVIEW
- TABLE 341 TAIKISHA LTD.: PRODUCTS OFFERED
- TABLE 342 TAIKISHA LTD.: PRODUCT LAUNCHES, JANUARY 2020–JULY 2024
- TABLE 343 TAIKISHA LTD.: EXPANSIONS, JANUARY 2020–JULY 2024
- TABLE 344 ARDMAC: COMPANY OVERVIEW
- TABLE 345 ARDMAC.: PRODUCTS OFFERED
- TABLE 346 ARDMAC: PRODUCT LAUNCHES, JANUARY 2020–JULY 2024
- TABLE 347 ARDMAC: DEALS, JANUARY 2020–JULY 2024
- TABLE 348 CAMFIL: COMPANY OVERVIEW
- TABLE 349 CAMFIL: PRODUCTS OFFERED
- TABLE 350 CAMFIL: DEALS, JANUARY 2020–JULY 2024
- TABLE 351 CAMFIL: EXPANSIONS, JANUARY 2020–JULY 2024
- TABLE 352 LABCONCO CORPORATION: COMPANY OVERVIEW
- TABLE 353 LABCONCO CORPORATION.: PRODUCTS OFFERED
- TABLE 354 LABCONCO CORPORATION: PRODUCT LAUNCHES, JANUARY 2020–JULY 2024
- TABLE 355 LABCONCO CORPORATION: DEALS, JANUARY 2020–JULY 2024
- TABLE 356 ABN CLEANROOM TECHNOLOGY: COMPANY OVERVIEW
- TABLE 357 ABN CLEANROOM TECHNOLOGY: PRODUCTS & SERVICES OFFERED
- TABLE 358 ABN CLEANROOM TECHNOLOGY: PRODUCT LAUNCHES, JANUARY 2020–JULY 2024
- TABLE 359 ABN CLEANROOM TECHNOLOGY: DEALS, JANUARY 2020–JULY 2024
- TABLE 360 ABN CLEANROOM TECHNOLOGY: EXPANSIONS, JANUARY 2020–JULY 2024
- TABLE 361 ANGSTROM TECHNOLOGY LTD.: COMPANY OVERVIEW
- TABLE 362 ANGSTROM TECHNOLOGY LTD.: PRODUCTS & SERVICES
- TABLE 363 ANGSTROM TECHNOLOGY LTD.: DEALS, JANUARY 2020–JULY 2024
- TABLE 364 OCTANORM-VERTRIEBS-GMBH: COMPANY OVERVIEW
- TABLE 365 OCTANORM-VERTRIEBS-GMBH: PRODUCTS & SERVICES OFFERED
- TABLE 366 OCTANORM-VERTRIEBS-GMBH: PRODUCT LAUNCHES, JANUARY 2020–JULY 2024
- TABLE 367 CLEAN ROOMS INTERNATIONAL, INC.: COMPANY OVERVIEW
- TABLE 368 TERRA UNIVERSAL, INC.: COMPANY OVERVIEW
- TABLE 369 AIRTECH JAPAN, LTD.: COMPANY OVERVIEW
- TABLE 370 PARTECO SRL: COMPANY OVERVIEW
- TABLE 371 DYNAREX CORPORATION: COMPANY OVERVIEW
- TABLE 372 COLANDIS GMBH: COMPANY OVERVIEW
- TABLE 373 CLEAN AIR PRODUCTS: COMPANY OVERVIEW
- TABLE 374 BERKSHIRE CORPORATION: COMPANY OVERVIEW
- TABLE 375 AIRPLAN: COMPANY OVERVIEW
- TABLE 376 CLEAN AIR TECHNOLOGY, INC.: COMPANY OVERVIEW
- TABLE 377 WEISS TECHNIK (A SCHUNK COMPANY): COMPANY OVERVIEW
- TABLE 378 ATLAS ENVIRONMENTS, LTD.: COMPANY OVERVIEW
- FIGURE 1 CLEANROOM TECHNOLOGIES MARKET SEGMENTATION
- FIGURE 2 RESEARCH DESIGN
- FIGURE 3 PRIMARY SOURCES
- FIGURE 4 BREAKDOWN OF PRIMARY INTERVIEWS: SUPPLY-SIDE AND OTHER PARTICIPANTS
- FIGURE 5 BREAKDOWN OF PRIMARY INTERVIEWS: BY COMPANY TYPE, DESIGNATION, AND REGION
- FIGURE 6 BREAKDOWN OF PRIMARY INTERVIEWS (DEMAND SIDE): BY END USER, DESIGNATION, AND REGION
- FIGURE 7 MARKET SIZE APPROACH – REVENUE ANALYSIS
- FIGURE 8 REVENUE ANALYSIS ILLUSTRATION: KIMBERLY-CLARK CORPORATION (2023)
- FIGURE 9 TOP-DOWN APPROACH
- FIGURE 10 SUPPLY SIDE ANALYSIS: CLEANROOM TECHNOLOGIES MARKET (2023)
- FIGURE 11 CAGR PROJECTIONS FROM ANALYSIS OF DRIVERS, RESTRAINTS, OPPORTUNITIES, AND CHALLENGES
- FIGURE 12 CLEANROOM TECHNOLOGIES MARKET: CAGR PROJECTIONS
- FIGURE 13 DATA TRIANGULATION METHODOLOGY
- FIGURE 14 CLEANROOM TECHNOLOGIES MARKET, BY PRODUCT, 2024 VS. 2029 (USD MILLION)
- FIGURE 15 CLEANROOM CONSUMABLES MARKET, BY PRODUCT SUB-TYPE, 2024 VS. 2029 (USD MILLION)
- FIGURE 16 CLEANROOM EQUIPMENT MARKET, BY PRODUCT SUB-TYPE, 2024 VS. 2029 (USD MILLION)
- FIGURE 17 CLEANROOM TECHNOLOGIES MARKET, BY TYPE, 2024 VS. 2029 (USD MILLION)
- FIGURE 18 CLEANROOM TECHNOLOGIES MARKET, BY END USER, 2024 VS. 2029 (USD MILLION)
- FIGURE 19 GEOGRAPHICAL SNAPSHOT OF CLEANROOM TECHNOLOGIES MARKET
- FIGURE 20 INCREASING DEMAND FOR BIOLOGICALS AND GROWTH OF GLOBAL BIOPHARMACEUTICAL INDUSTRY TO DRIVE MARKET
- FIGURE 21 PHARMACEUTICAL INDUSTRY AND CHINA DOMINATED MARKET IN 2023
- FIGURE 22 CHINA MARKET TO GROW AT HIGHEST CAGR DURING FORECAST PERIOD
- FIGURE 23 ASIA PACIFIC MARKET TO GROW AT HIGHEST RATE DURING FORECAST PERIOD (2024–2029)
- FIGURE 24 EMERGING ECONOMIES TO REGISTER HIGHER GROWTH DURING FORECAST PERIOD
- FIGURE 25 CLEANROOM TECHNOLOGIES MARKET: DRIVERS, RESTRAINTS, OPPORTUNITIES, AND CHALLENGES
- FIGURE 26 NUMBER OF PHARMA COMPANIES WITH ACTIVE DRUG PIPELINE PROJECTS (2010–2024)
- FIGURE 27 CLEANROOM TECHNOLOGIES MARKET: VALUE CHAIN ANALYSIS
- FIGURE 28 PORTER'S FIVE FORCES ANALYSIS
- FIGURE 29 INFLUENCE OF STAKEHOLDERS ON BUYING PROCESS FOR TOP 3 END USERS
- FIGURE 30 KEY BUYING CRITERIA FOR TOP 3 END USERS
- FIGURE 31 AVERAGE SELLING PRICE TREND OF CLEANROOM TECHNOLOGIES, BY PRODUCT
- FIGURE 32 CLEANROOM TECHNOLOGIES MARKET: ECOSYSTEM
- FIGURE 33 PATENT PUBLICATION TRENDS (JANUARY 2013–AUGUST 2024)
- FIGURE 34 TOP APPLICANTS & OWNERS (COMPANIES/INSTITUTIONS) FOR CLEANROOM TECHNOLOGY PATENTS (JANUARY 2013–AUGUST 2024)
- FIGURE 35 TOP APPLICANT COUNTRIES/REGIONS FOR CLEANROOM TECHNOLOGY PATENTS (JANUARY 2013–AUGUST 2024)
- FIGURE 36 CLEANROOM TECHNOLOGIES MARKET: SUPPLY CHAIN ANALYSIS
- FIGURE 37 TRENDS/DISRUPTIONS IMPACTING CUSTOMER BUSINESS IN CLEANROOM TECHNOLOGIES MARKET
- FIGURE 38 ADJACENT MARKETS FOR CLEANROOM TECHNOLOGIES
- FIGURE 39 INVESTMENT/VENTURE CAPITAL SCENARIO IN CLEANROOM TECHNOLOGIES MARKET, 2019–2024
- FIGURE 40 CLEANROOM TECHNOLOGIES MARKET: GEOGRAPHIC SNAPSHOT (2023)
- FIGURE 41 NORTH AMERICA: CLEANROOM TECHNOLOGIES MARKET SNAPSHOT (2023)
- FIGURE 42 ASIA PACIFIC: CLEANROOM TECHNOLOGIES MARKET SNAPSHOT (2023)
- FIGURE 43 REVENUE ANALYSIS OF KEY PLAYERS IN CLEANROOM TECHNOLOGIES MARKET (2019–2023)
- FIGURE 44 CLEANROOM TECHNOLOGIES MARKET SHARE, BY KEY PLAYER, 2023
- FIGURE 45 CLEANROOM TECHNOLOGIES MARKET: COMPANY EVALUATION MATRIX (KEY PLAYERS), 2023
- FIGURE 46 CLEANROOM TECHNOLOGIES MARKET: COMPANY FOOTPRINT
- FIGURE 47 CLEANROOM TECHNOLOGIES MARKET: COMPANY EVALUATION MATRIX (STARTUPS/SMES), 2023
- FIGURE 48 EV/EBITDA OF KEY VENDORS
- FIGURE 49 YEAR-TO-DATE (YTD) PRICE TOTAL RETURN AND 5-YEAR STOCK BETA OF KEY VENDORS
- FIGURE 50 CLEANROOM TECHNOLOGIES MARKET: BRAND/PRODUCT COMPARISON
- FIGURE 51 R&D ASSESSMENT OF KEY PLAYERS IN CLEANROOM TECHNOLOGIES MARKET, 2021–2023
- FIGURE 52 EXYTE GMBH: COMPANY SNAPSHOT (2023)
- FIGURE 53 KIMBERLY-CLARK CORPORATION: COMPANY SNAPSHOT (2023)
- FIGURE 54 ILLINOIS TOOL WORKS, INC.: COMPANY SNAPSHOT (2023)
- FIGURE 55 AZBIL CORPORATION: COMPANY SNAPSHOT (2023)
- FIGURE 56 BOUYGUES GROUP: COMPANY SNAPSHOT (2023)
- FIGURE 57 DUPONT DE NEMOURS, INC.: COMPANY SNAPSHOT (2023)
- FIGURE 58 TAIKISHA LTD.: COMPANY SNAPSHOT (2023)
This study involved four major activities in estimating the size of the cleanrooms technologies market. Exhaustive secondary research was done to collect information on the market, peer market, and parent market. The next step was to validate these findings, assumptions, and sizing with industry experts across value chains through primary research. The bottom-up approach was employed to estimate the overall market size. After that, market breakdown and data triangulation were used to estimate the market size of segments and sub-segments.
Secondary Research
The secondary research process involved the widespread use of secondary sources, directories, databases (such as Bloomberg Businessweek, Factiva, and D&B Hoovers), white papers, annual reports, company house documents, investor presentations, and SEC filings of companies. Secondary research was used to identify and collect information useful for the extensive, technical, market-oriented, and commercial study of the cleanroom technologies market. It was also used to obtain important information about the key players and market classification and segmentation according to industry trends to the bottom-most level, and key developments related to market and technology perspectives. A database of the key industry leaders was also prepared using secondary research.
Primary Research
In the primary research process, various sources from both the supply and demand sides were interviewed to obtain qualitative and quantitative information for this report. The primary sources from the supply side include industry experts such as CEOs, vice presidents, marketing and sales directors, technology & innovation directors, and related key executives from various key companies and organizations operating in the cleanroom technologies market. The primary sources from the demand side included industry experts, purchase & sales managers, doctors, and personnel from research organizations. Primary research was conducted to validate the market segmentation, identify key players in the market, and gather insights on key industry trends and key market dynamics.
Breakdown of Primary Interviews
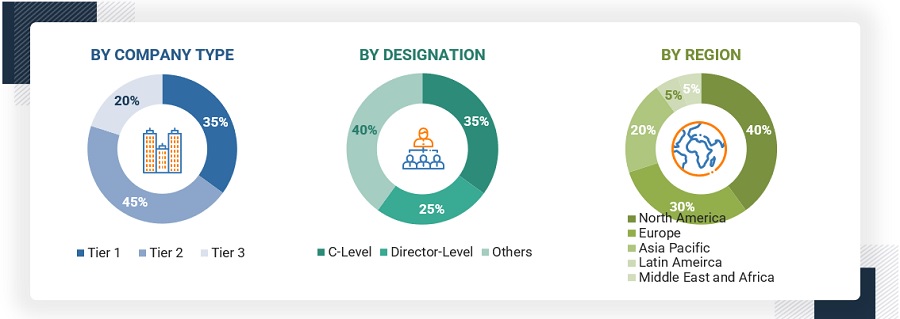
Note 1: C-level primaries include CEOs, COOs, CTOs, and VPs.
Note 2: Other primaries include Others include sales managers, marketing managers, and product managers.
Note 3: Companies are classified into tiers based on their total revenue. As of 2020: Tier 1=>USD 1 billion, Tier 2 = USD 500 million to USD 1 billion, Tier 3=<USD 500 million
To know about the assumptions considered for the study, download the pdf brochure
The research methodology used to estimate the size of the cleanroom technologies market includes the following details.
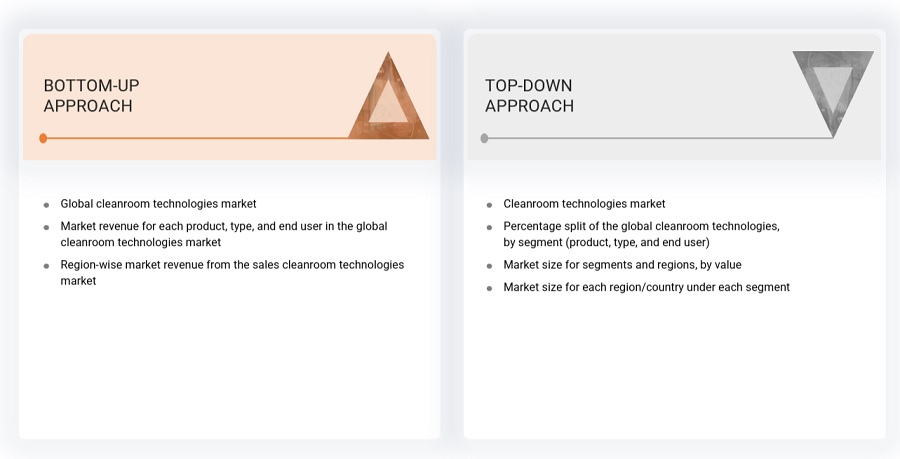
The market sizing of the market was undertaken from the global side.
Country-level Analysis: The size of the cleanroom technologies market was obtained from the annual presentations of leading players and secondary data available in the public domain. The share of products and services in the overall cleanroom technologies market was obtained from secondary data and validated by primary participants to arrive at the total cleanroom technologies market. Primary participants further validated the numbers.
Geographic market assessment (by region & country): The geographic assessment was done using the following approaches:
Approach 1: Geographic revenue contributions/splits of leading players in the market (wherever available) and respective growth trends
Approach 2: Geographic adoption trends for individual product segments by end users and growth prospects for each of the segments (assumptions and indicative estimates validated from primary interviews)
At each point, the assumptions and approaches were validated through industry experts contacted during primary research. Considering the limitations of data available from secondary research, revenue estimates for individual companies (for the overall cleanroom technologies market and geographic market assessment) were ascertained based on a detailed analysis of their respective product offerings, geographic reach/strength (direct or through distributors or suppliers), and the shares of the leading players in a particular region or country.
Global Cleanroom technologies Size: Top-Down and Bottom Up Approach
To know about the assumptions considered for the study, Request for Free Sample Report
Data Triangulation
After arriving at the overall market size—using the market size estimation processes explained above—the market was split into several segments and sub-segments. To complete the overall market engineering process and arrive at the exact statistics of each market segment and subsegment, data triangulation, and market breakdown procedures were employed, wherever applicable. The data was triangulated by studying various factors and trends from both the demand and supply sides.
Market Definition
Cleanroom technologies are specialized systems, processes, and equipment designed to produce an environment with low concentrations of airborne particulates, contaminants, and pollutants. Such technologies have significant applications in industries including pharmaceuticals, biotechnology, electronics, and aerospace, where a minute contaminant might compromise product quality or safety. Cleanroom technologies include such things as air filtration with HEPA and ULPA, environmental control for temperature, humidity, and pressure, and advanced monitoring systems that could be instituted in order to ensure particular standards of cleanliness are met, for instance ISO and GMP.
Key Stakeholders
- Indian Pharmaceutical Association (IPA)
- Pharmaceutical Research and Manufacturers of America (PhRMA)
- European Federation of Pharmaceutical Industries and Associations (EFPIA)
- Central Drugs Standard Control Organization (CDSCO)
- India Brand Equity Foundation (IBEF)
- Pharma & Biopharma Outsourcing Association (PBOA)
- Indian Drug Manufacturers’ Association (IDMA)
- World Health Organization (WHO)
- Organization for Economic Co-operation and Development (OECD)
- National Institutes of Health (NIH)
- Centers for Disease Control and Prevention (CDC)
- Annual Reports/SEC Filings, Investor Presentations, and Press Releases of Key Players
- White Papers, Journals/Magazines, and News Articles
- Paid Databases, such as Factiva, D&B Hoovers, and Bloomberg Business
Report Objectives
- To define, describe, segment, and forecast the cleanroom technologies market by product, type, end user, and region
- To provide detailed information about the factors influencing the market growth (such as drivers, restraints, opportunities, and challenges)
- To analyze micromarkets1 with respect to individual growth trends, prospects, and contributions to the overall cleanroom technologies market
- To analyze market opportunities for stakeholders and provide details of the competitive landscape for key players
- To forecast the size of the cleanroom technologies market in five main regions (along with their respective key countries), namely, North America, Europe, the Asia Pacific, Latin America, and the Middle East & Africa
- To profile the key players in the cleanroom technologies market and comprehensively analyze their core competencies2 and market shares
- To track and analyze competitive developments such as acquisitions, product launches, expansions, collaborations, agreements, partnerships, and R&D activities of the leading players in the cleanroom technologies market
- To benchmark players within the cleanroom technologies market using the competitive leadership mapping framework, which analyzes market players on various parameters within the broad categories of business strategy, market share, and product offering
Available Customizations
With the given market data, MarketsandMarkets offers customizations as per the company’s specific needs. The following customization options are available for the report:
Geographic Analysis
- Further breakdown of the Rest of Asia Pacific veterinary surgical procedures market into Indonesia, Philippines, Vietnam, Hong Kong, and other countries
- Further breakdown of the Rest of Europe veterinary surgical procedures market into Belgium, Russia, the Netherlands, Switzerland, and other countries.
- Further breakdown of the Rest of Latin America veterinary surgical procedures market into Argentina, Peru, and other countries
Growth opportunities and latent adjacency in Cleanroom Technologies Market
I want detailed information on the recent developments in the global Cleanroom Technologies Market
Which product segment is accounting for the largest share of the global Cleanroom Technologies Market?
Which factors are proving to be the game changer for the global growth of Cleanroom Technologies Market?