Carrier Screening Market: Growth, Size, Share, and Trends

Carrier Screening Market by Product and Service, Type (Expanded (Customized, Predesigned) Targeted Diseases, Medical condition (Hematologic, Pulmonary), Technology (DNA Sequencing, PCR), End User, Region - Global Forecast to 2028

Report Code: MD 7435 Jan, 2024, by marketsandmarkets.com

Market Growth Outlook Summary

The global carrier screening market, valued at US$1.8 billion in 2022, is forecasted to grow at a robust CAGR of 19.7%, reaching US$2.2 billion in 2023 and an impressive US$5.4 billion by 2028. The expansion of this market is majorly due to the development and availability of expanded carrier screening panels that cover a wide range of genetic conditions contribute to the market's growth. Comprehensive panels offer more thorough assessments, and healthcare providers adopt them to provide more extensive genetic information to patients. However, Despite efforts to increase awareness, many individuals and healthcare professionals may still have limited knowledge about the availability and importance of carrier screening. Lack of awareness can contribute to underutilization of carrier screening services which may inhibit the growth of this market.

Carrier Screening Market Trends

Carrier Screening Market

To know about the assumptions considered for the study, Request for Free Sample Report

Carrier Screening Market

Global Carrier Screening Market Dynamics

DRIVER: the increasing prevalence of genetic disorders

The rising prevalence and awareness of genetic diseases contribute significantly to the growth and demand in the carrier screening market. Carrier screening is a crucial tool for identifying individuals who carry a single copy of a gene mutation associated with a specific genetic disorder.

There are an estimated 10,000 different types of single-gene diseases (also called monogenic diseases), which are diseases caused by mutations in a single gene. The World Health Organization estimates that 10 out of every 1000 people are affected. This means that between 70 million and 80 million people in the world are living with one of these diseases. Similarly, as per the NIH, around 350 million people are living with rare disorders, and this is a disorder or condition with fewer than 200,000 people diagnosed. About 80% of these rare disorders are genetic in origin, and 95% of them do not have even one treatment approved by the FDA. In addition, as per a new scientific paper published in the European Journal of Human Genetics has confirmed that the number of people worldwide living with a rare disease is estimated at 300 million.

In addition, the rising prevalence of hereditary cancer is indeed a significant driver for the market. Carrier screening, particularly for cancer susceptibility genes, plays a crucial role in identifying individuals who carry genetic mutations associated with an increased risk of developing certain types of cancer. For instance, as per the NIH, up to 10% of all cancers may cause by inherited genetic changes. As a result, The rising prevalence of genetic diseases underscores the importance of carrier screening as a preventive measure and a tool for informed decision-making in family planning. As awareness continues to grow the market is likely to play an increasingly crucial role in managing and preventing genetic diseases.

RESTRAINT: high cost of carrier screening

The high cost of carrier screening can indeed be a significant restraint for market growth. The affordability and accessibility of genetic testing services, including carrier screening, are key factors that influence the adoption of these services by individuals, couples, and healthcare providers. High costs may limit access to carrier screening services for individuals and couples with limited financial means. This can result in disparities in healthcare, where only those who can afford the testing may benefit, creating inequities in access. Similarly, the high cost of carrier screening may lead to reduced adoption rates, as individuals and couples may be deterred by the financial burden associated with undergoing the testing. This can impact the overall uptake of carrier screening services.

For instance, the Centers for Medicare & Medicaid Services, or CMS, establishes payment levels and coverage rules under Medicare, while state Medicaid programs and commercial health plans establish rates and coverage rules independently in accordance with applicable rules. As such, the reimbursement rates for our diagnostic tests vary by third-party payer. CMS has established a pricing benchmark of USD 2,450 for expanded carrier screening testing. Similarly, as per the article published by obstetrics & Gynecology 2023, the price of 22 panels ranged from USD 349 to USD 4320 per couple in USD.

As a result, High costs may influence consumer perception and acceptance of carrier screening. Individuals and couples may question the value proposition of the testing in relation to the associated financial investment which can cause a threat to market growth.

OPPORTUNITY: integration with telehealth and digital health platforms

The integration of telehealth and digital health platforms creates significant opportunities within the market. Leveraging digital technologies enhances accessibility, improves the efficiency of genetic testing services, and contributes to a more patient-centered approach. Telehealth platforms enable individuals, especially those in remote or underserved areas, to access carrier screening services without the need to visit a physical healthcare facility. This increased accessibility helps reach a broader population. Similarly, telehealth platforms allow for the provision of preconception and prenatal care services, including carrier screening consultations. This supports individuals and couples in making decisions about family planning and managing genetic risks during pregnancy. In addition, Digital health platforms support ongoing follow-up care after carrier screening. This includes virtual consultations, monitoring of genetic risks, and the development of personalized care plans based on screening results. One of the recent developments in this segment is as below:

In 2022, Ambry Genetics (Ambry), a clinical diagnostic testing and a subsidiary of REALM IDx, launched a new reproductive health program that is driven by its CARE ProgramTM (Comprehensive Assessment Risk and Education), a digital platform that enhances the patient and provider experience through easier access to genetic education, testing, reporting, and counseling. This end-to-end program improves family planning and prenatal care by expanding access to carrier screening and NIPT, also known as non-invasive prenatal screening (NIPS), and by helping patients make informed decisions. NIPT is for screening, not diagnosis.

CHALLENGE: dearth of skilled professionals

In diagnostic laboratories, there is a high demand for technicians who are well-versed in handling advanced diagnostic techniques such as sequencing & PCR and capable of interpreting large volumes of data. However, there is a huge supply gap for such professionals worldwide.

According to data reported on Sep 22, 2022, by Education, Lab Management, it was estimated that the industry is short between 20,000 and 25,000 laboratory technologists, with roughly 335,000 such professionals currently employed nationwide. That’s one technologist for every 1,000 U.S. citizens, a shortfall of about 7%.The large gap between the number of medical laboratory professionals graduating and the number of job vacancies in major markets is expected to hamper the growth of the market in the coming years. Likewise, as per the article published by Forbes 2022, in a survey of laboratory professionals by the American Society for Clinical Pathology showed that 85.3% reported burnout. An additional 36.5% complained of inadequate staffing and almost as many of too heavy workload. Lack of recognition was cited by 14.9%.

Furthermore, every genetic analysis testing method requires certain skills to choose appropriate methods and instruments for specific applications. Unskilled personnel limit the use of these products and technologies, resulting in unproductive practices and a lack of understanding of sequencing-based data and detection of genetic abnormalities. As a result, the lack of adequate knowledge regarding the right choice of consumables and instruments may result in incorrect diagnosis and critical delays in timelines. This, in turn, can offset the benefits offered by carrier screening.

Carrier Screening Market Ecosystem Analysis

Carrier Screening Market  Ecosystem

Source: MarketsandMarkets Analysis

An ecosystem analysis in the context of carrier screening involves examining the interconnected network of entities, stakeholders, and factors that influence the development, delivery, and utilization of carrier screening services. This analysis considers the broader ecosystem, including healthcare providers, laboratories, regulatory bodies, technology developers, and patients.

China is anticipated to account the second largest share of Apac Region of Carrier Screening Industry

Based on the Apac region, the Carrier Screening Market is divided into China, Japan, and India. China is expected to account the largest share of Market. This is due to the Growing awareness among the Chinese population about genetic disorders and the importance of carrier screening is a key driver. Educational initiatives and campaigns can contribute to increased demand for carrier screening services and increased healthcare spending in China which lead to improved access to advanced medical technologies, including carrier screening. In addition, The prevalence of genetic disorders in the Chinese population can drive the demand for carrier screening.

Germany is forecasted as the fastest growing country of Carrier Screening Industry in Europe.

Based on the Europe region, the Carrier Screening Market is divided into Germany, UK, Italy, Spain, France, and RoE. Germany is forecasted to be the fastest growing market of Market in Europe. Germany is known for its strong biomedical research community, including leading universities, research institutes, and healthcare facilities. The country's commitment to scientific research contributes to the demand for advanced diagnostic technologies like carrier screening. In addition, Germany has a robust healthcare infrastructure, which includes advanced laboratories and diagnostic facilities. The availability of well-equipped healthcare institutions supports the implementation and utilization of sophisticated diagnostic technologies such as carrier screening.

North America dominates the global Carrier Screening Industry

Based on the region, the Carrier Screening Market is segmented into North America, Europe, Asia Pacific, and the Rest of the World (RoW). North America is expected to dominate the Carrier Screening assay market. Growth in the North American market is mainly driven by the factors such as North America, boasts an advanced and well-established healthcare infrastructure. The presence of state-of-the-art laboratories, research institutions, and healthcare facilities provides a conducive environment for the adoption of advanced diagnostic technologies like carrier screening. Similarly, The region is home to some of the world's leading research institutions and academic centers. These institutions are often at the forefront of genetic research, including studies related to rare diseases, driving the demand for carrier screening services.

Carrier Screening Market  by Region

To know about the assumptions considered for the study, download the pdf brochure

Some of the players operating in North American market are: Invitae Corporation. (US), Fulgent Genetics. (US), OPKO Health, Inc. (US), Thermo Fisher Scientific Inc. (US), Quest Diagnostics Incorporated (US), Myriad Genetics, Inc (US), Illumina, Inc. (US), Natera, Inc. (Italy), Laboratory Corporation of America Holdings. (US), Otogenetics (US),

Targeted Diseases Carrier screening segment of Carrier screening industry to witness the second highest shares during the forecast period.

Based on the Type, the global Carrier Screening Market is segmented into Expanded Carrier Screening (Customized Panel Testing, Predesigned Panel Testing)., and Targeted Diseases Carrier screening. Targeted Diseases Carrier screening segment is expected to witness the second highest shares. The growth of this market is driven by due to its wide applications such as Targeted carrier screening is driven by the higher prevalence of certain genetic conditions within specific ethnic or racial groups likewise, In populations where consanguineous marriages (marriage between close relatives) are more common, targeted carrier screening may be conducted to identify genetic risks associated with consanguinity.

Hematologic Conditions segment of Carrier screening industry to witness the third highest shares during the forecast period.

Based on the Medical Conditions, Carrier Screening Market is classified into Hematologic Conditions, Pulmonary Conditions, Neurological Conditions, and Others. The Hematologic Conditions segment is forecasted to drive the third highest shares of Market. This is due to the rising cases of Thalassemias globally which is a genetic disorders that affect hemoglobin production, leading to anemia. Carrier screening can identify individuals carrying mutations associated with thalassemia, especially in populations with a higher prevalence of these mutations. Likewise, The prevalence of specific hematologic disorders in a population may drive the demand for carrier screening for these conditions.

Carrier Screening Market Report Scope

Report Metric

Details

Market Revenue Size in 2023

$2.2 billion

Projected Revenue Size by 2028

$5.4 billion

Industry Growth Rate

Poised to Grow at a CAGR of 19.7%

Market Driver

the increasing prevalence of genetic disorders

Market Opportunity

integration with telehealth and digital health platforms

This research report categorizes the Carrier Screening Market to forecast revenue and analyze trends in each of the following submarkets:

By Region

  • North America
  • Europe
  • Asia Pacific
  • Rest of the World

By Product and Service

  • Product
  • Service

By Type

  • Targeted Diseases Carrier screening
  • Expanded Carrier Screening
  • Customized Panel Testing
  • Predesigned Panel Testing

By Medical Conditions

  • Hematologic Conditions
  • Pulmonary Conditions
  • Neurological Conditions
  • Others

By Technology

  • DNA Sequencing
  • PCR
  • DNA Microarray
  • Other

By End User

  • Hospitals and Medical Centers
  • Clinical Laboratories
  • Fertility Clinics
  • Other End Users

Recent Developments of Carrier Screening Market

  • In 2022, OPKO Health Acquired ModeX Therapeutics, to gain Proprietary Immunotherapy Technology with a Focus on Oncology and Infectious Diseases
  • In 2021, DiaSorin acquired Luminex Corporation to expands DiaSorin’s offer in the molecular diagnostic sector gaining access to multiplexing technology, which allows analysis of multiple parameters from a single biological sample within a single run.

Frequently Asked Questions (FAQ):

To speak to our analyst for a discussion on the above findings, click Speak to Analyst

Exclusive indicates content/data unique to MarketsandMarkets and not available with any competitors.

INTRODUCTION
22
RESEARCH METHODOLOGY
27
EXECUTIVE SUMMARY
41
PREMIUM INSIGHTS
46
MARKET OVERVIEW
48
  • 5.1 INTRODUCTION
  • 5.2 MARKET DYNAMICS
    DRIVERS
    - Increasing emphasis on early disease detection and prevention
    - Growing prevalence of genetic disorders
    - High risk of chromosomal abnormalities with advancing maternal age
    - Increased focus on preconception and prenatal testing
    - Rising number of fertility clinics and IVF centers
    - Declining rate of fertility
    RESTRAINTS
    - Ethical concerns in preconception genetic carrier screening
    - High cost of carrier screening
    OPPORTUNITIES
    - Increased awareness about reproductive health in emerging economies
    - Integration with telehealth and digital health platforms
    - Increased number of collaborations and partnerships among healthcare organizations
    - Increasing number of government initiatives and policies toward genetic health improvement
    - Growing focus on health screening for rare diseases
    CHALLENGES
    - Lack of skilled professionals
    - Lack of standard guidelines for carrier screening
  • 5.3 TRENDS
    LACK OF PUBLIC INTEREST IN EXPANDED CARRIER SCREENING
  • 5.4 PRICING ANALYSIS
  • 5.5 VALUE CHAIN ANALYSIS
  • 5.6 SUPPLY CHAIN ANALYSIS
  • 5.7 PORTER’S FIVE FORCES ANALYSIS
    THREAT OF NEW ENTRANTS
    THREAT OF SUBSTITUTES
    BARGAINING POWER OF SUPPLIERS
    BARGAINING POWER OF BUYERS
    INTENSITY OF COMPETITIVE RIVALRY
  • 5.8 ECOSYSTEM/MARKET MAP
  • 5.9 TARIFF & REGULATORY LANDSCAPE
    NORTH AMERICA
    - US
    - Canada
    EUROPE
    - UK
    - France
    ASIA PACIFIC
    - Japan
    - India
  • 5.10 PATENT ANALYSIS
    PATENT TRENDS FOR CARRIER SCREENING
    JURISDICTION AND TOP APPLICANT ANALYSIS
  • 5.11 TRENDS/DISRUPTIONS IMPACTING CUSTOMERS’ BUSINESSES
    REVENUE SHIFT AND REVENUE POCKETS FOR CARRIER SCREENING MANUFACTURERS
  • 5.12 KEY CONFERENCES & EVENTS
  • 5.13 TECHNOLOGY ANALYSIS
  • 5.14 KEY STAKEHOLDERS & BUYING CRITERIA
    KEY STAKEHOLDERS
    BUYING CRITERIA
  • 5.15 TRADE ANALYSIS
CARRIER SCREENING MARKET, BY PRODUCT & SERVICE
71
  • 6.1 INTRODUCTION
  • 6.2 SERVICES
    RISING NUMBER OF ACCREDITED LABORATORIES AND GENETIC CASES TO DRIVE MARKET
  • 6.3 PRODUCTS
    GROWING INCIDENCE OF CHROMOSOMAL ABNORMALITIES AND RISING USE OF CARRIER SCREENING TESTS TO DRIVE MARKET
CARRIER SCREENING MARKET, BY TYPE
75
  • 7.1 INTRODUCTION
  • 7.2 EXPANDED CARRIER SCREENING
    PREDESIGNED PANEL TESTING
    - Predesigned panel testing segment to command larger market share during forecast period
    CUSTOMIZED PANEL TESTING
    - Better customization options for meeting specific customer requirements to drive segment
  • 7.3 TARGETED DISEASE CARRIER SCREENING
    INTRODUCTION OF PANELS FOR SIMULTANEOUSLY SCREENING MULTIPLE GENETIC CONDITIONS TO DRIVE MARKET
CARRIER SCREENING MARKET, BY MEDICAL CONDITION
81
  • 8.1 INTRODUCTION
  • 8.2 PULMONARY CONDITIONS
    INCREASING AWARENESS ABOUT CYSTIC FIBROSIS IN REPRODUCTIVE PLANNING TO DRIVE MARKET
  • 8.3 HEMATOLOGICAL CONDITIONS
    RISING PREVALENCE OF HEMATOLOGICAL DISORDERS AMONG INFANTS TO DRIVE MARKET
  • 8.4 NEUROLOGICAL CONDITIONS
    INCREASED AWARENESS OF NEUROLOGICAL SCREENING AND PRESENCE OF TARGETED SCREENING PANELS TO DRIVE MARKET
  • 8.5 OTHER MEDICAL CONDITIONS
CARRIER SCREENING MARKET, BY TECHNOLOGY
89
  • 9.1 INTRODUCTION
  • 9.2 DNA SEQUENCING
    DNA SEQUENCING SEGMENT TO DOMINATE MARKET DURING STUDY PERIOD
  • 9.3 PCR
    HIGH ACCURACY, LOW REACTION TIME, AND ABSOLUTE ESTIMATION OF TARGET MOLECULE TO DRIVE MARKET
  • 9.4 DNA MICROARRAYS
    ABILITY TO ANALYZE MULTIPLE GENETIC MARKERS IN SINGLE ASSAY TO DRIVE MARKET
  • 9.5 OTHER TECHNOLOGIES
CARRIER SCREENING MARKET, BY END USER
95
  • 10.1 INTRODUCTION
  • 10.2 HOSPITALS AND MEDICAL CENTERS
    RISING PATIENT POPULATION AND INCREASING MEDICARE REIMBURSEMENT FOR CLINICAL TESTS TO DRIVE SEGMENT
  • 10.3 CLINICAL LABORATORIES
    LOWER SERVICE COSTS AND HIGHER TURNAROUND TIME TO DRIVE MARKET
  • 10.4 FERTILITY CLINICS
    INCREASING NUMBER OF INFERTILE COUPLES AND GROWING MEDICAL TOURISM IN EMERGING ECONOMIES TO DRIVE MARKET
  • 10.5 OTHER END USERS
CARRIER SCREENING MARKET, BY REGION
101
  • 11.1 INTRODUCTION
  • 11.2 NORTH AMERICA
    NORTH AMERICA: RECESSION IMPACT
    US
    - Increasing number of genetic diseases and rising healthcare expenditure to drive market
    CANADA
    - Increasing government and non-government funding to drive market
  • 11.3 EUROPE
    EUROPE: RECESSION IMPACT
    GERMANY
    - Increasing number of government initiatives and healthcare expenditures to drive market
    UK
    - Rising prevalence of hematological disease and increasing number of accredited clinical laboratories to drive market
    FRANCE
    - Better healthcare infrastructure and higher expenditure for life science research to drive market
    ITALY
    - Growing prevalence of chronic diseases and rising number of hospitals to drive market
    SPAIN
    - Increasing prevalence of rare genetic diseases and rising availability of research funding to drive market
    REST OF EUROPE
  • 11.4 ASIA PACIFIC
    ASIA PACIFIC: RECESSION IMPACT
    INDIA
    - Growing incidence of rare diseases and declining fertility rates to drive market
    CHINA
    - Rising focus on vaccine development and cancer research to drive market
    JAPAN
    - Rising geriatric population and growing government healthcare expenditure to drive market
    REST OF ASIA PACIFIC
  • 11.5 REST OF THE WORLD
    REST OF THE WORLD: RECESSION IMPACT
    LATIN AMERICA
    - Higher prevalence of genetic disorders and growing focus on reproductive healthcare services to drive market
    MIDDLE EAST & AFRICA
    - GCC Countries
COMPETITIVE LANDSCAPE
165
  • 12.1 OVERVIEW
  • 12.2 KEY STRATEGIES/RIGHT TO WIN
    OVERVIEW OF STRATEGIES ADOPTED BY KEY PLAYERS
  • 12.3 MARKET SHARE ANALYSIS
  • 12.4 REVENUE SHARE ANALYSIS
  • 12.5 COMPANY EVALUATION MATRIX
    STARS
    EMERGING LEADERS
    PERVASIVE PLAYERS
    PARTICIPANTS
    COMPANY FOOTPRINT
  • 12.6 START-UP/SME EVALUATION MATRIX
    PROGRESSIVE COMPANIES
    RESPONSIVE COMPANIES
    DYNAMIC COMPANIES
    STARTING BLOCKS
    COMPETITIVE BENCHMARKING
  • 12.7 COMPETITIVE SCENARIOS AND TRENDS
    KEY DEALS
COMPANY PROFILES
175
  • 13.1 KEY PLAYERS
    NATERA, INC.
    - Business overview
    - Products/Services/Solutions offered
    - MnM view
    QUEST DIAGNOSTICS INCORPORATED
    - Business overview
    - Products/Services/Solutions offered
    - MnM view
    FULGENT GENETICS
    - Business overview
    - Products/Services/Solutions offered
    - Recent developments
    - MnM view
    INVITAE CORPORATION
    - Business overview
    - Products/Services/Solutions offered
    EUROFINS SCIENTIFIC
    - Business overview
    - Products/Services/Solutions offered
    OPKO HEALTH, INC.
    - Business overview
    - Products/Services/Solutions offered
    - Recent developments
    THERMO FISHER SCIENTIFIC INC.
    - Business overview
    - Products/Services/Solutions offered
    MYRIAD GENETICS, INC.
    - Business overview
    - Products/Services/Solutions offered
    ILLUMINA, INC.
    - Business overview
    - Products/Services/Solutions offered
    LABORATORY CORPORATION OF AMERICA HOLDINGS
    - Business overview
    - Products/Services/Solutions offered
    CENTOGENE N.V.
    - Business overview
    - Products/Services/Solutions offered
    DIASORIN S.P.A.
    - Business overview
    - Products/Services/Solutions offered
    - Recent developments
    BGI
    - Business overview
    - Products/Services/Solutions offered.
    OTOGENETICS
    - Business overview
    - Products/Services/Solutions offered
    GENETECH
    - Business overview
    - Products/Services/Solutions offered
  • 13.2 OTHER PLAYERS
    OXY-GEN LABORATORY LLC
    - Business overview
    - Products/Services/Solutions offered
    MEDGENOME
    - Business overview
    - Products/Services/Solutions offered
    AMBRY GENETICS.
    - Business overview
    - Products/Services/Solutions offered
    ASPER BIOGENE
    - Business overview
    - Products/Services/Solutions offered
    LIFELABS GENETICS
    - Business overview
    - Products/Services/Solutions offered
    EASYDNA
    - Business overview
    - Products/Services/Solutions offered
    LIFECELL
    - Business overview
    - Products/Services/Solutions offered
    CNC PATH LAB
    - Business overview
    - Products/Services/Solutions offered
    SIGNATURE DIAGNOSTICS INC.
    - Business overview
    - Products/Services/Solutions offered
    MITERA
    - Business overview
    - Products/Services/Solutions offered
APPENDIX
217
  • 14.1 DISCUSSION GUIDE
  • 14.2 KNOWLEDGESTORE: MARKETSANDMARKETS’ SUBSCRIPTION PORTAL
  • 14.3 CUSTOMIZATION OPTIONS
  • 14.4 RELATED REPORTS
  • 14.5 AUTHOR DETAILS
LIST OF TABLES
 
  • TABLE 1 RISK ASSESSMENT: CARRIER SCREENING MARKET
  • TABLE 2 GLOBAL INCIDENCE RATE OF TRISOMY
  • TABLE 3 FERTILITY RATE (BIRTHS PER WOMAN), BY COUNTRY
  • TABLE 4 INDICATIVE PRICING OF CARRIER SCREENING PRODUCTS/SERVICES
  • TABLE 5 AVERAGE SELLING PRICE OF PREIMPLANTATION GENETIC TESTING SYSTEMS
  • TABLE 6 PORTER’S FIVE FORCES: CARRIER SCREENING MARKET
  • TABLE 7 ROLE IN ECOSYSTEM: CARRIER SCREENING MARKET
  • TABLE 8 INDICATIVE LIST OF REGULATORY AUTHORITIES GOVERNING CARRIER SCREENING MARKET
  • TABLE 9 DETAILED LIST OF KEY CONFERENCES & EVENTS, JANUARY 2024–DECEMBER 2025
  • TABLE 10 INFLUENCE OF STAKEHOLDERS ON BUYING PROCESS OF CARRIER SCREENING PRODUCTS (%)
  • TABLE 11 KEY BUYING CRITERIA FOR END USERS OF CARRIER SCREENING PRODUCTS/SERVICES
  • TABLE 12 IMPORT DATA FOR HS CODE 901849, BY COUNTRY, 2018–2022 (USD MILLION)
  • TABLE 13 EXPORT DATA FOR HS CODE 901849, BY COUNTRY, 2018–2022 (USD MILLION)
  • TABLE 14 CARRIER SCREENING MARKET, BY PRODUCT & SERVICE, 2021–2028 (USD MILLION)
  • TABLE 15 CARRIER SCREENING MARKET FOR SERVICES, BY REGION, 2021–2028 (USD MILLION)
  • TABLE 16 KEY PLAYERS PROVIDING CARRIER SCREENING PRODUCTS
  • TABLE 17 CARRIER SCREENING MARKET FOR PRODUCTS, BY REGION, 2021–2028 (USD MILLION)
  • TABLE 18 CARRIER SCREENING MARKET, BY TYPE, 2021–2028 (USD MILLION)
  • TABLE 19 CARRIER SCREENING MARKET FOR EXPANDED CARRIER SCREENING, BY TYPE, 2021–2028 (USD MILLION)
  • TABLE 20 CARRIER SCREENING MARKET FOR EXPANDED CARRIER SCREENING, BY REGION, 2021–2028 (USD MILLION)
  • TABLE 21 PREDESIGNED PANEL TESTING MARKET, BY REGION, 2021–2028 (USD MILLION)
  • TABLE 22 CUSTOMIZED PANEL TESTING MARKET, BY REGION, 2021–2028 (USD MILLION)
  • TABLE 23 CARRIER SCREENING MARKET FOR TARGETED DISEASE CARRIER SCREENING, BY REGION, 2021–2028 (USD MILLION)
  • TABLE 24 CARRIER SCREENING MARKET, BY MEDICAL CONDITION, 2021–2028 (USD MILLION)
  • TABLE 25 LIVE BIRTH INCIDENCE OF CYSTIC FIBROSIS
  • TABLE 26 CARRIER SCREENING PRODUCTS/SERVICES FOR CYSTIC FIBROSIS
  • TABLE 27 CARRIER SCREENING MARKET FOR PULMONARY CONDITIONS, BY REGION, 2021–2028 (USD MILLION)
  • TABLE 28 CARRIER SCREENING MARKET FOR HEMATOLOGICAL CONDITIONS, BY REGION, 2021–2028 (USD MILLION)
  • TABLE 29 GLOBAL PREVALENCE OF NEUROLOGICAL CONDITIONS
  • TABLE 30 CARRIER SCREENING PRODUCTS/SERVICES FOR NEUROLOGICAL CONDITIONS
  • TABLE 31 CARRIER SCREENING MARKET FOR NEUROLOGICAL CONDITIONS, BY REGION, 2021–2028 (USD MILLION)
  • TABLE 32 CARRIER SCREENING MARKET FOR OTHER MEDICAL CONDITIONS, BY REGION, 2021–2028 (USD MILLION)
  • TABLE 33 CARRIER SCREENING MARKET, BY TECHNOLOGY, 2021–2028 (USD MILLION)
  • TABLE 34 DNA SEQUENCING USED BY MARKET PLAYERS
  • TABLE 35 CARRIER SCREENING MARKET FOR DNA SEQUENCING, BY REGION, 2021–2028 (USD MILLION)
  • TABLE 36 PCR USED BY MARKET PLAYERS
  • TABLE 37 CARRIER SCREENING MARKET FOR PCR, BY REGION, 2021–2028 (USD MILLION)
  • TABLE 38 DNA MICROARRAYS USED BY MARKET PLAYERS
  • TABLE 39 CARRIER SCREENING MARKET FOR DNA MICROARRAYS, BY REGION, 2021–2028 (USD MILLION)
  • TABLE 40 ADVANTAGES OF OTHER TECHNOLOGIES FOR CARRIER SCREENING
  • TABLE 41 CARRIER SCREENING MARKET FOR OTHER TECHNOLOGIES, BY REGION, 2021–2028 (USD MILLION)
  • TABLE 42 CARRIER SCREENING MARKET, BY END USER, 2021–2028 (USD MILLION)
  • TABLE 43 CARRIER SCREENING MARKET FOR HOSPITALS AND MEDICAL CENTERS, BY REGION, 2021–2028 (USD MILLION)
  • TABLE 44 CARRIER SCREENING MARKET FOR CLINICAL LABORATORIES, BY REGION, 2021–2028 (USD MILLION)
  • TABLE 45 CARRIER SCREENING MARKET FOR FERTILITY CLINICS, BY REGION, 2021–2028 (USD MILLION)
  • TABLE 46 CARRIER SCREENING MARKET FOR OTHER END USERS, BY REGION, 2021–2028 (USD MILLION)
  • TABLE 47 CARRIER SCREENING MARKET, BY REGION, 2021–2028 (USD MILLION)
  • TABLE 48 NORTH AMERICA: CARRIER SCREENING MARKET, BY PRODUCT & SERVICE, 2021–2028 (USD MILLION)
  • TABLE 49 NORTH AMERICA: CARRIER SCREENING MARKET, BY TYPE, 2021–2028 (USD MILLION)
  • TABLE 50 NORTH AMERICA: CARRIER SCREENING MARKET FOR EXPANDED CARRIER SCREENING, BY TYPE, 2021–2028 (USD MILLION)
  • TABLE 51 NORTH AMERICA: CARRIER SCREENING MARKET, BY TECHNOLOGY, 2021–2028 (USD MILLION)
  • TABLE 52 NORTH AMERICA: CARRIER SCREENING MARKET, BY MEDICAL CONDITION, 2021–2028 (USD MILLION)
  • TABLE 53 NORTH AMERICA: CARRIER SCREENING MARKET, BY END USER, 2021–2028 (USD MILLION)
  • TABLE 54 NORTH AMERICA: CARRIER SCREENING MARKET, BY COUNTRY, 2021–2028 (USD MILLION)
  • TABLE 55 US: KEY MACROINDICATORS
  • TABLE 56 US: CARRIER SCREENING MARKET, BY PRODUCT & SERVICE, 2021–2028 (USD MILLION)
  • TABLE 57 US: CARRIER SCREENING MARKET, BY TYPE, 2021–2028 (USD MILLION)
  • TABLE 58 US: CARRIER SCREENING MARKET FOR EXPANDED CARRIER SCREENING, BY TYPE, 2021–2028 (USD MILLION)
  • TABLE 59 US: CARRIER SCREENING MARKET, BY TECHNOLOGY, 2021–2028 (USD MILLION)
  • TABLE 60 US: CARRIER SCREENING MARKET, BY MEDICAL CONDITION, 2021–2028 (USD MILLION)
  • TABLE 61 US: CARRIER SCREENING MARKET, BY END USER, 2021–2028 (USD MILLION)
  • TABLE 62 CANADA: KEY MACROINDICATORS
  • TABLE 63 CANADA: CARRIER SCREENING MARKET, BY PRODUCT & SERVICE, 2021–2028 (USD MILLION)
  • TABLE 64 CANADA: CARRIER SCREENING MARKET, BY TYPE, 2021–2028 (USD MILLION)
  • TABLE 65 CANADA: CARRIER SCREENING MARKET FOR EXPANDED CARRIER SCREENING, BY TYPE, 2021–2028 (USD MILLION)
  • TABLE 66 CANADA: CARRIER SCREENING MARKET, BY TECHNOLOGY, 2021–2028 (USD MILLION)
  • TABLE 67 CANADA: CARRIER SCREENING MARKET, BY MEDICAL CONDITION, 2021–2028 (USD MILLION)
  • TABLE 68 CANADA: CARRIER SCREENING MARKET, BY END USER, 2021–2028 (USD MILLION)
  • TABLE 69 EUROPE: HEALTHCARE EXPENDITURE, BY COUNTRY (% OF GDP)
  • TABLE 70 EUROPE: CARRIER SCREENING MARKET, BY COUNTRY, 2021–2028 (USD MILLION)
  • TABLE 71 EUROPE: CARRIER SCREENING MARKET, BY PRODUCT & SERVICE, 2021–2028 (USD MILLION)
  • TABLE 72 EUROPE: CARRIER SCREENING MARKET, BY TYPE, 2021–2028 (USD MILLION)
  • TABLE 73 EUROPE: CARRIER SCREENING MARKET FOR EXPANDED CARRIER SCREENING, BY TYPE, 2021–2028 (USD MILLION)
  • TABLE 74 EUROPE: CARRIER SCREENING MARKET, BY TECHNOLOGY, 2021–2028 (USD MILLION)
  • TABLE 75 EUROPE: CARRIER SCREENING MARKET, BY MEDICAL CONDITION, 2021–2028 (USD MILLION)
  • TABLE 76 EUROPE: CARRIER SCREENING MARKET, BY END USER, 2021–2028 (USD MILLION)
  • TABLE 77 GERMANY: KEY MACROINDICATORS
  • TABLE 78 GERMANY: CARRIER SCREENING MARKET, BY PRODUCT & SERVICE, 2021–2028 (USD MILLION)
  • TABLE 79 GERMANY: CARRIER SCREENING MARKET, BY TYPE, 2021–2028 (USD MILLION)
  • TABLE 80 GERMANY: CARRIER SCREENING MARKET FOR EXPANDED CARRIER SCREENING, BY TYPE, 2021–2028 (USD MILLION)
  • TABLE 81 GERMANY: CARRIER SCREENING MARKET, BY TECHNOLOGY, 2021–2028 (USD MILLION)
  • TABLE 82 GERMANY: CARRIER SCREENING MARKET, BY MEDICAL CONDITION, 2021–2028 (USD MILLION)
  • TABLE 83 GERMANY: CARRIER SCREENING MARKET, BY END USER, 2021–2028 (USD MILLION)
  • TABLE 84 UK: KEY MACROINDICATORS
  • TABLE 85 UK: CARRIER SCREENING MARKET, BY PRODUCT & SERVICE, 2021–2028 (USD MILLION)
  • TABLE 86 UK: CARRIER SCREENING MARKET, BY TYPE, 2021–2028 (USD MILLION)
  • TABLE 87 UK: CARRIER SCREENING MARKET FOR EXPANDED CARRIER SCREENING, BY TYPE, 2021–2028 (USD MILLION)
  • TABLE 88 UK: CARRIER SCREENING MARKET, BY TECHNOLOGY, 2021–2028 (USD MILLION)
  • TABLE 89 UK: CARRIER SCREENING MARKET, BY MEDICAL CONDITION, 2021–2028 (USD MILLION)
  • TABLE 90 UK: CARRIER SCREENING MARKET, BY END USER, 2021–2028 (USD MILLION)
  • TABLE 91 FRANCE: KEY MACROINDICATORS
  • TABLE 92 FRANCE: CARRIER SCREENING MARKET, BY PRODUCT & SERVICE, 2021–2028 (USD MILLION)
  • TABLE 93 FRANCE: CARRIER SCREENING MARKET, BY TYPE, 2021–2028 (USD MILLION)
  • TABLE 94 FRANCE: CARRIER SCREENING MARKET FOR EXPANDED CARRIER SCREENING, BY TYPE, 2021–2028 (USD MILLION)
  • TABLE 95 FRANCE: CARRIER SCREENING MARKET, BY TECHNOLOGY, 2021–2028 (USD MILLION)
  • TABLE 96 FRANCE: CARRIER SCREENING MARKET, BY MEDICAL CONDITION, 2021–2028 (USD MILLION)
  • TABLE 97 FRANCE: CARRIER SCREENING MARKET, BY END USER, 2021–2028 (USD MILLION)
  • TABLE 98 ITALY: CARRIER SCREENING MARKET, BY PRODUCT & SERVICE, 2021–2028 (USD MILLION)
  • TABLE 99 ITALY: CARRIER SCREENING MARKET, BY TYPE, 2021–2028 (USD MILLION)
  • TABLE 100 ITALY: CARRIER SCREENING MARKET FOR EXPANDED CARRIER SCREENING, BY TYPE, 2021–2028 (USD MILLION)
  • TABLE 101 ITALY: CARRIER SCREENING MARKET, BY TECHNOLOGY, 2021–2028 (USD MILLION)
  • TABLE 102 ITALY: CARRIER SCREENING MARKET, BY MEDICAL CONDITION, 2021–2028 (USD MILLION)
  • TABLE 103 ITALY: CARRIER SCREENING MARKET, BY END USER, 2021–2028 (USD MILLION)
  • TABLE 104 SPAIN: CARRIER SCREENING MARKET, BY PRODUCT & SERVICE, 2021–2028 (USD MILLION)
  • TABLE 105 SPAIN: CARRIER SCREENING MARKET, BY TYPE, 2021–2028 (USD MILLION)
  • TABLE 106 SPAIN: CARRIER SCREENING MARKET FOR EXPANDED CARRIER SCREENING, BY TYPE, 2021–2028 (USD MILLION)
  • TABLE 107 SPAIN: CARRIER SCREENING MARKET, BY TECHNOLOGY, 2021–2028 (USD MILLION)
  • TABLE 108 SPAIN: CARRIER SCREENING MARKET, BY MEDICAL CONDITION, 2021–2028 (USD MILLION)
  • TABLE 109 SPAIN: CARRIER SCREENING MARKET, BY END USER, 2021–2028 (USD MILLION)
  • TABLE 110 REST OF EUROPE: HEALTHCARE EXPENDITURE, BY COUNTRY, 2010 VS. 2021 (% OF GDP)
  • TABLE 111 REST OF EUROPE: CARRIER SCREENING MARKET, BY PRODUCT & SERVICE, 2021–2028 (USD MILLION)
  • TABLE 112 REST OF EUROPE: CARRIER SCREENING MARKET, BY TYPE, 2021–2028 (USD MILLION)
  • TABLE 113 REST OF EUROPE: CARRIER SCREENING MARKET FOR EXPANDED CARRIER SCREENING, BY TYPE, 2021–2028 (USD MILLION)
  • TABLE 114 REST OF EUROPE: CARRIER SCREENING MARKET, BY TECHNOLOGY, 2021–2028 (USD MILLION)
  • TABLE 115 REST OF EUROPE: CARRIER SCREENING MARKET, BY MEDICAL CONDITION, 2021–2028 (USD MILLION)
  • TABLE 116 REST OF EUROPE: CARRIER SCREENING MARKET, BY END USER, 2021–2028 (USD MILLION)
  • TABLE 117 ASIA PACIFIC: CARRIER SCREENING MARKET, BY PRODUCT & SERVICE, 2021–2028 (USD MILLION)
  • TABLE 118 ASIA PACIFIC: CARRIER SCREENING MARKET, BY TYPE, 2021–2028 (USD MILLION)
  • TABLE 119 ASIA PACIFIC: CARRIER SCREENING MARKET FOR EXPANDED CARRIER SCREENING, BY TYPE, 2021–2028 (USD MILLION)
  • TABLE 120 ASIA PACIFIC: CARRIER SCREENING MARKET, BY TECHNOLOGY, 2021–2028 (USD MILLION)
  • TABLE 121 ASIA PACIFIC: CARRIER SCREENING MARKET, BY MEDICAL CONDITION, 2021–2028 (USD MILLION)
  • TABLE 122 ASIA PACIFIC: CARRIER SCREENING MARKET, BY END USER, 2021–2028 (USD MILLION)
  • TABLE 123 INDIA: KEY MACROINDICATORS
  • TABLE 124 INDIA: CARRIER SCREENING MARKET, BY PRODUCT & SERVICE, 2021–2028 (USD MILLION)
  • TABLE 125 INDIA: CARRIER SCREENING MARKET, BY TYPE, 2021–2028 (USD MILLION)
  • TABLE 126 INDIA: CARRIER SCREENING MARKET FOR EXPANDED CARRIER SCREENING, BY TYPE, 2021–2028 (USD MILLION)
  • TABLE 127 INDIA: CARRIER SCREENING MARKET, BY TECHNOLOGY, 2021–2028 (USD MILLION)
  • TABLE 128 INDIA: CARRIER SCREENING MARKET, BY MEDICAL CONDITION, 2021–2028 (USD MILLION)
  • TABLE 129 INDIA: CARRIER SCREENING MARKET, BY END USER, 2021–2028 (USD MILLION)
  • TABLE 130 CHINA: KEY MACROINDICATORS
  • TABLE 131 CHINA: CARRIER SCREENING MARKET, BY PRODUCT & SERVICE, 2021–2028 (USD MILLION)
  • TABLE 132 CHINA: CARRIER SCREENING MARKET, BY TYPE, 2021–2028 (USD MILLION)
  • TABLE 133 CHINA: CARRIER SCREENING MARKET FOR EXPANDED CARRIER SCREENING, BY TYPE, 2021–2028 (USD MILLION)
  • TABLE 134 CHINA: CARRIER SCREENING MARKET, BY TECHNOLOGY, 2021–2028 (USD MILLION)
  • TABLE 135 CHINA: CARRIER SCREENING MARKET, BY MEDICAL CONDITION, 2021–2028 (USD MILLION)
  • TABLE 136 CHINA: CARRIER SCREENING MARKET, BY END USER, 2021–2028 (USD MILLION)
  • TABLE 137 JAPAN: KEY MACROINDICATORS
  • TABLE 138 JAPAN: CARRIER SCREENING MARKET, BY PRODUCT & SERVICE, 2021–2028 (USD MILLION)
  • TABLE 139 JAPAN: CARRIER SCREENING MARKET, BY TYPE, 2021–2028 (USD MILLION)
  • TABLE 140 JAPAN: CARRIER SCREENING MARKET FOR EXPANDED CARRIER SCREENING, BY TYPE, 2021–2028 (USD MILLION)
  • TABLE 141 JAPAN: CARRIER SCREENING MARKET, BY TECHNOLOGY, 2021–2028 (USD MILLION)
  • TABLE 142 JAPAN: CARRIER SCREENING MARKET, BY MEDICAL CONDITION, 2021–2028 (USD MILLION)
  • TABLE 143 JAPAN: CARRIER SCREENING MARKET, BY END USER, 2021–2028 (USD MILLION)
  • TABLE 144 REST OF ASIA PACIFIC: CARRIER SCREENING MARKET, BY PRODUCT & SERVICE, 2021–2028 (USD MILLION)
  • TABLE 145 REST OF ASIA PACIFIC: CARRIER SCREENING MARKET, BY TYPE, 2021–2028 (USD MILLION)
  • TABLE 146 REST OF ASIA PACIFIC: CARRIER SCREENING MARKET FOR EXPANDED CARRIER SCREENING, BY TYPE, 2021–2028 (USD MILLION)
  • TABLE 147 REST OF ASIA PACIFIC: CARRIER SCREENING MARKET, BY TECHNOLOGY, 2021–2028 (USD MILLION)
  • TABLE 148 REST OF ASIA PACIFIC: CARRIER SCREENING MARKET, BY MEDICAL CONDITION, 2021–2028 (USD MILLION)
  • TABLE 149 REST OF ASIA PACIFIC: CARRIER SCREENING MARKET, BY END USER, 2021–2028 (USD MILLION)
  • TABLE 150 REST OF THE WORLD: CARRIER SCREENING MARKET, BY PRODUCT & 2021–2028 (USD MILLION)
  • TABLE 151 REST OF THE WORLD: CARRIER SCREENING MARKET, BY TYPE, 2021–2028 (USD MILLION)
  • TABLE 152 REST OF THE WORLD: CARRIER SCREENING MARKET FOR EXPANDED CARRIER SCREENING, BY TYPE, 2021–2028 (USD MILLION)
  • TABLE 153 REST OF THE WORLD: CARRIER SCREENING MARKET, BY TECHNOLOGY, 2021–2028 (USD MILLION)
  • TABLE 154 REST OF THE WORLD: CARRIER SCREENING MARKET, BY MEDICAL CONDITION, 2021–2028 (USD MILLION)
  • TABLE 155 REST OF THE WORLD: CARRIER SCREENING MARKET, BY END USER, 2021–2028 (USD MILLION)
  • TABLE 156 DEFINITION OF RARE DISEASES IN VARIOUS COUNTRIES
  • TABLE 157 LATIN AMERICA: CARRIER SCREENING MARKET, BY PRODUCT & SERVICE, 2021–2028 (USD MILLION)
  • TABLE 158 LATIN AMERICA: CARRIER SCREENING MARKET, BY TYPE, 2021–2028 (USD MILLION)
  • TABLE 159 LATIN AMERICA: CARRIER SCREENING MARKET FOR EXPANDED CARRIER SCREENING, BY TYPE, 2021–2028 (USD MILLION)
  • TABLE 160 LATIN AMERICA: CARRIER SCREENING MARKET, BY TECHNOLOGY, 2021–2028 (USD MILLION)
  • TABLE 161 LATIN AMERICA: CARRIER SCREENING MARKET, BY MEDICAL CONDITION, 2021–2028 (USD MILLION)
  • TABLE 162 LATIN AMERICA: CARRIER SCREENING MARKET, BY END USER, 2021–2028 (USD MILLION)
  • TABLE 163 MIDDLE EAST & AFRICA: CARRIER SCREENING MARKET, BY PRODUCT & SERVICE, 2021–2028 (USD MILLION)
  • TABLE 164 MIDDLE EAST & AFRICA: CARRIER SCREENING MARKET, BY TYPE, 2021–2028 (USD MILLION)
  • TABLE 165 MIDDLE EAST & AFRICA: CARRIER SCREENING MARKET FOR EXPANDED CARRIER SCREENING, BY TYPE, 2021–2028 (USD MILLION)
  • TABLE 166 MIDDLE EAST & AFRICA: CARRIER SCREENING MARKET, BY TECHNOLOGY, 2021–2028 (USD MILLION)
  • TABLE 167 MIDDLE EAST & AFRICA: CARRIER SCREENING MARKET, BY MEDICAL CONDITION, 2021–2028 (USD MILLION)
  • TABLE 168 MIDDLE EAST & AFRICA: CARRIER SCREENING MARKET, BY END USER, 2021–2028 (USD MILLION)
  • TABLE 169 GCC COUNTRIES: CARRIER SCREENING MARKET, BY PRODUCT & SERVICE, 2021–2028 (USD MILLION)
  • TABLE 170 GCC COUNTRIES: CARRIER SCREENING MARKET, BY TYPE, 2021–2028 (USD MILLION)
  • TABLE 171 GCC COUNTRIES: CARRIER SCREENING MARKET FOR EXPANDED CARRIER SCREENING, BY TYPE, 2021–2028 (USD MILLION)
  • TABLE 172 GCC COUNTRIES: CARRIER SCREENING MARKET, BY TECHNOLOGY, 2021–2028 (USD MILLION)
  • TABLE 173 GCC COUNTRIES: CARRIER SCREENING MARKET, BY MEDICAL CONDITION, 2021–2028 (USD MILLION)
  • TABLE 174 GCC COUNTRIES: CARRIER SCREENING MARKET, BY END USER, 2021–2028 (USD MILLION)
  • TABLE 175 OVERVIEW OF STRATEGIES ADOPTED BY KEY PLAYERS IN CARRIER SCREENING MARKET
  • TABLE 176 DEGREE OF COMPETITION: CARRIER SCREENING MARKET
  • TABLE 177 OVERALL COMPANY FOOTPRINT
  • TABLE 178 PRODUCT FOOTPRINT
  • TABLE 179 REGIONAL FOOTPRINT
  • TABLE 180 DETAILED LIST OF KEY START-UPS/SMES IN CARRIER SCREENING MARKET
  • TABLE 181 KEY DEALS, JANUARY 2020–DECEMBER 2023
  • TABLE 182 NATERA, INC.: COMPANY OVERVIEW
  • TABLE 183 QUEST DIAGNOSTICS INCORPORATED: COMPANY OVERVIEW
  • TABLE 184 FULGENT GENETICS: COMPANY OVERVIEW
  • TABLE 185 INVITAE CORPORATION: COMPANY OVERVIEW
  • TABLE 186 EUROFINS SCIENTIFIC: COMPANY OVERVIEW
  • TABLE 187 OPKO HEALTH, INC.: COMPANY OVERVIEW
  • TABLE 188 THERMO FISHER SCIENTIFIC INC.: COMPANY OVERVIEW
  • TABLE 189 MYRIAD GENETICS, INC.: COMPANY OVERVIEW
  • TABLE 190 ILLUMINA, INC.: COMPANY OVERVIEW
  • TABLE 191 LABORATORY CORPORATION OF AMERICA HOLDINGS: COMPANY OVERVIEW
  • TABLE 192 CENTOGENE N.V.: COMPANY OVERVIEW
  • TABLE 193 DIASORIN S.P.A.: COMPANY OVERVIEW
  • TABLE 194 BGI: COMPANY OVERVIEW
  • TABLE 195 OTOGENETICS: COMPANY OVERVIEW
  • TABLE 196 GENETECH: COMPANY OVERVIEW
  • TABLE 197 OXY-GEN LABORATORY LLC: COMPANY OVERVIEW
  • TABLE 198 MEDGENOME: COMPANY OVERVIEW
  • TABLE 199 AMBRY GENETICS: COMPANY OVERVIEW
  • TABLE 200 ASPER BIOGENE: COMPANY OVERVIEW
  • TABLE 201 LIFELABS GENETICS: COMPANY OVERVIEW
  • TABLE 202 EASYDNA: COMPANY OVERVIEW
  • TABLE 203 LIFECELL: COMPANY OVERVIEW
  • TABLE 204 CNC PATH LAB: COMPANY OVERVIEW
  • TABLE 205 SIGNATURE DIAGNOSTICS INC.: COMPANY OVERVIEW
  • TABLE 206 MITERA: COMPANY OVERVIEW
LIST OF FIGURES
 
  • FIGURE 1 RESEARCH DESIGN
  • FIGURE 2 KEY SECONDARY SOURCES
  • FIGURE 3 PRIMARY SOURCES
  • FIGURE 4 BREAKDOWN OF PRIMARY INTERVIEWS: SUPPLY-SIDE AND DEMAND-SIDE PARTICIPANTS
  • FIGURE 5 BREAKDOWN OF PRIMARY INTERVIEWS: BY COMPANY TYPE, DESIGNATION, AND REGION
  • FIGURE 6 MARKET SIZE ESTIMATION: BOTTOM-UP APPROACH
  • FIGURE 7 MARKET SIZE ESTIMATION: CARRIER SCREENING MARKET
  • FIGURE 8 CAGR PROJECTION: SUPPLY-SIDE ANALYSIS
  • FIGURE 9 TOP-DOWN APPROACH
  • FIGURE 10 DATA TRIANGULATION METHODOLOGY
  • FIGURE 11 CARRIER SCREENING MARKET, BY PRODUCT & SERVICE, 2023 VS. 2028 (USD MILLION)
  • FIGURE 12 CARRIER SCREENING MARKET, BY TYPE, 2023 VS. 2028 (USD MILLION)
  • FIGURE 13 CARRIER SCREENING MARKET, BY MEDICAL CONDITION, 2023 VS. 2028 (USD MILLION)
  • FIGURE 14 CARRIER SCREENING MARKET, BY TECHNOLOGY, 2023 VS. 2028 (USD MILLION)
  • FIGURE 15 CARRIER SCREENING MARKET, BY END USER, 2023 VS. 2028 (USD MILLION)
  • FIGURE 16 CARRIER SCREENING MARKET, BY REGION, 2023 VS. 2028 (USD MILLION)
  • FIGURE 17 GROWING PREVALENCE OF GENETIC DISORDERS TO DRIVE MARKET
  • FIGURE 18 PREDESIGNED PANEL TESTING SEGMENT TO REGISTER HIGHEST GROWTH DURING FORECAST PERIOD
  • FIGURE 19 US AND PRODUCTS TO DOMINATE NORTH AMERICAN CARRIER SCREENING MARKET IN 2023
  • FIGURE 20 US TO REGISTER HIGHEST GROWTH RATE DURING STUDY PERIOD
  • FIGURE 21 DRIVERS, RESTRAINTS, OPPORTUNITIES, AND CHALLENGES: CARRIER SCREENING MARKET
  • FIGURE 22 HEALTHCARE EXPENDITURE PER CAPITA IN BRICS, 2012–2020
  • FIGURE 23 VALUE CHAIN ANALYSIS: MAJOR VALUE ADDED DURING MANUFACTURING AND ASSEMBLY PHASES
  • FIGURE 24 SUPPLY CHAIN ANALYSIS: DIRECT DISTRIBUTION TO BE PREFERRED STRATEGY FOR PROMINENT COMPANIES
  • FIGURE 25 ECOSYSTEM/MARKET MAP: CARRIER SCREENING MARKET
  • FIGURE 26 KEY PLAYERS IN CARRIER SCREENING MARKET
  • FIGURE 27 PATENT TRENDS FOR CARRIER SCREENING, JANUARY 2013–DECEMBER 2023
  • FIGURE 28 TOP APPLICANTS AND OWNERS (COMPANIES/INSTITUTIONS) FOR CARRIER SCREENING PATENTS, JANUARY 2013– DECEMBER 2023
  • FIGURE 29 REVENUE SHIFT FOR CARRIER SCREENING PRODUCTS/SERVICES
  • FIGURE 30 INFLUENCE OF STAKEHOLDERS ON BUYING PROCESS OF CARRIER SCREENING PRODUCTS
  • FIGURE 31 KEY BUYING CRITERIA FOR END USERS OF CARRIER SCREENING PRODUCTS/SERVICES
  • FIGURE 32 NORTH AMERICA: CARRIER SCREENING MARKET SNAPSHOT
  • FIGURE 33 ASIA PACIFIC: CARRIER SCREENING MARKET SNAPSHOT
  • FIGURE 34 REVENUE SHARE ANALYSIS OF KEY PLAYERS
  • FIGURE 35 COMPANY EVALUATION MATRIX, 2022
  • FIGURE 36 START-UP/SME EVALUATION MATRIX, 2022
  • FIGURE 37 NATERA, INC.: COMPANY SNAPSHOT (2022)
  • FIGURE 38 QUEST DIAGNOSTICS INCORPORATED: COMPANY SNAPSHOT (2022)
  • FIGURE 39 FULGENT GENETICS.: COMPANY SNAPSHOT (2022)
  • FIGURE 40 INVITAE CORPORATION.: COMPANY SNAPSHOT (2022)
  • FIGURE 41 EUROFINS SCIENTIFIC: COMPANY SNAPSHOT (2022)
  • FIGURE 42 OPKO HEALTH, INC.: COMPANY SNAPSHOT (2022)
  • FIGURE 43 THERMO FISHER SCIENTIFIC INC.: COMPANY SNAPSHOT (2022)
  • FIGURE 44 MYRIAD GENETICS, INC.: COMPANY SNAPSHOT (2022)
  • FIGURE 45 ILLUMINA, INC.: COMPANY SNAPSHOT (2022)
  • FIGURE 46 LABORATORY CORPORATION OF AMERICA HOLDINGS: COMPANY SNAPSHOT (2022)
  • FIGURE 47 CENTOGENE N.V.: COMPANY SNAPSHOT (2022)
  • FIGURE 48 DIASORIN S.P.A.: COMPANY SNAPSHOT (2023)

The study involved four major activities in estimating the current size of the Carrier Screening Market. Exhaustive secondary research was done to collect information on the market and its different subsegments. The next step was to validate these findings, assumptions, and sizing with industry experts across the value chain through primary research. Both top-down and bottom-up approaches were employed to estimate the complete market size. After that, market breakdown and data triangulation procedures were used to estimate the market size of the segments and subsegments.

Secondary Research

In the secondary research process, various secondary sources such as annual reports, press releases & investor presentations of companies, white papers, certified publications, articles by recognized authors, gold-standard & silver-standard websites, regulatory bodies, and databases (such as D&B Hoovers, Bloomberg Business, and Factiva) were referred to identify and collect information for this study.

Primary Research

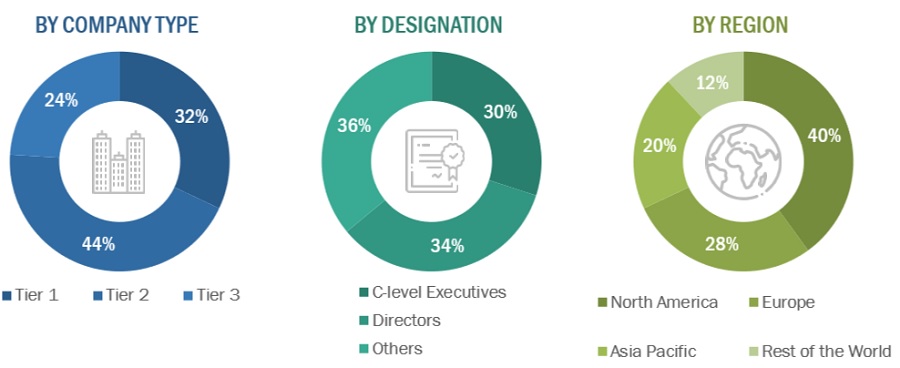
Extensive primary research was conducted after acquiring knowledge about the global market scenario through secondary research. Primary interviews were conducted from both the demand (Doctors, Surgeons, Gynecologist, genetic consultant) and supply sides (Carrier Screening product/service providers and distributors).

The following is a breakdown of the primary respondents:

Breakdown of Primary Participants:
Carrier Screening Market  Size, and Share

Note 1: Others include sales managers, marketing managers, and product managers.

Note 2. Tiers of companies are defined based on their total revenue. As of 2021: Tier 1 = >USD 5 billion, Tier 2 = USD 500 million to USD 5 billion, and Tier 3 = <USD 500 million.

To know about the assumptions considered for the study, download the pdf brochure

Market Size Estimation

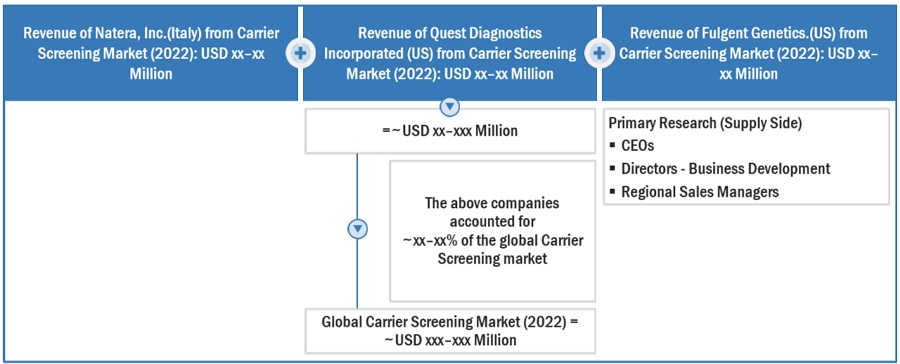
Both top-down and bottom-up approaches were used to estimate and validate the total size of the Carrier Screening Market. These methods were also used extensively to estimate the size of various subsegments in the market. The research methodology used to estimate the market size includes the following:

  • The key players in the industry and markets have been identified through extensive secondary research
  • The industry’s supply chain and market size, in terms of value, have been determined through primary and secondary research processes
  • All percentage shares, splits, and breakdowns have been determined using secondary sources and verified through primary sources
Carrier Screening Market  Size, and Share

To know about the assumptions considered for the study, Request for Free Sample Report

Carrier Screening Market  Size, and Share

Data Triangulation

After arriving at the overall market size—using the market size estimation processes—the market was split into several segments and subsegments. To complete the overall market engineering process and arrive at the exact statistics of each market segment and subsegment, the data triangulation, and market breakdown procedures were employed, wherever applicable. The data was triangulated by studying various factors and trends from both the demand and supply sides in the Carrier Screening Market industry.

Market Definition

Carrier screening is a type of genetic testing that is used to determine if a person is a carrier for a specific autosomal recessive disease. Similarly, when it is done before or during pregnancy, it allows to find out the chances of having a child with a genetic disorder. Carrier screening involves testing a sample of blood, saliva, or tissue from the inside of the cheek.

Market Stakeholders

  • Carrier screening product manufacturers, vendors, and distributors
  • Carrier screening service companies
  • Hospitals and private physician clinics
  • Reference laboratories
  • Donor banks
  • Health insurance payers
  • Research & consulting firms
  • Diagnostic Centers, and Medical Colleges
  • Research Institutes
  • Clinical Laboratories
  • Distributors of Carrier Screening Products and services

Report Objectives

  • To define, describe, and forecast the global Carrier Screening Market based on Product & Service, Type, Medical Condition, Technology, End User, and Region
  • To provide detailed information regarding the major factors influencing the growth of the market (drivers, opportunities, and industry-specific challenges)  
  • To strategically analyze micromarkets1 with respect to individual growth trends, future prospects, and contributions to the total market
  • To analyze opportunities in the market for stakeholders and provide details of the competitive landscape for market leaders
  • To forecast the size of market segments with respect to four main regions—North America, Europe, Asia Pacific and the Rest of the World (RoW)2
  • To strategically profile key players and comprehensively analyze their product portfolios, market shares, and core competencies
  • To track and analyze competitive developments such as acquisitions, expansions, new product launches, and partnerships in the Carrier Screening Market.

Available Customizations:

With the given market data, MarketsandMarkets offers customizations as per the company’s specific needs. The following customization options are available for the report:

  • Product Analysis: Product matrix, which gives a detailed comparison of the product portfolios of each company
  • Geographic Analysis:  Further breakdown of the European Carrier Screening Market into specific countries.  
Custom Market Research Services

We will customize the research for you, in case the report listed above does not meet with your exact requirements. Our custom research will comprehensively cover the business information you require to help you arrive at strategic and profitable business decisions.

Request Customization

Instant Answers with GPT - Ask Now!

Ask real questions. Get complete answers !
Report Code
MD 7435
Published ON
Jan, 2024
Choose License Type
BUY NOW
  • SHARE
X
Request Customization
Speak to Analyst
Speak to Analyst
OR FACE-TO-FACE MEETING
PERSONALIZE THIS RESEARCH
  • Triangulate with your Own Data
  • Get Data as per your Format and Definition
  • Gain a Deeper Dive on a Specific Application, Geography, Customer or Competitor
  • Any level of Personalization
REQUEST A FREE CUSTOMIZATION
LET US HELP YOU!
  • What are the Known and Unknown Adjacencies Impacting the Carrier Screening Market
  • What will your New Revenue Sources be?
  • Who will be your Top Customer; what will make them switch?
  • Defend your Market Share or Win Competitors
  • Get a Scorecard for Target Partners
CUSTOMIZED WORKSHOP REQUEST
knowledgestore logo

Want to explore hidden markets that can drive new revenue in Carrier Screening Market?

Find Hidden Markets
  • Call Us
  • +1-888-600-6441 (Corporate office hours)
  • +1-888-600-6441 (US/Can toll free)
  • +44-800-368-9399 (UK office hours)
CONNECT WITH US
ABOUT TRUST ONLINE
©2024 MarketsandMarkets Research Private Ltd. All rights reserved
DMCA.com Protection Status
Website Feedback