Bromine Market by Derivative (Organobromine, Clear Brine Fluids and Hydrogen Bromide), Application (Flame Retardant, PTA Synthesis, Oil & Gas Drilling, Water Treatment & Biocides, HBR Flow Battery, Pesticides), End-User & Region - Global Forecast to 2029
The bromine market is projected to grow from USD 2.6 billion in 2024 to USD 3.3 billion by 2029, at a CAGR of 4.6% from 2024 to 2029. Continuous research and development efforts lead to innovative bromine-based products with enhanced properties and applications. Advancements in bromine extraction techniques, synthesis methods, and formulation technologies are expanding the market opportunities for bromine across industries. This technological progress is contributing to the overall growth of the bromine market.
Attractive Opportunities in the Bromine Market
To know about the assumptions considered for the study, Request for Free Sample Report
Bromine Market Dynamics
Driver: Use of bromine compound to mitigate mercury emission
The use of bromine compounds to mitigate mercury emissions is a significant driver of the bromine market. Bromine compounds, such as brominated activated carbon, are utilized in flue gas treatment processes to capture and remove mercury emissions from industrial sources, particularly coal-fired power plants. These compounds chemically react with elemental mercury, forming stable complexes that can be easily captured and removed from the flue gas stream. With increasing regulatory pressure to reduce mercury emissions due to environmental and health concerns, the demand for bromine compounds as effective mercury control agents is growing, thereby driving the expansion of the bromine market.
Restraint: Toxicological effects of brominated compounds
The toxicological effects of bromine compounds significantly restrain the bromine market. Bromine compounds, particularly certain brominated flame retardants, have been associated with adverse health effects such as developmental and reproductive toxicity, endocrine disruption, and neurotoxicity. Concerns regarding the environmental persistence and bioaccumulation of bromine compounds further exacerbate these health risks. Consequently, stringent regulations and bans on using certain bromine compounds in consumer products and growing awareness among consumers about the potential hazards limit the market growth of bromine-based products. Manufacturers are increasingly under pressure to develop safer alternatives to bromine compounds, thereby challenging the growth prospects of the bromine market.
Opportunity: Recycling of bromine products
The recycling of bromine products presents a significant opportunity for the bromine market. Bromine-containing products, such as flame retardants used in electronics, textiles, and construction materials, often end up in waste streams at the end of their lifecycle. However, advancements in recycling technologies have enabled the recovery and reuse of bromine from these waste streams, reducing the need for virgin bromine production and minimizing environmental impact. By promoting circular economy principles and resource efficiency, bromine recycling conserves valuable resources and mitigates potential ecological and health risks associated with bromine disposal. This presents a promising avenue for the bromine market to capitalize on sustainable practices and meet the growing demand for environmentally responsible solutions.
Challenge: Significant fluctuations in oil gas pricing
Significant fluctuations in oil prices present challenges for the bromine market. Oil and natural gas are key raw materials for bromine production, and price fluctuations can impact the cost structure of bromine production. When oil prices are high, the cost of extracting bromine from brine wells or seawater increases, leading to higher production costs for bromine and its derivatives. Conversely, during periods of low oil prices, the profitability of bromine producers may be affected due to reduced demand for alternative energy sources such as shale oil and gas, resulting in lower investment in bromine production facilities. Additionally, volatility in oil prices can disrupt supply chains and logistics, leading to uncertainties in the availability and pricing of bromine products. Therefore, the bromine market faces challenges in managing the impact of oil price fluctuations on production costs, profitability, and market stability.
Bromine Market : Ecosystem
Based on the derivative, the organobromine segment will hold the most significant share during the forecast period.
Based on derivative, the organobromine segment held the largest share in 2023. Organobromine compounds find widespread applications across various industries, including pharmaceuticals, agrochemicals, flame retardants, and water treatment. In the pharmaceutical sector, organobromine compounds synthesize active pharmaceutical ingredients (APIs) for drugs treating conditions such as cancer, epilepsy, and psychiatric disorders. Additionally, these compounds play a crucial role in agrochemical formulations, acting as pesticides, herbicides, and fungicides, contributing to agricultural productivity and crop protection. The versatility of organobromine compounds in different industries underscores their significance in driving market growth.
Based on application, flame retardant is expected to be the largest bromine market segment during the forecast period.
In 2023, the flame retardant segment held the most significant portion of the bromine market by application. The construction industry is a major consumer of bromine-based flame retardants, particularly in products like insulation materials, coatings, and foams. As urbanization and infrastructure development projects continue to expand globally, especially in emerging economies, the demand for flame retardants to enhance fire safety in buildings and structures is increasing, thereby driving the growth of the bromine market.
Asia Pacific is projected to hold the most significant market share during the forecast period.
Asia Pacific accounted for the most significant global bromine market share in 2023. Bromine finds diverse applications in different sectors. In the pharmaceutical industry, it is used to produce various drugs, especially sedatives and antiseptics. In the oil and gas sector, bromine compounds are utilized for drilling fluids and completion fluids. Bromine-based flame retardants are also extensively employed in electronics, construction materials, and automotive components.
To know about the assumptions considered for the study, download the pdf brochure
Key Market Players
ICL Group Ltd. (Israel), Albemarle Corporation (US), LANXESS AG (Germany), Tosoh Corporation (Japan), TETRA Technologies, Inc. (US), TATA Chemicals Ltd. (India), Hindustan Salts Ltd. (India), Honeywell International Inc. (US), Gulf Resources, Inc. (China), Agrocel Industries Pvt Ltd. (India), Satyesh Brinechem Pvt. Ltd. (India) are one of the major players in the global bromine market. These players have been focusing on expansion, acquisition, and agreement strategies that help them expand their businesses in untapped and potential markets. They have adopted various organic and inorganic growth strategies to enhance their position in the bromine market.
Want to explore hidden markets that can drive new revenue in Bromine Market?
Scope of the Report:
Want to explore hidden markets that can drive new revenue in Bromine Market?
Report Metric |
Details |
Market Size Available for Years |
2019 to 2029 |
Base Year Considered |
2023 |
Forecast Period |
2024–2029 |
Forecast Units |
Value (USD Million/Billion), Volume (Kiloton) |
Segments Covered |
Derivative, Application, and Region |
Geographies Covered |
North America, Western Europe, Eastern & Central Europe, Asia Pacific, South America, and Middle East & Africa |
Companies Covered |
ICL Group Ltd. (Israel), Albemarle Corporation (US), LANXESS AG (Germany), Tosoh Corporation (Japan), TETRA Technologies, Inc. (US), TATA Chemicals Ltd. (India), Hindustan Salts Ltd. (India), Honeywell International Inc. (US), Gulf Resources, Inc. (China), Agrocel Industries Pvt Ltd. (India), Satyesh Brinechem Pvt. Ltd. (India) and others. |
This research report categorizes the bromine market based on derivative, application, and region and forecasts revenues and analyzes trends in each submarket.
Based on derivative, the bromine market is segmented into:
- Organobromine
- Clear Brine Fluid
- Hydrogen Bromide
Based on application, the bromine market is segmented into:
- Flame Retardants
- Oil & Gas drilling
- PTA Synthesis
- Water Treatment & Biocides
- Mercury Emission Control
- Pesticides
- HBr Flow Batteries
- Plasma Etching
- Pharmaceuticals
- Butyl Rubber
- Others
Based on the region, the bromine market has been segmented as follows:
-
North America
- US
- Canada
- Mexico
-
Western Europe
- Germany
- UK
- France
- Rest of Western Europe
-
Eastern & Central Europe
- Russia
- Turkey
- Rest of Eastern & Central Europe
-
Asia Pacific
- China
- India
- Japan
- South Korea
- Taiwan
- Rest of Asia Pacific
-
South America
- Brazil
- Argentina
- Rest of South America
-
Middle East & Africa
-
GCC Countries
- UAE
- Saudi Arabia
- Rest of GCC
- South Africa
- Rest of the Middle East & Africa
-
GCC Countries
Recent Developments
- In January 2023, ICL Group Limited launched a new product, BromoQuel, a bromine neutralization system. Its main component is an extinguisher comprising a custom-made bromine complexing agent formulation solution that can treat liquids and gases.
- In July 2019, LANXESS developed Emerald Innovation 3000 as a flame retardant for expanded (EPS) and extruded (XPS) polystyrene instead of hexabromocyclododecane (HBCD). Emerald Innovation 3000 is mainly used as a flame retardant in electronics and electrical applications. This product, manufactured via bromination of an alternating polystyrene butadiene copolymer, decreases the use of hexabromocyclododecane (HBCD), which is hazardous for health.
- In August 2022, TETRA Technologies, Inc. partnered with KMX Technologies LLC and Hyrec Holdings Company W.L.L. to recycle produced water for beneficial reuse, including agricultural and crop irrigation, industrial, power generation, construction, groundwater recharge, cooling towers, and dust control applications.
Frequently Asked Questions (FAQ):
What is the key driver and opportunity for the bromine market?
Increasing demand for flame retardants in electronics, consumer goods, and textile industries and increasing use of bromine in flow batteries are the primary drivers and opportunities.
Which region is expected to hold the highest market share in the bromine market?
The bromine market in the Asia Pacific is expected to dominate the market share in 2029 due to rapid development and investment in the construction sector.
What application of bromine accounts for a significant share?
Flame retardant accounts for a significant share of the bromine market.
Who are the primary producers of bromine?
The key manufacturers operating in the market are ICL Group Ltd. (Israel), Albemarle Corporation (US), LANXESS AG (Germany), Tosoh Corporation (Japan), and TETRA Technologies, Inc. (US).
What total CAGR is expected for the bromine from 2024 to 2029?
The market is expected to record a CAGR of 4.6% from 2024-2029 in terms of value. .
Which industries are driving the growth of the Bromine Market in the U.S.?
Key industries include construction (due to fire safety regulations), electronics (flame retardants in circuit boards), agriculture (pesticides and fumigants), and pharmaceuticals (medicinal compounds).
How is bromine produced in the UK?
Bromine is typically extracted from natural sources such as seawater, brine wells, or salt deposits, with processing plants extracting bromine through chemical reactions or distillation.
What challenges does the bromine market face?
Environmental regulations concerning bromine production and usage, Health risks associated with exposure to bromine compounds, which can cause skin irritation and respiratory issues.
What role does technological advancement play in the bromine market?
Technological advancements are enhancing production efficiency and enabling new applications for bromine, particularly in high-tech industries like electronics and renewable energy.
To speak to our analyst for a discussion on the above findings, click Speak to Analyst
Exclusive indicates content/data unique to MarketsandMarkets and not available with any competitors.
- 5.1 INTRODUCTION
-
5.2 MARKET DYNAMICSDRIVERS- Increasing use of bromine compounds to mitigate mercury emission- Growing demand for flame retardants in electronics, consumer goods, and textile industries- Extensive use of bromine and its derivatives in diverse applications- Increased use of bromine as disinfectantsRESTRAINTS- Toxicological effects of brominated compounds- Emergence of non-halogenated flame retardants- Restriction on brominated flame retardants by European UnionOPPORTUNITIES- Recycling of bromine products- Increasing use of bromine in flow batteriesCHALLENGES- Significant fluctuations in oil & gas prices
-
5.3 PORTER’S FIVE FORCES ANALYSISBARGAINING POWER OF SUPPLIERSTHREAT OF NEW ENTRANTSTHREAT OF SUBSTITUTESBARGAINING POWER OF BUYERSINTENSITY OF COMPETITIVE RIVALRY
-
6.1 CASE STUDY ANALYSISBROMINE USE AND RECYCLING- Objective- Solution statementIMPACT OF BROMINATED FLAME RETARDANTS ON RECYCLING OF WASTE PLASTICS IN EUROPE- Objective- Solution statementEFFECT OF AMMONIUM BROMIDE ON FLAME RETARDANCY IN COTTON FABRIC- Objective- Solution statement
- 6.2 KEY CONFERENCES AND EVENTS, 2024–2025
-
6.3 LAUNCH STRATEGIES FOR VARIOUS PRODUCT VOLUMESLAUNCH STRATEGIES FOR PRODUCT VOLUMES OF BROMINEDISRUPTION IN BROMINE SUPPLY-DEMAND EQUILIBRIUM- Bromine oversupply scenario: Excess production resulted in declining prices- Bromine supply-crunch scenario: Facility closures in China led to elevated bromine prices
-
6.4 AVERAGE SELLING PRICE ANALYSISAVERAGE SELLING PRICE TREND OF KEY PLAYERS
-
6.5 BROMINATED FLAME RETARDANTS: OVERVIEWINTRODUCTIONBROMINATED FLAME RETARDANTS
- 6.6 VALUE CHAIN ANALYSIS
- 6.7 TRENDS AND DISRUPTIONS IMPACTING CUSTOMERS’ BUSINESSES
-
6.8 TECHNOLOGY ANALYSISKEY TECHNOLOGYCOMPLEMENTARY TECHNOLOGYADJACENT TECHNOLOGY
- 6.9 ECOSYSTEM/MARKET MAP
-
6.10 REGULATORY LANDSCAPEREGULATORY BODIES, GOVERNMENT AGENCIES, AND OTHER ORGANIZATIONS
-
6.11 PATENT ANALYSISLIST OF MAJOR PATENTS
-
6.12 KEY STAKEHOLDERS AND BUYING CRITERIAKEY STAKEHOLDERS IN BUYING PROCESSBUYING CRITERIA
- 6.13 INVESTMENT AND FUNDING SCENARIO
- 7.1 INTRODUCTION
-
7.2 ORGANOBROMINESINCREASING USE IN FLAME RETARDANTS AND BIOCIDES TO DRIVE MARKET
-
7.3 CLEAR BRINE FLUIDSEXTENSIVE USE FOR OIL EXPLORATION TO DRIVE MARKET
-
7.4 HYDROGEN BROMIDEWIDE USE IN CHEMICAL, PLASTICS, AND PHARMACEUTICAL INDUSTRIES TO DRIVE MARKET
- 8.1 INTRODUCTION
-
8.2 OIL & GASDEMAND FOR CLEAR BRINE FLUIDS TO DRIVE MARKET
-
8.3 AUTOMOTIVEINCREASING USE OF HYDROGEN BROMIDE IN ELECTRIC VEHICLES TO FUEL MARKET
-
8.4 ELECTRICAL & ELECTRONICSBROMINE TO INCREASE FIRE RESISTANCE IN ELECTRICAL AND ELECTRONIC COMPONENTS
-
8.5 AGRICULTUREUSE OF BROMINE COMPOUNDS IN PESTICIDES TO DRIVE MARKET
-
8.6 PHARMACEUTICALBROMINE TO BE USED AS CATALYST IN PHARMACEUTICAL PRODUCTS
-
8.7 COSMETICSBROMINE DERIVATIVES TO INCREASE SHELF LIFE OF COSMETICS
-
8.8 TEXTILEREDUCED FLAMMABILITY IN TEXTILE FIBERS TO DRIVE MARKET
- 8.9 OTHERS
- 9.1 INTRODUCTION
-
9.2 FLAME RETARDANTSFLAME RETARDANTS TO REDUCE FIRE DAMAGE
-
9.3 WATER TREATMENT & BIOCIDESORGANOBROMINES USED AS BIOCIDES IN WATER TREATMENT TO DRIVE MARKET
-
9.4 MERCURY EMISSION CONTROLBROMINATED COMPOUNDS TO CONTROL MERCURY EMISSION AT COAL-FIRED POWER PLANTS
-
9.5 OIL & GAS DRILLINGCLEAR BRINE FLUIDS TO BE EFFECTIVE IN OIL & GAS DRILLING OPERATIONS
-
9.6 HYDROGEN BROMIDE FLOW BATTERIESHYDROGEN BROMIDE TO BE USED IN LOW-COST ENERGY STORAGE DEVICES
-
9.7 PTA SYNTHESISHYDROGEN BROMIDE TO CATALYZE PTA SYNTHESIS
-
9.8 PESTICIDESINCREASING USE OF METHYL BROMIDE IN PEST CONTROL TO DRIVE MARKET
-
9.9 PLASMA ETCHINGUSE OF HYDROGEN BROMIDE FOR PLASMA ETCHING
-
9.10 PHARMACEUTICALSWIDE USE IN PHARMACEUTICAL AND MEDICINAL PREPARATIONS TO DRIVE MARKET
-
9.11 BUTYL RUBBERCHEMICAL RESISTANCE TO INCREASE DEMAND IN BUTYL RUBBER PRODUCTION
- 9.12 OTHER APPLICATIONS
- 10.1 INTRODUCTION
-
10.2 ASIA PACIFICRECESSION IMPACT ON ASIA PACIFICCHINA- Growth of electrical and electronics industry to fuel demandJAPAN- Automotive and electronics industries to fuel demandINDIA- Rising demand from flame retardants, pesticides, and water treatment applications to fuel marketSOUTH KOREA- Rapidly growing electronics industry to drive marketTAIWAN- Growing demand for flame retardants to drive marketREST OF ASIA PACIFIC
-
10.3 NORTH AMERICARECESSION IMPACT ON NORTH AMERICAUS- Stringent environmental policies to reduce mercury emissionsCANADA- Shale gas recovery to drive marketMEXICO- Growing demand from flame retardants segment to fuel market
-
10.4 WESTERN EUROPERECESSION IMPACT ON WESTERN EUROPEGERMANY- Rising demand from automotive sector to fuel marketFRANCE- Growth in agriculture industry to increase demand for bromineUK- Rise in pharmaceutical industry to propel marketREST OF WESTERN EUROPE
-
10.5 CENTRAL & EASTERN EUROPERECESSION IMPACT ON CENTRAL & EASTERN EUROPERUSSIA- Oil & gas drilling to be major application of bromineTURKEY- Increasing demand for flame retardants to fuel marketREST OF CENTRAL & EASTERN EUROPE
-
10.6 MIDDLE EAST & AFRICARECESSION IMPACT ON MIDDLE EAST & AFRICAGCC COUNTRIESSAUDI ARABIA- Large oil reserves to drive oil & gas drilling segmentUAE- Growth of petroleum industry to propel marketREST OF GCC COUNTRIES- Ongoing construction projects generating demand for insulation products to drive marketSOUTH AFRICA- Rising urban development to fuel marketREST OF MIDDLE EAST & AFRICA
-
10.7 SOUTH AMERICARECESSION IMPACT ON SOUTH AMERICABRAZIL- Extensive use of bromine in manufacturing consumer products to drive marketARGENTINA- Rising environmental concerns to affect marketREST OF SOUTH AMERICA
- 11.1 INTRODUCTION
-
11.2 STRATEGIES ADOPTED BY KEY PLAYERSOVERVIEW OF STRATEGIES ADOPTED BY BROMINE MANUFACTURERS
-
11.3 REVENUE ANALYSIS OF TOP FIVE MARKET PLAYERSREVENUE ANALYSIS OF TOP PLAYERS IN BROMINE MARKET
-
11.4 MARKET SHARE ANALYSIS: BROMINE MARKET (2023)RANKING OF KEY PLAYERS, 2023
-
11.5 BRAND/PRODUCT COMPARISON ANALYSISICL GROUP LTDALBEMARLE CORPORATIONTOSOH CORPORATIONLANXESS AGTETRA TECHNOLOGIES INC.
-
11.6 COMPANY EVALUATION MATRIX: KEY PLAYERS, 2023STARSEMERGING LEADERSPERVASIVE PLAYERSPARTICIPANTS
- 11.7 COMPANY FOOTPRINT ANALYSIS
-
11.8 COMPANY EVALUATION MATRIX: STARTUPS/SMES, 2023PROGRESSIVE COMPANIESDYNAMIC COMPANIESRESPONSIVE COMPANIESSTARTING BLOCKS
- 11.9 COMPETITIVE BENCHMARKING
- 11.10 VALUATION AND FINANCIAL METRICS OF BROMINE MANUFACTURERS
-
11.11 COMPETITIVE SCENARIO AND TRENDSPRODUCT LAUNCHESDEALSEXPANSIONS
- 12.1 INTRODUCTION
-
12.2 KEY PLAYERSICL GROUP LIMITED- Business overview- Products/Solutions/Services offered- Recent developments- MnM viewALBEMARLE CORPORATION- Business overview- Products/Solutions/Services offered- Recent developments- MnM viewLANXESS AG- Business overview- Products/Solutions/Services offered- Recent developments- MnM viewTOSOH CORPORATION- Business overview- Products/Solutions/Services offered- Recent developments- MnM viewGULF RESOURCES INC.- Business overview- Products/Solutions/Services offered- Recent developments- MnM viewTETRA TECHNOLOGIES, INC.- Business overview- Products/Solutions/Services offered- Recent developmentsTATA CHEMICALS LIMITED- Business overview- Products/Solutions/Services offeredHINDUSTAN SALTS LIMITED- Business overview- Products/Solutions/Services offeredHONEYWELL INTERNATIONAL INC.- Business overview- Products/Solutions/Services offered- Recent developmentsARCHEAN CHEMICAL INDUSTRIES LTD- Business overview- Products/Solutions/Services offered- Recent developmentsAGROCEL INDUSTRIES PVT LTD.- Business overview- Products/Solutions/Services offered- Recent developmentsPEREKOP BROMINE FACTORY- Business overview- Products/Solutions/Services offeredSATYESH BRINECHEM PVT. LTD.- Business overview- Products/Solutions/Services offered
-
12.3 OTHER PLAYERSMORRE-TEC INDUSTRIES INC.SHANDONG YUYUAN GROUP CO., LTD.SHANDONG HAIWANG CHEMICAL CO., LTD.SHANDONG HAIHUA GROUP CO., LTD.SHANDONG OCEAN CHEMICAL CO., LTD.SHANDONG WEIFANG LONGWEI INDUSTRIAL CO., LTD.SHANDONG RUNKE CHEMICAL ENGINEERING CO., LTD.DHRUV CHEM INDUSTRIESSHANDONG LUBEI CHEMICAL CO., LTD.SHANDONG HAOYUAN GROUPCHEMCON SPECIALITY CHEMICALS LTD.SANGFROID CHEMICALS PVT. LTD.CHEMADA INDUSTRIES LTD.VINYL KFT.
- 13.1 INTRODUCTION
- 13.2 LIMITATIONS
-
13.3 BROMINE MARKET INTERCONNECTED MARKETSFLAME RETARDANTS MARKET- Market definition- Market overview
-
13.4 FLAME RETARDANTS MARKET, BY TYPEALUMINUM TRIHYDRATE (ATH)- Rapid development of infrastructure to drive marketANTIMONY OXIDE- Need to achieve fire safety standards to drive marketBROMINATED FLAME RETARDANTS- Higher cost-efficiency to drive demandCHLORINATED FLAME RETARDANTS- Asia Pacific to be fastest-growing marketPHOSPHORUS FLAME RETARDANTS- Low volatility of phosphorus flame retardants to fuel demandNITROGEN FLAME RETARDANTS- Shift toward non-halogenated flame retardants to drive marketOTHERS- Zinc borate- Magnesium hydroxide- Boron flame retardants
- 14.1 DISCUSSION GUIDE
- 14.2 KNOWLEDGESTORE: MARKETSANDMARKETS’ SUBSCRIPTION PORTAL
- 14.3 CUSTOMIZATION OPTIONS
- 14.4 RELATED REPORTS
- 14.5 AUTHOR DETAILS
- TABLE 1 BROMINE MARKET, BY APPLICATION: INCLUSIONS AND EXCLUSIONS
- TABLE 2 BROMINE MARKET, BY DERIVATIVE: INCLUSIONS AND EXCLUSIONS
- TABLE 3 BROMINE MARKET, BY END USER: INCLUSIONS AND EXCLUSIONS
- TABLE 4 BROMINE MARKET, BY REGION: INCLUSIONS AND EXCLUSIONS
- TABLE 5 BROMINE MARKET SNAPSHOT
- TABLE 6 PORTER’S FIVE FORCES ANALYSIS: BROMINE MARKET
- TABLE 7 BROMINE MARKET: KEY CONFERENCES AND EVENTS, 2024–2025
- TABLE 8 DIFFERENT LAUNCH STRATEGIES
- TABLE 9 AVERAGE PRICE OF BROMINE, BY REGION (USD/TON)
- TABLE 10 AVERAGE PRICE OF BROMINE, BY DERIVATIVE (USD/TON)
- TABLE 11 AVERAGE PRICE OF BROMINE, BY APPLICATION (USD/TON)
- TABLE 12 MARKET SHARE OF BROMINATED FLAME RETARDANTS
- TABLE 13 END USE OF BROMINATED FLAME RETARDANTS
- TABLE 14 BROMINE MARKET: ECOSYSTEM
- TABLE 15 BFR INCLUSION INTO STOCKHOLM CONVENTION BY REGION/COUNTRY
- TABLE 16 OVERVIEW OF BFRS LISTED IN STOCKHOLM CONVENTION
- TABLE 17 US STATES THAT REGULATE BFRS IN COMMERCIAL GOODS
- TABLE 18 EUROPEAN UNION REGULATIONS AND DIRECTIVES GOVERNING POP-BFRS
- TABLE 19 LIST OF MAJOR PATENTS
- TABLE 20 IMPACT OF STAKEHOLDERS ON BUYING PROCESS FOR TOP THREE APPLICATIONS (%)
- TABLE 21 KEY BUYING CRITERIA FOR RESPONDENTS, BY APPLICATION
- TABLE 22 BROMINE MARKET, BY DERIVATIVE, 2019–2023 (USD MILLION)
- TABLE 23 BROMINE MARKET, BY DERIVATIVE, 2024–2029 (USD MILLION)
- TABLE 24 BROMINE MARKET, BY DERIVATIVE, 2019–2023 (KILOTON)
- TABLE 25 BROMINE MARKET, BY DERIVATIVE, 2024–2029 (KILOTON)
- TABLE 26 ORGANOBROMINES: BROMINE MARKET, BY REGION, 2019–2023 (USD MILLION)
- TABLE 27 ORGANOBROMINES: BROMINE MARKET, BY REGION, 2024–2029 (USD MILLION)
- TABLE 28 ORGANOBROMINES: BROMINE MARKET, BY REGION, 2019–2023 (KILOTON)
- TABLE 29 ORGANOBROMINES: BROMINE MARKET, BY REGION, 2024–2029 (KILOTON)
- TABLE 30 CLEAR BRINE FLUIDS: BROMINE MARKET, BY REGION, 2019–2023 (USD MILLION)
- TABLE 31 CLEAR BRINE FLUIDS: BROMINE MARKET, BY REGION, 2024–2029 (USD MILLION)
- TABLE 32 CLEAR BRINE FLUIDS: BROMINE MARKET, BY REGION, 2019–2023 (KILOTON)
- TABLE 33 CLEAR BRINE FLUIDS: BROMINE MARKET, BY REGION, 2024–2029 (KILOTON)
- TABLE 34 HYDROGEN BROMIDE: BROMINE MARKET, BY REGION, 2019–2023 (USD MILLION)
- TABLE 35 HYDROGEN BROMIDE: BROMINE MARKET, BY REGION, 2024–2029 (USD MILLION)
- TABLE 36 HYDROGEN BROMIDE: BROMINE MARKET, BY REGION, 2019–2023 (KILOTON)
- TABLE 37 HYDROGEN BROMIDE: BROMINE MARKET, BY REGION, 2024–2029 (KILOTON)
- TABLE 38 BROMINE MARKET, BY APPLICATION, 2019–2023 (USD MILLION)
- TABLE 39 BROMINE MARKET, BY APPLICATION, 2024–2029 (USD MILLION)
- TABLE 40 BROMINE MARKET, BY APPLICATION, 2019–2023 (KILOTON)
- TABLE 41 BROMINE MARKET, BY APPLICATION, 2024–2029 (KILOTON)
- TABLE 42 FLAME RETARDANTS: BROMINE MARKET, BY REGION, 2019–2023 (USD MILLION)
- TABLE 43 FLAME RETARDANTS: BROMINE MARKET, BY REGION, 2024–2029 (USD MILLION)
- TABLE 44 FLAME RETARDANTS: BROMINE MARKET, BY REGION, 2019–2023 (KILOTON)
- TABLE 45 FLAME RETARDANTS: BROMINE MARKET, BY REGION, 2024–2029 (KILOTON)
- TABLE 46 WATER TREATMENT & BIOCIDES: BROMINE MARKET, BY REGION, 2019–2023 (USD MILLION)
- TABLE 47 WATER TREATMENT & BIOCIDES: BROMINE MARKET, BY REGION, 2024–2029 (USD MILLION)
- TABLE 48 WATER TREATMENT & BIOCIDES: BROMINE MARKET, BY REGION, 2019–2023 (KILOTON)
- TABLE 49 WATER TREATMENT & BIOCIDES: BROMINE MARKET, BY REGION, 2024–2029 (KILOTON)
- TABLE 50 MERCURY EMISSION CONTROL: BROMINE MARKET, BY REGION, 2019–2023 (USD MILLION)
- TABLE 51 MERCURY EMISSION CONTROL: BROMINE MARKET, BY REGION, 2024–2029 (USD MILLION)
- TABLE 52 MERCURY EMISSION CONTROL: BROMINE MARKET, BY REGION, 2019–2023 (KILOTON)
- TABLE 53 MERCURY EMISSION CONTROL: BROMINE MARKET, BY REGION, 2024–2029 (KILOTON)
- TABLE 54 OIL & GAS DRILLING: BROMINE MARKET, BY REGION, 2019–2023 (USD MILLION)
- TABLE 55 OIL & GAS DRILLING: BROMINE MARKET, BY REGION, 2024–2029 (USD MILLION)
- TABLE 56 OIL & GAS DRILLING: BROMINE MARKET, BY REGION, 2019–2023 (KILOTON)
- TABLE 57 OIL & GAS DRILLING: BROMINE MARKET, BY REGION, 2024–2029 (KILOTON)
- TABLE 58 HYDROGEN BROMIDE FLOW BATTERIES: BROMINE MARKET, BY REGION, 2019–2023 (USD MILLION)
- TABLE 59 HYDROGEN BROMIDE FLOW BATTERIES: BROMINE MARKET, BY REGION, 2024–2029 (USD MILLION)
- TABLE 60 HYDROGEN BROMIDE FLOW BATTERIES: BROMINE MARKET, BY REGION, 2019–2023 (KILOTON)
- TABLE 61 HYDROGEN BROMIDE FLOW BATTERIES: BROMINE MARKET, BY REGION, 2024–2029 (KILOTON)
- TABLE 62 PTA SYNTHESIS: BROMINE MARKET, BY REGION, 2019–2023 (USD MILLION)
- TABLE 63 PTA SYNTHESIS: BROMINE MARKET, BY REGION, 2024–2029 (USD MILLION)
- TABLE 64 PTA SYNTHESIS: BROMINE MARKET, BY REGION, 2019–2023 (KILOTON)
- TABLE 65 PTA SYNTHESIS: BROMINE MARKET, BY REGION, 2024–2029 (KILOTON)
- TABLE 66 PESTICIDES: BROMINE MARKET, BY REGION, 2019–2023 (USD MILLION)
- TABLE 67 PESTICIDES: BROMINE MARKET, BY REGION, 2024–2029 (USD MILLION)
- TABLE 68 PESTICIDES: BROMINE MARKET, BY REGION, 2019–2023 (KILOTON)
- TABLE 69 PESTICIDES: BROMINE MARKET, BY REGION, 2024–2029 (KILOTON)
- TABLE 70 PLASMA ETCHING: BROMINE MARKET, BY REGION, 2019–2023 (USD MILLION)
- TABLE 71 PLASMA ETCHING: BROMINE MARKET, BY REGION, 2024–2029 (USD MILLION)
- TABLE 72 PLASMA ETCHING: BROMINE MARKET, BY REGION, 2019–2023 (KILOTON)
- TABLE 73 PLASMA ETCHING: BROMINE MARKET, BY REGION, 2024–2029 (KILOTON)
- TABLE 74 PHARMACEUTICALS: BROMINE MARKET, BY REGION, 2019–2023 (USD MILLION)
- TABLE 75 PHARMACEUTICALS: BROMINE MARKET, BY REGION, 2024–2029 (USD MILLION)
- TABLE 76 PHARMACEUTICALS: BROMINE MARKET, BY REGION, 2019–2023 (KILOTON)
- TABLE 77 PHARMACEUTICALS: BROMINE MARKET, BY REGION, 2024–2029 (KILOTON)
- TABLE 78 BUTYL RUBBER: BROMINE MARKET, BY REGION, 2019–2023 (USD MILLION)
- TABLE 79 BUTYL RUBBER: BROMINE MARKET, BY REGION, 2024–2029 (USD MILLION)
- TABLE 80 BUTYL RUBBER: BROMINE MARKET, BY REGION, 2019–2023 (KILOTON)
- TABLE 81 BUTYL RUBBER: BROMINE MARKET, BY REGION, 2024–2029 (KILOTON)
- TABLE 82 OTHER APPLICATIONS: BROMINE MARKET, BY REGION, 2019–2023 (USD MILLION)
- TABLE 83 OTHER APPLICATIONS: BROMINE MARKET, BY REGION, 2024–2029 (USD MILLION)
- TABLE 84 OTHER APPLICATIONS: BROMINE MARKET, BY REGION, 2019–2023 (KILOTON)
- TABLE 85 OTHER APPLICATIONS: BROMINE MARKET, BY REGION, 2024–2029 (KILOTON)
- TABLE 86 BROMINE MARKET, BY REGION, 2019–2023 (USD MILLION)
- TABLE 87 BROMINE MARKET, BY REGION, 2024–2029 (USD MILLION)
- TABLE 88 BROMINE MARKET, BY REGION, 2019–2023 (KILOTON)
- TABLE 89 BROMINE MARKET, BY REGION, 2024–2029 (KILOTON)
- TABLE 90 ASIA PACIFIC: BROMINE MARKET, BY COUNTRY, 2019–2023 (USD MILLION)
- TABLE 91 ASIA PACIFIC: BROMINE MARKET, BY COUNTRY, 2024–2029 (USD MILLION)
- TABLE 92 ASIA PACIFIC: BROMINE MARKET, BY COUNTRY, 2019–2023 (KILOTON)
- TABLE 93 ASIA PACIFIC: BROMINE MARKET, BY COUNTRY, 2024–2029 (KILOTON)
- TABLE 94 ASIA PACIFIC: BROMINE MARKET, BY DERIVATIVE, 2019–2023 (USD MILLION)
- TABLE 95 ASIA PACIFIC: BROMINE MARKET, BY DERIVATIVE, 2024–2029 (USD MILLION)
- TABLE 96 ASIA PACIFIC: BROMINE MARKET, BY DERIVATIVE, 2019–2023 (KILOTON)
- TABLE 97 ASIA PACIFIC: BROMINE MARKET, BY DERIVATIVE, 2024–2029 (KILOTON)
- TABLE 98 ASIA PACIFIC: BROMINE MARKET, BY APPLICATION, 2019–2023 (USD MILLION)
- TABLE 99 ASIA PACIFIC: BROMINE MARKET, BY APPLICATION, 2024–2029 (USD MILLION)
- TABLE 100 ASIA PACIFIC: BROMINE MARKET, BY APPLICATION, 2019–2023 (KILOTON)
- TABLE 101 ASIA PACIFIC: BROMINE MARKET, BY APPLICATION, 2024–2029 (KILOTON)
- TABLE 102 CHINA: BROMINE MARKET, BY DERIVATIVE, 2019–2023 (USD MILLION)
- TABLE 103 CHINA: BROMINE MARKET, BY DERIVATIVE, 2024–2029 (USD MILLION)
- TABLE 104 CHINA: BROMINE MARKET, BY DERIVATIVE, 2019–2023 (KILOTON)
- TABLE 105 CHINA: BROMINE MARKET, BY DERIVATIVE, 2024–2029 (KILOTON)
- TABLE 106 CHINA: BROMINE MARKET, BY APPLICATION, 2019–2023 (USD MILLION)
- TABLE 107 CHINA: BROMINE MARKET, BY APPLICATION, 2024–2029 (USD MILLION)
- TABLE 108 CHINA: BROMINE MARKET, BY APPLICATION, 2019–2023 (KILOTON)
- TABLE 109 CHINA: BROMINE MARKET, BY APPLICATION, 2024–2029 (KILOTON)
- TABLE 110 JAPAN: BROMINE MARKET, BY DERIVATIVE, 2019–2023 (USD MILLION)
- TABLE 111 JAPAN: BROMINE MARKET, BY DERIVATIVE, 2024–2029 (USD MILLION)
- TABLE 112 JAPAN: BROMINE MARKET, BY DERIVATIVE, 2019–2023 (KILOTON)
- TABLE 113 JAPAN: BROMINE MARKET, BY DERIVATIVE, 2024–2029 (KILOTON)
- TABLE 114 JAPAN: BROMINE MARKET, BY APPLICATION, 2019–2023 (USD MILLION)
- TABLE 115 JAPAN: BROMINE MARKET, BY APPLICATION, 2024–2029 (USD MILLION)
- TABLE 116 JAPAN: BROMINE MARKET, BY APPLICATION, 2019–2023 (KILOTON)
- TABLE 117 JAPAN: BROMINE MARKET, BY APPLICATION, 2024–2029 (KILOTON)
- TABLE 118 INDIA: BROMINE MARKET, BY DERIVATIVE, 2019–2023 (USD MILLION)
- TABLE 119 INDIA: BROMINE MARKET, BY DERIVATIVE, 2024–2029 (USD MILLION)
- TABLE 120 INDIA: BROMINE MARKET, BY DERIVATIVE, 2019–2023 (KILOTON)
- TABLE 121 INDIA: BROMINE MARKET, BY DERIVATIVE, 2024–2029 (KILOTON)
- TABLE 122 INDIA: BROMINE MARKET, BY APPLICATION, 2019–2023 (USD MILLION)
- TABLE 123 INDIA: BROMINE MARKET, BY APPLICATION, 2024–2029 (USD MILLION)
- TABLE 124 INDIA: BROMINE MARKET, BY APPLICATION, 2019–2023 (KILOTON)
- TABLE 125 INDIA: BROMINE MARKET, BY APPLICATION, 2024–2029 (KILOTON)
- TABLE 126 SOUTH KOREA: BROMINE MARKET, BY DERIVATIVE, 2019–2023 (USD MILLION)
- TABLE 127 SOUTH KOREA: BROMINE MARKET, BY DERIVATIVE, 2024–2029 (USD MILLION)
- TABLE 128 SOUTH KOREA: BROMINE MARKET, BY DERIVATIVE, 2019–2023 (KILOTON)
- TABLE 129 SOUTH KOREA: BROMINE MARKET, BY DERIVATIVE, 2024–2029 (KILOTON)
- TABLE 130 SOUTH KOREA: BROMINE MARKET, BY APPLICATION, 2019–2023 (USD MILLION)
- TABLE 131 SOUTH KOREA: BROMINE MARKET, BY APPLICATION, 2024–2029 (USD MILLION)
- TABLE 132 SOUTH KOREA: BROMINE MARKET, BY APPLICATION, 2019–2023 (KILOTON)
- TABLE 133 SOUTH KOREA: BROMINE MARKET, BY APPLICATION, 2024–2029 (KILOTON)
- TABLE 134 TAIWAN: BROMINE MARKET, BY DERIVATIVE, 2019–2023 (USD MILLION)
- TABLE 135 TAIWAN: BROMINE MARKET, BY DERIVATIVE, 2024–2029 (USD MILLION)
- TABLE 136 TAIWAN: BROMINE MARKET, BY DERIVATIVE, 2019–2023 (KILOTON)
- TABLE 137 TAIWAN: BROMINE MARKET, BY DERIVATIVE, 2024–2029 (KILOTON)
- TABLE 138 TAIWAN: BROMINE MARKET, BY APPLICATION, 2019–2023 (USD MILLION)
- TABLE 139 TAIWAN: BROMINE MARKET, BY APPLICATION, 2024–2029 (USD MILLION)
- TABLE 140 TAIWAN: BROMINE MARKET, BY APPLICATION, 2019–2023 (KILOTON)
- TABLE 141 TAIWAN: BROMINE MARKET, BY APPLICATION, 2024–2029 (KILOTON)
- TABLE 142 REST OF ASIA PACIFIC: BROMINE MARKET, BY DERIVATIVE, 2019–2023 (USD MILLION)
- TABLE 143 REST OF ASIA PACIFIC: BROMINE MARKET, BY DERIVATIVE, 2024–2029 (USD MILLION)
- TABLE 144 REST OF ASIA PACIFIC: BROMINE MARKET, BY DERIVATIVE, 2019–2023 (KILOTON)
- TABLE 145 REST OF ASIA PACIFIC: BROMINE MARKET, BY DERIVATIVE, 2024–2029 (KILOTON)
- TABLE 146 REST OF ASIA PACIFIC: BROMINE MARKET, BY APPLICATION, 2019–2023 (USD MILLION)
- TABLE 147 REST OF ASIA PACIFIC: BROMINE MARKET, BY APPLICATION, 2024–2029 (USD MILLION)
- TABLE 148 REST OF ASIA PACIFIC: BROMINE MARKET, BY APPLICATION, 2019–2023 (KILOTON)
- TABLE 149 REST OF ASIA PACIFIC: BROMINE MARKET, BY APPLICATION, 2024–2029 (KILOTON)
- TABLE 150 NORTH AMERICA: BROMINE MARKET, BY COUNTRY, 2019–2023 (USD MILLION)
- TABLE 151 NORTH AMERICA: BROMINE MARKET, BY COUNTRY, 2024–2029 (USD MILLION)
- TABLE 152 NORTH AMERICA: BROMINE MARKET, BY COUNTRY, 2019–2023 (KILOTON)
- TABLE 153 NORTH AMERICA: BROMINE MARKET, BY COUNTRY, 2024–2029 (KILOTON)
- TABLE 154 NORTH AMERICA: BROMINE MARKET, BY DERIVATIVE, 2019–2023 (USD MILLION)
- TABLE 155 NORTH AMERICA: BROMINE MARKET, BY DERIVATIVE, 2024–2029 (USD MILLION)
- TABLE 156 NORTH AMERICA: BROMINE MARKET, BY DERIVATIVE, 2019–2023 (KILOTON)
- TABLE 157 NORTH AMERICA: BROMINE MARKET, BY DERIVATIVE, 2024–2029 (KILOTON)
- TABLE 158 NORTH AMERICA: BROMINE MARKET, BY APPLICATION, 2019–2023 (USD MILLION)
- TABLE 159 NORTH AMERICA: BROMINE MARKET, BY APPLICATION, 2024–2029 (USD MILLION)
- TABLE 160 NORTH AMERICA: BROMINE MARKET, BY APPLICATION, 2019–2023 (KILOTON)
- TABLE 161 NORTH AMERICA: BROMINE MARKET, BY APPLICATION, 2024–2029 (KILOTON)
- TABLE 162 US: BROMINE MARKET, BY DERIVATIVE, 2019–2023 (USD MILLION)
- TABLE 163 US: BROMINE MARKET, BY DERIVATIVE, 2024–2029 (USD MILLION)
- TABLE 164 US: BROMINE MARKET, BY DERIVATIVE, 2019–2023 (KILOTON)
- TABLE 165 US: BROMINE MARKET, BY DERIVATIVE, 2024–2029 (KILOTON)
- TABLE 166 US: BROMINE MARKET, BY APPLICATION, 2019–2023 (USD MILLION)
- TABLE 167 US: BROMINE MARKET, BY APPLICATION, 2024–2029 (USD MILLION)
- TABLE 168 US: BROMINE MARKET, BY APPLICATION, 2019–2023 (KILOTON)
- TABLE 169 US: BROMINE MARKET, BY APPLICATION, 2024–2029 (KILOTON)
- TABLE 170 CANADA: BROMINE MARKET, BY DERIVATIVE, 2019–2023 (USD MILLION)
- TABLE 171 CANADA: BROMINE MARKET, BY DERIVATIVE, 2024–2029 (USD MILLION)
- TABLE 172 CANADA: BROMINE MARKET, BY DERIVATIVE, 2019–2023 (KILOTON)
- TABLE 173 CANADA: BROMINE MARKET, BY DERIVATIVE, 2024–2029 (KILOTON)
- TABLE 174 CANADA: BROMINE MARKET, BY APPLICATION, 2019–2023 (USD MILLION)
- TABLE 175 CANADA: BROMINE MARKET, BY APPLICATION, 2024–2029 (USD MILLION)
- TABLE 176 CANADA: BROMINE MARKET, BY APPLICATION, 2019–2023 (KILOTON)
- TABLE 177 CANADA: BROMINE MARKET, BY APPLICATION, 2024–2029 (KILOTON)
- TABLE 178 MEXICO: BROMINE MARKET, BY DERIVATIVE, 2019–2023 (USD MILLION)
- TABLE 179 MEXICO: BROMINE MARKET, BY DERIVATIVE, 2024–2029 (USD MILLION)
- TABLE 180 MEXICO: BROMINE MARKET, BY DERIVATIVE, 2019–2023 (KILOTON)
- TABLE 181 MEXICO: BROMINE MARKET, BY DERIVATIVE, 2024–2029 (KILOTON)
- TABLE 182 MEXICO: BROMINE MARKET, BY APPLICATION, 2019–2023 (USD MILLION)
- TABLE 183 MEXICO: BROMINE MARKET, BY APPLICATION, 2024–2029 (USD MILLION)
- TABLE 184 MEXICO: BROMINE MARKET, BY APPLICATION, 2019–2023 (KILOTON)
- TABLE 185 MEXICO: BROMINE MARKET, BY APPLICATION, 2024–2029 (KILOTON)
- TABLE 186 WESTERN EUROPE: BROMINE MARKET, BY COUNTRY, 2019–2023 (USD MILLION)
- TABLE 187 WESTERN EUROPE: BROMINE MARKET, BY COUNTRY, 2024–2029 (USD MILLION)
- TABLE 188 WESTERN EUROPE: BROMINE MARKET, BY COUNTRY, 2019–2023 (KILOTON)
- TABLE 189 WESTERN EUROPE: BROMINE MARKET, BY COUNTRY, 2024–2029 (KILOTON)
- TABLE 190 WESTERN EUROPE: BROMINE MARKET, BY DERIVATIVE, 2019–2023 (USD MILLION)
- TABLE 191 WESTERN EUROPE: BROMINE MARKET, BY DERIVATIVE, 2024–2029 (USD MILLION)
- TABLE 192 WESTERN EUROPE: BROMINE MARKET, BY DERIVATIVE, 2019–2023 (KILOTON)
- TABLE 193 WESTERN EUROPE: BROMINE MARKET, BY DERIVATIVE, 2024–2029 (KILOTON)
- TABLE 194 WESTERN EUROPE: BROMINE MARKET, BY APPLICATION, 2019–2023 (USD MILLION)
- TABLE 195 WESTERN EUROPE: BROMINE MARKET, BY APPLICATION, 2024–2029 (USD MILLION)
- TABLE 196 WESTERN EUROPE: BROMINE MARKET, BY APPLICATION, 2019–2023 (KILOTON)
- TABLE 197 WESTERN EUROPE: BROMINE MARKET, BY APPLICATION, 2024–2029 (KILOTON)
- TABLE 198 GERMANY: BROMINE MARKET, BY DERIVATIVE, 2019–2023 (USD MILLION)
- TABLE 199 GERMANY: BROMINE MARKET, BY DERIVATIVE, 2024–2029 (USD MILLION)
- TABLE 200 GERMANY: BROMINE MARKET, BY DERIVATIVE, 2019–2023 (KILOTON)
- TABLE 201 GERMANY: BROMINE MARKET, BY DERIVATIVE, 2024–2029 (KILOTON)
- TABLE 202 GERMANY: BROMINE MARKET, BY APPLICATION, 2019–2023 (USD MILLION)
- TABLE 203 GERMANY: BROMINE MARKET, BY APPLICATION, 2024–2029 (USD MILLION)
- TABLE 204 GERMANY: BROMINE MARKET, BY APPLICATION, 2019–2023 (KILOTON)
- TABLE 205 GERMANY: BROMINE MARKET, BY APPLICATION, 2024–2029 (KILOTON)
- TABLE 206 FRANCE: BROMINE MARKET, BY DERIVATIVE, 2019–2023 (USD MILLION)
- TABLE 207 FRANCE: BROMINE MARKET, BY DERIVATIVE, 2024–2029 (USD MILLION)
- TABLE 208 FRANCE: BROMINE MARKET, BY DERIVATIVE, 2019–2023 (KILOTON)
- TABLE 209 FRANCE: BROMINE MARKET, BY DERIVATIVE, 2024–2029 (KILOTON)
- TABLE 210 FRANCE: BROMINE MARKET, BY APPLICATION, 2019–2023 (USD MILLION)
- TABLE 211 FRANCE: BROMINE MARKET, BY APPLICATION, 2024–2029 (USD MILLION)
- TABLE 212 FRANCE: BROMINE MARKET, BY APPLICATION, 2019–2023 (KILOTON)
- TABLE 213 FRANCE: BROMINE MARKET, BY APPLICATION, 2024–2029 (KILOTON)
- TABLE 214 UK: BROMINE MARKET, BY DERIVATIVE, 2019–2023 (USD MILLION)
- TABLE 215 UK: BROMINE MARKET, BY DERIVATIVE, 2024–2029 (USD MILLION)
- TABLE 216 UK: BROMINE MARKET, BY DERIVATIVE, 2019–2023 (KILOTON)
- TABLE 217 UK: BROMINE MARKET, BY DERIVATIVE, 2024–2029 (KILOTON)
- TABLE 218 UK: BROMINE MARKET, BY APPLICATION, 2019–2023 (USD MILLION)
- TABLE 219 UK: BROMINE MARKET, BY APPLICATION, 2024–2029 (USD MILLION)
- TABLE 220 UK: BROMINE MARKET, BY APPLICATION, 2019–2023 (KILOTON)
- TABLE 221 UK: BROMINE MARKET, BY APPLICATION, 2024–2029 (KILOTON)
- TABLE 222 REST OF WESTERN EUROPE: BROMINE MARKET, BY DERIVATIVE, 2019–2023 (USD MILLION)
- TABLE 223 REST OF WESTERN EUROPE: BROMINE MARKET, BY DERIVATIVE, 2024–2029 (USD MILLION)
- TABLE 224 REST OF WESTERN EUROPE: BROMINE MARKET, BY DERIVATIVE, 2019–2023 (KILOTON)
- TABLE 225 REST OF WESTERN EUROPE: BROMINE MARKET, BY DERIVATIVE, 2024–2029 (KILOTON)
- TABLE 226 REST OF WESTERN EUROPE: BROMINE MARKET, BY APPLICATION, 2019–2023 (USD MILLION)
- TABLE 227 REST OF WESTERN EUROPE: BROMINE MARKET, BY APPLICATION, 2024–2029 (USD MILLION)
- TABLE 228 REST OF WESTERN EUROPE: BROMINE MARKET, BY APPLICATION, 2019–2023 (KILOTON)
- TABLE 229 REST OF WESTERN EUROPE: BROMINE MARKET, BY APPLICATION, 2024–2029 (KILOTON)
- TABLE 230 CENTRAL & EASTERN EUROPE: BROMINE MARKET, BY COUNTRY, 2019–2023 (USD MILLION)
- TABLE 231 CENTRAL & EASTERN EUROPE: BROMINE MARKET, BY COUNTRY, 2024–2029 (USD MILLION)
- TABLE 232 CENTRAL & EASTERN EUROPE: BROMINE MARKET, BY COUNTRY, 2019–2023 (KILOTON)
- TABLE 233 CENTRAL & EASTERN EUROPE: BROMINE MARKET, BY COUNTRY, 2024–2029 (KILOTON)
- TABLE 234 CENTRAL & EASTERN EUROPE: BROMINE MARKET, BY DERIVATIVE, 2019–2023 (USD MILLION)
- TABLE 235 CENTRAL & EASTERN EUROPE: BROMINE MARKET, BY DERIVATIVE, 2024–2029 (USD MILLION)
- TABLE 236 CENTRAL & EASTERN EUROPE: BROMINE MARKET, BY DERIVATIVE, 2019–2023 (KILOTON)
- TABLE 237 CENTRAL & EASTERN EUROPE: BROMINE MARKET, BY DERIVATIVE, 2024–2029 (KILOTON)
- TABLE 238 CENTRAL & EASTERN EUROPE: BROMINE MARKET, BY APPLICATION, 2019–2023 (USD MILLION)
- TABLE 239 CENTRAL & EASTERN EUROPE: BROMINE MARKET, BY APPLICATION, 2024–2029 (USD MILLION)
- TABLE 240 CENTRAL & EASTERN EUROPE: BROMINE MARKET, BY APPLICATION, 2019–2023 (KILOTON)
- TABLE 241 CENTRAL & EASTERN EUROPE: BROMINE MARKET, BY APPLICATION, 2024–2029 (KILOTON)
- TABLE 242 RUSSIA: BROMINE MARKET, BY DERIVATIVE, 2019–2023 (USD MILLION)
- TABLE 243 RUSSIA: BROMINE MARKET, BY DERIVATIVE, 2024–2029 (USD MILLION)
- TABLE 244 RUSSIA: BROMINE MARKET, BY DERIVATIVE, 2019–2023 (KILOTON)
- TABLE 245 RUSSIA: BROMINE MARKET, BY DERIVATIVE, 2024–2029 (KILOTON)
- TABLE 246 RUSSIA: BROMINE MARKET, BY APPLICATION, 2019–2023 (USD MILLION)
- TABLE 247 RUSSIA: BROMINE MARKET, BY APPLICATION, 2024–2029 (USD MILLION)
- TABLE 248 RUSSIA: BROMINE MARKET, BY APPLICATION, 2019–2023 (KILOTON)
- TABLE 249 RUSSIA: BROMINE MARKET, BY APPLICATION, 2024–2029 (KILOTON)
- TABLE 250 TURKEY: BROMINE MARKET, BY DERIVATIVE, 2019–2023 (USD MILLION)
- TABLE 251 TURKEY: BROMINE MARKET, BY DERIVATIVE, 2024–2029 (USD MILLION)
- TABLE 252 TURKEY: BROMINE MARKET, BY DERIVATIVE, 2019–2023 (KILOTON)
- TABLE 253 TURKEY: BROMINE MARKET, BY DERIVATIVE, 2024–2029 (KILOTON)
- TABLE 254 TURKEY: BROMINE MARKET, BY APPLICATION, 2019–2023 (USD MILLION)
- TABLE 255 TURKEY: BROMINE MARKET, BY APPLICATION, 2024–2029 (USD MILLION)
- TABLE 256 TURKEY: BROMINE MARKET, BY APPLICATION, 2019–2023 (KILOTON)
- TABLE 257 TURKEY: BROMINE MARKET, BY APPLICATION, 2024–2029 (KILOTON)
- TABLE 258 REST OF CENTRAL & EASTERN EUROPE: BROMINE MARKET, BY DERIVATIVE, 2019–2023 (USD MILLION)
- TABLE 259 REST OF CENTRAL & EASTERN EUROPE: BROMINE MARKET, BY DERIVATIVE, 2024–2029 (USD MILLION)
- TABLE 260 REST OF CENTRAL & EASTERN EUROPE: BROMINE MARKET, BY DERIVATIVE, 2019–2023 (KILOTON)
- TABLE 261 REST OF CENTRAL & EASTERN EUROPE: BROMINE MARKET, BY DERIVATIVE, 2024–2029 (KILOTON)
- TABLE 262 REST OF CENTRAL & EASTERN EUROPE: BROMINE MARKET, BY APPLICATION, 2019–2023 (USD MILLION)
- TABLE 263 REST OF CENTRAL & EASTERN EUROPE: BROMINE MARKET, BY APPLICATION, 2024–2029 (USD MILLION)
- TABLE 264 REST OF CENTRAL & EASTERN EUROPE: BROMINE MARKET, BY APPLICATION, 2019–2023 (KILOTON)
- TABLE 265 REST OF CENTRAL & EASTERN EUROPE: BROMINE MARKET, BY APPLICATION, 2024–2029 (KILOTON)
- TABLE 266 MIDDLE EAST & AFRICA: BROMINE MARKET, BY COUNTRY, 2019–2023 (USD MILLION)
- TABLE 267 MIDDLE EAST & AFRICA: BROMINE MARKET, BY COUNTRY, 2024–2029 (USD MILLION)
- TABLE 268 MIDDLE EAST & AFRICA: BROMINE MARKET, BY COUNTRY, 2019–2023 (KILOTON)
- TABLE 269 MIDDLE EAST & AFRICA: BROMINE MARKET, BY COUNTRY, 2024–2029 (KILOTON)
- TABLE 270 MIDDLE EAST & AFRICA: BROMINE MARKET, BY DERIVATIVE, 2019–2023 (USD MILLION)
- TABLE 271 MIDDLE EAST & AFRICA: BROMINE MARKET, BY DERIVATIVE, 2024–2029 (USD MILLION)
- TABLE 272 MIDDLE EAST & AFRICA: BROMINE MARKET, BY DERIVATIVE, 2019–2023 (KILOTON)
- TABLE 273 MIDDLE EAST & AFRICA: BROMINE MARKET, BY DERIVATIVE, 2024–2029 (KILOTON)
- TABLE 274 MIDDLE EAST & AFRICA: BROMINE MARKET, BY APPLICATION, 2019–2023 (USD MILLION)
- TABLE 275 MIDDLE EAST & AFRICA: BROMINE MARKET, BY APPLICATION, 2024–2029 (USD MILLION)
- TABLE 276 MIDDLE EAST & AFRICA: BROMINE MARKET, BY APPLICATION, 2019–2023 (KILOTON)
- TABLE 277 MIDDLE EAST & AFRICA: BROMINE MARKET, BY APPLICATION, 2024–2029 (KILOTONS)
- TABLE 278 SAUDI ARABIA: BROMINE MARKET, BY DERIVATIVE, 2019–2023 (USD MILLION)
- TABLE 279 SAUDI ARABIA: BROMINE MARKET, BY DERIVATIVE, 2024–2029 (USD MILLION)
- TABLE 280 SAUDI ARABIA: BROMINE MARKET, BY DERIVATIVE, 2019–2023 (KILOTON)
- TABLE 281 SAUDI ARABIA: BROMINE MARKET, BY DERIVATIVE, 2024–2029 (KILOTON)
- TABLE 282 SAUDI ARABIA: BROMINE MARKET, BY APPLICATION, 2019–2023 (USD MILLION)
- TABLE 283 SAUDI ARABIA: BROMINE MARKET, BY APPLICATION, 2024–2029 (USD MILLION)
- TABLE 284 SAUDI ARABIA: BROMINE MARKET, BY APPLICATION, 2019–2023 KILOTON)
- TABLE 285 SAUDI ARABIA: BROMINE MARKET, BY APPLICATION, 2024–2029 (KILOTON)
- TABLE 286 UAE: BROMINE MARKET, BY DERIVATIVE, 2019–2023 (USD MILLION)
- TABLE 287 UAE: BROMINE MARKET, BY DERIVATIVE, 2024–2029 (USD MILLION)
- TABLE 288 UAE: BROMINE MARKET, BY DERIVATIVE, 2019–2023 (KILOTON)
- TABLE 289 UAE: BROMINE MARKET, BY DERIVATIVE, 2024–2029 (KILOTON)
- TABLE 290 UAE: BROMINE MARKET, BY APPLICATION, 2019–2023 (USD MILLION)
- TABLE 291 UAE: BROMINE MARKET, BY APPLICATION, 2024–2029 (USD MILLION)
- TABLE 292 UAE: BROMINE MARKET, BY APPLICATION, 2019–2023 (KILOTON)
- TABLE 293 UAE: BROMINE MARKET, BY APPLICATION, 2024–2029 (KILOTON)
- TABLE 294 REST OF GCC COUNTRIES: BROMINE MARKET, BY DERIVATIVE, 2019–2023 (USD MILLION)
- TABLE 295 REST OF GCC COUNTRIES: BROMINE MARKET, BY DERIVATIVE, 2024–2029 (USD MILLION)
- TABLE 296 REST OF GCC COUNTRIES: BROMINE MARKET, BY DERIVATIVE, 2019–2023 (KILOTON)
- TABLE 297 REST OF GCC COUNTRIES: BROMINE MARKET, BY DERIVATIVE, 2024–2029 (KILOTON)
- TABLE 298 REST OF GCC COUNTRIES: BROMINE MARKET, BY APPLICATION, 2019–2023 (USD MILLION)
- TABLE 299 REST OF GCC COUNTRIES: BROMINE MARKET, BY APPLICATION, 2024–2029 (USD MILLION)
- TABLE 300 REST OF GCC COUNTRIES: BROMINE MARKET, BY APPLICATION, 2019–2023 (KILOTON)
- TABLE 301 REST OF GCC COUNTRIES: BROMINE MARKET, BY APPLICATION, 2024–2029 (KILOTON)
- TABLE 302 SOUTH AFRICA: BROMINE MARKET, BY DERIVATIVE, 2019–2023 (USD MILLION)
- TABLE 303 SOUTH AFRICA: BROMINE MARKET, BY DERIVATIVE, 2024–2029 (USD MILLION)
- TABLE 304 SOUTH AFRICA: BROMINE MARKET, BY DERIVATIVE, 2019–2023 (KILOTON)
- TABLE 305 SOUTH AFRICA: BROMINE MARKET, BY DERIVATIVE, 2024–2029 (KILOTON)
- TABLE 306 SOUTH AFRICA: BROMINE MARKET, BY APPLICATION, 2019–2023 (USD MILLION)
- TABLE 307 SOUTH AFRICA: BROMINE MARKET, BY APPLICATION, 2024–2029 (USD MILLION)
- TABLE 308 SOUTH AFRICA: BROMINE MARKET, BY APPLICATION, 2019–2023 (KILOTON)
- TABLE 309 SOUTH AFRICA: BROMINE MARKET, BY APPLICATION, 2024–2029 (KILOTON)
- TABLE 310 REST OF MIDDLE EAST & AFRICA: BROMINE MARKET, BY DERIVATIVE, 2019–2023 (USD MILLION)
- TABLE 311 REST OF MIDDLE EAST & AFRICA: BROMINE MARKET, BY DERIVATIVE, 2024–2029 (USD MILLION)
- TABLE 312 REST OF MIDDLE EAST & AFRICA: BROMINE MARKET, BY DERIVATIVE, 2019–2023 (KILOTON)
- TABLE 313 REST OF MIDDLE EAST & AFRICA: BROMINE MARKET, BY DERIVATIVE, 2024–2029 (KILOTON)
- TABLE 314 REST OF MIDDLE EAST & AFRICA: BROMINE MARKET, BY APPLICATION, 2019–2023 (USD MILLION)
- TABLE 315 REST OF MIDDLE EAST & AFRICA: BROMINE MARKET, BY APPLICATION, 2024–2029 (USD MILLION)
- TABLE 316 REST OF MIDDLE EAST & AFRICA: BROMINE MARKET, BY APPLICATION, 2019–2023 (KILOTON)
- TABLE 317 REST OF MIDDLE EAST & AFRICA: BROMINE MARKET, BY APPLICATION, 2024–2029 (KILOTON)
- TABLE 318 SOUTH AMERICA: BROMINE MARKET, BY COUNTRY, 2019–2023 (USD MILLION)
- TABLE 319 SOUTH AMERICA: BROMINE MARKET, BY COUNTRY, 2024–2029 (USD MILLION)
- TABLE 320 SOUTH AMERICA: BROMINE MARKET, BY COUNTRY, 2019–2023 (KILOTON)
- TABLE 321 SOUTH AMERICA: BROMINE MARKET, BY COUNTRY, 2024–2029 (KILOTON)
- TABLE 322 SOUTH AMERICA: BROMINE MARKET, BY DERIVATIVE, 2019–2023 (USD MILLION)
- TABLE 323 SOUTH AMERICA: BROMINE MARKET, BY DERIVATIVE, 2024–2029 (USD MILLION)
- TABLE 324 SOUTH AMERICA: BROMINE MARKET, BY DERIVATIVE, 2019–2023 (KILOTON)
- TABLE 325 SOUTH AMERICA: BROMINE MARKET, BY DERIVATIVE, 2024–2029 (KILOTON)
- TABLE 326 SOUTH AMERICA: BROMINE MARKET, BY APPLICATION, 2019–2023 (USD MILLION)
- TABLE 327 SOUTH AMERICA: BROMINE MARKET, BY APPLICATION, 2024–2029 (USD MILLION)
- TABLE 328 SOUTH AMERICA: BROMINE MARKET, BY APPLICATION, 2019–2023 (KILOTON)
- TABLE 329 SOUTH AMERICA: BROMINE MARKET, BY APPLICATION, 2024–2029 (KILOTON)
- TABLE 330 BRAZIL: BROMINE MARKET, BY DERIVATIVE, 2019–2023 (USD MILLION)
- TABLE 331 BRAZIL: BROMINE MARKET, BY DERIVATIVE, 2024–2029 (USD MILLION)
- TABLE 332 BRAZIL: BROMINE MARKET, BY DERIVATIVE, 2019–2023 (KILOTON)
- TABLE 333 BRAZIL: BROMINE MARKET, BY DERIVATIVE, 2024–2029 (KILOTON)
- TABLE 334 BRAZIL: BROMINE MARKET, BY APPLICATION, 2019–2023 (USD MILLION)
- TABLE 335 BRAZIL: BROMINE MARKET, BY APPLICATION, 2024–2029 (USD MILLION)
- TABLE 336 BRAZIL: BROMINE MARKET, BY APPLICATION, 2019–2023 (KILOTON)
- TABLE 337 BRAZIL: BROMINE MARKET, BY APPLICATION, 2024–2029 (KILOTON)
- TABLE 338 ARGENTINA: BROMINE MARKET, BY DERIVATIVE, 2019–2023 (USD MILLION)
- TABLE 339 ARGENTINA: BROMINE MARKET, BY DERIVATIVE, 2024–2029 (USD MILLION)
- TABLE 340 ARGENTINA: BROMINE MARKET, BY DERIVATIVE, 2019–2023 (KILOTON)
- TABLE 341 ARGENTINA: BROMINE MARKET, BY DERIVATIVE, 2024–2029 (KILOTON)
- TABLE 342 ARGENTINA: BROMINE MARKET, BY APPLICATION, 2019–2023 (USD MILLION)
- TABLE 343 ARGENTINA: BROMINE MARKET, BY APPLICATION, 2024–2029 (USD MILLION)
- TABLE 344 ARGENTINA: BROMINE MARKET, BY APPLICATION, 2019–2023 (KILOTON)
- TABLE 345 ARGENTINA: BROMINE MARKET, BY APPLICATION, 2024–2029 (KILOTON)
- TABLE 346 REST OF SOUTH AMERICA: BROMINE MARKET, BY DERIVATIVE, 2019–2023 (USD MILLION)
- TABLE 347 REST OF SOUTH AMERICA: BROMINE MARKET, BY DERIVATIVE, 2024–2029 (USD MILLION)
- TABLE 348 REST OF SOUTH AMERICA: BROMINE MARKET, BY DERIVATIVE, 2019–2023 (KILOTON)
- TABLE 349 REST OF SOUTH AMERICA: BROMINE MARKET, BY DERIVATIVE, 2024–2029 (KILOTON)
- TABLE 350 REST OF SOUTH AMERICA: BROMINE MARKET, BY APPLICATION, 2019–2023 (USD MILLION)
- TABLE 351 REST OF SOUTH AMERICA: BROMINE MARKET, BY APPLICATION, 2024–2029 (USD MILLION)
- TABLE 352 REST OF SOUTH AMERICA: BROMINE MARKET, BY APPLICATION, 2019–2023 (KILOTON)
- TABLE 353 REST OF SOUTH AMERICA: BROMINE MARKET, BY APPLICATION, 2024–2029 (KILOTON)
- TABLE 354 BROMINE MARKET: DEGREE OF COMPETITION
- TABLE 355 COMPANY BROMINE DERIVATIVE FOOTPRINT, 2023
- TABLE 356 COMPANY APPLICATION FOOTPRINT, 2023
- TABLE 357 COMPANY END USER FOOTPRINT, 2023
- TABLE 358 COMPANY REGIONAL FOOTPRINT, 2023
- TABLE 359 BROMINE MARKET: KEY STARTUPS/SMES
- TABLE 360 BROMINE MARKET: COMPETITIVE BENCHMARKING OF KEY STARTUPS/SMES
- TABLE 361 BROMINE MARKET: PRODUCT LAUNCHES/DEVELOPMENTS, JANUARY 2017?APRIL 2024
- TABLE 362 BROMINE MARKET: DEALS, JANUARY 2017?APRIL 2024
- TABLE 363 BROMINE MARKET: EXPANSIONS, JANUARY 2017?APRIL 2024
- TABLE 364 ICL GROUP LIMITED: BUSINESS OVERVIEW
- TABLE 365 ICL GROUP LIMITED: PRODUCTS/SOLUTIONS/SERVICES OFFERED
- TABLE 366 ICL GROUP LIMITED: PRODUCT LAUNCHES, JANUARY 2017?APRIL 2024
- TABLE 367 ICL GROUP LIMITED: EXPANSIONS, JANUARY 2017?APRIL 2024
- TABLE 368 ALBEMARLE CORPORATION: COMPANY OVERVIEW
- TABLE 369 ALBEMARLE CORPORATION: PRODUCTS/SOLUTIONS/SERVICES OFFERED
- TABLE 370 ALBEMARLE CORPORATION: EXPANSIONS, JANUARY 2017?APRIL 2024
- TABLE 371 LANXESS AG: COMPANY OVERVIEW
- TABLE 372 LANXESS AG: PRODUCTS/SOLUTIONS/SERVICES OFFERED
- TABLE 373 LANXESS AG: PRODUCT LAUNCHES, JANUARY 2017?APRIL 2024
- TABLE 374 TOSOH CORPORATION: COMPANY OVERVIEW
- TABLE 375 TOSOH CORPORATION: PRODUCTS/SOLUTIONS/SERVICES OFFERED
- TABLE 376 TOSOH CORPORATION: EXPANSIONS, JANUARY 2017?APRIL 2024
- TABLE 377 GULF RESOURCES INC.: COMPANY OVERVIEW
- TABLE 378 GULF RESOURCES INC.: PRODUCTS/SOLUTIONS/SERVICES OFFERED
- TABLE 379 GULF RESOURCES INC.: EXPANSIONS, JANUARY 2017?APRIL 2024
- TABLE 380 TETRA TECHNOLOGIES, INC.: COMPANY OVERVIEW
- TABLE 381 TETRA TECHNOLOGIES, INC.: PRODUCTS/SOLUTIONS/SERVICES OFFERED
- TABLE 382 TETRA TECHNOLOGIES, INC.: DEALS, JANUARY 2017?APRIL 2024
- TABLE 383 TATA CHEMICALS LIMITED: COMPANY OVERVIEW
- TABLE 384 TATA CHEMICALS LIMITED.: PRODUCTS/SOLUTIONS/SERVICES OFFERED
- TABLE 385 HINDUSTAN SALTS LIMITED: COMPANY OVERVIEW
- TABLE 386 HINDUSTAN SALTS LIMITED: PRODUCTS/SOLUTIONS/SERVICES OFFERED
- TABLE 387 HONEYWELL INTERNATIONAL INC.: COMPANY OVERVIEW
- TABLE 388 HONEYWELL INTERNATIONAL INC.: PRODUCTS/SOLUTIONS/SERVICES OFFERED
- TABLE 389 HONEYWELL INTERNATIONAL INC.: DEALS, JANUARY 2017? APRIL 2024
- TABLE 390 ARCHEAN CHEMICAL INDUSTRIES LTD: COMPANY OVERVIEW
- TABLE 391 ARCHEAN CHEMICAL INDUSTRIES LTD: PRODUCTS/SOLUTIONS/SERVICES OFFERED
- TABLE 392 ARCHEAN CHEMICAL INDUSTRIES LTD: EXPANSIONS, JANUARY 2017? APRIL 2024
- TABLE 393 AGROCEL INDUSTRIES PVT LTD.: COMPANY OVERVIEW
- TABLE 394 AGROCEL INDUSTRIES PVT LTD.: PRODUCTS/SOLUTIONS/SERVICES OFFERED
- TABLE 395 AGROCEL INDUSTRIES PVT LTD.: DEALS, JANUARY 2017? APRIL 2024
- TABLE 396 PEREKOP BROMINE: COMPANY OVERVIEW
- TABLE 397 PEREKOP BROMINE: COMPANY PRODUCTS/SOLUTIONS/SERVICES
- TABLE 398 SATYESH BRINECHEM PVT. LTD.: COMPANY OVERVIEW
- TABLE 399 SATYESH BRINECHEM PVT. LTD.: PRODUCTS/SOLUTIONS/SERVICES OFFERED
- TABLE 400 MORRE-TEC INDUSTRIES INC.: COMPANY OVERVIEW
- TABLE 401 SHANDONG YUYUAN GROUP CO., LTD.: COMPANY OVERVIEW
- TABLE 402 SHANDONG HAIWANG CHEMICAL CO., LTD.: COMPANY SNAPSHOT
- TABLE 403 SHANDONG HAIHUA GROUP CO., LTD.: COMPANY SNAPSHOT
- TABLE 404 SHANDONG OCEAN CHEMICAL CO., LTD.: COMPANY SNAPSHOT
- TABLE 405 SHANDONG WEIFANG LONGWEI INDUSTRIAL CO., LTD.: COMPANY SNAPSHOT
- TABLE 406 SHANDONG RUNKE CHEMICAL ENGINEERING CO., LTD.: COMPANY SNAPSHOT
- TABLE 407 DHRUV CHEM INDUSTRIES: COMPANY SNAPSHOT
- TABLE 408 SHANDONG LUBEI CHEMICAL CO., LTD.: COMPANY SNAPSHOT
- TABLE 409 SHANDONG HAOYUAN GROUP: COMPANY SNAPSHOT
- TABLE 410 CHEMCON SPECIALITY CHEMICALS LTD.: COMPANY OVERVIEW
- TABLE 411 SANGFROID CHEMICALS PVT. LTD.: COMPANY OVERVIEW
- TABLE 412 CHEMADA INDUSTRIES LTD.: COMPANY OVERVIEW
- TABLE 413 VINYL KFT.: COMPANY OVERVIEW
- TABLE 414 FLAME RETARDANTS MARKET, BY TYPE, 2017–2021 (KILOTON)
- TABLE 415 FLAME RETARDANTS MARKET, BY TYPE, 2022–2028 (KILOTON)
- TABLE 416 FLAME RETARDANTS MARKET, BY TYPE, 2017–2021 (USD MILLION)
- TABLE 417 FLAME RETARDANTS MARKET, BY TYPE, 2022–2028 (USD MILLION)
- TABLE 418 ALUMINUM TRIHYDRATE: FLAME RETARDANTS MARKET, BY REGION, 2017–2021 (KILOTON)
- TABLE 419 ALUMINUM TRIHYDRATE: FLAME RETARDANTS MARKET, BY REGION, 2022–2028 (KILOTON)
- TABLE 420 ALUMINUM TRIHYDRATE: FLAME RETARDANTS MARKET, BY REGION, 2017–2021 (USD MILLION)
- TABLE 421 ALUMINUM TRIHYDRATE: FLAME RETARDANTS MARKET, BY REGION, 2022–2028 (USD MILLION)
- FIGURE 1 BROMINE MARKET SEGMENTATION
- FIGURE 2 BROMINE MARKET: REGIONS COVERED
- FIGURE 3 BROMINE MARKET: RESEARCH DESIGN
- FIGURE 4 BREAKDOWN OF INTERVIEWS WITH EXPERTS BY COMPANY TYPE, DESIGNATION, AND REGION
- FIGURE 5 MARKET SIZE ESTIMATION: BOTTOM-UP APPROACH
- FIGURE 6 MARKET SIZE ESTIMATION: TOP-DOWN APPROACH
- FIGURE 7 MARKET BREAKDOWN AND DATA TRIANGULATION
- FIGURE 8 ORGANOBROMINE DERIVATIVE TO DOMINATE MARKET IN 2024
- FIGURE 9 FLAME RETARDANTS APPLICATION LED MARKET IN 2023
- FIGURE 10 ASIA PACIFIC TO WITNESS HIGHEST GROWTH DURING FORECAST PERIOD
- FIGURE 11 GROWING DEMAND FOR FLAME RETARDANTS AND OIL & GAS DRILLING TO DRIVE MARKET DURING FORECAST PERIOD
- FIGURE 12 HYDROGEN BROMIDE TO BE FASTEST-GROWING DERIVATIVE SEGMENT DURING FORECAST PERIOD
- FIGURE 13 ORGANOBROMINE AND CHINA ACCOUNTED FOR LARGEST MARKET SHARE
- FIGURE 14 CHINA, INDIA, AND JAPAN TO OFFER LUCRATIVE OPPORTUNITIES DURING FORECAST PERIOD
- FIGURE 15 DRIVERS, RESTRAINTS, OPPORTUNITIES, AND CHALLENGES IN BROMINE MARKET
- FIGURE 16 GLOBAL VALUATION OF RETAIL APPAREL (TEXTILE) INDUSTRY
- FIGURE 17 GLOBAL USERS OF CONSUMER ELECTRONIC PRODUCTS
- FIGURE 18 CRUDE OIL PRICES, USD/BARREL (2013–2023)
- FIGURE 19 PORTER’S FIVE FORCES ANALYSIS
- FIGURE 20 AVERAGE SELLING PRICES OF BROMINE OFFERED BY KEY PLAYERS (USD/TON)
- FIGURE 21 AVERAGE SELLING PRICE OF BROMINE, BY REGION (USD/TON)
- FIGURE 22 CURRENT SCENARIO ON PRODUCTION AND CONSUMPTION OF BROMINATED FLAME RETARDANTS IN DIFFERENT REGIONS
- FIGURE 23 VALUE CHAIN ANALYSIS: BROMINE MARKET
- FIGURE 24 REVENUE SHIFT AND NEW REVENUE POCKETS FOR BROMINE MANUFACTURERS
- FIGURE 25 INDUSTRIAL-SCALE PRODUCTION FOR BROMINE
- FIGURE 26 ECOSYSTEM MAP: BROMINE MARKET
- FIGURE 27 LIST OF MAJOR PATENTS FOR INSULATED PRODUCTS
- FIGURE 28 INFLUENCE OF STAKEHOLDERS ON BUYING PROCESS FOR TOP THREE APPLICATIONS
- FIGURE 29 KEY BUYING CRITERIA, BY APPLICATION
- FIGURE 30 INVESTOR DEALS AND FUNDING IN BROMINE MARKET 2021–2023
- FIGURE 31 MOST VALUED BROMINE MANUFACTURERS IN 2024 (USD BILLION)
- FIGURE 32 ORGANOBROMINE TO ACCOUNT FOR LARGEST MARKET SHARE DURING FORECAST PERIOD
- FIGURE 33 FLAME RETARDANTS TO DOMINATE DURING FORECAST PERIOD
- FIGURE 34 REGIONAL SNAPSHOT
- FIGURE 35 ASIA PACIFIC: BROMINE MARKET SNAPSHOT
- FIGURE 36 NORTH AMERICA: BROMINE MARKET SNAPSHOT
- FIGURE 37 WESTERN EUROPE: BROMINE MARKET SNAPSHOT
- FIGURE 38 TOP FIVE PLAYERS—REVENUE ANALYSIS (2019–2023)
- FIGURE 39 ICL GROUP ACCOUNTED FOR LARGEST SHARE OF BROMINE MARKET IN 2023
- FIGURE 40 RANKING OF TOP FIVE PLAYERS IN BROMINE MARKET, 2023
- FIGURE 41 BROMINE MARKET: BRAND/PRODUCT COMPARISON
- FIGURE 42 BROMINE MARKET: COMPANY EVALUATION MATRIX (KEY PLAYERS), 2023
- FIGURE 43 BROMINE MARKET: OVERALL, COMPANY FOOTPRINT
- FIGURE 44 BROMINE MARKET: COMPANY EVALUATION MATRIX (STARTUPS/SMES), 2023
- FIGURE 45 EV/EBITDA OF KEY BROMINE MANUFACTURERS
- FIGURE 46 YEAR-TO-DATE (YTD) PRICE TOTAL RETURN AND 5-YEAR STOCK BETA OF KEY MANUFACTURERS
- FIGURE 47 ICL GROUP LIMITED: COMPANY SNAPSHOT
- FIGURE 48 ALBEMARLE CORPORATION: COMPANY SNAPSHOT
- FIGURE 49 LANXESS AG: COMPANY SNAPSHOT
- FIGURE 50 TOSOH CORPORATION: COMPANY SNAPSHOT
- FIGURE 51 GULF RESOURCES INC.: COMPANY SNAPSHOT
- FIGURE 52 TETRA TECHNOLOGIES, INC.: COMPANY SNAPSHOT
- FIGURE 53 TATA CHEMICALS LIMITED: COMPANY SNAPSHOT
- FIGURE 54 HINDUSTAN SALTS LIMITED: COMPANY SNAPSHOT
- FIGURE 55 HONEYWELL INTERNATIONAL INC.: COMPANY SNAPSHOT
- FIGURE 56 ARCHEAN CHEMICAL INDUSTRIES LTD: COMPANY SNAPSHOT
The study involved four major activities in estimating the current size of the bromine market: extensive secondary research collected information on the market, peer, and parent markets. The next step was to validate these findings, assumptions, and measures with industry experts across the bromine value chain through primary research. Both top-down and bottom-up approaches were employed to estimate the total market size. After that, market breakdown and data triangulation were used to estimate the size of the segments and sub-segments of the market.
Secondary Research
The research methodology used to estimate and forecast the access control market begins with capturing data on the revenues of key vendors in the market through secondary research. In the secondary research process, various secondary sources, such as Hoovers, Bloomberg BusinessWeek, Factiva, World Bank, and Industry Journals, were referred to to identify and collect information for this study. These secondary sources included annual reports, press releases, investor presentations of companies, white papers, certified publications, articles by recognized authors, notifications by regulatory bodies, trade directories, and databases. Vendor offerings have also been taken into consideration to determine market segmentation.
Primary Research
The bromine market comprises several stakeholders in the supply chain, such as manufacturers, end-users, traders, associations, and regulatory organizations. The development of various end-use industries characterizes the demand side of this market. Various primary sources from the supply and demand sides of the market were interviewed to obtain qualitative and quantitative information. Following is the breakdown of the primary respondents:
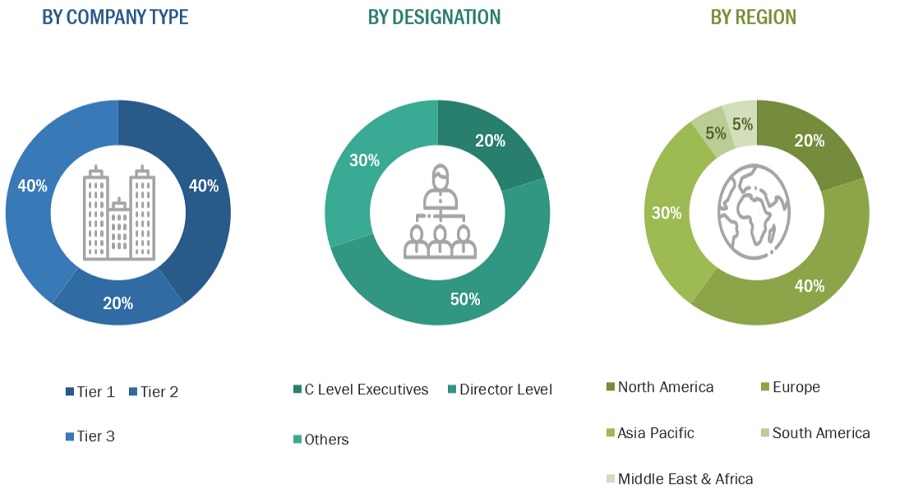
Note: “Others” includes sales, marketing, and product managers
To know about the assumptions considered for the study, download the pdf brochure
Market Size Estimation
The top-down and bottom-up approaches were used to estimate and validate the total size of the bromine market. These methods were also used extensively to determine the market size of various segments. The research methodology used to estimate the market size included the following:
- The key players were identified through extensive primary and secondary research.
- Primary and secondary research determined the value chain and market size of the bromine market in terms of value and volume.
- All percentage shares, splits, and breakdowns were determined using secondary sources and verified through primary sources.
- All possible parameters that affect the market covered in this research study were accounted for, viewed in extensive detail, verified through primary research, and analyzed to obtain the final quantitative and qualitative data.
- The research included the study of reports, reviews, and newsletters of top market players, along with extensive interviews for opinions from key leaders, such as CEOs, directors, and marketing executives.
Global Bromine Market Size: Bottom-Up Approach
To know about the assumptions considered for the study, Request for Free Sample Report
Global Bromine Market Size: Top-Down Approach
Data Triangulation
After arriving at the overall market size using the market size estimation processes explained above, the market was split into several segments and subsegments. Data triangulation and market breakdown procedures were employed to complete the overall market engineering process and determine each market segment’s and subsegment’s exact statistics. The market size was calculated globally by summing up the country-level and regional-level data.
Market Definition
The bromine market refers to the commercial ecosystem centered around the production, distribution, and utilization of bromine and its derivatives. This market encompasses the extraction of bromine from natural sources such as brine wells and seawater, its processing into various forms including elemental bromine and bromine compounds, and its application across diverse industries such as pharmaceuticals, chemicals, electronics, and flame retardants. Key aspects of the bromine market include supply-demand dynamics, pricing trends, regulatory frameworks, technological advancements, and global trade flows.
Key Stakeholder
- Manufacturers of bromine
- Traders, distributors, and suppliers of bromine
- Government and research organizations
- Associations and industrial bodies
- Research and consulting firms
- R&D institutions
- Environment support agencies
- Investment banks and private equity firms
Report Objectives:
- To define, describe, and forecast the size of the global bromine market in terms of value and volume
- To provide detailed information regarding the key factors, such as drivers, restraints, opportunities, and industry-specific challenges, influencing the growth of the bromine market.
- To analyze and forecast the size of various segments (material type, insulation type, and end-use industry) of the bromine market based on six major regions—North America, Western Europe, Eastern & Central Europe, Asia Pacific, South America, Middle East & Africa—along with key countries
- To analyze recent developments and competitive strategies, such as expansions, new product developments, partnerships, and acquisitions, product launches to draw the competitive landscape of the market
- To strategically profile the key players in the market and comprehensively analyze their core competencies
Available Customizations:
With the given market data, MarketsandMarkets offers customizations according to client-specific needs. The following customization options are available for the report:
- Additional country-level analysis of the bromine market
- Profiling of additional market players (up to 5)
- Product matrix, which gives a detailed comparison of the product portfolio of each company.
Growth opportunities and latent adjacency in Bromine Market
Interested in the bromine market report
Interested in inforamtion about the market size of Bromine and its demand in Upcoming years
General information on innovative products, technology and market trends at all in the bromine and bromine derivative
Bromine FR additives market Analysis by Application matrix, by end-use industry
Need sample tables before purchasing a Bromine market report and interested in section of the report/selected pages
Specifically, we are trying to ascertain the impact that our technology could have on the bromine industry.
interested in project report of bromine production plant based on Bittern (salt)
Interested in Bromine Market Report
Information about list of bromine producers, selling companies, prices.