Biorational Pesticides Market by Source (Botanical, Microbial, Non-organic), Type (Biorational Insecticides, Biorational Fungicides, Biorational Nematicides, Biorational Herbicides), Mode of Application, Formulation and Region - Global Forecast to 2028
Biorational Pesticides Market Outlook (2023-2028)
The global biorational pesticides market size is estimated to stand at US$ 7.5 billion in 2023. The market is expected to reach to a generous valuation of US$ 15.1 billion by 2028, registering an impressive CAGR of 15.2%.
The growing awareness about the harmful effects of synthetic pesticides on human health and the environment has led to a rising demand for biorational pesticides.
To know about the assumptions considered for the study, Request for Free Sample Report
To know about the assumptions considered for the study, download the pdf brochure
Biorational Pesticides Market Growth Insights
DRIVER : Chemical pesticide ban and awareness programs by government
The detrimental impact of chemical pesticides on soil, the environment, and water bodies globally has spurred a push towards promoting biopesticides in agriculture. This promotion involves awareness campaigns and policies fostering a favorable environment for private sector involvement. In South America, Asia Pacific, and Europe, rapid market growth is observed, driven by campaigns encouraging increased adoption and production of biorational pesticides at both farmer and producer levels.
In North America, the markets for bioinsecticides, biofungicides, and bionematicides—subcategories of biopesticides—are overseen by the Environmental Protection Agency (EPA). The EPA regulates registration and monitors their effects on humans and the environment. Sale and distribution permits for biopesticides fall under the jurisdiction of the Federal Insecticide, Fungicide, and Rodenticide Act (FIFRA), ensuring safety under the Federal Food, Drug, and Cosmetic Act (FFDCA) for residue-free food and feed.
In India, the Government has initiated the use of bioinsecticides as part of Integrated Pest Management (IPM), employing cultural, mechanical, and biological pest control methods. This approach, along with judicious use of chemical pesticides as needed, is promoted by Central Integrated Pest Management Centers (CIPMCs) through programs like Farmers Field Schools and training initiatives. Such governmental initiatives are pivotal in driving the market for biorational pesticides, particularly bioinsecticides, by emphasizing sustainable pest management practices.
Restraint : Less effectiveness can hamper market growth
Biological insecticides, when compared to synthetic pesticides, often exhibit lower efficacy. This suggests the potential need for more frequent applications or higher concentrations to achieve comparable pest control levels. Increased application frequency or stronger doses of biorational pesticides may elevate the overall cost of pest management. Consequently, this factor could diminish the attractiveness of biorational insecticides for specific customers and companies.
In contrast to synthetic pesticides, biological alternatives might lack specific targeting, affecting both beneficial organisms and pests, resulting in a broader range of impact. Additionally, biological insecticides might be more susceptible to environmental factors such as UV rays, pH levels, and temperature fluctuations. These environmental elements have the potential to influence their effectiveness and persistence, potentially impacting their overall efficacy in pest control.
Opportunity: Advancements in microbial research undertaken by key players across regions
Advancements made by companies like Bayer AG (Germany) in microbial and RNA interference (RNAi) technology offer promising opportunities in the biorational pesticides market. Significant research efforts by major industry players in crop protection have paved the way for utilizing biological signals to activate RNAi-specific genes. This innovation holds potential for enhancing disease and pest resistance while boosting crop yield and quality. The focus on developing sprayable RNAi products for biological crop protection is a notable advancement. Monsanto Company (prior to its acquisition by Bayer) received EPA approval in 2017 for genetic engineering technology utilizing RNA interference to combat insect pests. Additionally, Corteva Agriscience (US) acquired licenses for two insect traits from Monsanto, featuring an RNAi rootworm trait. This technology's increased adoption within the industry presents a novel solution particularly beneficial for managing rootworm traits.
Overall, the integration of RNA interference technology into biorational pesticides signifies a promising opportunity. It offers the potential for more effective and targeted pest control while aligning with environmentally friendly practices in crop protection.
Challenge: The challenge of swift pest control in biorational pesticides
Swift control in biorational pesticides presents a challenge in effectively managing pests using eco-friendly or naturally derived pesticides while ensuring rapid and efficient pest eradication. Biorational pesticides often target specific pests or have limited effectiveness across diverse pest populations or multiple pest species in a single area. This specificity can be a limitation. Moreover, these pesticides might not act as swiftly as conventional synthetic pesticides, requiring more time to impact target pests or eradicate infestations. This delay in action can be problematic, especially when immediate control is needed to prevent extensive damage to crops or property.
The slower effectiveness of biorational pesticides in contrast to synthetic options can pose a drawback in the market. In scenarios where urgent pest control is essential, synthetic pesticides could be favored, reducing the demand for biorational alternatives. The challenges in both speed and range of effectiveness underscore the necessity for continual research and development in biorational pesticides. Enhancing their efficiency, expanding their target range, and accelerating their action time could significantly boost their market appeal and adoption.
Biorational Pesticides Market Ecosystem
Prominent companies in this market include well-established, financially stable manufacturers of biorational pesticides. These companies have been operating in the market for several years and possess a diversified product portfolio, state-of-the-art technologies, and strong global sales and marketing networks. Prominent companies in this market include BASF SE (Germany), Bayer AG (Germany), UPL (India), FMC Corporation (US), Syngenta AG (Switzerland), Novozymes A/S (Denmark), Sumitomo Chemical Co., Ltd (Japan), Pro Farm Group Inc (US), Koppert (Netherlands), Valent BioSciences LLC (US), Gowan Company (US), Certis Biologicals (US), Biobest Group (Belgium), BIONEMA (UK), and Vestaron Corporation (US).
The anticipated increase in the use of foliar application is expected to be a key factor propelling the growth of the biorational pesticides market.
In the biorational pesticides market, foliar spraying stands out as a preferred method due to its precision in directly targeting plant pests where they commonly inhabit—on the leaves. This targeted approach ensures effective pest control, aligning with the core principles of biorational pesticides that prioritize eco-friendly, efficient, and specific pest management strategies. The direct application of biorational pesticides through foliar spraying allows for a more focused and efficient utilization of these environmentally friendly solutions, reducing the impact on non-target organisms.
Furthermore, the versatility of foliar application across diverse crop types and growth stages enhances its appeal in the market. This adaptability enables farmers to employ biorational solutions in various agricultural settings, aligning with sustainable pest management practices. The reduced volumes of pesticides used in foliar sprays, compared to alternative methods like soil drench or seed treatments, align with the biorational pesticides' emphasis on minimizing environmental impact and promoting sustainability. The quick absorption capabilities of leaves further support the rapid action of biorational pesticides, facilitating quicker pest control, which is beneficial in the context of integrated pest management strategies. Ultimately, the ease of application and convenience associated with foliar sprays contribute significantly to the adoption of biorational pesticides, offering a viable and practical pest control solution for farmers and applicators in the biorational pesticides market.
The utilization of microbials in the production of biorational pesticides is anticipated to drive market growth.
The expansion of the biorational pesticides market involves utilizing microbials like bacteria, fungi, viruses, and protozoa to develop environmentally friendly solutions for pest control. These microorganisms function with precise modes of action, targeting pests while minimizing harm to the environment and non-target organisms. They're incorporated into diverse formulations, including microbial-based insecticides, fungicides, and nematicides.
For instance, Bacillus thuringiensis (Bt), a renowned microbial insecticide, demonstrates the market's focus on eco-friendly solutions. Its production of insect-toxic proteins specifically targets certain pests while remaining harmless to humans, animals, and beneficial insects. Bt-based products, effectively employed in agriculture and mosquito control programs globally, exemplify the market's trend towards sustainable pest control measures.
The biorational pesticides market in Asia Pacific is projected to grow at highest CAGR during the forecast period.
The Asia Pacific region is anticipated to witness the highest Compound Annual Growth Rate (CAGR) in the market during the forecast period from 2023 to 2028 due to several factors driving the adoption of eco-friendly pest control solutions. Japan's "Organic Village" initiative, led by the Ministry of Agriculture, Forestry and Fisheries (MAFF), aims to significantly increase the organic share to 25 percent by 2050. This initiative reflects a strategic effort to promote organic farming practices, likely contributing to the rising demand for biorational pesticides in the region.
Moreover, there's a growing emphasis on organic and sustainable agricultural practices in China as highlighted in the “14th Five-Year Plan for National Economic and Social Development.” The plan emphasizes enhancing the green agricultural standard system and bolstering certification management for green food, organic products, and geographical indications of agricultural produce. This commitment signifies a shift towards eco-friendly farming methods, which can drive the demand for biorational pesticides in China and subsequently influence the Asia Pacific market's growth trajectory.
Additionally, the involvement of local organic groups and non-governmental organizations (NGOs) advocating for the use of organic food ingredients in school meals in Japan indicates a broader societal shift towards organic and sustainable agricultural practices. These initiatives align with the principles underlying the adoption of biorational pesticides, further contributing to the region's market expansion in the forecast period. Overall, the Asia Pacific's growth in the biorational pesticides market can be attributed to concerted efforts by governments and organizations towards promoting eco-friendly and sustainable agriculture practices, fostering a conducive environment for the increased adoption of biorational pest control solutions.
Key Players in Biorational Pesticides Market
The key players in this include BASF SE (Germany), Bayer AG (Germany), UPL (India), FMC Corporation (US), Syngenta AG (Switzerland), Novozymes A/S (Denmark), Sumitomo Chemical Co., Ltd (Japan), Pro Farm Group Inc (US), Koppert (Netherlands), Valent BioSciences LLC (US), Gowan Company (US), Certis Biologicals (US), Biobest Group (Belgium), BIONEMA (UK), and Vestaron Corporation (US). These players in this market are focusing on increasing their presence through agreements and collaborations. These companies have a strong presence in North America, Asia Pacific and Europe. They also have manufacturing facilities along with strong distribution networks across these regions.
Biorational Pesticides Market Scope
Report Metric |
Details |
Market Valuation in 2023 |
USD 7.5 Billion |
Revenue Forecast in 2028 |
USD 15.1 Billion |
Growth Rate |
CAGR of 15.2% |
Forecast Period Considered |
2023–2028 |
Segments Covered |
By Type, Crop Type, Source, Mode of Application, Formulation, and Region |
Regions covered |
North America, Europe, Asia Pacific, and RoW |
Companies studied |
|
This research report categorizes the biorational pesticides market, based on type, crop type, source, mode of application, formulation, and region.
Target Audience
- Biorational pesticide traders, retailers, and distributors
- Agriculture pesticide manufacturers & suppliers
- Related government authorities, commercial research & development (R&D) institutions, FDA, EFSA, USDA government agencies & NGOs, and other regulatory bodies
- Regulatory bodies, including government agencies and NGOs.
- Commercial research & development (R&D) institutions and financial institutions
- Government and research organizations
- Venture capitalists and investors
- Technology providers to biorational pesticide & microbial companies
- Associations and industry bodies
Biorational Pesticides Market Segmentation
By Type
- Biorational Insecticides
- Biorational Fungicides
- Biorational Nematicides
- Biorational Herbicides
- Other Types
By Crop Type
- Fruits & Vegetables
- Cereals & Grains
- Oil Seeds & Pulses
- Other Crop Types
By Source
- Botanical
- Microbials
- Non-Organic
- Other Sources
By Mode of Application
- Foliar Spray
- Soil Treatment
- Seed Treatment
- Other Modes of Applications
By Formulation
- Liquid
- Dry
By Region:
- North America
- Europe
- Asia Pacific
- Rest of the World (RoW)
Recent Developments
- In January 2023, Valent BioSciences LLC, known for its expertise in creating environmentally friendly and highly efficient technologies for agriculture, public health, and forest health, has confirmed the acquisition of FBSciences Holdings, Inc. This move solidifies their position in the market as a leader in developing and marketing naturally derived solutions for plant, soil, and climate health. Through this acquisition, Valent BioSciences, along with its parent company Sumitomo Chemical Co., Ltd., now presents a comprehensive lineup of integrated biorational solutions. This includes a proven portfolio encompassing biostimulants, biopesticides, and crop nutrition solutions.
- In January 2022, Certis Biologicals had launched MeloCon LC (Active Ingredient: Purpureocilium lilacinum strain 251), a water dispersible concentrate that contained spores from a naturally occurring soil fungus, targeting a wide range of harmful nematodes at various lifecycle stages. The improved liquid concentrate formulation of MeloCon LC brought several advantages to growers operating both organic and conventional acreage. This liquid formula provided increased convenience in storage, handling, and tank-mixing, allowing for application flexibility in situations where fumigant and conventional chemistries were unsuitable.
- In April 2021, FMC Corporation established a distribution partnership with Syngenta Crop Protection to market innovative biological seed treatments in Canada.
Frequently Asked Questions (FAQ):
Which are the major companies in the biorational pesticides market? What are their major strategies to strengthen their market presence?
The key players in this include BASF SE (Germany), Bayer AG (Germany), UPL (India), FMC Corporation (US), Syngenta AG (Switzerland), Novozymes A/S (Denmark), Sumitomo Chemical Co., Ltd (Japan), Pro Farm Group Inc (US), Koppert (Netherlands), Valent BioSciences LLC (US), Gowan Company (US), Certis Biologicals (US), Biobest Group (Belgium), BIONEMA (UK), and Vestaron Corporation (US). These players in this market are focusing on increasing their presence through agreements and collaborations. These companies have a strong presence in North America, Asia Pacific and Europe. They also have manufacturing facilities along with strong distribution networks across these regions.
What are the drivers and opportunities for the biorational pesticides market?
Government regulations that advocate for eco-friendly products and seek to minimize the usage of chemical pesticides are stimulating the biorational pesticides market. Regulatory backing serves as a catalyst for fostering innovation and acceptance. The implementation of integrated pest management tactics, which amalgamate diverse pest control techniques, including biorational pesticides, represents a promising avenue for market expansion. These comprehensive approaches are garnering increased recognition on a global scale.
Which region is expected to hold the highest market share?
Increased consumer preference for organic produce has amplified the need for biorational pesticides, approved for organic farming. This surge is propelled by consumers' inclination towards chemical-free and organic products, thus augmenting the market for biorational solutions. Regulatory bodies in North America are increasingly prioritizing and advocating eco-friendly pest control methods. Policies that endorse the decrease in chemical pesticide usage and endorse biorational alternatives have driven the demand for these products.
Which are the key technology trends prevailing in the biorational pesticides market?
Incorporating sustainable and eco-friendly production methods, known as green synthesis methodologies, into the manufacturing of biorational pesticides helps diminish their environmental footprint. The development and use of biorational pesticides may be revolutionized by nanotechnology. These tiny particles may have properties like larger surface area, better solubility, and higher stability. Using nanotechnology in crop protection has several benefits, like improved delivery of the active components to the desired pests or illnesses.
What is the total CAGR expected to be recorded for the biorational pesticides market during 2023-2028?
The CAGR is expected to record as of 15.2 % from 2023-2028.
To speak to our analyst for a discussion on the above findings, click Speak to Analyst
Exclusive indicates content/data unique to MarketsandMarkets and not available with any competitors.
- 5.1 INTRODUCTION
-
5.2 MACROECONOMIC INDICATORSGROWTH IN ORGANIC AGRICULTURAL PRACTICESINCREASING PEST ATTACKS ON FRUIT AND VEGETABLE CROPSRELUCTANCE IN ADOPTING HARMFUL CHEMICAL PESTICIDES IN DEVELOPED MARKETS
-
5.3 MARKET DYNAMICSDRIVERS- High costs associated with development of new synthetic crop protection products- Chemical pesticide bans and awareness programs by government agencies- Increase in acceptance of organic food productsRESTRAINTS- Technological limitations for use of biological products- Ineffectiveness of biological insecticidesOPPORTUNITIES- Advancements in microbial research undertaken by key players across regions- Resistance of pests to crop protection chemicals- Rising consumption of pesticides in developing countriesCHALLENGES- Preference for chemical pesticides in developing countries- Delayed effect of biorational pesticides on pests
- 6.1 INTRODUCTION
- 6.2 VALUE CHAIN ANALYSIS
- 6.3 SUPPLY CHAIN ANALYSIS
- 6.4 ECOSYSTEM ANALYSIS
-
6.5 PORTER’S FIVE FORCES ANALYSISTHREAT OF NEW ENTRANTSTHREAT OF SUBSTITUTESBARGAINING POWER OF SUPPLIERSBARGAINING POWER OF BUYERSINTENSITY OF COMPETITIVE RIVALRY
- 6.6 TRENDS AND DISRUPTIONS IMPACTING CUSTOMERS
- 6.7 KEY CONFERENCES & EVENTS
-
6.8 KEY STAKEHOLDERS & BUYING CRITERIAKEY STAKEHOLDERS IN BUYING PROCESSBUYING CRITERIA
-
6.9 TARIFF AND REGULATORY LANDSCAPEREGULATORY BODIES, GOVERNMENT AGENCIES, AND OTHER ORGANIZATIONSREGULATORY FRAMEWORK- North America- European Union- Asia Pacific- RoW
-
6.10 CASE STUDY ANALYSISKOPPERT BIOLOGICAL SYSTEMS ACQUIRED GEOCOM TO FOCUS ON PRECISION AGRI-FARMINGUPL LAUNCHED FLUPYRIMIN TO PROTECT RICE YIELDS AND BOOST CROP HEALTH
- 7.1 INTRODUCTION
-
7.2 LIQUIDEASE OF APPLICATION TO DRIVE ADOPTION OF LIQUID BIORATIONAL PESTICIDES
-
7.3 DRYEASE OF HANDLING AND LONG SHELF TO BOOST POPULARITY OF DRY BIORATIONAL PESTICIDES
- 8.1 INTRODUCTION
-
8.2 FOLIAR SPRAYEFFECTIVENESS AND EASE OF APPLICATION OF FOLIAR SPRAY TO SPUR ITS DEMAND
-
8.3 SOIL TREATMENTNEED TO DECREASE POTENTIAL IMPACT OF PESTICIDES ON NEIGHBOURING NON-TARGET AREAS TO DRIVE USE OF SOIL TREATMENT PRACTICES
-
8.4 SEED TREATMENTDEMAND FOR MODERN PEST RESISTANCE MANAGEMENT STRATEGIES TO BOOST ADOPTION OF SEED TREATMENT PRACTICES
- 8.5 OTHER MODES OF APPLICATION
- 9.1 INTRODUCTION
-
9.2 BOTANICALPYRETHRIN- Ability of pyrethrin-based pesticides to kill insects to boost demandAZADIRACHTIN & NEEM OIL- Azadirachtin disrupts insect growth cycles and impacts pests like aphids and beetlesROTENONE- Effectivity of rotenone against soilborne pests to boost growthOTHERS
-
9.3 MICROBIALSBACILLUS THURINGIENSIS- Diverse formulations and cost-efficiency of bacillus thuringiensis (Bt) in pest control to drive marketBEAUVERIA BASSIANA- Demand for microbials that control soilborne insects to spur market for beauveria bassianaOTHERS
-
9.4 NON-ORGANICRISING DEMAND FOR EFFECTIVE ALTERNATIVE TO BIOLOGICAL CROP PROTECTION SOLUTIONS TO PROPEL MARKET
- 9.5 OTHER SOURCES
- 10.1 INTRODUCTION
-
10.2 BIORATIONAL INSECTICIDESNEED FOR MAXIMIZING CROP HEALTH AND SUSTAINABILITY TO ENCOURAGE ADOPTION OF BIORATIONAL INSECTICIDES
-
10.3 BIORATIONAL FUNGICIDESEMPHASIS ON ADVANCEMENTS IN FERMENTATION TECHNOLOGY TO SHIFT FOCUS TO BIORATIONAL FUNGICIDES
-
10.4 BIORATIONAL NEMATICIDESINCREASE IN NEMATODE-RELATED ISSUES TO FUEL MARKET FOR BIORATIONAL NEMATICIDES
-
10.5 BIORATIONAL HERBICIDESPREFERENCE FOR ECO-FRIENDLY ALTERNATIVES TO SYNTHETIC HERBICIDES TO BOOST GROWTH
- 10.6 OTHER BIORATIONAL PESTICIDES
- 11.1 INTRODUCTION
-
11.2 FRUITS & VEGETABLESHIGH EXPORT OF ORGANIC FRUITS AND VEGETABLES TO BOOST MARKETCITRUS FRUITSBERRIESTOMATOESPOTATOESOTHER FRUITS & VEGETABLES
-
11.3 CEREALS & GRAINSRISING DEMAND FOR CEREALS AND GRAINS FROM HEALTH-CONSCIOUS PEOPLE TO SPUR MARKET GROWTHWHEATRICECORNOTHER CEREALS & GRAINS
-
11.4 OILSEEDS & PULSESINCREASING CONSUMPTION OF OILSEEDS AND PULSES TO PROPEL DEMAND FOR BIORATIONAL PESTICIDESSOYBEANSUNFLOWERCOTTON SEEDOTHER OILSEEDS & PULSES
- 11.5 OTHER CROP TYPES
- 12.1 INTRODUCTION
-
12.2 NORTH AMERICAUS- Government initiatives and organic food market to boost adoption of biorational pesticidesCANADA- Stringent regulations on chemical pesticides to make way for growth of biorational pesticidesMEXICO- Prohibition of chemical pesticides to lead to local production of biorational pesticides
-
12.3 ASIA PACIFICCHINA- Easy registration process and advancements in biomanufacturing to lead to market expansionINDIA- Large-scale production of agricultural commodities to drive market for biorational pesticidesJAPAN- Initiatives by MAFF to encourage development and adoption of biopesticides and associated nature-based technologiesAUSTRALIA- Organic farming expansion to play catalyst for biorational pesticides market’s growthREST OF ASIA PACIFIC
-
12.4 EUROPEFRANCE- Expansion of organic food market to spur demand for biorational pesticidesITALY- Government regulations on chemical pesticides to encourage key players to introduce new biorational productsGERMANY- Sustainable organic farming to create favorable environment for biorational pesticidesSPAIN- Growing demand for enhanced agricultural yield and productivity to propel marketUK- Ban on chemical pesticides and continuous growth in organic farming practices to boost demandREST OF EUROPE
-
12.5 REST OF THE WORLDSOUTH AMERICA- Increasing arable land and sustainable farming methods to encourage market expansionMIDDLE EAST & AFRICA- Rapid use of innovative agricultural practices and large-scale commercial farming to spur growth
- 13.1 INTRODUCTION
- 13.2 MARKET SHARE ANALYSIS
- 13.3 REVENUE ANALYSIS
- 13.4 KEY PLAYERS’ STRATEGIES/RIGHT TO WIN
-
13.5 COMPANY EVALUATION MATRIXSTARSEMERGING LEADERSPERVASIVE PLAYERSPARTICIPANTSCOMPANY FOOTPRINT
-
13.6 START-UP/SME EVALUATION MATRIXPROGRESSIVE COMPANIESRESPONSIVE COMPANIESDYNAMIC COMPANIESSTARTING BLOCKSCOMPETITIVE BENCHMARKING
-
13.7 COMPETITIVE SCENARIO & TRENDSPRODUCT LAUNCHESDEALSOTHERS
-
14.1 KEY PLAYERSUPL- Business overview- Product/Solutions/Services offered- Recent developments- MnM viewFMC CORPORATION- Business overview- Products/Solutions/Services offered- Recent developments- MnM viewBASF SE- Business overview- Products/Solutions/Services offered- Recent developments- MnM viewBAYER AG- Business overview- Products/Solutions/Services offered- Recent developments- MnM viewSYNGENTA AG- Business overview- Products/Solutions/Services offered- Recent developments- MnM viewNOVOZYMES A/S- Business overview- Products/Solutions/Services offered- Recent developments- MnM viewSUMITOMO CHEMICAL CO., LTD.- Business overview- Products/Solutions/Services offered- Recent developments- MnM viewPRO FARM GROUP INC.- Business overview- Products/Solutions/Services offered- Recent developments- MnM viewKOPPERT- Business overview- Products/Solutions/Services offered- Recent developments- MnM viewVALENT BIOSCIENCES LLC- Business overview- Products/Solutions/Services offered- Recent developments- MnM viewGOWAN COMPANY- Business overview- Products/Solutions/Services offered- Recent developments- MnM viewCERTIS BIOLOGICALS- Business overview- Products/Solutions/Services offered- Recent developments- MnM viewBIOBEST GROUP- Business overview- Products/Solutions/Services offered- Recent developments- MnM viewBIONEMA- Business overview- Products/Solutions/Services offered- Recent developments- MnM viewVESTARON CORPORATION- Business overview- Products/Solutions/Services offered- Recent developments- MnM view
-
14.2 OTHER PLAYERSSTK BIO-AG TECHNOLOGIES- Business overview- Products/Solutions/Services offered- Recent developments- MnM viewIPL BIOLOGICALS- Business overview- Products/Solutions/Services offered- Recent developments- MnM viewANDERMATT GROUP AG- Business overview- Products/Solutions/Services offered- Recent developments- MnM viewVEGALAB SA- Business overview- Products/Solutions/Services offered- Recent developments- MnM viewFYTOFEND- Business overview- Products/Solutions/Services offered- Recent developments- MnM viewBIOTALYS NVINNOVATE AGRICULTUREAGRILIFE (INDIA) PRIVATE LIMITEDKAY BEE BIO-ORGANICSLALLEMAND INC.
- 15.1 INTRODUCTION
- 15.2 LIMITATIONS
-
15.3 BIOPESTICIDES MARKETMARKET DEFINITIONMARKET OVERVIEWBIOPESTICIDES MARKET, BY SOURCE
-
15.4 BIOINSECTICIDES MARKETMARKET DEFINITIONMARKET OVERVIEWBIOINSECTICIDES MARKET, BY CROP TYPE
- 16.1 DISCUSSION GUIDE
- 16.2 KNOWLEDGESTORE: MARKETSANDMARKETS’ SUBSCRIPTION PORTAL
- 16.3 CUSTOMIZATION OPTIONS
- 16.4 RELATED REPORTS
- 16.5 AUTHOR DETAILS
- TABLE 1 USD EXCHANGE RATES, 2019–2022
- TABLE 2 RESEARCH ASSUMPTIONS
- TABLE 3 BIORATIONAL PESTICIDES MARKET SNAPSHOT, 2023 VS. 2028
- TABLE 4 LIST OF PLANT PRODUCTS REGISTERED AS BIOPESTICIDES
- TABLE 5 6TH EDITION OF PAN INTERNATIONAL CONSOLIDATED LIST OF BANNED PESTICIDES (MAY 2022)
- TABLE 6 ROLE OF PLAYERS IN MARKET ECOSYSTEM
- TABLE 7 IMPACT OF PORTER’S FIVE FORCES ON BIORATIONAL PESTICIDES MARKET
- TABLE 8 KEY CONFERENCES & EVENTS, 2023–2025
- TABLE 9 INFLUENCE OF STAKEHOLDERS ON BUYING PROCESS FOR TOP 3 MODES OF APPLICATION
- TABLE 10 KEY BUYING CRITERIA FOR TOP 3 TYPES OF BIORATIONAL PESTICIDES
- TABLE 11 NORTH AMERICA: LIST OF REGULATORY BODIES, GOVERNMENT AGENCIES, AND OTHER ORGANIZATIONS
- TABLE 12 EUROPE: LIST OF REGULATORY BODIES, GOVERNMENT AGENCIES, AND OTHER ORGANIZATIONS
- TABLE 13 ASIA PACIFIC: LIST OF REGULATORY BODIES, GOVERNMENT AGENCIES, AND OTHER ORGANIZATIONS
- TABLE 14 ROW: LIST OF REGULATORY BODIES, GOVERNMENT AGENCIES, AND OTHER ORGANIZATIONS
- TABLE 15 BIORATIONAL PESTICIDES MARKET, BY FORMULATION, 2018–2022 (USD MILLION)
- TABLE 16 BIORATIONAL PESTICIDES MARKET, BY FORMULATION, 2023–2028 (USD MILLION)
- TABLE 17 LIQUID: BIORATIONAL PESTICIDES MARKET, BY REGION, 2018–2022 (USD MILLION)
- TABLE 18 LIQUID: BIORATIONAL PESTICIDES MARKET, BY REGION, 2023–2028 (USD MILLION)
- TABLE 19 DRY: BIORATIONAL PESTICIDES MARKET, BY REGION, 2018–2022 (USD MILLION)
- TABLE 20 DRY: BIORATIONAL PESTICIDES MARKET, BY REGION, 2023–2028 (USD MILLION)
- TABLE 21 BIORATIONAL PESTICIDES MARKET, BY MODE OF APPLICATION, 2018–2022 (USD MILLION)
- TABLE 22 BIORATIONAL PESTICIDES MARKET, BY MODE OF APPLICATION, 2023–2028 (USD MILLION)
- TABLE 23 FOLIAR SPRAY: BIORATIONAL PESTICIDES MARKET, BY REGION, 2018–2022 (USD MILLION)
- TABLE 24 FOLIAR SPRAY: BIORATIONAL PESTICIDES MARKET, BY REGION, 2023–2028 (USD MILLION)
- TABLE 25 SOIL TREATMENT: BIORATIONAL PESTICIDES MARKET, BY REGION, 2018–2022 (USD MILLION)
- TABLE 26 SOIL TREATMENT: BIORATIONAL PESTICIDES MARKET, BY REGION, 2023–2028 (USD MILLION)
- TABLE 27 SEED TREATMENT: BIORATIONAL PESTICIDES MARKET, BY REGION, 2018–2022 (USD MILLION)
- TABLE 28 SEED TREATMENT: BIORATIONAL PESTICIDES MARKET, BY REGION, 2023–2028 (USD MILLION)
- TABLE 29 OTHER MODES OF APPLICATION: BIORATIONAL PESTICIDES MARKET, BY REGION, 2018–2022 (USD MILLION)
- TABLE 30 OTHER MODES OF APPLICATION: BIORATIONAL PESTICIDES MARKET, BY REGION, 2023–2028 (USD MILLION)
- TABLE 31 POPULAR BOTANICAL PESTICIDES WITH SOURCES
- TABLE 32 BIORATIONAL PESTICIDES MARKET, BY SOURCE, 2018–2022 (USD MILLION)
- TABLE 33 BIORATIONAL PESTICIDES MARKET, BY SOURCE, 2023–2028 (USD MILLION)
- TABLE 34 BOTANICAL: BIORATIONAL PESTICIDES MARKET, BY REGION, 2018–2022 (USD MILLION)
- TABLE 35 BOTANICAL: BIORATIONAL PESTICIDES MARKET, BY REGION, 2023–2028 (USD MILLION)
- TABLE 36 MICROBIALS: BIORATIONAL PESTICIDES MARKET, BY REGION, 2018–2022 (USD MILLION)
- TABLE 37 MICROBIALS: BIORATIONAL PESTICIDES MARKET, BY REGION, 2023–2028 (USD MILLION)
- TABLE 38 NON-ORGANIC: BIORATIONAL PESTICIDES MARKET, BY REGION, 2018–2022 (USD MILLION)
- TABLE 39 NON-ORGANIC: BIORATIONAL PESTICIDES MARKET, BY REGION, 2023–2028 (USD MILLION)
- TABLE 40 OTHER SOURCES: BIORATIONAL PESTICIDES MARKET, BY REGION, 2018–2022 (USD MILLION)
- TABLE 41 OTHER SOURCES: BIORATIONAL PESTICIDES MARKET, BY REGION, 2023–2028 (USD MILLION)
- TABLE 42 BIORATIONAL PESTICIDES MARKET, BY TYPE, 2018–2022 (USD MILLION)
- TABLE 43 BIORATIONAL PESTICIDES MARKET, BY TYPE, 2023–2028 (USD MILLION)
- TABLE 44 BIORATIONAL INSECTICIDES MARKET, BY REGION, 2018–2022 (USD MILLION)
- TABLE 45 BIORATIONAL INSECTICIDES MARKET, BY REGION, 2023–2028 (USD MILLION)
- TABLE 46 BIORATIONAL FUNGICIDES MARKET, BY REGION, 2018–2022 (USD MILLION)
- TABLE 47 BIORATIONAL FUNGICIDES MARKET, BY REGION, 2023–2028 (USD MILLION)
- TABLE 48 BIORATIONAL NEMATICIDES MARKET, BY REGION, 2018–2022 (USD MILLION)
- TABLE 49 BIORATIONAL NEMATICIDES MARKET, BY REGION, 2023–2028 (USD MILLION)
- TABLE 50 BIORATIONAL HERBICIDES MARKET, BY REGION, 2018–2022 (USD MILLION)
- TABLE 51 BIORATIONAL HERBICIDES MARKET, BY REGION, 2023–2028 (USD MILLION)
- TABLE 52 OTHER BIORATIONAL PESTICIDES MARKET, BY REGION, 2018–2022 (USD MILLION)
- TABLE 53 OTHER BIORATIONAL PESTICIDES MARKET, BY REGION, 2023–2028 (USD MILLION)
- TABLE 54 LIST OF BIOPESTICIDES FOR VARIOUS CROPS
- TABLE 55 BIORATIONAL PESTICIDES MARKET, BY CROP TYPE, 2018–2022 (USD MILLION)
- TABLE 56 BIORATIONAL PESTICIDES MARKET, BY CROP TYPE, 2023–2028 (USD MILLION)
- TABLE 57 FRUITS & VEGETABLES: BIORATIONAL PESTICIDES MARKET, BY REGION, 2018–2022 (USD MILLION)
- TABLE 58 FRUITS & VEGETABLES: BIORATIONAL PESTICIDES MARKET, BY REGION, 2023–2028 (USD MILLION)
- TABLE 59 CEREALS & GRAINS: BIORATIONAL PESTICIDES MARKET, BY REGION, 2018–2022 (USD MILLION)
- TABLE 60 CEREALS & GRAINS: BIORATIONAL PESTICIDES MARKET, BY REGION, 2023–2028 (USD MILLION)
- TABLE 61 OILSEEDS & PULSES: BIORATIONAL PESTICIDES MARKET, BY REGION, 2018–2022 (USD MILLION)
- TABLE 62 OILSEEDS & PULSES: BIORATIONAL PESTICIDES MARKET, BY REGION, 2023–2028 (USD MILLION)
- TABLE 63 OTHER CROP TYPES: BIORATIONAL PESTICIDES MARKET, BY REGION, 2018–2022 (USD MILLION)
- TABLE 64 OTHER CROP TYPES: BIORATIONAL PESTICIDES MARKET, BY REGION, 2023–2028 (USD MILLION)
- TABLE 65 BIORATIONAL PESTICIDES MARKET, BY REGION, 2018–2022 (USD MILLION)
- TABLE 66 BIORATIONAL PESTICIDES MARKET, BY REGION, 2023–2028 (USD MILLION)
- TABLE 67 NORTH AMERICA: LAND USE IN ORGANIC AGRICULTURE, 2021
- TABLE 68 NORTH AMERICA: BIORATIONAL PESTICIDES MARKET, BY COUNTRY, 2018–2022 (USD MILLION)
- TABLE 69 NORTH AMERICA: BIORATIONAL PESTICIDES MARKET, BY COUNTRY, 2023–2028 (USD MILLION)
- TABLE 70 NORTH AMERICA: BIORATIONAL PESTICIDES MARKET, BY TYPE, 2018–2022 (USD MILLION)
- TABLE 71 NORTH AMERICA: BIORATIONAL PESTICIDES MARKET, BY TYPE, 2023–2028 (USD MILLION)
- TABLE 72 NORTH AMERICA: BIORATIONAL PESTICIDES MARKET, BY SOURCE, 2018–2022 (USD MILLION)
- TABLE 73 NORTH AMERICA: BIORATIONAL PESTICIDES MARKET, BY SOURCE, 2023–2028 (USD MILLION)
- TABLE 74 NORTH AMERICA: BIORATIONAL PESTICIDES MARKET, BY MODE OF APPLICATION, 2018–2022 (USD MILLION)
- TABLE 75 NORTH AMERICA: BIORATIONAL PESTICIDES MARKET, BY MODE OF APPLICATION, 2023–2028 (USD MILLION)
- TABLE 76 NORTH AMERICA: BIORATIONAL PESTICIDES MARKET, BY FORMULATION, 2018–2022 (USD MILLION)
- TABLE 77 NORTH AMERICA: BIORATIONAL PESTICIDES MARKET, BY FORMULATION, 2023–2028 (USD MILLION)
- TABLE 78 NORTH AMERICA: BIORATIONAL PESTICIDES MARKET, BY CROP TYPE, 2018–2022 (USD MILLION)
- TABLE 79 NORTH AMERICA: BIORATIONAL PESTICIDES MARKET, BY CROP TYPE, 2023–2028 (USD MILLION)
- TABLE 80 US: BIORATIONAL PESTICIDES MARKET, BY SOURCE, 2018–2022 (USD MILLION)
- TABLE 81 US: BIORATIONAL PESTICIDES MARKET, BY SOURCE, 2023–2028 (USD MILLION)
- TABLE 82 CANADA: BIORATIONAL PESTICIDES MARKET, BY SOURCE, 2018–2022 (USD MILLION)
- TABLE 83 CANADA: BIORATIONAL PESTICIDES MARKET, BY SOURCE, 2023–2028 (USD MILLION)
- TABLE 84 MEXICO: BIORATIONAL PESTICIDES MARKET, BY SOURCE, 2018–2022 (USD MILLION)
- TABLE 85 MEXICO: BIORATIONAL PESTICIDES MARKET, BY SOURCE, 2023–2028 (USD MILLION)
- TABLE 86 ASIA PACIFIC: BIORATIONAL PESTICIDES MARKET, BY COUNTRY, 2018–2022 (USD MILLION)
- TABLE 87 ASIA PACIFIC: BIORATIONAL PESTICIDES MARKET, BY COUNTRY, 2023–2028 (USD MILLION)
- TABLE 88 ASIA PACIFIC: BIORATIONAL PESTICIDES MARKET, BY TYPE, 2018–2022 (USD MILLION)
- TABLE 89 ASIA PACIFIC: BIORATIONAL PESTICIDES MARKET, BY TYPE, 2023–2028 (USD MILLION)
- TABLE 90 ASIA PACIFIC: BIORATIONAL PESTICIDES MARKET, BY SOURCE, 2018–2022 (USD MILLION)
- TABLE 91 ASIA PACIFIC: BIORATIONAL PESTICIDES MARKET, BY SOURCE, 2023–2028 (USD MILLION)
- TABLE 92 ASIA PACIFIC: BIORATIONAL PESTICIDES MARKET, BY MODE OF APPLICATION, 2018–2022 (USD MILLION)
- TABLE 93 ASIA PACIFIC: BIORATIONAL PESTICIDES MARKET, BY MODE OF APPLICATION, 2023–2028 (USD MILLION)
- TABLE 94 ASIA PACIFIC: BIORATIONAL PESTICIDES MARKET, BY FORMULATION, 2018–2022 (USD MILLION)
- TABLE 95 ASIA PACIFIC: BIORATIONAL PESTICIDES MARKET, BY FORMULATION, 2023–2028 (USD MILLION)
- TABLE 96 ASIA PACIFIC: BIORATIONAL PESTICIDES MARKET, BY CROP TYPE, 2018–2022 (USD MILLION)
- TABLE 97 ASIA PACIFIC: BIORATIONAL PESTICIDES MARKET, BY CROP TYPE, 2023–2028 (USD MILLION)
- TABLE 98 CHINA: BIORATIONAL PESTICIDES MARKET, BY SOURCE, 2018–2022 (USD MILLION)
- TABLE 99 CHINA: BIORATIONAL PESTICIDES MARKET, BY SOURCE, 2023–2028 (USD MILLION)
- TABLE 100 INDIA: BIORATIONAL PESTICIDES MARKET, BY SOURCE, 2018–2022 (USD MILLION)
- TABLE 101 INDIA: BIORATIONAL PESTICIDES MARKET, BY SOURCE, 2023–2028 (USD MILLION)
- TABLE 102 JAPAN: BIORATIONAL PESTICIDES MARKET, BY SOURCE, 2018–2022 (USD MILLION)
- TABLE 103 JAPAN: BIORATIONAL PESTICIDES MARKET, BY SOURCE, 2023–2028 (USD MILLION)
- TABLE 104 AUSTRALIA: BIORATIONAL PESTICIDES MARKET, BY SOURCE, 2018–2022 (USD MILLION)
- TABLE 105 AUSTRALIA: BIORATIONAL PESTICIDES MARKET, BY SOURCE, 2023–2028 (USD MILLION)
- TABLE 106 REST OF ASIA PACIFIC: BIORATIONAL PESTICIDES MARKET, BY SOURCE, 2018–2022 (USD MILLION)
- TABLE 107 REST OF ASIA PACIFIC: BIORATIONAL PESTICIDES MARKET, BY SOURCE, 2023–2028 (USD MILLION)
- TABLE 108 EUROPE: BIORATIONAL PESTICIDES MARKET, BY COUNTRY, 2018–2022 (USD MILLION)
- TABLE 109 EUROPE: BIORATIONAL PESTICIDES MARKET, BY COUNTRY, 2023–2028 (USD MILLION)
- TABLE 110 EUROPE: BIORATIONAL PESTICIDES MARKET, BY TYPE, 2018–2022 (USD MILLION)
- TABLE 111 EUROPE: BIORATIONAL PESTICIDES MARKET, BY TYPE, 2023–2028 (USD MILLION)
- TABLE 112 EUROPE: BIORATIONAL PESTICIDES MARKET, BY SOURCE, 2018–2022 (USD MILLION)
- TABLE 113 EUROPE: BIORATIONAL PESTICIDES MARKET, BY SOURCE, 2023–2028 (USD MILLION)
- TABLE 114 EUROPE: BIORATIONAL PESTICIDES MARKET, BY MODE OF APPLICATION, 2018–2022 (USD MILLION)
- TABLE 115 EUROPE: BIORATIONAL PESTICIDES MARKET, BY MODE OF APPLICATION, 2023–2028 (USD MILLION)
- TABLE 116 EUROPE: BIORATIONAL PESTICIDES MARKET, BY FORMULATION, 2018–2022 (USD MILLION)
- TABLE 117 EUROPE: BIORATIONAL PESTICIDES MARKET, BY FORMULATION, 2023–2028 (USD MILLION)
- TABLE 118 EUROPE: BIORATIONAL PESTICIDES MARKET, BY CROP TYPE, 2018–2022 (USD MILLION)
- TABLE 119 EUROPE: BIORATIONAL PESTICIDES MARKET, BY CROP TYPE, 2023–2028 (USD MILLION)
- TABLE 120 FRANCE: BIORATIONAL PESTICIDES MARKET, BY SOURCE, 2018–2022 (USD MILLION)
- TABLE 121 FRANCE: BIORATIONAL PESTICIDES MARKET, BY SOURCE, 2023–2028 (USD MILLION)
- TABLE 122 ITALY: BIORATIONAL PESTICIDES MARKET, BY SOURCE, 2018–2022 (USD MILLION)
- TABLE 123 ITALY: BIORATIONAL PESTICIDES MARKET, BY SOURCE, 2023–2028 (USD MILLION)
- TABLE 124 GERMANY: BIORATIONAL PESTICIDES MARKET, BY SOURCE, 2018–2022 (USD MILLION)
- TABLE 125 GERMANY: BIORATIONAL PESTICIDES MARKET, BY SOURCE, 2023–2028 (USD MILLION)
- TABLE 126 SPAIN: BIORATIONAL PESTICIDES MARKET, BY SOURCE, 2018–2022 (USD MILLION)
- TABLE 127 SPAIN: BIORATIONAL PESTICIDES MARKET, BY SOURCE, 2023–2028 (USD MILLION)
- TABLE 128 UK: BIORATIONAL PESTICIDES MARKET, BY SOURCE, 2018–2022 (USD MILLION)
- TABLE 129 UK: BIORATIONAL PESTICIDES MARKET, BY SOURCE, 2023–2028 (USD MILLION)
- TABLE 130 REST OF EUROPE: BIORATIONAL PESTICIDES MARKET, BY SOURCE, 2018–2022 (USD MILLION)
- TABLE 131 REST OF EUROPE: BIORATIONAL PESTICIDES MARKET, BY SOURCE, 2023–2028 (USD MILLION)
- TABLE 132 REST OF THE WORLD: BIORATIONAL PESTICIDES MARKET, BY REGION, 2018–2022 (USD MILLION)
- TABLE 133 REST OF THE WORLD: BIORATIONAL PESTICIDES MARKET, BY REGION, 2023–2028 (USD MILLION)
- TABLE 134 REST OF THE WORLD: BIORATIONAL PESTICIDES MARKET, BY TYPE, 2018–2022 (USD MILLION)
- TABLE 135 REST OF THE WORLD: BIORATIONAL PESTICIDES MARKET, BY TYPE, 2023–2028 (USD MILLION)
- TABLE 136 REST OF THE WORLD: BIORATIONAL PESTICIDES MARKET, BY SOURCE, 2018–2022 (USD MILLION)
- TABLE 137 REST OF THE WORLD: BIORATIONAL PESTICIDES MARKET, BY SOURCE, 2023–2028 (USD MILLION)
- TABLE 138 REST OF THE WORLD: BIORATIONAL PESTICIDES MARKET, BY MODE OF APPLICATION, 2018–2022 (USD MILLION)
- TABLE 139 REST OF THE WORLD: BIORATIONAL PESTICIDES MARKET, BY MODE OF APPLICATION, 2023–2028 (USD MILLION)
- TABLE 140 REST OF THE WORLD: BIORATIONAL PESTICIDES MARKET, BY FORMULATION, 2018–2022 (USD MILLION)
- TABLE 141 REST OF THE WORLD: BIORATIONAL PESTICIDES MARKET, BY FORMULATION, 2023–2028 (USD MILLION)
- TABLE 142 REST OF THE WORLD: BIORATIONAL PESTICIDES MARKET, BY CROP TYPE, 2018–2022 (USD MILLION)
- TABLE 143 REST OF THE WORLD: BIORATIONAL PESTICIDES MARKET, BY CROP TYPE, 2023–2028 (USD MILLION)
- TABLE 144 SOUTH AMERICA: BIORATIONAL PESTICIDES MARKET, BY SOURCE, 2018–2022 (USD MILLION)
- TABLE 145 SOUTH AMERICA: BIORATIONAL PESTICIDES MARKET, BY SOURCE, 2023–2028 (USD MILLION)
- TABLE 146 MIDDLE EAST & AFRICA: BIORATIONAL PESTICIDES MARKET, BY SOURCE, 2018–2022 (USD MILLION)
- TABLE 147 MIDDLE EAST & AFRICA: BIORATIONAL PESTICIDES MARKET, BY SOURCE, 2023–2028 (USD MILLION)
- TABLE 148 BIORATIONAL PESTICIDES MARKET: INTENSITY OF COMPETITIVE RIVALRY, 2022
- TABLE 149 COMPANY PRODUCT TYPE FOOTPRINT
- TABLE 150 COMPANY CROP TYPE FOOTPRINT
- TABLE 151 COMPANY REGIONAL FOOTPRINT
- TABLE 152 OVERALL COMPANY FOOTPRINT
- TABLE 153 DETAILED LIST OF KEY START-UPS/SMES
- TABLE 154 COMPETITIVE BENCHMARKING OF KEY START-UPS/SMES
- TABLE 155 PRODUCT LAUNCHES, 2019–2023
- TABLE 156 DEALS, 2019–2023
- TABLE 157 OTHERS, 2019–2023
- TABLE 158 UPL: BUSINESS OVERVIEW
- TABLE 159 UPL: PRODUCTS/SOLUTIONS/SERVICES OFFERED
- TABLE 160 UPL: PRODUCT LAUNCHES
- TABLE 161 UPL: DEALS
- TABLE 162 UPL: OTHERS
- TABLE 163 FMC CORPORATION: BUSINESS OVERVIEW
- TABLE 164 FMC CORPORATION: PRODUCTS/SOLUTIONS/SERVICES OFFERED
- TABLE 165 FMC CORPORATION: PRODUCT LAUNCHES
- TABLE 166 FMC CORPORATION: DEALS
- TABLE 167 FMC CORPORATION: OTHERS
- TABLE 168 BASF SE: BUSINESS OVERVIEW
- TABLE 169 BASF SE: PRODUCTS/SOLUTIONS/SERVICES OFFERED
- TABLE 170 BASF SE: PRODUCT LAUNCHES
- TABLE 171 BASF SE: DEALS
- TABLE 172 BASF SE: OTHERS
- TABLE 173 BAYER AG: BUSINESS OVERVIEW
- TABLE 174 BAYER AG: PRODUCTS/SOLUTIONS/SERVICES OFFERED
- TABLE 175 BAYER AG: PRODUCT LAUNCHES
- TABLE 176 BAYER AG: DEALS
- TABLE 177 BAYER AG: OTHERS
- TABLE 178 SYNGENTA AG: BUSINESS OVERVIEW
- TABLE 179 SYNGENTA AG: PRODUCTS/SOLUTIONS/SERVICES OFFERED
- TABLE 180 SYNGENTA AG: PRODUCT LAUNCHES
- TABLE 181 SYNGENTA AG: DEALS
- TABLE 182 SYNGENTA AG: OTHERS
- TABLE 183 NOVOZYMES A/S: BUSINESS OVERVIEW
- TABLE 184 NOVOZYMES A/S: PRODUCTS/SOLUTIONS/SERVICES OFFERED
- TABLE 185 NOVOZYMES A/S: PRODUCT LAUNCHES
- TABLE 186 NOVOZYMES A/S: DEALS
- TABLE 187 SUMITOMO CHEMICAL CO., LTD.: BUSINESS OVERVIEW
- TABLE 188 SUMITOMO CHEMICAL CO., LTD.: PRODUCTS/SOLUTIONS/SERVICES OFFERED
- TABLE 189 SUMITOMO CHEMICAL CO., LTD.: DEALS
- TABLE 190 SUMITOMO CHEMICAL CO., LTD.: OTHERS
- TABLE 191 PRO FARM GROUP INC.: BUSINESS OVERVIEW
- TABLE 192 PRO FARM GROUP INC.: PRODUCTS/SOLUTIONS/SERVICES OFFERED
- TABLE 193 PRO FARM GROUP INC.: PRODUCT LAUNCHES
- TABLE 194 PRO FARM GROUP INC.: DEALS
- TABLE 195 KOPPERT: BUSINESS OVERVIEW
- TABLE 196 KOPPERT: PRODUCTS/SOLUTIONS/SERVICES OFFERED
- TABLE 197 KOPPERT: PRODUCT LAUNCHES
- TABLE 198 KOPPERT: DEALS
- TABLE 199 VALENT BIOSCIENCES LLC: BUSINESS OVERVIEW
- TABLE 200 VALENT BIOSCIENCES LLC: PRODUCTS/SOLUTIONS/SERVICES OFFERED
- TABLE 201 VALENT BIOSCIENCES LLC: DEALS
- TABLE 202 VALENT BIOSCIENCES LLC: OTHERS
- TABLE 203 GOWAN COMPANY: BUSINESS OVERVIEW
- TABLE 204 GOWAN COMPANY: PRODUCTS/SOLUTIONS/SERVICES OFFERED
- TABLE 205 GOWAN COMPANY: DEALS
- TABLE 206 CERTIS BIOLOGICALS: BUSINESS OVERVIEW
- TABLE 207 CERTIS BIOLOGICALS: PRODUCTS/SOLUTIONS/SERVICES OFFERED
- TABLE 208 CERTIS BIOLOGICALS: PRODUCT LAUNCHES
- TABLE 209 CERTIS BIOLOGICALS: OTHERS
- TABLE 210 BIOBEST GROUP: BUSINESS OVERVIEW
- TABLE 211 BIOBEST GROUP: PRODUCTS/SOLUTIONS/SERVICES OFFERED
- TABLE 212 BIOBEST GROUP: PRODUCT LAUNCHES
- TABLE 213 BIOBEST GROUP: DEALS
- TABLE 214 BIONEMA: BUSINESS OVERVIEW
- TABLE 215 BIONEMA: PRODUCTS/SOLUTIONS/SERVICES OFFERED
- TABLE 216 BIONEMA: PRODUCT LAUNCHES
- TABLE 217 BIONEMA: DEALS
- TABLE 218 VESTARON CORPORATION: BUSINESS OVERVIEW
- TABLE 219 VESTARON CORPORATION: PRODUCTS/SOLUTIONS/SERVICES OFFERED
- TABLE 220 VESTARON CORPORATION: PRODUCT LAUNCHES
- TABLE 221 VESTARON CORPORATION: DEALS
- TABLE 222 STK BIO-AG TECHNOLOGIES: COMPANY OVERVIEW
- TABLE 223 STK BIO-AG TECHNOLOGIES: PRODUCTS/SOLUTIONS/SERVICES OFFERED
- TABLE 224 STK BIO-AG TECHNOLOGIES: DEALS
- TABLE 225 IPL BIOLOGICALS: BUSINESS OVERVIEW
- TABLE 226 IPL BIOLOGICALS: PRODUCTS/SOLUTIONS/SERVICES OFFERED
- TABLE 227 ANDERMATT GROUP AG: BUSINESS OVERVIEW
- TABLE 228 ANDERMATT GROUP AG: PRODUCTS/SOLUTIONS/SERVICES OFFERED
- TABLE 229 VEGALAB SA: BUSINESS OVERVIEW
- TABLE 230 VEGALAB SA: PRODUCTS/SOLUTIONS/SERVICES OFFERED
- TABLE 231 FYTOFEND: BUSINESS OVERVIEW
- TABLE 232 FYTOFEND: PRODUCTS/SOLUTIONS/SERVICES OFFERED
- TABLE 233 MARKETS ADJACENT TO BIORATIONAL PESTICIDES MARKET
- TABLE 234 BIOPESTICIDES MARKET, BY SOURCE, 2019–2022 (USD MILLION)
- TABLE 235 BIOPESTICIDES MARKET, BY SOURCE, 2023–2028 (USD MILLION)
- TABLE 236 BIOINSECTICIDES MARKET, BY CROP TYPE, 2018–2025 (USD MILLION)
- FIGURE 1 BIORATIONAL PESTICIDES MARKET: RESEARCH DESIGN
- FIGURE 2 BREAKDOWN OF PRIMARY INTERVIEWS: BY COMPANY TYPE, DESIGNATION, AND REGION
- FIGURE 3 BIORATIONAL PESTICIDES MARKET SIZE ESTIMATION (DEMAND SIDE)
- FIGURE 4 BIORATIONAL PESTICIDES MARKET SIZE ESTIMATION: BOTTOM-UP APPROACH
- FIGURE 5 BIORATIONAL PESTICIDES MARKET SIZE ESTIMATION, BY TYPE (SUPPLY SIDE)
- FIGURE 6 BIORATIONAL PESTICIDES MARKET SIZE ESTIMATION: TOP-DOWN APPROACH
- FIGURE 7 DATA TRIANGULATION
- FIGURE 8 BIORATIONAL PESTICIDES MARKET, BY TYPE, 2023 VS. 2028 (USD MILLION)
- FIGURE 9 BIORATIONAL PESTICIDES MARKET, BY MODE OF APPLICATION, 2023 VS. 2028 (USD MILLION)
- FIGURE 10 BIORATIONAL PESTICIDES MARKET, BY SOURCE, 2023 VS. 2028 (USD MILLION)
- FIGURE 11 BIORATIONAL PESTICIDES MARKET, BY FORMULATION, 2023 VS. 2028 (USD MILLION)
- FIGURE 12 BIORATIONAL PESTICIDES MARKET, BY CROP TYPE, 2023 VS. 2028 (USD MILLION)
- FIGURE 13 BIORATIONAL PESTICIDES MARKET: REGIONAL SNAPSHOT
- FIGURE 14 SHIFT TOWARD SUSTAINABLE AGRICULTURE AND GOVERNMENT POLICIES TO DRIVE BIORATIONAL PESTICIDES MARKET
- FIGURE 15 BIORATIONAL INSECTICIDES SEGMENT AND US ACCOUNTED FOR SIGNIFICANT SHARE IN 2022
- FIGURE 16 NORTH AMERICA TO DOMINATE MARKET DURING FORECAST PERIOD
- FIGURE 17 LIQUID SEGMENT TO ACCOUNT FOR LARGER SHARE BY 2028
- FIGURE 18 BIORATIONAL INSECTICIDES SEGMENT TO LEAD MARKET DURING FORECAST PERIOD
- FIGURE 19 FOLIAR SPRAY SEGMENT TO ACCOUNT FOR LARGEST SHARE DURING FORECAST PERIOD
- FIGURE 20 FRUITS & VEGETABLES SEGMENT TO LEAD MARKET DURING FORECAST PERIOD
- FIGURE 21 INDIA, AUSTRALIA, AND SOUTH AMERICA TO ACHIEVE SIGNIFICANT GROWTH DURING FORECAST PERIOD
- FIGURE 22 TOTAL ORGANIC LAND, BY REGION, 2021
- FIGURE 23 TOP 10 COUNTRIES WITH LARGE AREA UNDER ORGANIC FARMING, 2021 (MILLION HECTARES)
- FIGURE 24 BIORATIONAL PESTICIDES MARKET: DRIVERS, RESTRAINTS, OPPORTUNITIES, AND CHALLENGES
- FIGURE 25 TRENDS OF NEW ACTIVE INGREDIENT LAUNCHES, 1950–2019
- FIGURE 26 EUROPE: MARKET SHARE OF ORGANIC FARMING, BY KEY COUNTRY, 2021
- FIGURE 27 GROWTH OF GLOBAL FOOD & DRINK MARKET (2000–2021)
- FIGURE 28 TOP 10 COUNTRIES AND THEIR TOTAL PESTICIDE USAGE IN AGRICULTURE, 2020 (‘000 TONNES)
- FIGURE 29 VALUE CHAIN ANALYSIS
- FIGURE 30 SUPPLY CHAIN ANALYSIS
- FIGURE 31 ECOSYSTEM MAP
- FIGURE 32 TRENDS AND DISRUPTIONS IMPACTING CUSTOMERS
- FIGURE 33 INFLUENCE OF STAKEHOLDERS ON BUYING PROCESS FOR TOP 3 MODES OF APPLICATION
- FIGURE 34 INFLUENCE OF STAKEHOLDERS ON BUYING PROCESS FOR TOP 3 TYPES OF BIORATIONAL PESTICIDES
- FIGURE 35 BIORATIONAL PESTICIDES MARKET, BY FORMULATION, 2023 VS. 2028 (USD MILLION)
- FIGURE 36 BIORATIONAL PESTICIDES MARKET, BY MODE OF APPLICATION, 2023 VS. 2028 (USD MILLION)
- FIGURE 37 BIORATIONAL PESTICIDES MARKET, BY SOURCE, 2023 VS. 2028 (USD MILLION)
- FIGURE 38 BIORATIONAL PESTICIDES MARKET, BY TYPE, 2023 VS. 2028 (USD MILLION)
- FIGURE 39 BIORATIONAL PESTICIDES MARKET, BY CROP TYPE, 2023 VS. 2028 (USD MILLION)
- FIGURE 40 TOTAL ORGANIC CEREAL PRODUCTION AREA, BY REGION, 2021
- FIGURE 41 TOP 5 COUNTRIES AND THEIR AREA FOR OILSEED PRODUCTION, 2021
- FIGURE 42 DISTRIBUTION OF ORGANIC AGRICULTURAL LAND, BY REGION, 2021
- FIGURE 43 INDIA TO RECORD SIGNIFICANT GROWTH IN BIORATIONAL PESTICIDES MARKET DURING FORECAST PERIOD
- FIGURE 44 BIORATIONAL PESTICIDES MARKET, BY REGION, 2023 VS. 2028 (USD MILLION)
- FIGURE 45 NORTH AMERICA: BIORATIONAL PESTICIDES MARKET SNAPSHOT
- FIGURE 46 ASIA PACIFIC: BIORATIONAL PESTICIDES MARKET SNAPSHOT
- FIGURE 47 BIOPESTICIDE CONSUMPTION IN INDIA (2018–2019 TO 2021–2022)
- FIGURE 48 REVENUE ANALYSIS OF KEY PLAYERS, 2020–2022 (USD BILLION)
- FIGURE 49 COMPANY EVALUATION MATRIX, 2023
- FIGURE 50 START-UP/SME EVALUATION MATRIX, 2023
- FIGURE 51 UPL LIMITED: COMPANY SNAPSHOT
- FIGURE 52 FMC CORPORATION: COMPANY SNAPSHOT
- FIGURE 53 BASF SE: COMPANY SNAPSHOT
- FIGURE 54 BAYER AG: COMPANY SNAPSHOT
- FIGURE 55 SYNGENTA AG: COMPANY SNAPSHOT
- FIGURE 56 NOVOZYMES A/S: COMPANY SNAPSHOT
- FIGURE 57 SUMITOMO CHEMICAL CO., LTD.: COMPANY SNAPSHOT
The study involved four major activities in estimating the current size of the biorational pesticides market. Exhaustive secondary research was done to collect information on the market, peer market, and parent market. The next step was to validate these findings, assumptions, and sizing with industry experts across the value chain through primary research. Both top-down and bottom-up approaches were employed to estimate the complete market size. After that, market breakdown and data triangulation were used to estimate the market size of segments and subsegments.
Secondary Research
This research study involved the extensive use of secondary sources—directories and databases such as Bloomberg Businessweek and Factiva—to identify and collect information useful for a technical, market-oriented, and commercial study of the market.
In the secondary research process, various sources such as annual reports, press releases & investor presentations of companies, white papers, agriculture journals, certified publications, articles from recognized authors, gold & silver standard websites, directories, and databases, were referred to identify and collect information. This research study involved the extensive use of secondary sources—directories and databases such as Bloomberg Businessweek and Factiva—to identify and collect information useful for a technical, market-oriented, and commercial study of the biorational pesticides market.
Secondary research was mainly used to obtain key information about the industry’s supply chain, the total pool of key players, and market classification and segmentation as per the industry trends to the bottom-most level, regional markets, and key developments from both market- and technology-oriented perspectives.
Primary Research
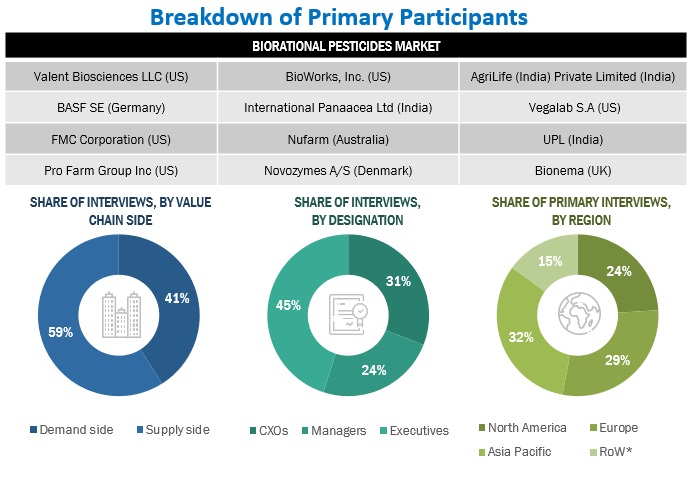
Extensive primary research was conducted after obtaining information regarding the biorational pesticides market scenario through secondary research. Several primary interviews were conducted with market experts from both the demand and supply sides across major countries of North America, Europe, Asia Pacific, the Middle East & Africa, and South America. Primary data was collected through questionnaires, emails, and telephonic interviews. The primary sources from the supply side included various industry experts, such as Chief X Officers (CXOs), Vice Presidents (VPs), Directors, from business development, marketing, research, and development teams, and related key executives from distributors, and key opinion leaders. Primary interviews were conducted to gather insights such as market statistics, data on revenue collected from the products and services, market breakdowns, market size estimations, market forecasting, and data triangulation. Primary research also helped in understanding the various trends related to types of biorational pesticides, type, mode of application, source, formulation, crop type, and region. Stakeholders from the demand side, such as opinion leaders, growers, farmers, and agronomists who are using biorational pesticides were interviewed to understand the buyer’s perspective on the suppliers, products, and their current usage of biorational pesticides and the future outlook of their business which will affect the overall market.
To know about the assumptions considered for the study, download the pdf brochure
Market Size Estimation
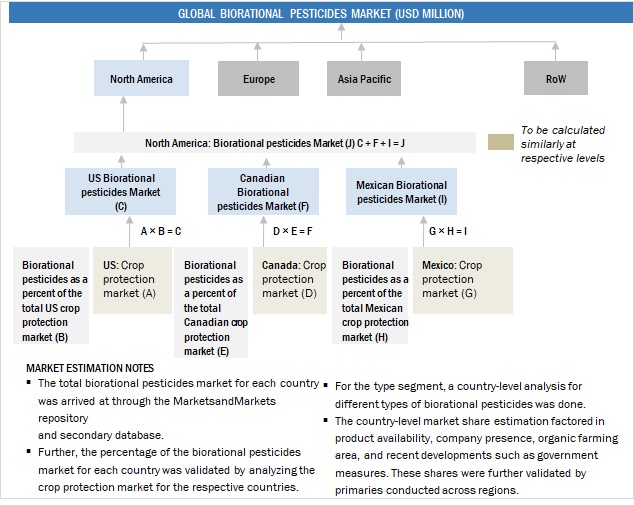
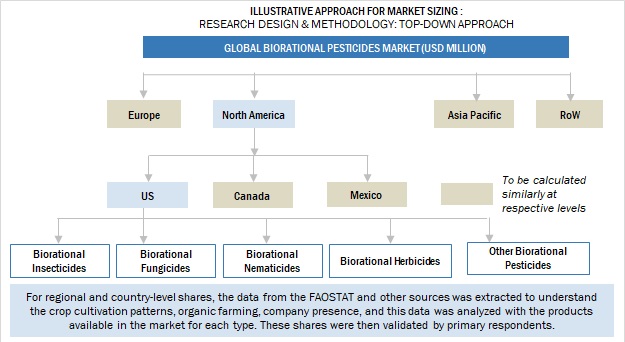
Both the top-down and bottom-up approaches were used to estimate and validate the total size of the biorational pesticides market. These approaches were also used extensively to estimate the size of various dependent submarkets. The research methodology used to estimate the market size includes the following:
- Key players were identified through extensive secondary research.
- The industry’s value chain and market size were determined through primary and secondary research.
- All percentage share splits and breakdowns were determined using secondary sources and verified through primary sources.
- All the possible parameters that affect the markets covered in this research study were accounted for, viewed in extensive detail, verified through primary research, and analyzed to obtain the final quantitative and qualitative data.
- The parent market—the crop protection market—was considered further to validate the details of the market.
- The following figure provides an illustrative representation of the complete market size estimation process implemented in this research study for an overall estimation of the market in a consolidated format.
The following sections (bottom-up & top-down) depict the overall market size estimation process employed for the purpose of this study.
Global Biorational Pesticides Market: Bottom-Up Approach
To know about the assumptions considered for the study, Request for Free Sample Report
Global Biorational Pesticides Market: Top-Down Approach
Data Triangulation
After arriving at the overall market size from the estimation process explained above, the total market was split into several segments and subsegments. The data triangulation and market breakdown procedures were employed, wherever applicable, to estimate the overall biorational pesticides market and arrive at the exact statistics for all segments and subsegments. The data was triangulated by studying various factors and trends from the demand and supply sides. Along with this, the market size was validated using both the top-down and bottom-up approaches.
Market Definition
According to a paper published by IPM Florida & the University of Florida, the term “biorational” describes those pesticides that are efficient against target pests but are less detrimental to natural enemies. In this report, a biorational pesticide is defined as “any type of pesticide active against pest populations, but relatively innocuous to non-target organisms and therefore, non-disruptive to the environment’s biological control.
Biorational pesticides are derived from natural biological materials such as animals, plants, bacteria, and certain minerals. They are third-generation pesticides that are environment-friendly and closely resemble or are identical to chemicals produced biologically in nature.
Key Stakeholders
- Agriculture pesticide manufacturers & suppliers
- Associations and industry bodies
- Biorational pesticide manufacturers & suppliers
- Biorational pesticide traders, retailers, and distributors
- Commercial research & development (R&D) institutions
- Venture capitalists and investors
- Government, regulatory bodies, and research organizations
- Technology providers to biorational pesticide & microbial companies
- Public hygiene organizations, government regulatory institutions, and food safety agencies
- Associations and industry bodies
Report Objectives
Market Intelligence
- Determining and projecting the size of the market, based on type, formulation, mode of application, source, crop type, and regional markets, over a five-year period, ranging from 2023 to 2028.
- Identifying attractive opportunities in the market by determining the largest and fastest-growing segments across regions
- Analyzing the demand-side factors based on the following:
- Impact of macro- and microeconomic factors on the market
- Shift in demand patterns across different subsegments and regions
Competitive Intelligence
- Identifying and profiling the key market players in the market
- Determining the share of key players operating in the biorational pesticides market
-
Providing a comparative analysis of the market leaders on the basis of the following:
- Product offerings
- Business strategies
- Strengths, weaknesses, opportunities, and threats
- Key financials
- Understanding the competitive landscape and identifying major growth strategies adopted by the key companies.
- Analyzing the patents registered and regulatory frameworks across the regions and their impact on prominent market players.
- Analyzing the market dynamics and competitive situations & trends across the regions and their impact on prominent market players
Available Customizations:
With the given market data, MarketsandMarkets offers customizations according to company-specific scientific needs.
The following customization options are available for the report:
Product Analysis
- Product Matrix, which gives a detailed comparison of the product portfolio of each company.
Geographic Analysis
With the given market data, MarketsandMarkets offers customizations according to company-specific scientific needs.
- Further breakdown of the Rest of Europe into Netherlands, Poland, and other EU & non-EU countries
- Further breakdown of the Rest of Asia Pacific into New Zealand, Thailand, and Vietnam.
- Further breakdown of the Rest of South America into Colombia, Paraguay, Peru, and other South American countries
Company Information
- Detailed analyses and profiling of additional market players (up to five)
Growth opportunities and latent adjacency in Biorational Pesticides Market
Very informative market report.