Foliar Spray Market

Foliar Spray Market by Type (Nitrogenous, Phosphatic, Potassic and Micronutrients), Form (Powder and Liquid), Application (Horticultural Crops, Field Crops, Turfs & Ornamentals), Region ( North America, Europe, Asia- Pacific) - Global Forecast to 2028

Report Code: AGI 8663 May, 2023, by marketsandmarkets.com

[262 Pages Report] The foliar spray market is projected to reach from USD 7.3 billion in 2023 to USD 9.6 billion by 2028 growing at a CAGR of 5.5% from 2023 to 2028. Foliar spray is a technique used in agriculture to apply nutrients or pesticides directly to the leaves of a plant. The foliar spray market refers to the industry that supplies products used in this technique, including fertilizers, herbicides, insecticides, and other plant nutrients. Foliar sprays are known for their quick response time and ability to improve the yield and quality of crops. They are also effective in controlling diseases, pests, and weeds. The market includes a wide range of products, from traditional chemical-based sprays to organic and bio-based alternatives. Factors such as environmental concerns and regulations, the increasing demand for high-quality crops and the need for efficient crop management practices the demand for more sustainable and eco-friendly solutions in the foliar spray market and is driving the market.

Foliar Spray Market

To know about the assumptions considered for the study, Request for Free Sample Report

Foliar Spray Market

To know about the assumptions considered for the study, download the pdf brochure

Foliar Spray Market Dynamics

One Driver: Increasing demand of high-quality crops

The demand for high-quality crops is a major driver of the foliar spray market. Nowadays, consumers are more health-conscious and they are looking for high-quality, nutrient-dense food. As a result, farmers are under increasing pressure to produce crops that meet these demands. Foliar spraying is an effective way for farmers to deliver essential nutrients directly to the leaves of plants, improving their growth, yield, and quality. Foliar sprays are particularly useful in situations where soil fertility is low or when crops are grown in high-density plantings, where access to nutrients in the soil is limited. Foliar sprays are used to deliver a wide range of nutrients, including nitrogen, phosphorus, potassium, calcium, magnesium, and micronutrients. These nutrients are essential for plant growth and improve the quality of crops by increasing their nutritional content, flavor, and shelf life. In addition to improving the quality of crops, foliar sprays also help farmers increase their yields. By delivering nutrients directly to the leaves of plants, foliar sprays help crops reach their full potential, producing higher yields and more abundant harvests. As the demand for high-quality crops continues to grow, the use of foliar sprays is likely to become more widespread. Farmers who use foliar sprays produce crops that meet the demands of consumers while also increasing their profitability by improving the quality and yield of their harvests.

Restraint: Environmental concerns risk the use of products of foliar spray

Foliar spray products are becoming an increasingly popular method of crop protection, providing a convenient and effective means of controlling pests and diseases. However, there are growing concerns about the potential environmental impacts of these products. Another environmental concern associated with foliar sprays is the risk of developing resistance. Overuse of these products leads to the development of resistance in pests and diseases, making them more difficult to control over time. This not only reduces the effectiveness of the product but also leads to an increase in the use of more potent and potentially harmful products. When these products are applied, they leach into the soil and water, potentially contaminating these resources with pesticides and other chemicals. This has adverse effects on the health of soil organisms, aquatic life, and humans who rely on these resources for drinking water and food production. While foliar spray products are an effective means of crop protection, they also pose significant environmental risks.

Opportunity: Meeting the increasing demand for high-quality foods

The increasing demand for high-quality food products is driving the need for sustainable and environmentally friendly practices in agriculture. This trend is creating a growing market for foliar sprays, which offer an effective and efficient way to improve crop yield and quality. Additionally, the rising awareness about the benefits of foliar sprays is driving the adoption of these products by farmers and growers. The need to improve crop productivity to meet the growing demand for food is another significant opportunity for the foliar spray market. Foliar sprays are a cost-effective and efficient way to boost crop yields and productivity and help to meet the demand of the population. Moreover, the adoption of sustainable agricultural practices is creating new opportunities for the foliar spray market, as farmers and growers look for ways to reduce their environmental impact.

Challenge: Impact of climate change and soil degradation

The foliar spray market faces several challenges that need to be addressed to maintain growth and sustain profitability. One such challenge is the complex and varying regulatory framework governing the use of foliar sprays in different countries. With a large number of players offering a wide range of products and services, global players often struggle to enter new markets and capture a significant market share. This competition is further intensified by the presence of several regional and local players. Environmental factors and the impact of climate change pose additional challenges for the foliar spray market. Soil degradation, water scarcity, and pests and diseases have a significant impact on crop yields and quality, which in turn, affects the demand for foliar sprays.

Foliar Spray Market Ecosystem

Prominent companies in this market include well-established, financially stable manufacturers of foliar spray. These companies have been operating in the market for several years and possess a diversified product portfolio, state-of-the-art technologies, and strong global sales and marketing networks.

  • The key players in foliar spray market include Eurochem Group (Switzerland), Nutrien Ltd. (Canada), Yara (Norway), Israel Chemical Limited (Israel), Coromandel International Limited (India) and The Mosaic Company (US).

Foliar Spray Market Size, and Share

Based on Type, Nitrogenous foliar spray is estimated to account for the fasted market share of the foliar spray market

Nitrogen is an essential nutrient for plant growth and soil applications of nitrogen fertilizers are the most common method of providing this nutrient to plants. Foliar sprays are an effective way to supplement plant nitrogen uptake. Nitrogenous foliar sprays are formulations containing nitrogen in the form of various salts, such as ammonium nitrate, urea, or amino acids. Nitrogenous foliar sprays are especially useful in situations where plants require a quick boost of nitrogen, such as during periods of rapid growth or in times of stress. Nitrogenous foliar sprays applied at lower rates than soil-applied fertilizers, reduce the risk of leaching and runoff. This makes them a more environmentally friendly option for fertilizing plants. Additionally, foliar sprays help to minimize nutrient imbalances that occur when soil applications are used exclusively.

Based on Application, the horticultural crops segment is estimated to account for the highest growth of the foliar spray market

Foliar sprays are a common technique used in horticultural crops for various purposes such as nutrient management, disease management, and growth promotion. Foliar sprays are used to supplement nutrients in crops that are deficient. This is particularly useful in situations where soil nutrient levels are low, and plant growth is limited. It provides a quick and efficient method of delivering nutrients directly to the plant, resulting in rapid uptake and utilization. Foliar sprays are also used as part of an integrated pest management (IPM) program to reduce pest populations and prevent the development of resistance to pesticides. Foliar sprays are used to promote growth and development in horticultural crops. Growth regulators such as cytokinins and gibberellins are also applied as foliar sprays to stimulate plant growth, increase fruit size, and improve crop yields.

Based on Form, the Liquid segment is estimated to account for the highest growth of the foliar spray market

A liquid foliar spray is a method of applying liquid fertilizer or other nutrients to the leaves of plants. This technique is used in agriculture to increase crop yields and improve plant health. One of the key drivers of growth of liquid foliar spray is the increasing demand for high-quality crops that are more resistant to disease and pests. Liquid foliar sprays provide plants with essential nutrients and trace elements that help improve their health and increase their resistance to disease and pests. The growing trend towards organic farming and sustainable agriculture is also driving the growth of the liquid foliar spray market, as these products are seen as a more environmentally friendly and sustainable alternative to traditional chemical fertilizers.

Europe: Foliar Spray Market Snapshot

Foliar Spray Market Size, and Share

Europe had a market size of USD 2.9 billion, and the market is projected to grow with a CAGR of 5.4% during the forecast period (2023-2028)

Europe foliar sprays market experience significant growth due to the increasing demand for high-quality crops and the need to maximize yield in a sustainable manner. The market is driven by factors such as the growing population, shrinking arable land, and rising demand for high-quality food and agricultural products. Consumers are increasingly demanding crops that are not only nutritious but also free from harmful chemicals and pesticides. Foliar sprays offer an effective way of delivering essential nutrients and trace elements directly to the plant, helping to improve crop quality and yield. The increasing adoption of precision farming techniques is also driving the Europe foliar spray market. Precision farming involves the use of advanced technologies such as GPS mapping and remote sensing to analyze soil and crop data and optimize farming practices. Foliar sprays are used in specific crop needs, allowing farmers to deliver the right nutrients in the right quantities at the right time, improving crop health and yield.

Key Market Players

The key players in foliar spray market include EuroChem Group (Switzerland), Yara (Norway), Nutrien Ltd. (Canada), Israel Chemical Limited (Israel), Coromandel International Limited (India) and The Mosaic Company (US).

Get online access to the report on the World's First Market Intelligence Cloud

  • Easy to Download Historical Data & Forecast Numbers
  • Company Analysis Dashboard for high growth potential opportunities
  • Research Analyst Access for customization & queries
  • Competitor Analysis with Interactive dashboard
  • Latest News, Updates & Trend analysis
Request Sample

Scope of the Report

Report Metric

Details

Market size estimation

2023–2028

Base year considered

2022

Forecast period considered

2023–2028

Units considered

Value (USD)

Segments covered

By Type, Form, Application, and Region

Regions covered

North America, Europe, Asia Pacific, South America, and RoW

Companies studied

  • EuroChem Group AG (Switzerland)
  • Nutrien Ltd. (Canada)
  • K+S Aktiengesellschaft (Germany)
  • Yara International (Norway)
  • Israel Chemical Ltd. (Israel)
  • The Mosaic Company (US)
  • Gujarat State Fertilizers & Chemicals Ltd. (India)
  • Coromandel International Limited (India)
  • Tribodyn AG (Germany)
  • Hebei Monband Water Soluble Fertilizer Co., Ltd. (China)
  • Haifa Chemicals Ltd (Israel)
  • Andaman AG (Switzerland)
  • Aries Agro Limited (India)
  • Sichuan Shucan Chemical Co. Ltd (China)
  • ICL Specialty Fertilizers (Israel)
  • Nutrient Technologies (US)
  • Lima Europe (Belgium)
  • Chaitanya Agro Biotech Pvt. Ltd. (India)
  • Cippy Bio International (Israel)
  • AgroLiquid (US)

This research report categorizes the foliar spray market, based on type, form, application, and region.

Target Audience

  • Sugar substitute producers, suppliers, distributors, importers, and exporters
  • Large-scale food and beverage ingredient manufacturers, processed food manufacturers, and research organizations
  • Related government authorities, commercial research & development (R&D) institutions, FDA, EFSA, USDA, FSANZ, EUFIC government agencies & NGOs, and other regulatory bodies
  • Food product consumers
  • Regulatory bodies, including government agencies and NGOs
  • Commercial research & development (R&D) institutions and financial institutions
  • Government and research organizations

Report Scope:

Foliar Spray Market:

By Type
  • Nitrogenous
  • Phosphatic
  • Potassic
  • Micronutrients
By Form
  • Powder
  • Liquid
By Application
  • Horticultural Crops
  • Field Crops
  • Turfs & Ornamentals
  • Others
By Region:
  • North America
  • Europe
  • Asia Pacific
  • South America
  • Rest of the World (RoW)

Recent Developments

  • In January 2023, K+S Group acquired Industrial Commodities Holdings (Pty) Ltd., a leading provider of innovative agricultural solutions. The acquisition would strengthen K+S’s position in the global agricultural industry and enhance its product portfolio, particularly in the foliar spray market. Leveraging ICH Company’s expertise in precision agriculture, K+S aims to develop advanced foliar spray solutions that optimize crop yield, improve nutrient uptake, and promote sustainable farming practices.
  • In January 2022, EuroChem Group completed the acquisition of the Serra do Salitre phosphate project in Brazil. Fertilizer production is expected to launch in 2024 and reach full capacity in 2025. The size of the deal is USD 452 million.
  • In July 2022, Nutrien Ltd. entered into an agreement to acquire the Brazilian company, Casa do Adubo S.A. (Casa do Adubo). The acquisition includes 39 retail locations under the brand Casa do Adubo, and 10 distribution centers, under the brand Agrodistribuidor Casa.

Frequently Asked Questions (FAQ):

To speak to our analyst for a discussion on the above findings, click Speak to Analyst

TABLE OF CONTENTS
 
1 INTRODUCTION (Page No. - 24)
    1.1 STUDY OBJECTIVES 
    1.2 MARKET DEFINITION 
    1.3 STUDY SCOPE 
           FIGURE 1 MARKET SEGMENTATION
           TABLE 1 INCLUSIONS AND EXCLUSIONS
           1.3.1 REGIONS COVERED
    1.4 YEARS CONSIDERED 
    1.5 CURRENCY CONSIDERED 
           TABLE 2 USD EXCHANGE RATES, 2020–2022
    1.6 UNITS CONSIDERED 
    1.7 STAKEHOLDERS 
    1.8 SUMMARY OF CHANGES 
           1.8.1 RECESSION IMPACT
 
2 RESEARCH METHODOLOGY (Page No. - 29)
    2.1 RESEARCH DATA 
           FIGURE 2 FOLIAR SPRAY MARKET: RESEARCH DESIGN
           2.1.1 SECONDARY DATA
                    2.1.1.1 Key data from secondary sources
           2.1.2 PRIMARY DATA
                    2.1.2.1 Key data from primary sources
                    2.1.2.2 Key industry insights
                    2.1.2.3 Breakdown of primary interviews
                               FIGURE 3 BREAKDOWN OF PRIMARY INTERVIEWS: BY COMPANY TYPE, DESIGNATION, AND REGION
    2.2 MARKET SIZE ESTIMATION 
           2.2.1 FOLIAR SPRAY MARKET: BOTTOM-UP APPROACH
                    FIGURE 4 FOLIAR SPRAY MARKET: BOTTOM-UP APPROACH
           2.2.2 FOLIAR SPRAY MARKET: TOP-DOWN APPROACH
                    FIGURE 5 FOLIAR SPRAY MARKET: TOP-DOWN APPROACH
    2.3 DATA TRIANGULATION 
           FIGURE 6 DATA TRIANGULATION METHODOLOGY
    2.4 RESEARCH ASSUMPTIONS 
    2.5 LIMITATIONS AND RISK ASSESSMENT 
    2.6 FOLIAR SPRAY MARKET: RECESSION IMPACT ANALYSIS 
           2.6.1 RECESSION INDICATORS
                    FIGURE 7 RECESSION INDICATORS
                    FIGURE 8 GLOBAL INFLATION RATE, 2011–2021
                    FIGURE 9 GLOBAL GDP, 2011–2021 (USD TRILLION)
                    FIGURE 10 RECESSION INDICATORS AND THEIR IMPACT ON FOLIAR SPRAY MARKET
                    FIGURE 11 GLOBAL FOLIAR SPRAY MARKET: CURRENT FORECAST VS. RECESSION FORECAST
 
3 EXECUTIVE SUMMARY (Page No. - 41)
    TABLE 3 FOLIAR SPRAY MARKET, 2023 VS. 2028 
    FIGURE 12 FOLIAR SPRAY MARKET, BY PRODUCT TYPE, 2023 VS. 2028 (USD MILLION) 
    FIGURE 13 FOLIAR SPRAY MARKET, BY CROP TYPE, 2023 VS. 2028 (USD MILLION) 
    FIGURE 14 FOLIAR SPRAY MARKET, BY FORM, 2023 VS. 2028 (USD MILLION) 
    FIGURE 15 FOLIAR SPRAY MARKET SHARE & GROWTH RATE, BY REGION 
 
4 PREMIUM INSIGHTS (Page No. - 46)
    4.1 ATTRACTIVE OPPORTUNITIES FOR PLAYERS IN FOLIAR SPRAY MARKET 
           FIGURE 16 RISING DEMAND FOR HIGH-QUALITY CROP YIELD TO DRIVE MARKET FOR FOLIAR SPRAY
    4.2 ASIA PACIFIC: FOLIAR SPRAY MARKET, BY CROP TYPE & COUNTRY 
           FIGURE 17 HORTICULTURAL CROPS SEGMENT AND CHINA TO ACCOUNT FOR SIGNIFICANT SHARE IN 2023
    4.3 FOLIAR SPRAY MARKET, BY PRODUCT TYPE, 2023 VS. 2028 
           FIGURE 18 NITROGENOUS SEGMENT TO LEAD MARKET IN 2023
    4.4 FOLIAR SPRAY MARKET, BY FORM, 2023 VS. 2028 
           FIGURE 19 DRY SEGMENT TO BE DOMINANT MARKET DURING FORECAST PERIOD
    4.5 FOLIAR SPRAY MARKET, BY CROP TYPE, 2023 VS. 2028 
           FIGURE 20 HORTICULTURAL CROPS SEGMENT TO BE DOMINANT MARKET BY 2028
    4.6 MARKET SHARE OF MAJOR REGIONAL SUBMARKETS 
           FIGURE 21 US TO ACCOUNT FOR LARGEST SHARE DURING FORECAST PERIOD
 
5 MARKET OVERVIEW (Page No. - 52)
    5.1 INTRODUCTION 
    5.2 MARKET DYNAMICS 
           FIGURE 22 FOLIAR SPRAY MARKET: DRIVERS, RESTRAINTS, OPPORTUNITIES, AND CHALLENGES
           5.2.1 DRIVERS
                    5.2.1.1 Growing need for efficient application of fertilizers
                    5.2.1.2 Increased awareness regarding foliar spray products in emerging markets
                    5.2.1.3 Ease of application
           5.2.2 RESTRAINTS
                    5.2.2.1 Growth of organic fertilizer industry
                               FIGURE 23 GROWTH OF ORGANIC AGRICULTURAL LAND, 2010–2019
                               FIGURE 24 DISTRIBUTION OF ORGANIC AGRICULTURAL LAND, BY REGION, 2019
           5.2.3 OPPORTUNITIES
                    5.2.3.1 Limited availability of land and increasing food demand
                               FIGURE 25 YEAR-WISE DECREASE IN AGRICULTURAL LAND, 2011–2020
                    5.2.3.2 Environmental concerns regarding use of chemical fertilizers
           5.2.4 CHALLENGES
                    5.2.4.1 Price volatility
 
6 INDUSTRY TRENDS (Page No. - 58)
    6.1 INTRODUCTION 
    6.2 TRENDS IMPACTING CUSTOMERS’ BUSINESSES 
           FIGURE 26 REVENUE SHIFT IN FOLIAR SPRAY MARKET
    6.3 VALUE CHAIN 
           6.3.1 RESEARCH & DEVELOPMENT
           6.3.2 REGISTRATION
           6.3.3 MANUFACTURING
           6.3.4 DISTRIBUTION
           6.3.5 MARKETING & SALES
                    FIGURE 27 VALUE CHAIN ANALYSIS
    6.4 TRADE ANALYSIS 
           TABLE 4 TOP 10 EXPORTERS AND IMPORTERS OF NITROGENOUS FERTILIZERS, 2021 (BY VALUE)
           TABLE 5 TOP 10 EXPORTERS AND IMPORTERS OF NITROGENOUS FERTILIZERS, 2021 (BY VOLUME)
           TABLE 6 TOP 10 EXPORTERS AND IMPORTERS OF PHOSPHATIC FERTILIZERS, 2021 (BY VALUE)
           TABLE 7 TOP 10 EXPORTERS AND IMPORTERS OF PHOSPHATIC FERTILIZERS, 2021 (BY VOLUME)
           TABLE 8 TOP 10 EXPORTERS AND IMPORTERS OF POTASSIC FERTILIZERS, 2021 (BY VALUE)
           TABLE 9 TOP 10 EXPORTERS AND IMPORTERS OF POTASSIC FERTILIZERS, 2021 (BY VOLUME)
    6.5 TECHNOLOGY ANALYSIS 
           6.5.1 NANOTECHNOLOGY-BASED UREA TO MITIGATE USE OF EXCESSIVE APPLICATION OF CONVENTIONAL UREA
    6.6 PATENT ANALYSIS 
           FIGURE 28 NUMBER OF PATENTS GRANTED, 2013–2023
           TABLE 10 LIST OF PATENTS GRANTED, 2020–2023
    6.7 MARKET MAPPING AND ECOSYSTEM ANALYSIS 
           6.7.1 DEMAND SIDE
           6.7.2 SUPPLY SIDE
                    FIGURE 29 MARKET MAPPING
                    TABLE 11 ECOSYSTEM ANALYSIS
    6.8 PORTER’S FIVE FORCES ANALYSIS 
           TABLE 12 PORTER’S FIVE FORCES ANALYSIS
           6.8.1 INTENSITY OF COMPETITIVE RIVALRY
           6.8.2 BARGAINING POWER OF SUPPLIERS
           6.8.3 BARGAINING POWER OF BUYERS
           6.8.4 THREAT FROM SUBSTITUTES
           6.8.5 THREAT FROM NEW ENTRANTS
    6.9 CASE STUDIES 
           6.9.1 FOLIAR APPLICATION OF NUTRIENTS IMPROVED SOYBEAN PRODUCTIVITY
                    6.9.1.1 Case study: Foliar application of nutrients improved soybean productivity
    6.10 PRICING ANALYSIS 
           6.10.1 AVERAGE SELLING PRICE TRENDS
                    TABLE 13 FOLIAR SPRAY MARKET: AVERAGE SELLING PRICE, BY PRODUCT TYPE, 2018–2023 (USD PER METRIC TON)
                    TABLE 14 FOLIAR SPRAY MARKET: AVERAGE SELLING PRICE, BY REGION, 2018–2023 (USD PER METRIC TON)
    6.11 REGULATORY FRAMEWORK 
           6.11.1 REGULATORY BODIES, GOVERNMENT AGENCIES, AND OTHER ORGANIZATIONS
                    TABLE 15 NORTH AMERICA: LIST OF REGULATORY BODIES, GOVERNMENT AGENCIES, AND OTHER ORGANIZATIONS
                    TABLE 16 EUROPE: LIST OF REGULATORY BODIES, GOVERNMENT AGENCIES, AND OTHER ORGANIZATIONS
                    TABLE 17 ASIA PACIFIC: LIST OF REGULATORY BODIES, GOVERNMENT AGENCIES, AND OTHER ORGANIZATIONS
           6.11.2 NORTH AMERICA: FOLIAR SPRAY FERTILIZER REGULATIONS
                    6.11.2.1 US
                    6.11.2.2 Canada
           6.11.3 EUROPE: FOLIAR SPRAY FERTILIZER REGULATIONS
           6.11.4 ASIA PACIFIC: FOLIAR SPRAY FERTILIZER REGULATIONS
                    6.11.4.1 Australia
                    6.11.4.2 China
                    6.11.4.3 India
    6.12 KEY STAKEHOLDERS AND BUYING CRITERIA 
                    FIGURE 30 INFLUENCE OF STAKEHOLDERS ON BUYING PROCESS FOR CROP TYPES
                    TABLE 18 INFLUENCE OF STAKEHOLDERS ON BUYING PROCESS FOR CROP TYPES
                    FIGURE 31 KEY BUYING CRITERIA FOR CROP TYPES
                    TABLE 19 KEY BUYING CRITERIA FOR CROP TYPES
    6.13 KEY CONFERENCES & EVENTS 
                    TABLE 20 KEY CONFERENCES & EVENTS, 2023–2024
 
7 FOLIAR SPRAY MARKET, BY PRODUCT TYPE (Page No. - 82)
    7.1 INTRODUCTION 
           FIGURE 32 FOLIAR SPRAY MARKET, BY PRODUCT TYPE, 2023 VS. 2028
           TABLE 21 FOLIAR SPRAY MARKET, BY PRODUCT TYPE, 2018–2022 (USD MILLION)
           TABLE 22 FOLIAR SPRAY MARKET, BY PRODUCT TYPE, 2023–2028 (USD MILLION)
           TABLE 23 FOLIAR SPRAY MARKET, BY PRODUCT TYPE, 2018–2022 (KT)
           TABLE 24 FOLIAR SPRAY MARKET, BY PRODUCT TYPE, 2023–2028 (KT)
    7.2 NITROGENOUS 
           7.2.1 NEED FOR ENHANCED PLANT GROWTH AND DEVELOPMENT TO DRIVE USE OF NITROGENOUS FOLIAR SPRAY FERTILIZERS
           7.2.2 UREA
           7.2.3 AMMONIUM NITRATE
           7.2.4 AMMONIUM SULFATE
           7.2.5 CALCIUM NITRATE
                    TABLE 25 NITROGENOUS: FOLIAR SPRAY MARKET, BY REGION, 2018–2022 (USD MILLION)
                    TABLE 26 NITROGENOUS: FOLIAR SPRAY MARKET, BY REGION, 2023–2028 (USD MILLION)
                    TABLE 27 NITROGENOUS: FOLIAR SPRAY MARKET, BY REGION, 2018–2022 (KT)
                    TABLE 28 NITROGENOUS: FOLIAR SPRAY MARKET, BY REGION, 2023–2028 (KT)
    7.3 PHOSPHATIC 
           7.3.1 NEED TO MAXIMIZE CROP YIELD TO DRIVE ADOPTION OF PHOSPHATIC FOLIAR SPRAY FERTILIZERS
           7.3.2 MONOAMMONIUM PHOSPHATE (MAP)
           7.3.3 DIAMMONIUM PHOSPHATE (DAP)
           7.3.4 PHOSPHORIC ACID
                    TABLE 29 PHOSPHATIC: FOLIAR SPRAY MARKET, BY REGION, 2018–2022 (USD MILLION)
                    TABLE 30 PHOSPHATIC: FOLIAR SPRAY MARKET, BY REGION, 2023–2028 (USD MILLION)
                    TABLE 31 PHOSPHATIC: FOLIAR SPRAY MARKET, BY REGION, 2018–2022 (KT)
                    TABLE 32 PHOSPHATIC: FOLIAR SPRAY MARKET, BY REGION, 2023–2028 (KT)
    7.4 POTASSIC 
           7.4.1 APPLICATION OF POTASSIC FERTILIZERS THROUGH FOLIAR SPRAYS TO OFFER COMPETITIVE ADVANTAGE TO FARMERS
           7.4.2 POTASSIUM NITRATE
           7.4.3 POTASSIUM SULFATE
           7.4.4 POTASSIUM CHLORIDE
           7.4.5 POTASSIUM CARBONATE
           7.4.6 POTASSIUM PHOSPHATE
                    TABLE 33 POTASSIC: FOLIAR SPRAY MARKET, BY REGION, 2018–2022 (USD MILLION)
                    TABLE 34 POTASSIC: FOLIAR SPRAY MARKET, BY REGION, 2023–2028 (USD MILLION)
                    TABLE 35 POTASSIC: FOLIAR SPRAY MARKET, BY REGION, 2018–2022 (KT)
                    TABLE 36 POTASSIC: FOLIAR SPRAY MARKET, BY REGION, 2023–2028 (KT)
    7.5 MICRONUTRIENTS 
           7.5.1 NEED FOR EFFECTIVE PLANT GROWTH TO PROPEL DEMAND FOR FOLIAR APPLICATION OF MICRONUTRIENTS
           7.5.2 BORON
           7.5.3 IRON
           7.5.4 MANGANESE
           7.5.5 ZINC
                    TABLE 37 MICRONUTRIENTS: FOLIAR SPRAY MARKET, BY REGION, 2018–2022 (USD MILLION)
                    TABLE 38 MICRONUTRIENTS: FOLIAR SPRAY MARKET, BY REGION, 2023–2028 (USD MILLION)
                    TABLE 39 MICRONUTRIENTS: FOLIAR SPRAY MARKET, BY REGION, 2018–2022 (KT)
                    TABLE 40 MICRONUTRIENTS: FOLIAR SPRAY MARKET, BY REGION, 2023–2028 (KT)
 
8 FOLIAR SPRAY MARKET, BY FORM (Page No. - 97)
    8.1 INTRODUCTION 
           FIGURE 33 FOLIAR SPRAY MARKET, BY FORM, 2023 VS. 2028
           TABLE 41 FOLIAR SPRAY MARKET, BY FORM, 2018–2022 (USD MILLION)
           TABLE 42 FOLIAR SPRAY MARKET, BY FORM, 2023–2028 (USD MILLION)
           TABLE 43 FOLIAR SPRAY MARKET, BY FORM, 2018–2022 (KT)
           TABLE 44 FOLIAR SPRAY MARKET, BY FORM, 2023–2028 (KT)
    8.2 DRY 
           8.2.1 LONG SHELF LIFE AND EASE OF TRANSPORTATION OF DRY FOLIAR SPRAYS TO DRIVE MARKET GROWTH
                    TABLE 45 DRY: FOLIAR SPRAY MARKET, BY REGION, 2018–2022 (USD MILLION)
                    TABLE 46 DRY: FOLIAR SPRAY MARKET, BY REGION, 2023–2028 (USD MILLION)
    8.3 LIQUID 
           8.3.1 NEED FOR OPTIMUM NUTRIENT APPLICATION AT DIFFERENT CROP STAGES TO DRIVE ADOPTION OF LIQUID FOLIAR SPRAYS
                    TABLE 47 LIQUID: FOLIAR SPRAY MARKET, BY REGION, 2018–2022 (USD MILLION)
                    TABLE 48 LIQUID: FOLIAR SPRAY MARKET, BY REGION, 2023–2028 (USD MILLION)
 
9 FOLIAR SPRAY MARKET, BY CROP TYPE (Page No. - 102)
    9.1 INTRODUCTION 
           FIGURE 34 FOLIAR SPRAY MARKET, BY CROP TYPE, 2023 VS. 2028
           TABLE 49 FOLIAR SPRAY MARKET, BY CROP TYPE, 2018–2022 (USD MILLION)
           TABLE 50 FOLIAR SPRAY MARKET, BY CROP TYPE, 2023–2028 (USD MILLION)
           TABLE 51 FOLIAR SPRAY MARKET, BY CROP TYPE, 2018–2022 (KT)
           TABLE 52 FOLIAR SPRAY MARKET, BY CROP TYPE, 2023–2028 (KT)
    9.2 HORTICULTURAL CROPS 
           9.2.1 GROWING DEMAND FOR INCREASED PRODUCTIVITY TO DRIVE USE OF FOLIAR SPRAYS ON HORTICULTURAL CROPS
           9.2.2 ORCHARD CROPS
           9.2.3 VEGETABLE & FLOWER CROPS
                    TABLE 53 HORTICULTURAL CROPS: FOLIAR SPRAY MARKET, BY REGION, 2018–2022 (USD MILLION)
                    TABLE 54 HORTICULTURAL CROPS: FOLIAR SPRAY MARKET, BY REGION, 2023–2028 (USD MILLION)
                    TABLE 55 HORTICULTURAL CROPS: FOLIAR SPRAY MARKET, BY REGION, 2018–2022 (KT)
                    TABLE 56 HORTICULTURAL CROPS: FOLIAR SPRAY MARKET, BY REGION, 2023–2028 (KT)
    9.3 FIELD CROPS 
           9.3.1 DEMAND FOR HIGH-QUALITY FIELD CROPS TO DRIVE USE OF FOLIAR SPRAYS
           9.3.2 CEREALS
           9.3.3 PULSES
           9.3.4 OILSEEDS
                    TABLE 57 FIELD CROPS: FOLIAR SPRAY MARKET, BY REGION, 2018–2022 (USD MILLION)
                    TABLE 58 FIELD CROPS: FOLIAR SPRAY MARKET, BY REGION, 2023–2028 (USD MILLION)
                    TABLE 59 FIELD CROPS: FOLIAR SPRAY MARKET, BY REGION, 2018–2022 (KT)
                    TABLE 60 FIELD CROPS: FOLIAR SPRAY MARKET, BY REGION, 2023–2028 (KT)
    9.4 TURF & ORNAMENTALS 
           9.4.1 RISING DEMAND FOR ENHANCED GROWTH OF TURF AND ORNAMENTALS TO DRIVE USE OF FOLIAR SPRAYS
                    TABLE 61 TURF & ORNAMENTALS: FOLIAR SPRAY MARKET, BY REGION, 2018–2022 (USD MILLION)
                    TABLE 62 TURF & ORNAMENTALS: FOLIAR SPRAY MARKET, BY REGION, 2023–2028 (USD MILLION)
                    TABLE 63 TURF & ORNAMENTALS: FOLIAR SPRAY MARKET, BY REGION, 2018–2022 (KT)
                    TABLE 64 TURF & ORNAMENTALS: FOLIAR SPRAY MARKET, BY REGION, 2023–2028 (KT)
    9.5 OTHER CROP TYPES 
           TABLE 65 OTHER CROP TYPES: FOLIAR SPRAY MARKET, BY REGION, 2018–2022 (USD MILLION)
           TABLE 66 OTHER CROP TYPES: FOLIAR SPRAY MARKET, BY REGION, 2023–2028 (USD MILLION)
           TABLE 67 OTHER CROP TYPES: FOLIAR SPRAY MARKET, BY REGION, 2018–2022 (KT)
           TABLE 68 OTHER CROP TYPES: FOLIAR SPRAY MARKET, BY REGION, 2023–2028 (KT)
 
10 FOLIAR SPRAY MARKET, BY REGION (Page No. - 114)
     10.1 INTRODUCTION 
               FIGURE 35 GERMANY TO ACHIEVE HIGHEST GROWTH DURING FORECAST PERIOD
               TABLE 69 FOLIAR SPRAY MARKET, BY REGION, 2018–2022 (USD MILLION)
               TABLE 70 FOLIAR SPRAY MARKET, BY REGION, 2023–2028 (USD MILLION)
               TABLE 71 FOLIAR SPRAY MARKET, BY REGION, 2018–2022 (KT)
               TABLE 72 FOLIAR SPRAY MARKET, BY REGION, 2023–2028 (KT)
     10.2 NORTH AMERICA 
               TABLE 73 NORTH AMERICA: FOLIAR SPRAY MARKET, BY COUNTRY, 2018–2022 (USD MILLION)
               TABLE 74 NORTH AMERICA: FOLIAR SPRAY MARKET, BY COUNTRY, 2023–2028 (USD MILLION)
               TABLE 75 NORTH AMERICA: FOLIAR SPRAY MARKET, BY COUNTRY, 2018–2022 (KT)
               TABLE 76 NORTH AMERICA: FOLIAR SPRAY MARKET, BY COUNTRY, 2023–2028 (KT)
               TABLE 77 NORTH AMERICA: FOLIAR SPRAY MARKET, BY PRODUCT TYPE, 2018–2022 (USD MILLION)
               TABLE 78 NORTH AMERICA: FOLIAR SPRAY MARKET, BY PRODUCT TYPE, 2023–2028 (USD MILLION)
               TABLE 79 NORTH AMERICA: FOLIAR SPRAY MARKET, BY PRODUCT TYPE, 2018–2022 (KT)
               TABLE 80 NORTH AMERICA: FOLIAR SPRAY MARKET, BY PRODUCT TYPE, 2023–2028 (KT)
               TABLE 81 NORTH AMERICA: FOLIAR SPRAY MARKET, BY CROP TYPE, 2018–2022 (USD MILLION)
               TABLE 82 NORTH AMERICA: FOLIAR SPRAY MARKET, BY CROP TYPE, 2023–2028 (USD MILLION)
               TABLE 83 NORTH AMERICA: FOLIAR SPRAY MARKET, BY CROP TYPE, 2018–2022 (KT)
               TABLE 84 NORTH AMERICA: FOLIAR SPRAY MARKET, BY CROP TYPE, 2023–2028 (KT)
               TABLE 85 NORTH AMERICA: FOLIAR SPRAY MARKET, BY FORM, 2018–2022 (USD MILLION)
               TABLE 86 NORTH AMERICA: FOLIAR SPRAY MARKET, BY FORM, 2023–2028 (USD MILLION)
             10.2.1 NORTH AMERICA: RECESSION IMPACT ANALYSIS
                       FIGURE 36 NORTH AMERICA: RECESSION IMPACT ANALYSIS
             10.2.2 US
                       10.2.2.1 Growing demand for high-quality food to drive growth of foliar spray market
                                   TABLE 87 US: FOLIAR SPRAY MARKET, BY PRODUCT TYPE, 2018–2022 (USD MILLION)
                                   TABLE 88 US: FOLIAR SPRAY MARKET, BY PRODUCT TYPE, 2023–2028 (USD MILLION)
                                   TABLE 89 US: FOLIAR SPRAY MARKET, BY PRODUCT TYPE, 2018–2022 (KT)
                                   TABLE 90 US: FOLIAR SPRAY MARKET, BY PRODUCT TYPE, 2023–2028 (KT)
             10.2.3 CANADA
                       10.2.3.1 Adverse climatic conditions to compel farmers to use foliar sprays
                                   TABLE 91 CANADA: FOLIAR SPRAY MARKET, BY PRODUCT TYPE, 2018–2022 (USD MILLION)
                                   TABLE 92 CANADA: FOLIAR SPRAY MARKET, BY PRODUCT TYPE, 2023–2028 (USD MILLION)
                                   TABLE 93 CANADA: FOLIAR SPRAY MARKET, BY PRODUCT TYPE, 2018–2022 (KT)
                                   TABLE 94 CANADA: FOLIAR SPRAY MARKET, BY PRODUCT TYPE, 2023–2028 (KT)
             10.2.4 MEXICO
                       10.2.4.1 Need for sustainable and profitable agriculture practices to drive foliar spray market growth
                                   TABLE 95 MEXICO: FOLIAR SPRAY MARKET, BY PRODUCT TYPE, 2018–2022 (USD MILLION)
                                   TABLE 96 MEXICO: FOLIAR SPRAY MARKET, BY PRODUCT TYPE, 2023–2028 (USD MILLION)
                                   TABLE 97 MEXICO: FOLIAR SPRAY MARKET, BY PRODUCT TYPE, 2018–2022 (KT)
                                   TABLE 98 MEXICO: FOLIAR SPRAY MARKET, BY PRODUCT TYPE, 2023–2028 (KT)
     10.3 ASIA PACIFIC 
             10.3.1 ASIA PACIFIC: RECESSION IMPACT ANALYSIS
                       FIGURE 37 ASIA PACIFIC: RECESSION IMPACT ANALYSIS
                       TABLE 99 ASIA PACIFIC: FOLIAR SPRAY MARKET, BY COUNTRY, 2018–2022 (USD MILLION)
                       TABLE 100 ASIA PACIFIC: FOLIAR SPRAY MARKET, BY COUNTRY, 2023–2028 (USD MILLION)
                       TABLE 101 ASIA PACIFIC: FOLIAR SPRAY MARKET, BY COUNTRY, 2018–2022 (KT)
                       TABLE 102 ASIA PACIFIC: FOLIAR SPRAY MARKET, BY COUNTRY, 2023–2028 (KT)
                       TABLE 103 ASIA PACIFIC: FOLIAR SPRAY MARKET, BY PRODUCT TYPE, 2018–2022 (USD MILLION)
                       TABLE 104 ASIA PACIFIC: FOLIAR SPRAY MARKET, BY PRODUCT TYPE, 2023–2028 (USD MILLION)
                       TABLE 105 ASIA PACIFIC: FOLIAR SPRAY MARKET, BY PRODUCT TYPE, 2018–2022 (KT)
                       TABLE 106 ASIA PACIFIC: FOLIAR SPRAY MARKET, BY PRODUCT TYPE, 2023–2028 (KT)
                       TABLE 107 ASIA PACIFIC: FOLIAR SPRAY MARKET, BY CROP TYPE, 2018–2022 (USD MILLION)
                       TABLE 108 ASIA PACIFIC: FOLIAR SPRAY MARKET, BY CROP TYPE, 2023–2028 (USD MILLION)
                       TABLE 109 ASIA PACIFIC: FOLIAR SPRAY MARKET, BY CROP TYPE, 2018–2022 (KT)
                       TABLE 110 ASIA PACIFIC: FOLIAR SPRAY MARKET, BY CROP TYPE, 2023–2028 (KT)
                       TABLE 111 ASIA PACIFIC: FOLIAR SPRAY MARKET, BY FORM, 2018–2022 (USD MILLION)
                       TABLE 112 ASIA PACIFIC: FOLIAR SPRAY MARKET, BY FORM, 2023–2028 (USD MILLION)
             10.3.2 CHINA
                       10.3.2.1 Increased production of horticulture crops to boost demand for foliar sprays
                                   TABLE 113 CHINA: FOLIAR SPRAY MARKET, BY PRODUCT TYPE, 2018–2022 (USD MILLION)
                                   TABLE 114 CHINA: FOLIAR SPRAY MARKET, BY PRODUCT TYPE, 2023–2028 (USD MILLION)
                                   TABLE 115 CHINA: FOLIAR SPRAY MARKET, BY PRODUCT TYPE, 2018–2022 (KT)
                                   TABLE 116 CHINA: FOLIAR SPRAY MARKET, BY PRODUCT TYPE, 2023–2028 (KT)
             10.3.3 JAPAN
                       10.3.3.1 Rising demand for high-quality crops to drive foliar spray market
                                   TABLE 117 JAPAN: FOLIAR SPRAY MARKET, BY PRODUCT TYPE, 2018–2022 (USD MILLION)
                                   TABLE 118 JAPAN: FOLIAR SPRAY MARKET, BY PRODUCT TYPE, 2023–2028 (USD MILLION)
                                   TABLE 119 JAPAN: FOLIAR SPRAY MARKET, BY PRODUCT TYPE, 2018–2022 (KT)
                                   TABLE 120 JAPAN: FOLIAR SPRAY MARKET, BY PRODUCT TYPE, 2023–2028 (KT)
             10.3.4 INDIA
                       10.3.4.1 Growth in population and increased demand for food to boost foliar spray market
                                   TABLE 121 INDIA: FOLIAR SPRAY MARKET, BY PRODUCT TYPE, 2018–2022 (USD MILLION)
                                   TABLE 122 INDIA: FOLIAR SPRAY MARKET, BY PRODUCT TYPE, 2023–2028 (USD MILLION)
                                   TABLE 123 INDIA: FOLIAR SPRAY MARKET, BY PRODUCT TYPE, 2018–2022 (KT)
                                   TABLE 124 INDIA: FOLIAR SPRAY MARKET, BY PRODUCT TYPE, 2023–2028 (KT)
             10.3.5 AUSTRALIA & NEW ZEALAND
                       10.3.5.1 Need for high crop yield to fuel adoption of foliar sprays
                                   TABLE 125 AUSTRALIA & NEW ZEALAND: FOLIAR SPRAY MARKET, BY PRODUCT TYPE, 2018–2022 (USD MILLION)
                                   TABLE 126 AUSTRALIA & NEW ZEALAND: FOLIAR SPRAY MARKET, BY PRODUCT TYPE, 2023–2028 (USD MILLION)
                                   TABLE 127 AUSTRALIA & NEW ZEALAND: FOLIAR SPRAY MARKET, BY PRODUCT TYPE, 2018–2022 (KT)
                                   TABLE 128 AUSTRALIA & NEW ZEALAND: FOLIAR SPRAY MARKET, BY PRODUCT TYPE, 2023–2028 (KT)
             10.3.6 SOUTH KOREA
                       10.3.6.1 Government initiatives and increased demand for high-yielding crops to drive adoption of foliar sprays
                                   TABLE 129 SOUTH KOREA: FOLIAR SPRAY MARKET, BY PRODUCT TYPE, 2018–2022 (USD MILLION)
                                   TABLE 130 SOUTH KOREA: FOLIAR SPRAY MARKET, BY PRODUCT TYPE, 2023–2028 (USD MILLION)
                                   TABLE 131 SOUTH KOREA: FOLIAR SPRAY MARKET, BY PRODUCT TYPE, 2018–2022 (KT)
                                   TABLE 132 SOUTH KOREA: FOLIAR SPRAY MARKET, BY PRODUCT TYPE, 2023–2028 (KT)
             10.3.7 REST OF ASIA PACIFIC
                       TABLE 133 REST OF ASIA PACIFIC: FOLIAR SPRAY MARKET, BY PRODUCT TYPE, 2018–2022 (USD MILLION)
                       TABLE 134 REST OF ASIA PACIFIC: FOLIAR SPRAY MARKET, BY PRODUCT TYPE, 2023–2028 (USD MILLION)
                       TABLE 135 REST OF ASIA PACIFIC: FOLIAR SPRAY MARKET, BY PRODUCT TYPE, 2018–2022 (KT)
                       TABLE 136 REST OF ASIA PACIFIC: FOLIAR SPRAY MARKET, BY PRODUCT TYPE, 2023–2028 (KT)
     10.4 EUROPE 
               FIGURE 38 EUROPE: FOLIAR SPRAY MARKET SNAPSHOT
             10.4.1 EUROPE: RECESSION IMPACT ANALYSIS
                       FIGURE 39 EUROPE: RECESSION IMPACT ANALYSIS
                       TABLE 137 EUROPE: FOLIAR SPRAY MARKET, BY COUNTRY, 2018–2022 (USD MILLION)
                       TABLE 138 EUROPE: FOLIAR SPRAY MARKET, BY COUNTRY, 2023–2028 (USD MILLION)
                       TABLE 139 EUROPE: FOLIAR SPRAY MARKET, BY COUNTRY, 2018–2022 (KT)
                       TABLE 140 EUROPE: FOLIAR SPRAY MARKET, BY COUNTRY, 2023–2028 (KT)
                       TABLE 141 EUROPE: FOLIAR SPRAY MARKET, BY PRODUCT TYPE, 2018–2022 (USD MILLION)
                       TABLE 142 EUROPE: FOLIAR SPRAY MARKET, BY PRODUCT TYPE, 2023–2028 (USD MILLION)
                       TABLE 143 EUROPE: FOLIAR SPRAY MARKET, BY PRODUCT TYPE, 2018–2022 (KT)
                       TABLE 144 EUROPE: FOLIAR SPRAY MARKET, BY PRODUCT TYPE, 2023–2028 (KT)
                       TABLE 145 EUROPE: FOLIAR SPRAY MARKET, BY CROP TYPE, 2018–2022 (USD MILLION)
                       TABLE 146 EUROPE: FOLIAR SPRAY MARKET, BY CROP TYPE, 2023–2028 (USD MILLION)
                       TABLE 147 EUROPE: FOLIAR SPRAY MARKET, BY CROP TYPE, 2018–2022 (KT)
                       TABLE 148 EUROPE: FOLIAR SPRAY MARKET, BY CROP TYPE, 2023–2028 (KT)
                       TABLE 149 EUROPE: FOLIAR SPRAY MARKET, BY FORM, 2018–2022 (USD MILLION)
                       TABLE 150 EUROPE: FOLIAR SPRAY MARKET, BY FORM, 2023–2028 (USD MILLION)
             10.4.2 GERMANY
                       10.4.2.1 Government initiatives to boost production of high-quality crops to drive foliar spray market
                                   TABLE 151 GERMANY: FOLIAR SPRAY MARKET, BY PRODUCT TYPE, 2018–2022 (USD MILLION)
                                   TABLE 152 GERMANY: FOLIAR SPRAY MARKET, BY PRODUCT TYPE, 2023–2028 (USD MILLION)
                                   TABLE 153 GERMANY: FOLIAR SPRAY MARKET, BY PRODUCT TYPE, 2018–2022 (KT)
                                   TABLE 154 GERMANY: FOLIAR SPRAY MARKET, BY PRODUCT TYPE, 2023–2028 (KT)
             10.4.3 FRANCE
                       10.4.3.1 Rising consumption of organic food products to drive demand for foliar sprays
                                   TABLE 155 FRANCE: FOLIAR SPRAY MARKET, BY PRODUCT TYPE, 2018–2022 (USD MILLION)
                                   TABLE 156 FRANCE: FOLIAR SPRAY MARKET, BY PRODUCT TYPE, 2023–2028 (USD MILLION)
                                   TABLE 157 FRANCE: FOLIAR SPRAY MARKET, BY PRODUCT TYPE, 2018–2022 (KT)
                                   TABLE 158 FRANCE: FOLIAR SPRAY MARKET, BY PRODUCT TYPE, 2023–2028 (KT)
             10.4.4 UK
                       10.4.4.1 Increased food demand and need for enhanced crop productivity to boost adoption of foliar spray products
                                   TABLE 159 UK: FOLIAR SPRAY MARKET, BY PRODUCT TYPE, 2018–2022 (USD MILLION)
                                   TABLE 160 UK: FOLIAR SPRAY MARKET, BY PRODUCT TYPE, 2023–2028 (USD MILLION)
                                   TABLE 161 UK: FOLIAR SPRAY MARKET, BY PRODUCT TYPE, 2018–2022 (KT)
                                   TABLE 162 UK: FOLIAR SPRAY MARKET, BY PRODUCT TYPE, 2023–2028 (KT)
             10.4.5 ITALY
                       10.4.5.1 Rising demand for premium and sustainable foods to fuel market growth of foliar sprays
                                   TABLE 163 ITALY: FOLIAR SPRAY MARKET, BY PRODUCT TYPE, 2018–2022 (USD MILLION)
                                   TABLE 164 ITALY: FOLIAR SPRAY MARKET, BY PRODUCT TYPE, 2023–2028 (USD MILLION)
                                   TABLE 165 ITALY: FOLIAR SPRAY MARKET, BY PRODUCT TYPE, 2018–2022 (KT)
                                   TABLE 166 ITALY: FOLIAR SPRAY MARKET, BY PRODUCT TYPE, 2023–2028 (KT)
             10.4.6 SPAIN
                       10.4.6.1 Growth of agriculture sector to drive demand for foliar spray products
                                   TABLE 167 SPAIN: FOLIAR SPRAY MARKET, BY PRODUCT TYPE, 2018–2022 (USD MILLION)
                                   TABLE 168 SPAIN: FOLIAR SPRAY MARKET, BY PRODUCT TYPE, 2023–2028 (USD MILLION)
                                   TABLE 169 SPAIN: FOLIAR SPRAY MARKET, BY PRODUCT TYPE, 2018–2022 (KT)
                                   TABLE 170 SPAIN: FOLIAR SPRAY MARKET, BY PRODUCT TYPE, 2023–2028 (KT)
             10.4.7 REST OF EUROPE
                       TABLE 171 REST OF EUROPE: FOLIAR SPRAY MARKET, BY PRODUCT TYPE, 2018–2022 (USD MILLION)
                       TABLE 172 REST OF EUROPE: FOLIAR SPRAY MARKET, BY PRODUCT TYPE, 2023–2028 (USD MILLION)
                       TABLE 173 REST OF EUROPE: FOLIAR SPRAY MARKET, BY PRODUCT TYPE, 2018–2022 (KT)
                       TABLE 174 REST OF EUROPE: FOLIAR SPRAY MARKET, BY PRODUCT TYPE, 2023–2028 (KT)
     10.5 SOUTH AMERICA 
             10.5.1 SOUTH AMERICA: RECESSION IMPACT ANALYSIS
                       FIGURE 40 SOUTH AMERICA: RECESSION IMPACT ANALYSIS
                       TABLE 175 SOUTH AMERICA: FOLIAR SPRAY MARKET, BY COUNTRY, 2018–2022 (USD MILLION)
                       TABLE 176 SOUTH AMERICA: FOLIAR SPRAY MARKET, BY COUNTRY, 2023–2028 (USD MILLION)
                       TABLE 177 SOUTH AMERICA: FOLIAR SPRAY MARKET, BY COUNTRY, 2018–2022 (KT)
                       TABLE 178 SOUTH AMERICA: FOLIAR SPRAY MARKET, BY COUNTRY, 2023–2028 (KT)
                       TABLE 179 SOUTH AMERICA: FOLIAR SPRAY MARKET, BY PRODUCT TYPE, 2018–2022 (USD MILLION)
                       TABLE 180 SOUTH AMERICA: FOLIAR SPRAY MARKET, BY PRODUCT TYPE, 2023–2028 (USD MILLION)
                       TABLE 181 SOUTH AMERICA: FOLIAR SPRAY MARKET, BY PRODUCT TYPE, 2018–2022 (KT)
                       TABLE 182 SOUTH AMERICA: FOLIAR SPRAY MARKET, BY PRODUCT TYPE, 2023–2028 (KT)
                       TABLE 183 SOUTH AMERICA: FOLIAR SPRAY MARKET, BY CROP TYPE, 2018–2022 (USD MILLION)
                       TABLE 184 SOUTH AMERICA: FOLIAR SPRAY MARKET, BY CROP TYPE, 2023–2028 (USD MILLION)
                       TABLE 185 SOUTH AMERICA: FOLIAR SPRAY MARKET, BY CROP TYPE, 2018–2022 (KT)
                       TABLE 186 SOUTH AMERICA: FOLIAR SPRAY MARKET, BY CROP TYPE, 2023–2028 (KT)
                       TABLE 187 SOUTH AMERICA: FOLIAR SPRAY MARKET, BY FORM, 2018–2022 (USD MILLION)
                       TABLE 188 SOUTH AMERICA: FOLIAR SPRAY MARKET, BY FORM, 2023–2028 (USD MILLION)
             10.5.2 BRAZIL
                       10.5.2.1 Steady growth in use of precision farming techniques to drive foliar spray market
                                   TABLE 189 BRAZIL: FOLIAR SPRAY MARKET, BY PRODUCT TYPE, 2018–2022 (USD MILLION)
                                   TABLE 190 BRAZIL: FOLIAR SPRAY MARKET, BY PRODUCT TYPE, 2023–2028 (USD MILLION)
                                   TABLE 191 BRAZIL: FOLIAR SPRAY MARKET, BY PRODUCT TYPE, 2018–2022 (KT)
                                   TABLE 192 BRAZIL: FOLIAR SPRAY MARKET, BY PRODUCT TYPE, 2023–2028 (KT)
             10.5.3 ARGENTINA
                       10.5.3.1 Adoption of precision agriculture technologies and decreased nutrient content in soil to drive growth of foliar spray market
                                   TABLE 193 ARGENTINA: FOLIAR SPRAY MARKET, BY PRODUCT TYPE, 2018–2022 (USD MILLION)
                                   TABLE 194 ARGENTINA: FOLIAR SPRAY MARKET, BY PRODUCT TYPE, 2023–2028 (USD MILLION)
                                   TABLE 195 ARGENTINA: FOLIAR SPRAY MARKET, BY PRODUCT TYPE, 2018–2022 (KT)
                                   TABLE 196 ARGENTINA: FOLIAR SPRAY MARKET, BY PRODUCT TYPE, 2023–2028 (KT)
             10.5.4 REST OF SOUTH AMERICA
                       TABLE 197 REST OF SOUTH AMERICA: FOLIAR SPRAY MARKET, BY PRODUCT TYPE, 2018–2022 (USD MILLION)
                       TABLE 198 REST OF SOUTH AMERICA: FOLIAR SPRAY MARKET, BY PRODUCT TYPE, 2023–2028 (USD MILLION)
                       TABLE 199 REST OF SOUTH AMERICA: FOLIAR SPRAY MARKET, BY PRODUCT TYPE, 2018–2022 (KT)
                       TABLE 200 REST OF SOUTH AMERICA: FOLIAR SPRAY MARKET, BY PRODUCT TYPE, 2023–2028 (KT)
     10.6 REST OF THE WORLD (ROW) 
             10.6.1 REST OF THE WORLD: RECESSION IMPACT
                       FIGURE 41 ROW: RECESSION IMPACT ANALYSIS
                       TABLE 201 ROW: FOLIAR SPRAY MARKET, BY REGION, 2018–2022 (USD MILLION)
                       TABLE 202 ROW: FOLIAR SPRAY MARKET, BY REGION, 2023–2028 (USD MILLION)
                       TABLE 203 ROW: FOLIAR SPRAY MARKET, BY REGION, 2018–2022 (KT)
                       TABLE 204 ROW: FOLIAR SPRAY MARKET, BY REGION, 2023–2028 (KT)
                       TABLE 205 ROW: FOLIAR SPRAY MARKET, BY PRODUCT TYPE, 2018–2022 (USD MILLION)
                       TABLE 206 ROW: FOLIAR SPRAY MARKET, BY PRODUCT TYPE, 2023–2028 (USD MILLION)
                       TABLE 207 ROW: FOLIAR SPRAY MARKET, BY PRODUCT TYPE, 2018–2022 (KT)
                       TABLE 208 ROW: FOLIAR SPRAY MARKET, BY PRODUCT TYPE, 2023–2028 (KT)
                       TABLE 209 ROW: FOLIAR SPRAY MARKET, BY CROP TYPE, 2018–2022 (USD MILLION)
                       TABLE 210 ROW: FOLIAR SPRAY MARKET, BY CROP TYPE, 2023–2028 (USD MILLION)
                       TABLE 211 ROW: FOLIAR SPRAY MARKET, BY CROP TYPE, 2018–2022 (KT)
                       TABLE 212 ROW: FOLIAR SPRAY MARKET, BY CROP TYPE, 2023–2028 (KT)
                       TABLE 213 ROW: FOLIAR SPRAY MARKET, BY FORM, 2018–2022 (USD MILLION)
                       TABLE 214 ROW: FOLIAR SPRAY MARKET, BY FORM, 2023–2028 (USD MILLION)
             10.6.2 MIDDLE EAST
                       10.6.2.1 Need for cost-efficiency in crop production to drive market growth of foliar sprays
                                   TABLE 215 MIDDLE EAST: FOLIAR SPRAY MARKET, BY PRODUCT TYPE, 2018–2022 (USD MILLION)
                                   TABLE 216 MIDDLE EAST: FOLIAR SPRAY MARKET, BY PRODUCT TYPE, 2023–2028 (USD MILLION)
                                   TABLE 217 MIDDLE EAST: FOLIAR SPRAY MARKET, BY PRODUCT TYPE, 2018–2022 (KT)
                                   TABLE 218 MIDDLE EAST: FOLIAR SPRAY MARKET, BY PRODUCT TYPE, 2023–2028 (KT)
             10.6.3 AFRICA
                       10.6.3.1 Adoption of sustainable agriculture practices to fuel market growth of foliar sprays
                                   TABLE 219 AFRICA: FOLIAR SPRAY MARKET, BY PRODUCT TYPE, 2018–2022 (USD MILLION)
                                   TABLE 220 AFRICA: FOLIAR SPRAY MARKET, BY PRODUCT TYPE, 2023–2028 (USD MILLION)
                                   TABLE 221 AFRICA: FOLIAR SPRAY MARKET, BY PRODUCT TYPE, 2018–2022 (KT)
                                   TABLE 222 AFRICA: FOLIAR SPRAY MARKET, BY PRODUCT TYPE, 2023–2028 (KT)
 
11 COMPETITIVE LANDSCAPE (Page No. - 179)
     11.1 OVERVIEW 
     11.2 STRATEGIES ADOPTED BY KEY PLAYERS 
               TABLE 223 STRATEGIES ADOPTED BY KEY PLAYERS
     11.3 HISTORICAL REVENUE ANALYSIS FOR KEY PLAYERS 
               FIGURE 42 HISTORICAL REVENUE ANALYSIS FOR KEY PLAYERS, 2020–2022 (USD BILLION)
     11.4 MARKET SHARE ANALYSIS 
               TABLE 224 MARKET SHARE ANALYSIS, 2022
     11.5 EVALUATION QUADRANT MATRIX FOR KEY PLAYERS 
             11.5.1 STARS
             11.5.2 PERVASIVE PLAYERS
             11.5.3 EMERGING LEADERS
             11.5.4 PARTICIPANTS
                       FIGURE 43 EVALUATION QUADRANT MATRIX FOR KEY PLAYERS, 2023
             11.5.5 PRODUCT FOOTPRINT
                       TABLE 225 COMPANY FOOTPRINT, BY PRODUCT TYPE
                       TABLE 226 COMPANY FOOTPRINT, BY CROP TYPE
                       TABLE 227 COMPANY FOOTPRINT, BY FORM
                       TABLE 228 COMPANY FOOTPRINT, BY REGION
                       TABLE 229 OVERALL COMPANY FOOTPRINT
     11.6 EVALUATION QUADRANT MATRIX FOR STARTUPS/SMES 
             11.6.1 PROGRESSIVE COMPANIES
             11.6.2 STARTING BLOCKS
             11.6.3 RESPONSIVE COMPANIES
             11.6.4 DYNAMIC COMPANIES
                       FIGURE 44 EVALUATION QUADRANT MATRIX FOR STARTUPS/SMES, 2023
             11.6.5 COMPETITIVE BENCHMARKING
                       TABLE 230 DETAILED LIST OF STARTUPS/SMES
                       TABLE 231 COMPETITIVE BENCHMARKING FOR STARTUPS/SMES
     11.7 COMPETITIVE SCENARIO 
               TABLE 232 FOLIAR SPRAY MARKET: DEALS, 2019–2023
               TABLE 233 FOLIAR SPRAY MARKET: OTHERS, 2019–2022
 
12 COMPANY PROFILES (Page No. - 195)
(Business overview, Products/Solutions/Services offered, Recent developments & MnM View)*
     12.1 KEY PLAYERS 
             12.1.1 EUROCHEM GROUP
                       TABLE 234 EUROCHEM GROUP: BUSINESS OVERVIEW
                       FIGURE 45 EUROCHEM GROUP INGREDIENTS: COMPANY SNAPSHOT
                       TABLE 235 EUROCHEM GROUP: PRODUCTS/SOLUTIONS/SERVICES OFFERED
                       TABLE 236 EUROCHEM GROUP: DEALS
                       TABLE 237 EUROCHEM GROUP: OTHERS
             12.1.2 NUTRIEN LTD.
                       TABLE 238 NUTRIEN LTD.: BUSINESS OVERVIEW
                       FIGURE 46 NUTRIEN LTD.: COMPANY SNAPSHOT
                       TABLE 239 NUTRIEN LTD.: PRODUCTS/SOLUTIONS/SERVICES OFFERED
                       TABLE 240 NUTRIEN LTD.: DEALS
                       TABLE 241 NUTRIEN LTD.: OTHERS
             12.1.3 K+S AKTIENGESELLSCHAFT
                       TABLE 242 K+S AKTIENGESELLSCHAFT: BUSINESS OVERVIEW
                       FIGURE 47 K+S AKTIENGESELLSCHAFT: COMPANY SNAPSHOT
                       TABLE 243 K+S AKTIENGESELLSCHAFT: PRODUCTS/SOLUTIONS/SERVICES OFFERED
                       TABLE 244 K+S AKTIENGESELLSCHAFT: DEALS
             12.1.4 YARA
                       TABLE 245 YARA: BUSINESS OVERVIEW
                       FIGURE 48 YARA: COMPANY SNAPSHOT
                       TABLE 246 YARA: PRODUCTS/SOLUTIONS/SERVICES OFFERED
                       TABLE 247 YARA: DEALS
             12.1.5 ICL
                       TABLE 248 ICL: BUSINESS OVERVIEW
                       FIGURE 49 ICL: COMPANY SNAPSHOT
                       TABLE 249 ICL: PRODUCTS/SOLUTIONS/SERVICES OFFERED
                       TABLE 250 ICL: DEALS
             12.1.6 MOSAIC
                       TABLE 251 MOSAIC: BUSINESS OVERVIEW
                       FIGURE 50 MOSAIC: COMPANY SNAPSHOT
                       TABLE 252 MOSAIC: PRODUCTS/SOLUTIONS/SERVICES OFFERED
                       TABLE 253 MOSAIC: DEALS
             12.1.7 COROMANDEL INTERNATIONAL LIMITED
                       TABLE 254 COROMANDEL INTERNATIONAL LIMITED: BUSINESS OVERVIEW
                       FIGURE 51 COROMANDEL INTERNATIONAL LIMITED: COMPANY SNAPSHOT
                       TABLE 255 COROMANDEL INTERNATIONAL LIMITED: PRODUCTS/SOLUTIONS/SERVICES OFFERED
                       TABLE 256 COROMANDEL INTERNATIONAL LIMITED: DEALS
             12.1.8 BASF SE
                       TABLE 257 BASF SE: BUSINESS OVERVIEW
                       FIGURE 52 BASF SE: COMPANY SNAPSHOT
                       TABLE 258 BASF SE: PRODUCTS/SOLUTIONS/SERVICES OFFERED
                       TABLE 259 BASF SE: DEALS
             12.1.9 SYNGENTA
                       TABLE 260 SYNGENTA: BUSINESS OVERVIEW
                       FIGURE 53 SYNGENTA: COMPANY SNAPSHOT
                       TABLE 261 SYNGENTA: PRODUCTS/SOLUTIONS/SERVICES OFFERED
             12.1.10 BAYER AG
                       TABLE 262 BAYER AG: BUSINESS OVERVIEW
                       FIGURE 54 BAYER AG: COMPANY SNAPSHOT
                       TABLE 263 BAYER AG: PRODUCTS/SOLUTIONS/SERVICES OFFERED
             12.1.11 GUJARAT STATE FERTILIZERS & CHEMICALS LTD.
                       TABLE 264 GUJARAT STATE FERTILIZERS & CHEMICALS LTD.: BUSINESS OVERVIEW
                       FIGURE 55 GUJARAT STATE FERTILIZERS & CHEMICALS LTD.: COMPANY SNAPSHOT
                       TABLE 265 GUJARAT STATE FERTILIZERS & CHEMICALS LTD.: PRODUCTS/SOLUTIONS/SERVICES OFFERED
             12.1.12 ARIES AGRO LTD.
                       TABLE 266 ARIES AGRO LTD.: BUSINESS OVERVIEW
                       FIGURE 56 ARIES AGRO LTD.: COMPANY SNAPSHOT
                       TABLE 267 ARIES AGRO LTD.: PRODUCTS/SOLUTIONS/SERVICES
             12.1.13 TRIBODYN
                       TABLE 268 TRIBODYN: BUSINESS OVERVIEW
                       TABLE 269 TRIBODYN: PRODUCTS/SOLUTIONS/SERVICES OFFERED
             12.1.14 HEBEI MONBAND WATER SOLUBLE FERTILIZER CO. LTD.
                       TABLE 270 HEBEI MONBAND WATER SOLUBLE FERTILIZER CO. LTD.: BUSINESS OVERVIEW
                       TABLE 271 HEBEI MONBAND WATER SOLUBLE FERTILIZER CO. LTD.: PRODUCTS/SOLUTIONS/SERVICES OFFERED
             12.1.15 HAIFA NEGEV TECHNOLOGIES LTD.
                       TABLE 272 HAIFA NEGEV TECHNOLOGIES LTD.: BUSINESS OVERVIEW
                       TABLE 273 HAIFA NEGEV TECHNOLOGIES LTD.: PRODUCTS/SOLUTIONS/SERVICES OFFERED
*Details on Business overview, Products/Solutions/Services offered, Recent developments & MnM View might not be captured in case of unlisted companies.
     12.2 STARTUPS/SMES 
             12.2.1 NUTRIENT TECH
             12.2.2 SICHUAN SHUCAN CHEMICAL CO. LTD.
             12.2.3 MANGALORE CHEMICALS & FERTILIZERS LTD.
             12.2.4 DEEPAK FERTILISERS AND PETROCHEMICALS CORPORATION LIMITED (DFPCL)
             12.2.5 AGROLIQUID
 
13 ADJACENT AND RELATED MARKETS (Page No. - 251)
     13.1 INTRODUCTION 
               TABLE 274 MARKETS ADJACENT TO FOLIAR SPRAY MARKET
     13.2 LIMITATIONS 
     13.3 AGRICULTURAL MICRONUTRIENTS MARKET 
             13.3.1 MARKET DEFINITION
             13.3.2 MARKET OVERVIEW
                       TABLE 275 AGRICULTURAL MICRONUTRIENTS MARKET, BY MODE OF APPLICATION, 2017–2021 (USD MILLION)
                       TABLE 276 AGRICULTURAL MICRONUTRIENTS MARKET, BY MODE OF APPLICATION, 2022–2027 (USD MILLION)
     13.4 NITROGENOUS FERTILIZERS MARKET 
             13.4.1 MARKET DEFINITION
             13.4.2 MARKET OVERVIEW
                       TABLE 277 NITROGENOUS FERTILIZERS MARKET, BY MODE OF APPLICATION, 2014–2022 (USD BILLION)
 
14 APPENDIX (Page No. - 255)
     14.1 DISCUSSION GUIDE 
     14.2 KNOWLEDGESTORE: MARKETSANDMARKETS’ SUBSCRIPTION PORTAL 
     14.3 CUSTOMIZATION OPTIONS 
     14.4 RELATED REPORTS 
     14.5 AUTHOR DETAILS 

The study involved four major activities in estimating the current size of the foliar spray market. Exhaustive secondary research was done to collect information on the market, peer market, and parent market. The next step was to validate these findings, assumptions, and sizing with industry experts across the value chain through primary research. Both top-down and bottom-up approaches were employed to estimate the complete market size. After that, market breakdown and data triangulation were used to estimate the market size of segments and subsegments.

Secondary Research

This research study involved the extensive use of secondary sources—directories and databases such as Bloomberg Businessweek and Factiva—to identify and collect information useful for a technical, market-oriented, and commercial study of the foliar spray market.

In the secondary research process, various sources such as annual reports, press releases & investor presentations of companies, white papers, food journals, certified publications, articles from recognized authors, gold & silver standard websites, directories, and databases, were referred to identify and collect information. This research study involved the extensive use of secondary sources—directories and databases such as Bloomberg Businessweek and Factiva—to identify and collect information useful for a technical, market-oriented, and commercial study of the foliar spray market.

Secondary research was mainly used to obtain key information about the industry’s supply chain, the total pool of key players, and market classification and segmentation as per the industry trends to the bottom-most level, regional markets, and key developments from both market- and technology-oriented perspectives.

Primary Research

Extensive primary research was conducted after obtaining information regarding the foliar spray market scenario through secondary research. Several primary interviews were conducted with market experts from both, the demand and supply sides across major countries of North America, Europe, Asia Pacific, the Middle East & Africa, and Latin America. Primary data was collected through questionnaires, emails, and telephonic interview. The primary sources from the supply side included various industry experts, such as Chief X Officers (CXOs), Vice Presidents (VPs), Directors, from business development, marketing, research and development teams, and related key executives from distributors; and key opinion leaders. Primary interviews were conducted to gather insights such as market statistics, data of revenue collected from the products and services, market breakdowns, market size estimations, market forecasting, and data triangulation. Primary research also helped in understanding the various trends related to types of foliar sprays, form, application, and region. Stakeholders from the demand side, such as food and beverage companies and health and personal care companies who are using foliar spray were interviewed to understand the buyer’s perspective on the suppliers, products, and their current usage of foliar spray and future outlook of their business which will affect the overall market
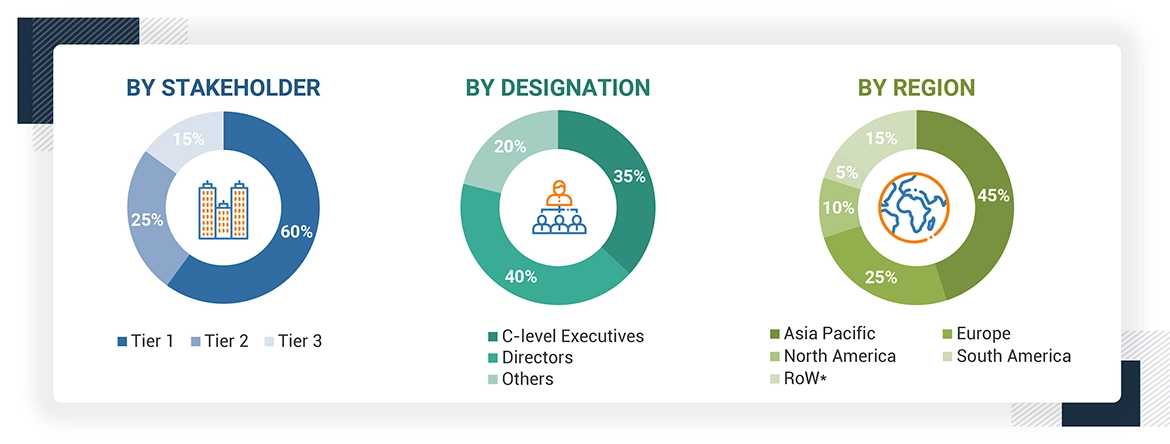
 

Foliar Spray Market Size, and Share

Company Name

Designation

EuroChem Group AG (Switzerland)

General Manager

Nutrien Ltd. (Canada)

Sales Manager

K+S Aktiengesellschaft (Germany)

Director

Yara International (Norway)

Individual Industry Expert

Israel Chemical Ltd. (Israel)

Marketing Manager

The Mosaic Company (US)

Sales Executive

Gujarat State Fertilizers & Chemicals Ltd. (India)

Sales Manager

Coromandel International Limited (India)

Individual Industry Expert

Tribodyn AG (Germany)

Manager

Hebei Monband Water Soluble Fertilizer Co., Ltd. (China)

Individual Industry Expert

Market Size Estimation

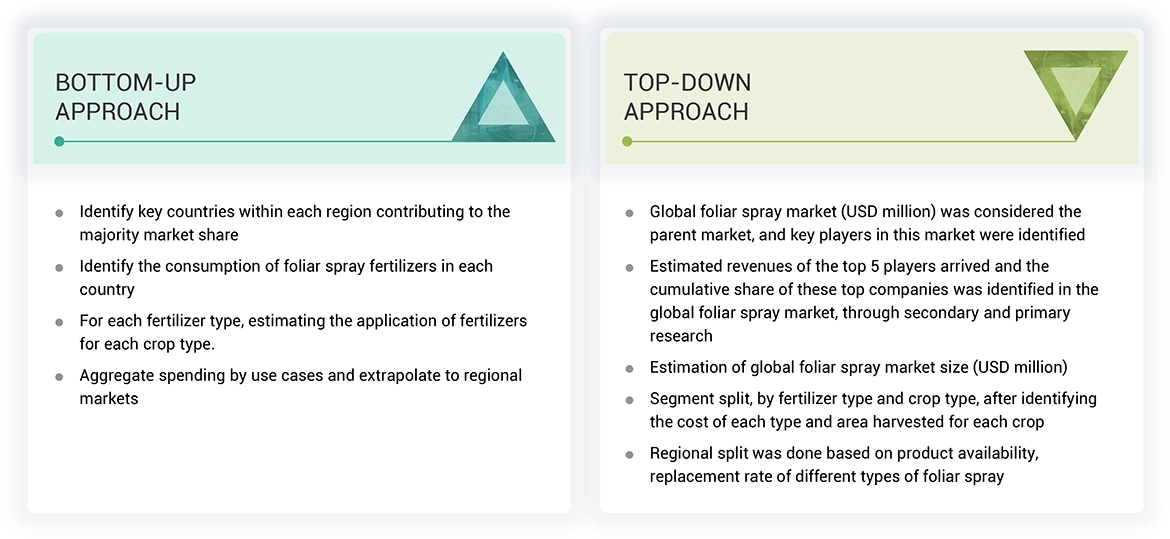
Both the top-down and bottom-up approaches were used to estimate and validate the total size of the foliar spray market. These approaches were also used extensively to determine the size of various subsegments in the market. The research methodology used to estimate the market size includes the following details:

  • The key players in the industry and the overall markets were identified through extensive secondary research.
  • The revenues of the major foliar spray players were determined through primary and secondary research, which were used as the basis for market sizing and estimation.
  • All percentage shares, splits, and breakdowns were determined using secondary sources and verified through primary sources.
  • All macroeconomic and microeconomic factors affecting the growth of the foliar spray market were considered while estimating the market size.
  • All possible parameters that affect the market covered in this research study were accounted for, viewed in extensive detail, verified through primary research, and analyzed to obtain final quantitative and qualitative data.

Global Foliar Spray Market: Bottom Up Approach

Foliar Spray Market Size, and Share

To know about the assumptions considered for the study, Request for Free Sample Report

Global Foliar Spray Market: Top Down Approach

Foliar Spray Market Size, and Share

Data Triangulation

After arriving at the overall size from the market size estimation process explained above, the total market was split into several segments and subsegments. The data triangulation and market breakdown procedures explained below were implemented, wherever applicable, to complete the overall market engineering process and arrive at the exact statistics for various market segments and subsegments. The data was triangulated by studying various factors and trends from the demand and supply sides. Along with this, the market size was validated using both the top-down and bottom-up approaches.


Market Definition

Foliar spray is the term used to describe the application of a chemical or fertilizer to plants in order to supply them with vital nutrients throughout the vegetative and generative stages. Foliar fertilization is found to increase yields, improve disease and insect resistance, increase drought tolerance, and improve crop quality. The species, fertilizer type, concentration, frequency of application all affect the plant growth. Foliar applications are scheduled with respect to vegetative or fruiting growth stages, and the fertilizer formulation is modified and adjusted accordingly.

Report Objectives

  • Determining and projecting the size of the foliar spray market, with respect to type, form, application, and regions, over five years, ranging from 2023 to 2028
  • Identifying the attractive opportunities in the market by determining the largest and fastest-growing segments across regions
  • Providing detailed information about the key factors influencing the growth of the market (drivers, restraints, opportunities, and industry-specific challenges)
  • Analyzing the micro-markets with respect to individual growth trends, prospects, and their contribution to the total market
  • Impact of macro- and microeconomic factors on the market
  • Impact of recession on the global foliar spray market
  • Shifts in demand patterns across different subsegments and regions
  • Identifying and profiling the key market players in the foliar spray market
  • Understanding the competitive landscape and identifying the major growth strategies adopted by players across the key regions

Key Stakeholders

  • Manufacturers of Foliar Spray
  • Traders, Distributors, and Suppliers of Foliar Spray
  • Agricultural Farms/Farmers/Self-Help Groups
  • Government and Research Organizations
  • Associations and Industrial Bodies
  • Research and Consulting Firms
  • R&D Institutions
  • Environment Support Agencies
  • Investment Banks and Private Equity Firms

Available Customizations

With the given market data, MarketsandMarkets offers customizations according to company-specific scientific needs.

The following customization options are available for the report:

Product Analysis

  • Product Matrix, which gives a detailed comparison of the product portfolio of each company

Geographic Analysis

With the given market data, MarketsandMarkets offers customizations according to company-specific scientific needs.

  • Further breakdown of the Rest of Europe into the Netherlands, Poland, Belgium, Sweden, and other EU & non-EU countries
  • Further breakdown of the Rest of Asia Pacific into Indonesia, Malaysia, Thailand, the Philippines, Singapore, and Vietnam.
  • Further breakdown of South America into Chile, Uruguay, and Peru.

Company Information

  • Detailed analyses and profiling of additional market players (up to five)
Custom Market Research Services

We will customize the research for you, in case the report listed above does not meet with your exact requirements. Our custom research will comprehensively cover the business information you require to help you arrive at strategic and profitable business decisions.

Request Customization

Instant Answers with GPT - Ask Now!

Ask real questions. Get complete answers !
Report Code
AGI 8663
Published ON
May, 2023
Choose License Type
BUY NOW
  • SHARE
X
Request Customization
Speak to Analyst
Speak to Analyst
OR FACE-TO-FACE MEETING
PERSONALIZE THIS RESEARCH
  • Triangulate with your Own Data
  • Get Data as per your Format and Definition
  • Gain a Deeper Dive on a Specific Application, Geography, Customer or Competitor
  • Any level of Personalization
REQUEST A FREE CUSTOMIZATION
LET US HELP YOU!
  • What are the Known and Unknown Adjacencies Impacting the Foliar Spray Market
  • What will your New Revenue Sources be?
  • Who will be your Top Customer; what will make them switch?
  • Defend your Market Share or Win Competitors
  • Get a Scorecard for Target Partners
CUSTOMIZED WORKSHOP REQUEST
+1-888-600-6441
  • Call Us
  • +1-888-600-6441 (Corporate office hours)
  • +1-888-600-6441 (US/Can toll free)
  • +44-800-368-9399 (UK office hours)
CONNECT WITH US
ABOUT TRUST ONLINE
©2024 MarketsandMarkets Research Private Ltd. All rights reserved
DMCA.com Protection Status Website Feedback