Biopreservation Market: Growth, Size, Share, and Trends

Report Code BT 1305
Published in May, 2024, By MarketsandMarkets™
Download PDF

Choose License Type

Buy Report Now Inquire Before Buying

Biopreservation Market by Product (Media [Cryopreservation, Hypothermic]), Equipment (Freezers, Refrigerators, Incubators, Centrifuge, Accessories), Biospecimen (Tissues, Organs, Stem Cells), Application (Research, Therapeutic) - Global Forecast to 2029

Overview

The global biopreservation market, valued at US$3.7 billion in 2022, is forecasted to grow at a robust CAGR of 9.8%, reaching US$4.4 billion in 2024 and an impressive US$7.1 billion by 2029. The market will grow as a result of growing advancements in the biobanks and increase in the trend of preserving newborn cord blood stem cells and rise in the need for personalized medicines. However, the expensive biopreservation techniques and stability issues with cryopreservation will restrain the market during the forecast period.

Attractive Opportunities in the Biopreservation Market

ASIA PACIFIC

Market growth in the Asia Pacific can be attributed to the growth in untapped markets of China, Japan, and India. China is considered a record a highest CAGR for Biopreservation due to high prevalence of chronic disorders.

The growth of this market can be attributed to the growing demand for organ transplants, innovation in biopreservation technologies, and growing healthcare expenditure in the countries by the government.

The rise of pharmaceutical and biotechnology industry is expected to provide lucrative opportunities for market players.

The European Biopreservation market is expected to be worth USD 1.6 billion by 2029, growing at CAGR of 9.1% during the forecast period.

High cost of equipment and stability issues are expected to pose a challenge to the growth of this market.

Global Biopreservation Market Dynamics

DRIVER: Growing healthcare expenditure

Innovative medical procedures such as organ transplants, stem cell therapy, and regenerative medicine will be on the rise with the increasing healthcare expenditure. These procedures require frequent preservation of biological samples such as tissues, cells, and organs, which will result in the increased demand for biopreservation products that can effectively retain the vitality of these materials while preserving. According to the American Medical Association (AMA), in 2022, the healthcare expenditure in the US increased by 4.1%, reaching USD 4.4 trillion or USD 13,493 per person. Similarly, Canada’s total health spending was expected to reach USD 344 billion (12% of GDP) in 2023, or USD 8,740 per Canadian.

RESTRAINT: High cost of advanced techniques

Biopreservation is of outmost importance in the storage of bio samples. This involves the specific use of media and equipment, such as freezers, refrigerators, or cryogenic and other expensive storage equipment. Because of the components involved, the media solutions for organs, as well as for cells and tissues, are expensive to produce. Equipment like liquid nitrogen storage systems and tanks, are a one-time investment for storage and transport in which huge capital is involved in the initial stages of establishing a biopreservation setup. For instance, Thermo Fisher Value Lab Upright freezers cost USD 3,510, TSX Universal ULT Freezer costs range from USD 11,600 to USD 89,400, VWR CryoPro Standard Auto-Fill Systems costs range from USD 30,766 to USD 54,341, VWR CryoPro AFX Auto-Fill Systems costs range from USD 20,847 to USD 23,762, and the MVE Fusion Series Freezers costs range from USD 51,295 to USD 62,528.


OPPORTUNITY: Growing demand for organ transplants and cell & gene therapy

Organs like heart or lung can be kept viable for transplantation for only six hours, pancreas or liver for 12 hours, and a kidney for less than 30 hours. Hence, to maintain a proper condition, it is very important to preserve these organs. The aim of the preservation is to ensure the optimal functionality of the organ after transplantation so that the damage during this time is minimal. Degenerative reactions take place when the organ is removed from the donor, this is because of the alteration of homeostasis of the organ; therefore, it is very crucial to properly preserve the organs. Moreover, the rise in the number of cell and gene therapy products in development will support the demand for biopreservation solutions to store and manage biological materials used in these therapies, which includes cells, tissues, and viral vectors. This is due to increasing investments in cell and gene therapy R&D which has led to the significant growth of the therapy pipeline, with more candidate therapies advancing into clinical trials and commercialization.

CHALLENGE: Storage and transportation logistics

Ensuring the viability and integrity of preserved biological materials is technically challenging. Issues such as ice crystal formation during freezing, contamination risks, and sample degradation over time pose significant hurdles. Maintaining consistent quality control standards is also resource intensive. Furthermore, biological samples often need to be transported at consistent low temperatures to prevent degradation. Any break in the cold chain can compromise sample viability.

Global Biopreservation Market Ecosystem Analysis

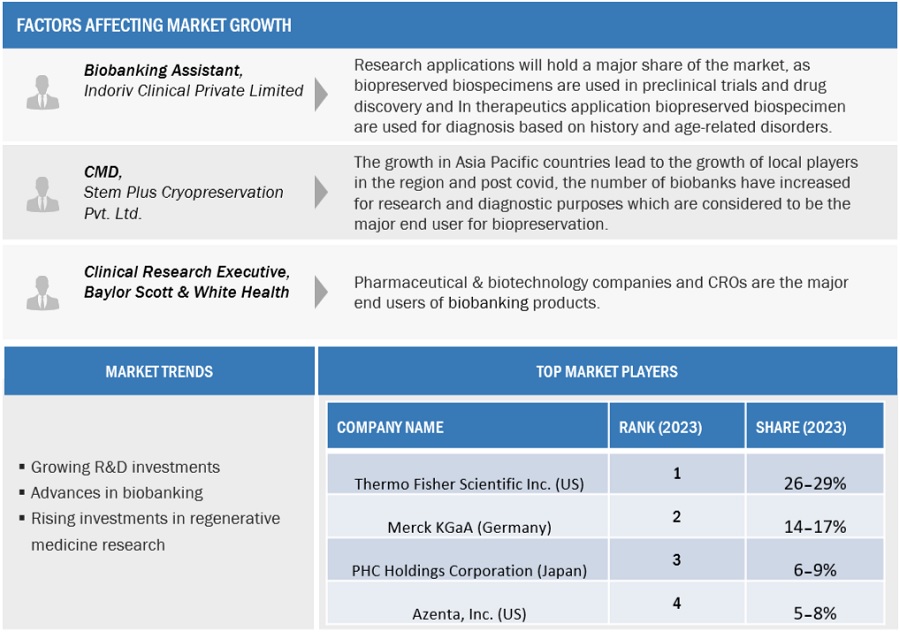
Prominent companies in this market include well-established, financially stable manufacturers of Biopreservation. These companies have been operating in the market for several years and possess diversified state-of-the-art technologies, product portfolios, and strong global sales and marketing networks. Prominent companies in this market include Thermo Fisher Scientific Inc. (US), Merck KGaA (Germany), PHC Holdings Corporation (Japan), and Azenta, Inc. (US).


In 2023, biopreservation equipment segment to observe the highest growth rate of the biopreservation industry, by product.

Based on product, the biopreservation market is segmented into media, equipment, and accessories. The biopreservation media segment accounted for the largest market share in 2023. This is attributed to the frequent and repeated purchase of media when compared to equipment, and the media reflects their versatility and importance in preserving biological samples for diverse purposes.

In 2023, research application segment to dominate the biopreservation industry, by application.

Based on the application, the biopreservation market is segmented into therapeutic applications, research applications, and other applications. The research applications segment accounted for the largest market share in 2023. The growing research investments in biomedical research, personalized medicine, cell-based research, drug discovery, and other related segments will drive the market during the forecast period.In 2023, biobanks segment to dominate the biopreservation industry, by end user.Based on the end user, the biopreservation market is segmented into biobanks, gene banks, hospitals, and other end users such as research institutes and universities, pharmaceutical companies, and contract research organizations. The biobanks segment accounted for the largest share of the market in 2023. Advances in biobanks, more number of investments by the government in the biobanking sector, and collaborative research activities are supporting the growth of this end-user segment.

North America Region Holds the Largest Share of the Biopreservation Market

The global biopreservation market is segmented into North America, Europe, Asia Pacific, Latin America, the Middle East & Africa, and GCC. North America is expected to dominate during the forecast period, primarily due to the growing availability of government funding for research activities and healthcare spending, the presence of major players in the US, and increased collaborations and partnerships between biobanks and research institutes.


Recent Developments of Biopreservation Market industry

  • In 2024, Merck invested more than USD 321.7 million (EUR 300 million) into a new Bioprocessing Production Center in Daejeon, South Korea. The new site is the largest investment by Merck’s Life Science business sector in the Asia Pacific to date and demonstrates the company’s commitment to expanding its capacities in the fast-growing region. Merck expects the investment to create approximately 300 additional jobs by the end of 2028. In 2024, Thermo Fisher Scientific introduced its newest line of high-performance, ultra-low temperature (ULT) freezers. With enhancements to performance, user experience, and energy efficiency, the Thermo Scientific TSX Universal Series ULT Freezers seamlessly adapt to scientists’ workflows across a variety of lab settings, marking a new era in performance, reliability, and sustainability.
  • In 2023, Avantor entered into an agreement with Tobin Scientific, a leading provider of biopharma cold chain, ambient storage, and transport & logistics services, to support end-to-end moves for US biopharma customers looking to relocate the labs, research facilities, and samples. This partnership will deal with the growing customer need for complex logistics solutions with temperature-specific requirements.

Key Market Players

KEY PLAYERS IN THE Biopreservation Market INCLUDE

Want to explore hidden markets that can drive new revenue in Biopreservation Market?

Scope of the Report

Report Attribute Details
Market Size & Growth Projected to reach USD 7.1 billion by 2029, growing at a CAGR of 9.8% from USD 4.4 billion in 2024.
Market Drivers Increasing organ transplants, growing healthcare expenditure, and R&D investments in regenerative medicine.
Market Restraints Expensive biopreservation techniques and stability issues with cryopreservation.
Product Segmentation Biopreservation media, equipment, and accessories. Biopreservation media holds the largest share.
Biospecimen Segmentation Human tissue samples hold the largest market share, while stem cells are expected to grow the fastest.
End-User Segmentation Biobanks hold the largest market share, driven by the demand for stem cell and tissue banking.
Geographic Insights North America holds the largest share, fueled by government investments and a rising number of biobanks.


Key Questions Addressed by the Report

What is the projected growth rate of the global biopreservation market between 2024 and 2029?
The global biopreservation market is expected to grow from USD 4.4 billion in 2024 to USD 7.1 billion by 2029, at a CAGR of 9.8%. This growth is fueled by increasing advancements in biobanks, organ transplants, and regenerative medicine, along with rising healthcare investments.
What are the key factors driving the growth of the biopreservation market?
The key factors driving the growth of the biopreservation market include rising demand for organ transplants, increasing research in regenerative medicine, expanding biobanks, and growing investments in healthcare and life science research.
What are the challenges faced by the biopreservation market?
Some of the challenges faced by the biopreservation market include the high cost of biopreservation techniques, stability issues related to cryopreservation, and the complexities of preserving biological samples for long-term storage.
Which regions are expected to show significant growth in the biopreservation market?
North America is expected to continue holding the largest market share due to substantial government investments in healthcare, organ transplants, and biobank development. Additionally, the Asia Pacific region is projected to see significant growth due to increasing healthcare spending and advancements in life science research.


Personalize This Research

  • Triangulate with your Own Data
  • Get Data as per your Format and Definition
  • Gain a Deeper Dive on a Specific Application, Geography, Customer or Competitor
  • Any level of Personalization
Request A Free Customisation

Let Us Help You

  • What are the Known and Unknown Adjacencies Impacting the Biopreservation Market
  • What will your New Revenue Sources be?
  • Who will be your Top Customer; what will make them switch?
  • Defend your Market Share or Win Competitors
  • Get a Scorecard for Target Partners
Customized Workshop Request

Table of Contents

Exclusive indicates content/data unique to MarketsandMarkets and not available with any competitors.

TITLE
PAGE NO
INTRODUCTION
27
RESEARCH METHODOLOGY
33
EXECUTIVE SUMMARY
45
PREMIUM INSIGHTS
49
MARKET OVERVIEW
53
  • 5.1 INTRODUCTION
  • 5.2 MARKET DYNAMICS
    DRIVERS
    - Growing healthcare expenditure
    - Increasing R&D investments
    - Advances in biobanking and growing trend of conserving cord blood stem cells of newborns
    - Rising investments in regenerative medicine research
    - Increasing demand for personalized medicine
    RESTRAINTS
    - High cost of advanced techniques
    - Stability issues due to tissue injury during freezing and thawing
    - Issues related to biospecimen sample management
    OPPORTUNITIES
    - Asia offers significant growth opportunities
    - Rising demand for organ transplants and cell & gene therapy
    CHALLENGES
    - Increasing demand for room temperature storage technologies
    - Storage and transportation logistics
  • 5.3 PRICING ANALYSIS
  • 5.4 PATENT ANALYSIS
  • 5.5 VALUE CHAIN ANALYSIS
  • 5.6 SUPPLY CHAIN ANALYSIS
  • 5.7 ECOSYSTEM ANALYSIS
    BIOPRESERVATION MARKET: ROLE IN ECOSYSTEM
  • 5.8 PORTER’S FIVE FORCES ANALYSIS
    THREAT OF NEW ENTRANTS
    THREAT OF SUBSTITUTES
    BARGAINING POWER OF SUPPLIERS
    BARGAINING POWER OF BUYERS
    INTENSITY OF COMPETITIVE RIVALRY
  • 5.9 REGULATORY ANALYSIS
    US
    EUROPEAN UNION
  • 5.10 TRADE ANALYSIS
  • 5.11 TECHNOLOGY ANALYSIS
    KEY TECHNOLOGIES
    - Cryopreservation
    - Hypothermic preservation
    ADJACENT TECHNOLOGIES
    - Normothermic machine perfusion
  • 5.12 KEY CONFERENCES AND EVENTS IN 2024–2025
  • 5.13 TRENDS/DISRUPTIONS IMPACTING CUSTOMER’S BUSINESS
    REVENUE SHIFT IN BIOPRESERVATION
  • 5.14 KEY STAKEHOLDERS AND BUYING CRITERIA
    KEY STAKEHOLDERS IN BUYING PROCESS
    BUYING CRITERIA
  • 5.15 INVESTMENT AND FUNDING SCENARIO
BIOPRESERVATION MARKET, BY PRODUCT
81
  • 6.1 INTRODUCTION
  • 6.2 BIOPRESERVATION MEDIA
    CRYOPRESERVATION MEDIA
    - Largest and fastest-growing segment of biopreservation media market
    HYPOTHERMIC PRESERVATION MEDIA
    - Increase in organ transplants to support segment growth
  • 6.3 BIOPRESERVATION EQUIPMENT
    TEMPERATURE CONTROL SYSTEMS
    - Freezers
    - Cryogenic storage systems
    - Thawing equipment
    - Refrigerators
    ALARM MONITORING SYSTEMS
    - Help scrutinize proper functioning of biopreservation equipment
    INCUBATORS
    - Help maintain favorable environment for cell growth
    CENTRIFUGES
    - Used for isolating and separating suspensions and immiscible liquids
    OTHER BIOPRESERVATION EQUIPMENT
  • 6.4 BIOPRESERVATION ACCESSORIES
    INDISPENSABLE AND INTEGRAL COMPONENTS OF BIOPRESERVATION PROCEDURES
BIOPRESERVATION MARKET, BY BIOSPECIMEN
114
  • 7.1 INTRODUCTION
  • 7.2 HUMAN TISSUE SAMPLES
    GROWTH IN R&D SPENDING FOR LIFE SCIENCE RESEARCH TO DRIVE MARKET
  • 7.3 ORGANS
    INCREASING NUMBER OF ORGAN TRANSPLANTS TO DRIVE MARKET GROWTH
  • 7.4 STEM CELLS
    ADVANCEMENTS IN STEM CELL THERAPY TO PROPEL MARKET
  • 7.5 OTHER BIOSPECIMENS
BIOPRESERVATION MARKET, BY APPLICATION
125
  • 8.1 INTRODUCTION
  • 8.2 RESEARCH APPLICATIONS
    GOVERNMENT INITIATIVES TO SUPPORT MARKET GROWTH
  • 8.3 THERAPEUTIC APPLICATIONS
    INCREASING UTILIZATION OF STEM CELLS FOR TREATMENT OF DISEASES TO DRIVE MARKET
  • 8.4 OTHER APPLICATIONS
BIOPRESERVATION MARKET, BY END USER
134
  • 9.1 INTRODUCTION
  • 9.2 BIOBANKS
    INCREASING RESEARCH IN FIELD OF PERSONALIZED MEDICINE TO DRIVE MARKET
  • 9.3 GENE BANKS
    GROWING GENE THERAPY APPROVALS TO SUPPORT MARKET GROWTH
  • 9.4 HOSPITALS
    GROWING NUMBER OF ORGAN TRANSPLANT PROCEDURES TO PROPEL MARKET
  • 9.5 OTHER END USERS
BIOPRESERVATION MARKET, BY REGION
146
  • 10.1 INTRODUCTION
  • 10.2 NORTH AMERICA
    RECESSION IMPACT: NORTH AMERICA
    US
    - High incidence of chronic and genetic diseases to drive market
    CANADA
    - Government funding for research and innovation to support market growth
  • 10.3 EUROPE
    EUROPE: RECESSION IMPACT
    GERMANY
    - Presence of advanced infrastructure to propel market
    UK
    - High R&D expenditure to drive market
    FRANCE
    - Advances in research activities to support market growth
    ITALY
    - Increase in life sciences research projects to drive market
    SPAIN
    - Government initiatives for development of healthcare system to support market growth
    REST OF EUROPE
  • 10.4 ASIA PACIFIC
    ASIA PACIFIC: RECESSION IMPACT
    CHINA
    - High research and development expenditure to propel market
    JAPAN
    - Government initiatives to support market growth
    INDIA
    - Increasing investments in research activities to support market growth
    REST OF ASIA PACIFIC
  • 10.5 LATIN AMERICA
    LATIN AMERICA: RECESSION IMPACT
    BRAZIL
    - High investments in pharmaceutical R&D to propel market
    MEXICO
    - Growth in pharmaceutical industry to support market growth
    REST OF LATIN AMERICA
  • 10.6 MIDDLE EAST & AFRICA
    GROWING INVESTMENTS IN STEM CELL RESEARCH TO DRIVE MARKET
    MIDDLE EAST & AFRICA: RECESSION IMPACT
  • 10.7 GCC COUNTRIES
    INCREASING HEALTHCARE SPENDING TO DRIVE MARKET
    GCC COUNTRIES: RECESSION IMPACT
COMPETITIVE LANDSCAPE
217
  • 11.1 OVERVIEW
  • 11.2 KEY PLAYER STRATEGIES/RIGHT TO WIN
  • 11.3 REVENUE ANALYSIS
  • 11.4 MARKET SHARE ANALYSIS
  • 11.5 COMPANY EVALUATION MATRIX: KEY PLAYERS, 2023
    STARS
    EMERGING LEADERS
    PERVASIVE PLAYERS
    PARTICIPANTS
    COMPANY FOOTPRINT: KEY PLAYERS, 2023
    - Company footprint
    - Regional footprint
    - Product footprint
    - Biospecimen footprint
    - Application footprint
  • 11.6 COMPANY EVALUATION MATRIX: STARTUPS/SMES, 2023
    PROGRESSIVE COMPANIES
    STARTING BLOCKS
    RESPONSIVE COMPANIES
    DYNAMIC COMPANIES
    COMPETITIVE BENCHMARKING
    COMPANY FOOTPRINT: STARTUPS/SMES, 2023
    - Company footprint
    - Product footprint
    - Regional footprint
  • 11.7 VALUATION & FINANCIAL METRICS
  • 11.8 BRAND/PRODUCT COMPARISON
  • 11.9 COMPETITIVE SCENARIO
    PRODUCT LAUNCHES
    DEALS
    EXPANSIONS
COMPANY PROFILES
236
  • 12.1 KEY PLAYERS
    THERMO FISHER SCIENTIFIC INC.
    - Business overview
    - Products offered
    - Recent developments
    - MnM view
    MERCK KGAA
    - Business overview
    - Products offered
    - Recent developments
    - MnM view
    PHC HOLDINGS CORPORATION
    - Business overview
    - Products offered
    - Recent developments
    - MnM view
    AZENTA, INC.
    - Business overview
    - Products offered
    - Recent developments
    AVANTOR, INC.
    - Business overview
    - Products offered
    - Recent developments
    SARTORIUS AG
    - Business overview
    - Products offered
    THERMOGENESIS HOLDINGS, INC.
    - Business overview
    - Products offered
    - Recent developments
    BIO-TECHNE CORPORATION
    - Business overview
    - Products offered
    BIOLIFE SOLUTIONS INC.
    - Business overview
    - Products offered
    - Recent developments
    CRYOPORT INC.
    - Business overview
    - Products offered
    - Recent developments
    SO-LOW ENVIRONMENTAL EQUIPMENT CO.
    - Business overview
    - Products offered
  • 12.2 OTHER PLAYERS
    SHANGHAI GENEXT MEDICAL TECHNOLOGY CO., LTD.
    HELMER SCIENTIFIC INC.
    ARCTIKO
    NIPPON GENETICS EUROPE
    STEMCELL TECHNOLOGIES, INC.
    AMSBIO
    OPS DIAGNOSTICS
    ASKION GMBH
    DOHMEYER
    X-THERMA, INC.
    IC BIOMEDICAL, LLC
    TAIYO NIPPON SANSO CORPORATION
    FROILABO
    CELLBIOS HEALTHCARE & LIFESCIENCES PVT. LTD.
APPENDIX
292
  • 13.1 DISCUSSION GUIDE
  • 13.2 KNOWLEDGESTORE: MARKETSANDMARKETS’ SUBSCRIPTION PORTAL
  • 13.3 CUSTOMIZATION OPTIONS
  • 13.4 RELATED REPORTS
  • 13.5 AUTHOR DETAILS
LIST OF TABLES
 
  • TABLE 1 INCLUSIONS AND EXCLUSIONS OF STUDY
  • TABLE 2 KEY DATA FROM PRIMARY SOURCES
  • TABLE 3 AVERAGE SELLING PRICE TREND OF KEY PLAYERS, BY PRODUCT
  • TABLE 4 AVERAGE SELLING PRICE TREND, BY REGION
  • TABLE 5 BIOPRESERVATION MARKET: PORTER’S FIVE FORCES ANALYSIS
  • TABLE 6 NORTH AMERICA: LIST OF REGULATORY BODIES, GOVERNMENT AGENCIES, AND OTHER ORGANIZATIONS
  • TABLE 7 EUROPE: REGULATORY BODIES, GOVERNMENT AGENCIES, AND OTHER ORGANIZATIONS
  • TABLE 8 ASIA PACIFIC: LIST OF REGULATORY BODIES, GOVERNMENT AGENCIES, AND OTHER ORGANIZATIONS
  • TABLE 9 LATIN AMERICA: LIST OF REGULATORY BODIES, GOVERNMENT AGENCIES, AND OTHER ORGANIZATIONS
  • TABLE 10 REST OF THE WORLD: LIST OF REGULATORY BODIES, GOVERNMENT AGENCIES, AND OTHER ORGANIZATIONS
  • TABLE 11 EXPORT DATA FOR HS CODE 841869, BY COUNTRY, 2019–2023 (USD BILLION)
  • TABLE 12 IMPORT DATA FOR HS CODE 841869, BY COUNTRY, 2019–2023 (USD BILLION)
  • TABLE 13 BIOPRESERVATION MARKET: DETAILED LIST OF KEY CONFERENCES AND EVENTS
  • TABLE 14 INFLUENCE OF STAKEHOLDERS ON BUYING PROCESS OF BIOPRESERVATION PRODUCTS, BY END USER
  • TABLE 15 KEY BUYING CRITERIA, BY END USER
  • TABLE 16 BIOPRESERVATION MARKET, BY PRODUCT, 2022–2029 (USD BILLION)
  • TABLE 17 BIOPRESERVATION MEDIA MARKET, BY TYPE, 2022–2029 (USD BILLION)
  • TABLE 18 BIOPRESERVATION MEDIA MARKET, BY REGION, 2022–2029 (USD BILLION)
  • TABLE 19 NORTH AMERICA: BIOPRESERVATION MEDIA MARKET, BY COUNTRY, 2022–2029 (USD BILLION)
  • TABLE 20 EUROPE: BIOPRESERVATION MEDIA MARKET, BY COUNTRY, 2022–2029 (USD BILLION)
  • TABLE 21 ASIA PACIFIC: BIOPRESERVATION MEDIA MARKET, BY COUNTRY, 2022–2029 (USD BILLION)
  • TABLE 22 LATIN AMERICA: BIOPRESERVATION MEDIA MARKET, BY COUNTRY, 2022–2029 (USD BILLION)
  • TABLE 23 CRYOPRESERVATION MEDIA MARKET, BY REGION, 2022–2029 (USD BILLION)
  • TABLE 24 NORTH AMERICA: CRYOPRESERVATION MEDIA MARKET, BY COUNTRY, 2022–2029 (USD BILLION)
  • TABLE 25 EUROPE: CRYOPRESERVATION MEDIA MARKET, BY COUNTRY, 2022–2029 (USD BILLION)
  • TABLE 26 ASIA PACIFIC: CRYOPRESERVATION MEDIA MARKET, BY COUNTRY, 2022–2029 (USD BILLION)
  • TABLE 27 LATIN AMERICA: CRYOPRESERVATION MEDIA MARKET, BY COUNTRY, 2022–2029 (USD BILLION)
  • TABLE 28 HYPOTHERMIC PRESERVATION MEDIA MARKET, BY REGION, 2022–2029 (USD BILLION)
  • TABLE 29 NORTH AMERICA: HYPOTHERMIC PRESERVATION MEDIA MARKET, BY COUNTRY, 2022–2029 (USD BILLION)
  • TABLE 30 EUROPE: HYPOTHERMIC PRESERVATION MEDIA MARKET, BY COUNTRY, 2022–2029 (USD BILLION)
  • TABLE 31 ASIA PACIFIC: HYPOTHERMIC PRESERVATION MEDIA MARKET, BY COUNTRY, 2022–2029 (USD BILLION)
  • TABLE 32 LATIN AMERICA: HYPOTHERMIC PRESERVATION MEDIA MARKET, BY COUNTRY, 2022–2029 (USD BILLION)
  • TABLE 33 BIOPRESERVATION EQUIPMENT MARKET, BY TYPE, 2022–2029 (USD BILLION)
  • TABLE 34 BIOPRESERVATION EQUIPMENT MARKET, BY REGION, 2022–2029 (USD BILLION)
  • TABLE 35 NORTH AMERICA: BIOPRESERVATION EQUIPMENT MARKET, BY COUNTRY, 2022–2029 (USD BILLION)
  • TABLE 36 EUROPE: BIOPRESERVATION EQUIPMENT MARKET, BY COUNTRY, 2022–2029 (USD BILLION)
  • TABLE 37 ASIA PACIFIC: BIOPRESERVATION EQUIPMENT MARKET, BY COUNTRY, 2022–2029 (USD BILLION)
  • TABLE 38 LATIN AMERICA; BIOPRESERVATION EQUIPMENT MARKET, BY COUNTRY, 2022–2029 (USD BILLION)
  • TABLE 39 TEMPERATURE CONTROL SYSTEMS MARKET, BY TYPE, 2022–2029 (USD BILLION)
  • TABLE 40 TEMPERATURE CONTROL SYSTEMS MARKET, BY REGION, 2022–2029 (USD BILLION)
  • TABLE 41 NORTH AMERICA: TEMPERATURE CONTROL SYSTEMS MARKET, BY COUNTRY, 2022–2029 (USD BILLION)
  • TABLE 42 EUROPE: TEMPERATURE CONTROL SYSTEMS MARKET, BY COUNTRY, 2022–2029 (USD BILLION)
  • TABLE 43 ASIA PACIFIC: TEMPERATURE CONTROL SYSTEMS MARKET, BY COUNTRY, 2022–2029 (USD BILLION)
  • TABLE 44 LATIN AMERICA: TEMPERATURE CONTROL SYSTEMS MARKET, BY COUNTRY, 2022–2029 (USD BILLION)
  • TABLE 45 FREEZERS MARKET, BY REGION, 2022–2029 (USD BILLION)
  • TABLE 46 NORTH AMERICA: FREEZERS MARKET, BY COUNTRY, 2022–2029 (USD BILLION)
  • TABLE 47 EUROPE: FREEZERS MARKET, BY COUNTRY, 2022–2029 (USD BILLION)
  • TABLE 48 ASIA PACIFIC: FREEZERS MARKET, BY COUNTRY, 2022–2029 (USD BILLION)
  • TABLE 49 LATIN AMERICA: FREEZERS MARKET, BY COUNTRY, 2022–2029 (USD BILLION)
  • TABLE 50 CRYOGENIC STORAGE SYSTEMS MARKET, BY REGION, 2022–2029 (USD BILLION)
  • TABLE 51 NORTH AMERICA: CRYOGENIC STORAGE SYSTEMS MARKET, BY COUNTRY, 2022–2029 (USD BILLION)
  • TABLE 52 EUROPE: CRYOGENIC STORAGE SYSTEMS MARKET, BY COUNTRY, 2022–2029 (USD BILLION)
  • TABLE 53 ASIA PACIFIC: CRYOGENIC STORAGE SYSTEMS MARKET, BY COUNTRY, 2022–2029 (USD BILLION)
  • TABLE 54 LATIN AMERICA: CRYOGENIC STORAGE SYSTEMS MARKET, BY COUNTRY, 2022–2029 (USD BILLION)
  • TABLE 55 THAWING EQUIPMENT MARKET, BY REGION, 2022–2029 (USD BILLION)
  • TABLE 56 NORTH AMERICA: THAWING EQUIPMENT MARKET, BY COUNTRY, 2022–2029 (USD BILLION)
  • TABLE 57 EUROPE: THAWING EQUIPMENT MARKET, BY COUNTRY, 2022–2029 (USD BILLION)
  • TABLE 58 ASIA PACIFIC: THAWING EQUIPMENT MARKET, BY COUNTRY, 2022–2029 (USD BILLION)
  • TABLE 59 LATIN AMERICA: THAWING EQUIPMENT MARKET, BY COUNTRY, 2022–2029 (USD BILLION)
  • TABLE 60 REFRIGERATORS MARKET, BY REGION, 2022–2029 (USD BILLION)
  • TABLE 61 NORTH AMERICA: REFRIGERATORS MARKET, BY COUNTRY, 2022–2029 (USD BILLION)
  • TABLE 62 EUROPE: REFRIGERATORS MARKET, BY COUNTRY, 2022–2029 (USD BILLION)
  • TABLE 63 ASIA PACIFIC: REFRIGERATORS MARKET, BY COUNTRY, 2022–2029 (USD BILLION)
  • TABLE 64 LATIN AMERICA: REFRIGERATORS MARKET, BY COUNTRY, 2022–2029 (USD BILLION)
  • TABLE 65 ALARM MONITORING SYSTEMS MARKET, BY REGION, 2022–2029 (USD BILLION)
  • TABLE 66 NORTH AMERICA: ALARM MONITORING SYSTEMS MARKET, BY COUNTRY, 2022–2029 (USD BILLION)
  • TABLE 67 EUROPE: ALARM MONITORING SYSTEMS MARKET, BY COUNTRY, 2022–2029 (USD BILLION)
  • TABLE 68 ASIA PACIFIC: ALARM MONITORING SYSTEMS MARKET, BY COUNTRY, 2022–2029 (USD BILLION)
  • TABLE 69 LATIN AMERICA: ALARM MONITORING SYSTEMS MARKET, BY COUNTRY, 2022–2029 (USD BILLION)
  • TABLE 70 INCUBATORS MARKET, BY REGION, 2022–2029 (USD BILLION)
  • TABLE 71 NORTH AMERICA: INCUBATORS MARKET, BY COUNTRY, 2022–2029 (USD BILLION)
  • TABLE 72 EUROPE: INCUBATORS MARKET, BY COUNTRY, 2022–2029 (USD BILLION)
  • TABLE 73 ASIA PACIFIC: INCUBATORS MARKET, BY COUNTRY, 2022–2029 (USD BILLION)
  • TABLE 74 LATIN AMERICA: INCUBATORS MARKET, BY COUNTRY, 2022–2029 (USD BILLION)
  • TABLE 75 CENTRIFUGES MARKET, BY REGION, 2022–2029 (USD BILLION)
  • TABLE 76 NORTH AMERICA: CENTRIFUGES MARKET, BY COUNTRY, 2022–2029 (USD BILLION)
  • TABLE 77 EUROPE: CENTRIFUGES MARKET, BY COUNTRY, 2022–2029 (USD BILLION)
  • TABLE 78 ASIA PACIFIC: CENTRIFUGES MARKET, BY COUNTRY, 2022–2029 (USD BILLION)
  • TABLE 79 LATIN AMERICA: CENTRIFUGES MARKET, BY COUNTRY, 2022–2029 (USD BILLION)
  • TABLE 80 OTHER BIOPRESERVATION EQUIPMENT MARKET, BY REGION, 2022–2029 (USD BILLION)
  • TABLE 81 NORTH AMERICA: OTHER BIOPRESERVATION EQUIPMENT MARKET, BY COUNTRY, 2022–2029 (USD BILLION)
  • TABLE 82 EUROPE: OTHER BIOPRESERVATION EQUIPMENT MARKET, BY COUNTRY, 2022–2029 (USD BILLION)
  • TABLE 83 ASIA PACIFIC: OTHER BIOPRESERVATION EQUIPMENT MARKET, BY COUNTRY, 2022–2029 (USD BILLION)
  • TABLE 84 LATIN AMERICA: OTHER BIOPRESERVATION EQUIPMENT MARKET, BY COUNTRY, 2022–2029 (USD BILLION)
  • TABLE 85 BIOPRESERVATION ACCESSORIES MARKET, BY REGION, 2022–2029 (USD BILLION)
  • TABLE 86 NORTH AMERICA: BIOPRESERVATION ACCESSORIES MARKET, BY COUNTRY, 2022–2029 (USD BILLION)
  • TABLE 87 EUROPE: BIOPRESERVATION ACCESSORIES MARKET, BY COUNTRY, 2022–2029 (USD BILLION)
  • TABLE 88 ASIA PACIFIC: BIOPRESERVATION ACCESSORIES MARKET, BY COUNTRY, 2022–2029 (USD BILLION)
  • TABLE 89 LATIN AMERICA: BIOPRESERVATION ACCESSORIES MARKET, BY COUNTRY, 2022–2029 (USD BILLION)
  • TABLE 90 BIOPRESERVATION MARKET, BY BIOSPECIMEN, 2022–2029 (USD BILLION)
  • TABLE 91 BIOPRESERVATION MARKET FOR HUMAN TISSUE SAMPLES, BY REGION, 2022–2029 (USD BILLION)
  • TABLE 92 NORTH AMERICA: BIOPRESERVATION MARKET FOR HUMAN TISSUE SAMPLES, BY COUNTRY, 2022–2029 (USD BILLION)
  • TABLE 93 EUROPE: BIOPRESERVATION MARKET FOR HUMAN TISSUE SAMPLES, BY COUNTRY, 2022–2029 (USD BILLION)
  • TABLE 94 ASIA PACIFIC: BIOPRESERVATION MARKET FOR HUMAN TISSUE SAMPLES, BY COUNTRY, 2022–2029 (USD BILLION)
  • TABLE 95 LATIN AMERICA: BIOPRESERVATION MARKET FOR HUMAN TISSUE SAMPLES, BY COUNTRY, 2022–2029 (USD BILLION)
  • TABLE 96 BIOPRESERVATION MARKET FOR ORGANS, BY REGION, 2022–2029 (USD BILLION)
  • TABLE 97 NORTH AMERICA: BIOPRESERVATION MARKET FOR ORGANS, BY COUNTRY, 2022–2029 (USD BILLION)
  • TABLE 98 EUROPE: BIOPRESERVATION MARKET FOR ORGANS, BY COUNTRY, 2022–2029 (USD BILLION)
  • TABLE 99 ASIA PACIFIC: BIOPRESERVATION MARKET FOR ORGANS, BY COUNTRY, 2022–2029 (USD BILLION)
  • TABLE 100 LATIN AMERICA: BIOPRESERVATION MARKET FOR ORGANS, BY COUNTRY, 2022–2029 (USD BILLION)
  • TABLE 101 BIOPRESERVATION MARKET FOR STEM CELLS, BY REGION, 2022–2029 (USD BILLION)
  • TABLE 102 NORTH AMERICA: BIOPRESERVATION MARKET FOR STEM CELLS, BY COUNTRY, 2022–2029 (USD BILLION)
  • TABLE 103 EUROPE: BIOPRESERVATION MARKET FOR STEM CELLS, BY COUNTRY, 2022–2029 (USD BILLION)
  • TABLE 104 ASIA PACIFIC: BIOPRESERVATION MARKET FOR STEM CELLS, BY COUNTRY, 2022–2029 (USD BILLION)
  • TABLE 105 LATIN AMERICA: BIOPRESERVATION MARKET FOR STEM CELLS, BY COUNTRY, 2022–2029 (USD BILLION)
  • TABLE 106 BIOPRESERVATION MARKET FOR OTHER BIOSPECIMENS, BY REGION, 2022–2029 (USD BILLION)
  • TABLE 107 NORTH AMERICA: BIOPRESERVATION MARKET FOR OTHER BIOSPECIMENS, BY COUNTRY, 2022–2029 (USD BILLION)
  • TABLE 108 EUROPE: BIOPRESERVATION MARKET FOR OTHER BIOSPECIMENS, BY COUNTRY, 2022–2029 (USD BILLION)
  • TABLE 109 ASIA PACIFIC: BIOPRESERVATION MARKET FOR OTHER BIOSPECIMENS, BY COUNTRY, 2022–2029 (USD BILLION)
  • TABLE 110 LATIN AMERICA: BIOPRESERVATION MARKET FOR OTHER BIOSPECIMENS, BY COUNTRY, 2022–2029 (USD BILLION)
  • TABLE 111 BIOPRESERVATION MARKET, BY APPLICATION, 2022–2029 (USD BILLION)
  • TABLE 112 BIOPRESERVATION MARKET FOR RESEARCH APPLICATIONS, BY REGION, 2022–2029 (USD BILLION)
  • TABLE 113 NORTH AMERICA: BIOPRESERVATION MARKET FOR RESEARCH APPLICATIONS, BY COUNTRY, 2022–2029 (USD BILLION)
  • TABLE 114 EUROPE: BIOPRESERVATION MARKET FOR RESEARCH APPLICATIONS, BY COUNTRY, 2022–2029 (USD BILLION)
  • TABLE 115 ASIA PACIFIC: BIOPRESERVATION MARKET FOR RESEARCH APPLICATIONS, BY COUNTRY, 2022–2029 (USD BILLION)
  • TABLE 116 LATIN AMERICA: BIOPRESERVATION MARKET FOR RESEARCH APPLICATIONS, BY COUNTRY, 2022–2029 (USD BILLION)
  • TABLE 117 BIOPRESERVATION MARKET FOR THERAPEUTIC APPLICATIONS, BY REGION, 2022–2029 (USD BILLION)
  • TABLE 118 NORTH AMERICA: BIOPRESERVATION MARKET FOR THERAPEUTIC APPLICATIONS, BY COUNTRY, 2022–2029 (USD BILLION)
  • TABLE 119 EUROPE: BIOPRESERVATION MARKET FOR THERAPEUTIC APPLICATIONS, BY COUNTRY, 2022–2029 (USD BILLION)
  • TABLE 120 ASIA PACIFIC: BIOPRESERVATION MARKET FOR THERAPEUTIC APPLICATIONS, BY COUNTRY, 2022–2029 (USD BILLION)
  • TABLE 121 LATIN AMERICA: BIOPRESERVATION MARKET FOR THERAPEUTIC APPLICATIONS, BY COUNTRY, 2022–2029 (USD BILLION)
  • TABLE 122 BIOPRESERVATION MARKET FOR OTHER APPLICATIONS, BY REGION, 2022–2029 (USD BILLION)
  • TABLE 123 NORTH AMERICA: BIOPRESERVATION MARKET FOR OTHER APPLICATIONS, BY COUNTRY, 2022–2029 (USD BILLION)
  • TABLE 124 EUROPE: BIOPRESERVATION MARKET FOR OTHER APPLICATIONS, BY COUNTRY, 2022–2029 (USD BILLION)
  • TABLE 125 ASIA PACIFIC: BIOPRESERVATION MARKET FOR OTHER APPLICATIONS, BY COUNTRY, 2022–2029 (USD BILLION)
  • TABLE 126 LATIN AMERICA: BIOPRESERVATION MARKET FOR OTHER APPLICATIONS, BY COUNTRY, 2022–2029 (USD BILLION)
  • TABLE 127 BIOPRESERVATION MARKET, BY END USER, 2022–2029 (USD BILLION)
  • TABLE 128 BIOPRESERVATION MARKET FOR BIOBANKS, BY REGION, 2022–2029 (USD BILLION)
  • TABLE 129 NORTH AMERICA: BIOPRESERVATION MARKET FOR BIOBANKS, BY COUNTRY, 2022–2029 (USD BILLION)
  • TABLE 130 EUROPE: BIOPRESERVATION MARKET FOR BIOBANKS, BY COUNTRY, 2022–2029 (USD BILLION)
  • TABLE 131 ASIA PACIFIC: BIOPRESERVATION MARKET FOR BIOBANKS, BY COUNTRY, 2022–2029 (USD BILLION)
  • TABLE 132 LATIN AMERICA: BIOPRESERVATION MARKET FOR BIOBANKS, BY COUNTRY, 2022–2029 (USD BILLION)
  • TABLE 133 BIOPRESERVATION MARKET FOR GENE BANKS, BY REGION, 2022–2029 (USD BILLION)
  • TABLE 134 NORTH AMERICA: BIOPRESERVATION MARKET FOR GENE BANKS, BY COUNTRY, 2022–2029 (USD BILLION)
  • TABLE 135 EUROPE: BIOPRESERVATION MARKET FOR GENE BANKS, BY COUNTRY, 2022–2029 (USD BILLION)
  • TABLE 136 ASIA PACIFIC: BIOPRESERVATION MARKET FOR GENE BANKS, BY COUNTRY, 2022–2029 (USD BILLION)
  • TABLE 137 LATIN AMERICA: BIOPRESERVATION MARKET FOR GENE BANKS, BY COUNTRY, 2022–2029 (USD BILLION)
  • TABLE 138 BIOPRESERVATION MARKET FOR HOSPITALS, BY REGION, 2022–2029 (USD BILLION)
  • TABLE 139 NORTH AMERICA: BIOPRESERVATION MARKET FOR HOSPITALS, BY COUNTRY, 2022–2029 (USD BILLION)
  • TABLE 140 EUROPE: BIOPRESERVATION MARKET FOR HOSPITALS, BY COUNTRY, 2022–2029 (USD BILLION)
  • TABLE 141 ASIA PACIFIC: BIOPRESERVATION MARKET FOR HOSPITALS, BY COUNTRY, 2022–2029 (USD BILLION)
  • TABLE 142 LATIN AMERICA: BIOPRESERVATION MARKET FOR HOSPITALS, BY COUNTRY, 2022–2029 (USD BILLION)
  • TABLE 143 BIOPRESERVATION MARKET FOR OTHER END USERS, BY REGION, 2022–2029 (USD BILLION)
  • TABLE 144 NORTH AMERICA: BIOPRESERVATION MARKET FOR OTHER END USERS, BY COUNTRY, 2022–2029 (USD BILLION)
  • TABLE 145 EUROPE: BIOPRESERVATION MARKET FOR OTHER END USERS, BY COUNTRY, 2022–2029 (USD BILLION)
  • TABLE 146 ASIA PACIFIC: BIOPRESERVATION MARKET FOR OTHER END USERS, BY COUNTRY, 2022–2029 (USD BILLION)
  • TABLE 147 LATIN AMERICA: BIOPRESERVATION MARKET FOR OTHER END USERS, BY COUNTRY, 2022–2029 (USD BILLION)
  • TABLE 148 BIOPRESERVATION MARKET, BY REGION, 2022–2029 (USD BILLION)
  • TABLE 149 NORTH AMERICA: BIOPRESERVATION MARKET, BY COUNTRY, 2022–2029 (USD BILLION)
  • TABLE 150 NORTH AMERICA: BIOPRESERVATION MARKET, BY PRODUCT, 2022–2029 (USD BILLION)
  • TABLE 151 NORTH AMERICA: BIOPRESERVATION MEDIA MARKET, BY TYPE, 2022–2029 (USD BILLION)
  • TABLE 152 NORTH AMERICA: BIOPRESERVATION EQUIPMENT MARKET, BY TYPE, 2022–2029 (USD BILLION)
  • TABLE 153 NORTH AMERICA: TEMPERATURE CONTROL SYSTEMS MARKET, BY TYPE, 2022–2029 (USD BILLION)
  • TABLE 154 NORTH AMERICA: BIOPRESERVATION MARKET, BY BIOSPECIMEN, 2022–2029 (USD BILLION)
  • TABLE 155 NORTH AMERICA: BIOPRESERVATION MARKET, BY APPLICATION, 2022–2029 (USD BILLION)
  • TABLE 156 NORTH AMERICA: BIOPRESERVATION MARKET, BY END USER, 2022–2029 (USD BILLION)
  • TABLE 157 US: BIOPRESERVATION MARKET, BY PRODUCT, 2022–2029 (USD BILLION)
  • TABLE 158 US: BIOPRESERVATION MEDIA MARKET, BY TYPE, 2022–2029 (USD BILLION)
  • TABLE 159 US: BIOPRESERVATION EQUIPMENT MARKET, BY TYPE, 2022–2029 (USD BILLION)
  • TABLE 160 US: TEMPERATURE CONTROL SYSTEMS MARKET, BY TYPE, 2022–2029 (USD BILLION)
  • TABLE 161 US: BIOPRESERVATION MARKET, BY BIOSPECIMEN, 2022–2029 (USD BILLION)
  • TABLE 162 US: BIOPRESERVATION MARKET, BY APPLICATION, 2022–2029 (USD BILLION)
  • TABLE 163 US: BIOPRESERVATION MARKET, BY END USER, 2022–2029 (USD BILLION)
  • TABLE 164 US: BIOPRESERVATION MARKET, BY TRANSPLANT TYPE, 2022–2029 (THOUSAND)
  • TABLE 165 CANADA: BIOPRESERVATION MARKET, BY PRODUCT, 2022–2029 (USD BILLION)
  • TABLE 166 CANADA: BIOPRESERVATION MEDIA MARKET, BY TYPE, 2022–2029 (USD BILLION)
  • TABLE 167 CANADA: BIOPRESERVATION EQUIPMENT MARKET, BY TYPE, 2022–2029 (USD BILLION)
  • TABLE 168 CANADA: TEMPERATURE CONTROL SYSTEMS MARKET, BY TYPE, 2022–2029 (USD BILLION)
  • TABLE 169 CANADA: BIOPRESERVATION MARKET, BY BIOSPECIMEN, 2022–2029 (USD BILLION)
  • TABLE 170 CANADA: BIOPRESERVATION MARKET, BY APPLICATION, 2022–2029 (USD BILLION)
  • TABLE 171 CANADA: BIOPRESERVATION MARKET, BY END USER, 2022–2029 (USD BILLION)
  • TABLE 172 EUROPE: BIOPRESERVATION MARKET, BY COUNTRY, 2022–2029 (USD BILLION)
  • TABLE 173 EUROPE: BIOPRESERVATION MARKET, BY PRODUCT, 2022–2029 (USD BILLION)
  • TABLE 174 EUROPE: BIOPRESERVATION MEDIA MARKET, BY TYPE, 2022–2029 (USD BILLION)
  • TABLE 175 EUROPE: BIOPRESERVATION EQUIPMENT MARKET, BY TYPE, 2022–2029 (USD BILLION)
  • TABLE 176 EUROPE: TEMPERATURE CONTROL SYSTEMS MARKET, BY TYPE, 2022–2029 (USD BILLION)
  • TABLE 177 EUROPE: BIOPRESERVATION MARKET, BY BIOSPECIMEN, 2022–2029 (USD BILLION)
  • TABLE 178 EUROPE: BIOPRESERVATION MARKET, BY APPLICATION, 2022–2029 (USD BILLION)
  • TABLE 179 EUROPE: BIOPRESERVATION MARKET, BY END USER, 2022–2029 (USD BILLION)
  • TABLE 180 GERMANY: BIOPRESERVATION MARKET, BY PRODUCT, 2022–2029 (USD BILLION)
  • TABLE 181 GERMANY: BIOPRESERVATION MEDIA MARKET, BY TYPE, 2022–2029 (USD BILLION)
  • TABLE 182 GERMANY: BIOPRESERVATION EQUIPMENT MARKET, BY TYPE, 2022–2029 (USD BILLION)
  • TABLE 183 GERMANY: TEMPERATURE CONTROL SYSTEMS MARKET, BY TYPE, 2022–2029 (USD BILLION)
  • TABLE 184 GERMANY: BIOPRESERVATION MARKET, BY BIOSPECIMEN, 2022–2029 (USD BILLION)
  • TABLE 185 GERMANY: BIOPRESERVATION MARKET, BY APPLICATION, 2022–2029 (USD BILLION)
  • TABLE 186 GERMANY: BIOPRESERVATION MARKET, BY END USER, 2022–2029 (USD BILLION)
  • TABLE 187 UK: BIOPRESERVATION MARKET, BY PRODUCT, 2022–2029 (USD BILLION)
  • TABLE 188 UK: BIOPRESERVATION MEDIA MARKET, BY TYPE, 2022–2029 (USD BILLION)
  • TABLE 189 UK: BIOPRESERVATION EQUIPMENT MARKET, BY TYPE, 2022–2029 (USD BILLION)
  • TABLE 190 UK: TEMPERATURE CONTROL SYSTEMS MARKET, BY TYPE, 2022–2029 (USD BILLION)
  • TABLE 191 UK: BIOPRESERVATION MARKET, BY BIOSPECIMEN, 2022–2029 (USD BILLION)
  • TABLE 192 UK: BIOPRESERVATION MARKET, BY APPLICATION, 2022–2029 (USD BILLION)
  • TABLE 193 UK: BIOPRESERVATION MARKET, BY END USER, 2022–2029 (USD BILLION)
  • TABLE 194 FRANCE: BIOPRESERVATION MARKET, BY PRODUCT, 2022–2029 (USD BILLION)
  • TABLE 195 FRANCE: BIOPRESERVATION MEDIA MARKET, BY TYPE, 2022–2029 (USD BILLION)
  • TABLE 196 FRANCE: BIOPRESERVATION EQUIPMENT MARKET, BY TYPE, 2022–2029 (USD BILLION)
  • TABLE 197 FRANCE: TEMPERATURE CONTROL SYSTEMS MARKET, BY TYPE, 2022–2029 (USD BILLION)
  • TABLE 198 FRANCE: BIOPRESERVATION MARKET, BY BIOSPECIMEN, 2022–2029 (USD BILLION)
  • TABLE 199 FRANCE: BIOPRESERVATION MARKET, BY APPLICATION, 2022–2029 (USD BILLION)
  • TABLE 200 FRANCE: BIOPRESERVATION MARKET, BY END USER, 2022–2029 (USD BILLION)
  • TABLE 201 ITALY: BIOPRESERVATION MARKET, BY PRODUCT, 2022–2029 (USD BILLION)
  • TABLE 202 ITALY: BIOPRESERVATION MEDIA MARKET, BY TYPE, 2022–2029 (USD BILLION)
  • TABLE 203 ITALY: BIOPRESERVATION EQUIPMENT MARKET, BY TYPE, 2022–2029 (USD BILLION)
  • TABLE 204 ITALY: TEMPERATURE CONTROL SYSTEMS MARKET, BY TYPE, 2022–2029 (USD BILLION)
  • TABLE 205 ITALY: BIOPRESERVATION MARKET, BY BIOSPECIMEN, 2022–2029 (USD BILLION)
  • TABLE 206 ITALY: BIOPRESERVATION MARKET, BY APPLICATION, 2022–2029 (USD BILLION)
  • TABLE 207 ITALY: BIOPRESERVATION MARKET, BY END USER, 2022–2029 (USD BILLION)
  • TABLE 208 SPAIN: BIOPRESERVATION MARKET, BY PRODUCT, 2022–2029 (USD BILLION)
  • TABLE 209 SPAIN: BIOPRESERVATION MEDIA MARKET, BY TYPE, 2022–2029 (USD BILLION)
  • TABLE 210 SPAIN: BIOPRESERVATION EQUIPMENT MARKET, BY TYPE, 2022–2029 (USD BILLION)
  • TABLE 211 SPAIN: TEMPERATURE CONTROL SYSTEMS MARKET, BY TYPE, 2022–2029 (USD BILLION)
  • TABLE 212 SPAIN: BIOPRESERVATION MARKET, BY BIOSPECIMEN, 2022–2029 (USD BILLION)
  • TABLE 213 SPAIN: BIOPRESERVATION MARKET, BY APPLICATION, 2022–2029 (USD BILLION)
  • TABLE 214 SPAIN: BIOPRESERVATION MARKET, BY END USER, 2022–2029 (USD BILLION)
  • TABLE 215 REST OF EUROPE: BIOPRESERVATION MARKET, BY PRODUCT, 2022–2029 (USD BILLION)
  • TABLE 216 REST OF EUROPE: BIOPRESERVATION MEDIA MARKET, BY TYPE, 2022–2029 (USD BILLION)
  • TABLE 217 REST OF EUROPE: BIOPRESERVATION EQUIPMENT MARKET, BY TYPE, 2022–2029 (USD BILLION)
  • TABLE 218 REST OF EUROPE: TEMPERATURE CONTROL SYSTEMS MARKET, BY TYPE, 2022–2029 (USD BILLION)
  • TABLE 219 REST OF EUROPE: BIOPRESERVATION MARKET, BY BIOSPECIMEN, 2022–2029 (USD BILLION)
  • TABLE 220 REST OF EUROPE: BIOPRESERVATION MARKET, BY APPLICATION, 2022–2029 (USD BILLION)
  • TABLE 221 REST OF EUROPE: BIOPRESERVATION MARKET, BY END USER, 2022–2029 (USD BILLION)
  • TABLE 222 ASIA PACIFIC: BIOPRESERVATION MARKET, BY COUNTRY, 2022–2029 (USD BILLION)
  • TABLE 223 ASIA PACIFIC: BIOPRESERVATION MARKET, BY PRODUCT, 2022–2029 (USD BILLION)
  • TABLE 224 ASIA PACIFIC: BIOPRESERVATION MEDIA MARKET, BY TYPE, 2022–2029 (USD BILLION)
  • TABLE 225 ASIA PACIFIC: BIOPRESERVATION EQUIPMENT MARKET, BY TYPE, 2022–2029 (USD BILLION)
  • TABLE 226 ASIA PACIFIC: TEMPERATURE CONTROL SYSTEMS MARKET, BY TYPE, 2022–2029 (USD BILLION)
  • TABLE 227 ASIA PACIFIC: BIOPRESERVATION MARKET, BY BIOSPECIMEN, 2022–2029 (USD BILLION)
  • TABLE 228 ASIA PACIFIC: BIOPRESERVATION MARKET, BY APPLICATION, 2022–2029 (USD BILLION)
  • TABLE 229 ASIA PACIFIC: BIOPRESERVATION MARKET, BY END USER, 2022–2029 (USD BILLION)
  • TABLE 230 CHINA: BIOPRESERVATION MARKET, BY PRODUCT, 2022–2029 (USD BILLION)
  • TABLE 231 CHINA: BIOPRESERVATION MEDIA MARKET, BY TYPE, 2022–2029 (USD BILLION)
  • TABLE 232 CHINA: BIOPRESERVATION EQUIPMENT MARKET, BY TYPE, 2022–2029 (USD BILLION)
  • TABLE 233 CHINA: TEMPERATURE CONTROL SYSTEMS MARKET, BY TYPE, 2022–2029 (USD BILLION)
  • TABLE 234 CHINA: BIOPRESERVATION MARKET, BY BIOSPECIMEN, 2022–2029 (USD BILLION)
  • TABLE 235 CHINA: BIOPRESERVATION MARKET, BY APPLICATION, 2022–2029 (USD BILLION)
  • TABLE 236 CHINA: BIOPRESERVATION MARKET, BY END USER, 2022–2029 (USD BILLION)
  • TABLE 237 JAPAN: BIOPRESERVATION MARKET, BY PRODUCT, 2022–2029 (USD BILLION)
  • TABLE 238 JAPAN: BIOPRESERVATION MEDIA MARKET, BY TYPE, 2022–2029 (USD BILLION)
  • TABLE 239 JAPAN: BIOPRESERVATION EQUIPMENT MARKET, BY TYPE, 2022–2029 (USD BILLION)
  • TABLE 240 JAPAN: TEMPERATURE CONTROL SYSTEMS MARKET, BY TYPE, 2022–2029 (USD BILLION)
  • TABLE 241 JAPAN: BIOPRESERVATION MARKET, BY BIOSPECIMEN, 2022–2029 (USD BILLION)
  • TABLE 242 JAPAN: BIOPRESERVATION MARKET, BY APPLICATION, 2022–2029 (USD BILLION)
  • TABLE 243 JAPAN: BIOPRESERVATION MARKET, BY END USER, 2022–2029 (USD BILLION)
  • TABLE 244 INDIA: BIOPRESERVATION MARKET, BY PRODUCT, 2022–2029 (USD BILLION)
  • TABLE 245 INDIA: BIOPRESERVATION MEDIA MARKET, BY TYPE, 2022–2029 (USD BILLION)
  • TABLE 246 INDIA: BIOPRESERVATION EQUIPMENT MARKET, BY TYPE, 2022–2029 (USD BILLION)
  • TABLE 247 INDIA: TEMPERATURE CONTROL SYSTEMS MARKET, BY TYPE, 2022–2029 (USD BILLION)
  • TABLE 248 INDIA: BIOPRESERVATION MARKET, BY BIOSPECIMEN, 2022–2029 (USD BILLION)
  • TABLE 249 INDIA: BIOPRESERVATION MARKET, BY APPLICATION, 2022–2029 (USD BILLION)
  • TABLE 250 INDIA: BIOPRESERVATION MARKET, BY END USER, 2022–2029 (USD BILLION)
  • TABLE 251 REST OF ASIA PACIFIC: BIOPRESERVATION MARKET, BY PRODUCT, 2022–2029 (USD BILLION)
  • TABLE 252 REST OF ASIA PACIFIC: BIOPRESERVATION MEDIA MARKET, BY TYPE, 2022–2029 (USD BILLION)
  • TABLE 253 REST OF ASIA PACIFIC: BIOPRESERVATION EQUIPMENT MARKET, BY TYPE, 2022–2029 (USD BILLION)
  • TABLE 254 REST OF ASIA PACIFIC: TEMPERATURE CONTROL SYSTEMS MARKET, BY TYPE, 2022–2029 (USD BILLION)
  • TABLE 255 REST OF ASIA PACIFIC: BIOPRESERVATION MARKET, BY BIOSPECIMEN, 2022–2029 (USD BILLION)
  • TABLE 256 REST OF ASIA PACIFIC: BIOPRESERVATION MARKET, BY APPLICATION, 2022–2029 (USD BILLION)
  • TABLE 257 REST OF ASIA PACIFIC: BIOPRESERVATION MARKET, BY END USER, 2022–2029 (USD BILLION)
  • TABLE 258 LATIN AMERICA: BIOPRESERVATION MARKET, BY COUNTRY, 2022–2029 (USD BILLION)
  • TABLE 259 LATIN AMERICA: BIOPRESERVATION MARKET, BY PRODUCT, 2022–2029 (USD BILLION)
  • TABLE 260 LATIN AMERICA: BIOPRESERVATION MEDIA MARKET, BY TYPE, 2022–2029 (USD BILLION)
  • TABLE 261 LATIN AMERICA: BIOPRESERVATION EQUIPMENT MARKET, BY TYPE, 2022–2029 (USD BILLION)
  • TABLE 262 LATIN AMERICA: TEMPERATURE CONTROL SYSTEMS MARKET, BY TYPE, 2022–2029 (USD BILLION)
  • TABLE 263 LATIN AMERICA: BIOPRESERVATION MARKET, BY BIOSPECIMEN, 2022–2029 (USD BILLION)
  • TABLE 264 LATIN AMERICA: BIOPRESERVATION MARKET, BY APPLICATION, 2022–2029 (USD BILLION)
  • TABLE 265 LATIN AMERICA: BIOPRESERVATION MARKET, BY END USER, 2022–2029 (USD BILLION)
  • TABLE 266 BRAZIL: BIOPRESERVATION MARKET, BY PRODUCT, 2022–2029 (USD BILLION)
  • TABLE 267 BRAZIL: BIOPRESERVATION MEDIA MARKET, BY TYPE, 2022–2029 (USD BILLION)
  • TABLE 268 BRAZIL: BIOPRESERVATION EQUIPMENT MARKET, BY TYPE, 2022–2029 (USD BILLION)
  • TABLE 269 BRAZIL: TEMPERATURE CONTROL SYSTEMS MARKET, BY TYPE, 2022–2029 (USD BILLION)
  • TABLE 270 BRAZIL: BIOPRESERVATION MARKET, BY BIOSPECIMEN, 2022–2029 (USD BILLION)
  • TABLE 271 BRAZIL: BIOPRESERVATION MARKET, BY APPLICATION, 2022–2029 (USD BILLION)
  • TABLE 272 BRAZIL: BIOPRESERVATION MARKET, BY END USER, 2022–2029 (USD BILLION)
  • TABLE 273 MEXICO: BIOPRESERVATION MARKET, BY PRODUCT, 2022–2029 (USD BILLION)
  • TABLE 274 MEXICO: BIOPRESERVATION MEDIA MARKET, BY TYPE, 2022–2029 (USD BILLION)
  • TABLE 275 MEXICO: BIOPRESERVATION EQUIPMENT MARKET, BY TYPE, 2022–2029 (USD BILLION)
  • TABLE 276 MEXICO: TEMPERATURE CONTROL SYSTEMS MARKET, BY TYPE, 2022–2029 (USD BILLION)
  • TABLE 277 MEXICO: BIOPRESERVATION MARKET, BY BIOSPECIMEN, 2022–2029 (USD BILLION)
  • TABLE 278 MEXICO: BIOPRESERVATION MARKET, BY APPLICATION, 2022–2029 (USD BILLION)
  • TABLE 279 MEXICO: BIOPRESERVATION MARKET, BY END USER, 2022–2029 (USD BILLION)
  • TABLE 280 REST OF LATIN AMERICA: BIOPRESERVATION MARKET, BY PRODUCT, 2022–2029 (USD BILLION)
  • TABLE 281 REST OF LATIN AMERICA: BIOPRESERVATION MEDIA MARKET, BY TYPE, 2022–2029 (USD BILLION)
  • TABLE 282 REST OF LATIN AMERICA: BIOPRESERVATION EQUIPMENT MARKET, BY TYPE, 2022–2029 (USD BILLION)
  • TABLE 283 REST OF LATIN AMERICA: TEMPERATURE CONTROL SYSTEMS MARKET, BY TYPE, 2022–2029 (USD BILLION)
  • TABLE 284 REST OF LATIN AMERICA: BIOPRESERVATION MARKET, BY BIOSPECIMEN, 2022–2029 (USD BILLION)
  • TABLE 285 REST OF LATIN AMERICA: BIOPRESERVATION MARKET, BY APPLICATION, 2022–2029 (USD BILLION)
  • TABLE 286 REST OF LATIN AMERICA: BIOPRESERVATION MARKET, BY END USER, 2022–2029 (USD BILLION)
  • TABLE 287 MIDDLE EAST & AFRICA: BIOPRESERVATION MARKET, BY PRODUCT, 2022–2029 (USD BILLION)
  • TABLE 288 MIDDLE EAST & AFRICA: BIOPRESERVATION MEDIA MARKET, BY TYPE, 2022–2029 (USD BILLION)
  • TABLE 289 MIDDLE EAST & AFRICA: BIOPRESERVATION EQUIPMENT MARKET, BY TYPE, 2022–2029 (USD BILLION)
  • TABLE 290 MIDDLE EAST & AFRICA: TEMPERATURE CONTROL SYSTEMS MARKET, BY TYPE, 2022–2029 (USD BILLION)
  • TABLE 291 MIDDLE EAST & AFRICA: BIOPRESERVATION MARKET, BY BIOSPECIMEN, 2022–2029 (USD BILLION)
  • TABLE 292 MIDDLE EAST & AFRICA: BIOPRESERVATION MARKET, BY APPLICATION, 2022–2029 (USD BILLION)
  • TABLE 293 MIDDLE EAST & AFRICA: BIOPRESERVATION MARKET, BY END USER, 2022–2029 (USD BILLION)
  • TABLE 294 GCC COUNTRIES: BIOPRESERVATION MARKET, BY PRODUCT, 2022–2029 (USD BILLION)
  • TABLE 295 GCC COUNTRIES: BIOPRESERVATION MEDIA MARKET, BY TYPE, 2022–2029 (USD BILLION)
  • TABLE 296 GCC COUNTRIES: BIOPRESERVATION EQUIPMENT MARKET, BY TYPE, 2022–2029 (USD BILLION)
  • TABLE 297 GCC COUNTRIES: TEMPERATURE CONTROL SYSTEMS MARKET, BY TYPE, 2022–2029 (USD BILLION)
  • TABLE 298 GCC COUNTRIES: BIOPRESERVATION MARKET, BY BIOSPECIMEN, 2022–2029 (USD BILLION)
  • TABLE 299 GCC COUNTRIES: BIOPRESERVATION MARKET, BY APPLICATION, 2022–2029 (USD BILLION)
  • TABLE 300 GCC COUNTRIES: BIOPRESERVATION MARKET, BY END USER, 2022–2029 (USD BILLION)
  • TABLE 301 OVERVIEW OF STRATEGIES ADOPTED BY KEY BIOPRESERVATION COMPANIES
  • TABLE 302 BIOPRESERVATION MARKET: DEGREE OF COMPETITION
  • TABLE 303 BIOPRESERVATION MARKET: REGIONAL FOOTPRINT
  • TABLE 304 BIOPRESERVATION MARKET: PRODUCT FOOTPRINT
  • TABLE 305 BIOPRESERVATION MARKET: BIOSPECIMEN FOOTPRINT
  • TABLE 306 BIOPRESERVATION MARKET: APPLICATION FOOTPRINT
  • TABLE 307 BIOPRESERVATION MARKET: DETAILED LIST OF KEY STARTUPS/SMES
  • TABLE 308 BIOPRESERVATION MARKET: COMPANY FOOTPRINT (STARTUPS/SMES)
  • TABLE 309 BIOPRESERVATION MARKET: PRODUCT FOOTPRINT (STARTUPS/SMES)
  • TABLE 310 BIOPRESERVATION MARKET: REGIONAL FOOTPRINT (STARTUPS/SMES)
  • TABLE 311 BIOPRESERVATION MARKET: PRODUCT LAUNCHES, JANUARY 2021– APRIL 2024
  • TABLE 312 BIOPRESERVATION MARKET: DEALS, JANUARY 2021– APRIL 2024
  • TABLE 313 BIOPRESERVATION MARKET: EXPANSIONS, JANUARY 2021– APRIL 2024
  • TABLE 314 THERMO FISHER SCIENTIFIC INC.: BUSINESS OVERVIEW
  • TABLE 315 THERMO FISHER SCIENTIFIC INC.: PRODUCTS OFFERED
  • TABLE 316 THERMO FISHER SCIENTIFIC INC.: PRODUCT LAUNCHES
  • TABLE 317 MERCK KGAA: BUSINESS OVERVIEW
  • TABLE 318 MERCK KGAA: PRODUCTS OFFERED
  • TABLE 319 MERCK KGAA: EXPANSIONS
  • TABLE 320 PHC HOLDINGS CORPORATION: BUSINESS OVERVIEW
  • TABLE 321 EXCHANGE RATES (UTILIZED FOR CONVERSION OF YEN TO USD)
  • TABLE 322 PHC HOLDINGS CORPORATION: PRODUCTS OFFERED
  • TABLE 323 PRODUCT LAUNCHES
  • TABLE 324 AZENTA, INC.: BUSINESS OVERVIEW
  • TABLE 325 AZENTA, INC.: PRODUCTS OFFERED
  • TABLE 326 AZENTA, INC.: PRODUCT LAUNCHES
  • TABLE 327 AZENTA, INC.: DEALS
  • TABLE 328 AVANTOR, INC.: BUSINESS OVERVIEW
  • TABLE 329 AVANTOR, INC.: PRODUCTS OFFERED
  • TABLE 330 AVANTOR, INC.: DEALS
  • TABLE 331 SARTORIUS AG: BUSINESS OVERVIEW
  • TABLE 332 EXCHANGE RATES (UTILIZED FOR CONVERSION OF EUR TO USD)
  • TABLE 333 SARTORIUS AG: PRODUCTS OFFERED
  • TABLE 334 THERMOGENESIS HOLDINGS, INC.: BUSINESS OVERVIEW
  • TABLE 335 THERMOGENESIS HOLDINGS, INC.: PRODUCTS OFFERED
  • TABLE 336 THERMOGENESIS HOLDINGS, INC.: EXPANSIONS
  • TABLE 337 BIO-TECHNE CORPORATION: BUSINESS OVERVIEW
  • TABLE 338 BIO-TECHNE CORPORATION: PRODUCTS OFFERED
  • TABLE 339 BIOLIFE SOLUTIONS, INC.: BUSINESS OVERVIEW
  • TABLE 340 BIOLIFE SOLUTIONS, INC.: PRODUCTS OFFERED
  • TABLE 341 BIOLIFE SOLUTIONS, INC.: PRODUCT LAUNCHES
  • TABLE 342 BIOLIFE SOLUTIONS, INC.: DEALS
  • TABLE 343 CRYOPORT INC.: BUSINESS OVERVIEW
  • TABLE 344 CRYOPORT INC.: PRODUCTS OFFERED
  • TABLE 345 CRYOPORT INC.: DEALS
  • TABLE 346 SO-LOW ENVIRONMENTAL EQUIPMENT CO.: BUSINESS OVERVIEW
  • TABLE 347 SO-LOW ENVIRONMENTAL EQUIPMENT CO.: PRODUCTS OFFERED
  • TABLE 348 SHANGHAI GENEXT MEDICAL TECHNOLOGY CO., LTD.: COMPANY OVERVIEW
  • TABLE 349 HELMER SCIENTIFIC INC.: COMPANY OVERVIEW
  • TABLE 350 ARCTIKO: COMPANY OVERVIEW
  • TABLE 351 NIPPON GENETICS EUROPE: COMPANY OVERVIEW
  • TABLE 352 STEMCELL TECHNOLOGIES, INC.: COMPANY OVERVIEW
  • TABLE 353 AMSBIO: COMPANY OVERVIEW
  • TABLE 354 OPS DIAGNOSTICS: COMPANY OVERVIEW
  • TABLE 355 ASKION GMBH: COMPANY OVERVIEW
  • TABLE 356 DOHMEYER: COMPANY OVERVIEW
  • TABLE 357 X-THERMA, INC.: COMPANY OVERVIEW
  • TABLE 358 IC BIOMEDICAL, LLC: COMPANY OVERVIEW
  • TABLE 359 TAIYO NIPPON SANSO CORPORATION: COMPANY OVERVIEW
  • TABLE 360 FROILABO: COMPANY OVERVIEW
  • TABLE 361 CELLBIOS HEALTHCARE & LIFESCIENCES PVT. LTD.: COMPANY OVERVIEW
LIST OF FIGURES
 
  • FIGURE 1 BIOPRESERVATION MARKET: RESEARCH DESIGN METHODOLOGY
  • FIGURE 2 KEY INDUSTRY INSIGHTS
  • FIGURE 3 BREAKDOWN OF PRIMARY INTERVIEWS: SUPPLY-SIDE AND DEMAND-SIDE PARTICIPANTS
  • FIGURE 4 BREAKDOWN OF PRIMARY INTERVIEWS: BY COMPANY TYPE, DESIGNATION, AND REGION
  • FIGURE 5 BREAKDOWN OF PRIMARY INTERVIEWS: BY END USER, DESIGNATION, AND REGION
  • FIGURE 6 BOTTOM-UP APPROACH: REVENUE-BASED APPROACH
  • FIGURE 7 CAGR PROJECTIONS: SUPPLY-SIDE ANALYSIS
  • FIGURE 8 BIOPRESERVATION MARKET: TOP-DOWN APPROACH
  • FIGURE 9 DATA TRIANGULATION METHODOLOGY
  • FIGURE 10 BIOPRESERVATION MARKET, BY PRODUCT, 2024 VS. 2029 (USD BILLION)
  • FIGURE 11 BIOPRESERVATION MARKET, BY BIOSPECIMEN, 2024 VS. 2029 (USD BILLION)
  • FIGURE 12 BIOPRESERVATION MARKET, BY APPLICATION, 2024 VS. 2029 (USD BILLION)
  • FIGURE 13 BIOPRESERVATION MARKET, BY END USER, 2024 VS. 2029 (USD BILLION)
  • FIGURE 14 GEOGRAPHICAL SNAPSHOT OF BIOPRESERVATION MARKET
  • FIGURE 15 RISING INVESTMENTS IN REGENERATIVE MEDICINE RESEARCH TO DRIVE MARKET
  • FIGURE 16 HUMAN TISSUE SAMPLES SEGMENT ACCOUNTED FOR LARGEST SHARE OF ASIA PACIFIC BIOPRESERVATION MARKET IN 2023
  • FIGURE 17 CHINA TO REGISTER HIGHEST GROWTH RATE DURING FORECAST PERIOD
  • FIGURE 18 ASIA PACIFIC MARKET TO WITNESS HIGHEST GROWTH FROM 2024 TO 2029
  • FIGURE 19 DEVELOPING MARKETS TO REGISTER HIGHER GROWTH DURING FORECAST PERIOD
  • FIGURE 20 BIOPRESERVATION MARKET DYNAMICS: DRIVERS, RESTRAINTS, OPPORTUNITIES, AND CHALLENGES
  • FIGURE 21 PERCENTAGE OF FDA-APPROVED PERSONALIZED MEDICINES (2015–2022)
  • FIGURE 22 PATENT ANALYSIS FOR CRYOGENIC STORAGE SYSTEMS (JANUARY 2014–DECEMBER 2023)
  • FIGURE 23 VALUE CHAIN ANALYSIS: MAJOR VALUE ADDED DURING MANUFACTURING & ASSEMBLY PHASES
  • FIGURE 24 BIOPRESERVATION MARKET: SUPPLY CHAIN ANALYSIS
  • FIGURE 25 BIOPRESERVATION MARKET: ECOSYSTEM ANALYSIS
  • FIGURE 26 KEY PLAYERS IN BIOPRESERVATION MARKET
  • FIGURE 27 BIOPRESERVATION MARKET: PORTER’S FIVE FORCES ANALYSIS
  • FIGURE 28 INFLUENCE OF STAKEHOLDERS ON BUYING PROCESS OF BIOPRESERVATION PRODUCTS, BY END USER
  • FIGURE 29 KEY BUYING CRITERIA FOR END USERS
  • FIGURE 30 BIOPRESERVATION MARKET: INVESTMENT & FUNDING SCENARIO
  • FIGURE 31 ORGAN TRANSPLANTATION PROCEDURES PERFORMED WORLDWIDE, BY ORGAN TYPE (2024)
  • FIGURE 32 NORTH AMERICA: BIOPRESERVATION MARKET SNAPSHOT
  • FIGURE 33 ASIA PACIFIC: BIOPRESERVATION MARKET SNAPSHOT
  • FIGURE 34 REVENUE ANALYSIS FOR KEY COMPANIES IN BIOPRESERVATION MARKET, 2019–2023 (USD MILLION)
  • FIGURE 35 BIOPRESERVATION MARKET SHARE ANALYSIS, BY KEY PLAYER (2023)
  • FIGURE 36 BIOPRESERVATION MARKET: COMPANY EVALUATION MATRIX ( KEY PLAYERS), 2023
  • FIGURE 37 BIOPRESERVATION MARKET: COMPANY FOOTPRINT
  • FIGURE 38 BIOPRESERVATION MARKET: COMPANY EVALUATION MATRIX (STARTUPS/SMES), 2023
  • FIGURE 39 EV/EBITDA OF KEY VENDORS
  • FIGURE 40 EV/REVENUE OF KEY VENDORS
  • FIGURE 41 BETA (5 YEARS) OF KEY VENDORS
  • FIGURE 42 1-YEAR PRICE TOTAL RETURN OF KEY VENDORS
  • FIGURE 43 BIOPRESERVATION MARKET: BRAND/PRODUCT COMPARATIVE ANALYSIS
  • FIGURE 44 THERMO FISHER SCIENTIFIC INC.: COMPANY SNAPSHOT (2023)
  • FIGURE 45 MERCK KGAA: COMPANY SNAPSHOT (2023)
  • FIGURE 46 PHC HOLDINGS CORPORATION: COMPANY SNAPSHOT (2023)
  • FIGURE 47 AZENTA, INC.: COMPANY SNAPSHOT (2023)
  • FIGURE 48 AVANTOR, INC.: COMPANY SNAPSHOT (2023)
  • FIGURE 49 SARTORIUS AG: COMPANY SNAPSHOT (2023)
  • FIGURE 50 THERMOGENESIS HOLDINGS, INC.: COMPANY SNAPSHOT (2023)
  • FIGURE 51 BIO-TECHNE CORPORATION: COMPANY SNAPSHOT (2023)
  • FIGURE 52 BIOLIFE SOLUTIONS, INC.: COMPANY SNAPSHOT (2023)
  • FIGURE 53 CRYOPORT INC.: COMPANY SNAPSHOT (2023)

The objective of the study is to analyze the key market dynamics, such as drivers, opportunities, challenges, restraints, and key player strategies. To track company developments such as acquisitions, product launches, expansions, collaborations, agreements, and partnerships of the leading players, the competitive landscape of the Biopreservation market to analyze market players on various parameters within the broad categories of business and product strategy. Top-down and bottom-up approaches were used to estimate the market size. To estimate the market size of segments and subsegments, the market breakdown and data triangulation were used.

The four steps involved in estimating the market size are:

Collecting Secondary Data

The secondary research data collection process involves the usage of secondary sources, directories, databases (such as Bloomberg Businessweek, Factiva, and D&B), annual reports, investor presentations, and SEC filings of companies. Secondary research was used to identify and collect information useful for the extensive, technical, market-oriented, and commercial study of the Biopreservation market. A database of the key industry leaders was also prepared using secondary research.

Collecting Primary Data

The primary research data was conducted after acquiring knowledge about the Biopreservation market scenario through secondary research. A significant number of primary interviews were conducted with stakeholders from both the demand side (such as biobanks, gene banks, hospitals, and academic research institute) and supply side (such as included various industry experts, such as Directors, Chief X Officers (CXOs), Vice Presidents (VPs) from business development, marketing, and product development teams, product manufacturers, wholesalers, channel partners, and distributors) across major countries of North America, Europe, Asia Pacific, the Middle East & Africa, Latin America, and GCC. Approximately 40% of the primary interviews were conducted with stakeholders from the demand side, while those from the supply side accounted for the remaining 60%. Primary data for this report was collected through questionnaires, emails, and telephonic interviews.

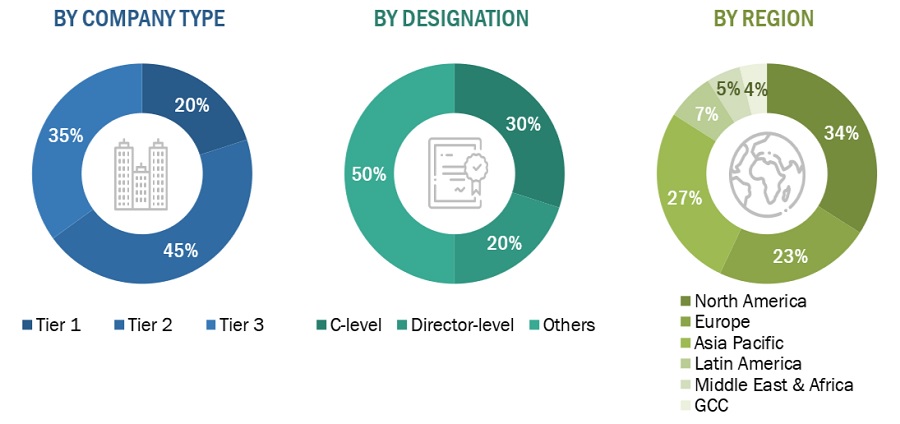
A breakdown of the primary respondents is provided below:

Breakdown of Primary Participants:
Biopreservation Market Size, and Share

Note 1: *Others include sales managers, marketing managers, and product managers.

Note 2: Tiers are defined based on a company’s total revenue as of 2023: Tier 1=> USD 1 billion, Tier 2 = USD 500 million to USD 1 billion, and Tier 3=< USD 500 million.

To know about the assumptions considered for the study, download the pdf brochure

Market Size Estimation

All major product manufacturers offering various Biopreservation were identified at the global/regional level. Revenue mapping was done for the major players and was extrapolated to arrive at the global market value of each type of segment. The market value Biopreservation market was also split into various segments and subsegments at the region and country level based on:

  • Product mapping of various manufacturers for each type of Biopreservation market at the regional and country-level 
  • Relative adoption pattern of each Biopreservation market among key application segments at the regional and/or country-level 
  • Detailed primary research to gather qualitative and quantitative information related to segments and subsegments at the regional and/or country level. 
  • Detailed secondary research to gauge the prevailing market trends at the regional and/or country-level 

Global Biopreservation Market Size: Top Down Approach

Biopreservation Market Size, and Share

To know about the assumptions considered for the study, Request for Free Sample Report

Global Biopreservation Market Size: Bottom-Up Approach
Biopreservation Market Size, and Share

Data Triangulation

After arriving at the overall market size—using the market size estimation processes—the market was split into several segments and subsegments. To complete the overall market engineering process and arrive at the exact statistics of each market segment and subsegment, data triangulation and market breakdown procedures were employed, wherever applicable. The data was triangulated by studying various factors and trends from both the demand and supply sides in the Biopreservation industry.

Market Definition

Biopreservation is a technique used for the storage of cells and tissues in a hypothermic or chemical environment to preserve biological samples with sustained integrity. The different types of biospecimen stored include human tissue samples, stem cells, and organs, which are majorly used in therapeutic and research applications. These high-yielding cell lines need to be preserved in order to provide optimum yield, viability, and productivity, which can be achieved by cryopreservation and vitrification in a hypothermic storage environment. Biopreservation is a rapidly emerging field of specimen procurement, processing, preservation and banking which requires a close collaboration between clinicians, engineers and scientists coming from academia, small private enterprises or huge industrial companies.

Key Stakeholders

  • Senior Management
  • Finance/Procurement Department
  • Doctors/HCPs
  • Researchers
  • Lab Managers/Technicians
  • End Users/Operators

Report Objectives

  • To provide detailed information about the factors influencing the market growth (such as drivers, restraints, opportunities, and challenges)
  • To define, describe, segment, and forecast the Biopreservation market by product, biospecimen, application, end user, and region.
  • To analyze market opportunities for stakeholders and provide details of the competitive landscape for key players
  • To analyze micro markets with respect to individual growth trends, prospects, and contributions to the overall Biopreservation market
  • To forecast the size of the Biopreservation market in five main regions along with their respective key countries, namely, North America, Europe, the Asia Pacific, Latin America, Middle East & Africa, and GCC.
  • To profile key players in the Biopreservation market and comprehensively analyze their core competencies and market shares
  • To track and analyze competitive developments, such as acquisitions; product launches; expansions; collaborations, agreements, & partnerships; and R&D activities of the leading players in the Biopreservation market.
  • To benchmark players within the Biopreservation market using the Competitive Leadership Mapping framework, which analyzes market players on various parameters within the broad categories of business and product strategy

Available Customizations

MarketsandMarkets offers the following customizations for this market report:

  • Additional country-level analysis of the Biopreservation market
  • Profiling of additional market players (up to 5)

Product Analysis

  • Product matrix, which provides a detailed comparison of the product portfolio of each company in the Biopreservation Market

Previous Versions of this Report

Biopreservation Market by Type (Media (Sera), Equipment (Thawing Equipment, Alarms, Freezers)), Biospecimen (Human Tissue, Stem Cells, Organs), Application (Therapeutic, Research, Clinical Trials), End User (Hospitals, Biobank) - Global Forecast to 2025

Report Code BT 1305
Published in Jun, 2020, By MarketsandMarkets™

Biopreservation Market, by Product (Media, Sera, Cryogenic Storage Systems, Thawing Equipment, Alarms), by Biospecimen (Human Tissue, Stem Cells, Organs), Application (Therapeutic, Regenerative Medicine, Clinical Trials), End User - Global Forecast to 2020

Report Code BT 1305
Published in Aug, 2015, By MarketsandMarkets™

Global Biobank (Biospecimen/ Biorepository/Biopreservation) Market for Equipment and Media - Trends and Forecast to 2017

Report Code BT 1305
Published in Oct, 2012, By MarketsandMarkets™
"Our USP is "providing game-changing business opportunities reports with free customization" - so please feel free to provide us with your specific areas of interest / business challenges in much greater detail !!"

We appreciate your interest in this report. Once you fill out the form, you'll be immediately directed to an exclusive solution tailored to your needs. This high-value offering can help boost your revenue by 30% - a must-see opportunity for anyone looking to maximize growth.


By clicking the "Submit" button, you are agreeing to the Terms of Use and Privacy Policy.

Custom Market Research Services

We Will Customise The Research For You, In Case The Report Listed Above Does Not Meet With Your Requirements

Get 10% Free Customisation

Growth opportunities and latent adjacency in Biopreservation Market

DMCA.com Protection Status