Architectural Metal Coatings Market

Report Code CH 8107
Published in Feb, 2024, By MarketsandMarkets™
Download PDF

Choose License Type

Buy Report Now Inquire Before Buying

Architectural Metal Coatings Market by Resin Type (Polyester, Fluoropolymer), Coil Coating Application (Roofing & Cladding, Wall Panels & Facades), Extrusion Coating Application (Curtain Walls, Store Front) and Region - Global Forecast to 2028

Overview

The global architectural metal coatings market was valued at USD 5.3 billion in 2023 and is projected to reach USD 6.7 billion by 2028, growing at 4.6% cagr from 2023 to 2028. The architectural metal coatings market is poised for growth, primarily driven by the anticipated rise in building and construction activity over the next five years. This surge in construction activity is expected to fuel the demand for polyester resin-based architectural metal coatings, as these coatings continue to be the go-to choice for achieving superior durability and performance in a wide range of architectural applications. The architectural metal coatings market's resilience and preference for polyester resin-based coatings are rooted in the exceptional properties that this resin type offers. As the building and construction sector experiences heightened activity, the demand for these coatings is expected to grow, underlining the pivotal role they play in enhancing the longevity and quality of architectural structures.

Attractive Opportunities in the Architectural Metal Coatings Market

ASIA PACIFIC

The market growth in Asia Pacific can be attributed to the growth of multifarious applications such as coil coatings and extrusion coatings in the region.

Increased demand for applications such as coil coatings, and extrusion coatings are attracting global architectural metal coatings manufacturers to invest in this market

Over the next five years, market players are expected to benefit significantly from investments and expansions and mergers & acquisitions.

The Asia Pacific architectural metal coatings market is expected to be worth USD 6.3 billion by 2028, growing at a CAGR of 4.7% during the forecast period

Surging demand in developing countries is an opportunity for the growth of various market players

Global Architectural Metal Coatings Market Dynamics

DRIVER: The building and construction sector is a broad field encompassing the modification, renovation, and development of residential, non-residential, and infrastructure projects. A report by Global Construction Perspectives and Oxford Economics projects a significant expansion in the global construction market, with an 85% increase forecasted, reaching a value of USD 15.5 trillion by 2030. This surge is anticipated to be primarily driven by China, the United States, and India, which are expected to account for more than half of this growth.

This robust expansion is largely attributed to the economic revitalization in major global economies. A confluence of factors is propelling this industry forward: the forces of globalization and urbanization, an uplift in living standards, enhanced purchasing power, and the strategic push towards infrastructural advancement. The need for large-scale urban centers in burgeoning economies is also a significant driver, with a growing demand for paints and coatings as a direct corollary of these construction activities.In terms of economic impact, the construction industry represents a substantial portion of the GDP, accounting for approximately 5% in advanced economies and up to 8% in developing nations. Looking forward, the demand for infrastructure is poised to escalate dramatically. Projections suggest an annual global infrastructure investment requirement of USD 3.7 trillion by the year 2040, signaling a period of intense activity and opportunity within the construction sector on a worldwide scale.The construction industry in 2023 witnessed positive growth trends, characterized by a notable 7% increase in nominal value added and a 6% increase in nominal gross output compared to the previous year. These figures reflected a robust performance in the sector. However, it's crucial to analyze these statistics in the context of real GDP data, where it becomes evident that a significant portion of the growth is driven by price inflation rather than an increase in the actual volume of construction activity. This inflationary pressure has been a key factor shaping the industry's landscape.

RESTRAINTS: In the extrusion coating industry, traditional polymers such as Low-Density Polyethylene (LDPE), Ethylene-Vinyl Acetate (EVA), and Polypropylene (PP) have been the standard. The production and processing of these polymers, however, pose environmental concerns due to the potential release of harmful by-products, which can contribute to an increased carbon footprint. Furthermore, these materials are derived from non-renewable resources, adding to their environmental impact.

In response to these challenges, there has been a shift toward bio-based polymers, which are derived from renewable agricultural by-products or feedstocks. Examples include corn starch, wood cellulose, vegetable fats and oils, and wheat fiber. These bio-based alternatives are categorized into two distinct types: natural and synthetic bio-based polymers.Bio-based polymers offer several advantages over their conventional counterparts. They are considered more sustainable due to their renewable origins and have been shown to significantly lower the carbon footprint of the extrusion coating process—studies indicate a potential reduction of up to 42%. This substantial decrease in carbon footprint represents a compelling case for the industry to adopt bio-based polymers as a means to align with global sustainability goals and reduce the overall environmental impact of polymer production and processing.


OPPORTUNITY: The developing economies collectively referred to as BRICS - Brazil, Russia, India, China, and South Africa - are currently steering their focus towards substantial infrastructural development and the execution of large-scale, long-term projects. This strategic investment drive has engendered a high-growth environment in these economies, which stands in stark contrast to the relatively subdued market conditions prevailing in North America and Western Europe. Companies headquartered in the latter regions are keenly vying for growth opportunities within the burgeoning markets of these developing countries.

The Asia Pacific region, in particular, has emerged as a focal point for companies such as Akzo Nobel, ArcelorMittal, and Tata Steel. These industry leaders have strategically initiated the relocation of their coil coating facilities from regions like Sweden, France, Portugal, and the UK to rapidly expanding markets such as China, Saudi Arabia, and India. This shift underscores the region's compelling potential, offering remarkable opportunities for these companies to tap into the evolving landscape of the coatings industry.The driving force behind this significant shift and investment lies in the escalating demand and robust industrial growth observed in these emerging economies. As these nations continue to experience substantial economic expansion and urbanization, there is a growing need for advanced coatings solutions across a spectrum of industries. This surge in demand is pivotal in propelling the expansion of the global coatings market.

CHALLENGES: The coatings industry is contending with significant operational hurdles due to a critical shortfall in essential raw materials coupled with escalating prices. This disruption can be attributed to a confluence of four major trends. Firstly, an intensified demand across global markets is leading to a pronounced scarcity of numerous raw materials. Concurrently, there has been a marked 58% rise in oil prices since November 2020, reaching a current level of USD 68 per barrel, which directly influences the cost of petrochemical-derived materials used in coatings. Compounding these issues is a worldwide shortage of shipping containers, which has precipitated a spike in freight costs from Asia to Europe, thereby constricting the supply lines and availability of materials. Additionally, the recent implementation of new customs protocols between the UK and the EU has resulted in extra non-tariff costs that are inflating the expenses for raw materials imported into the UK from European countries. These trends collectively are exerting upward pressure on costs and stretching the industry's ability to maintain steady supplies, necessitating strategic adaptations to navigate the increased cost landscape and supply chain volatility.

Solvents are a category where prices are going through the roof. Some examples in BCF’s (British Coatings Federation) monthly raw material prices survey show the largest increases in solvent prices in January 2021 versus the previous year- acetone (123%), n-butyl acetate (91%), IPA (41%), and n-butanol (54%).

Global Architectural Metal Coatings Market Ecosystem Analysis


Based on application, the extrusion coatings segment is estimated to account for the highest CAGR in architectural metal coatings market

The applications of extrusion coatings in the architectural metal coatings market are segmented into curtain walls, store front, door & windows, and others such as railings and light poles. To meet increasing demands for cost-effectiveness and durability in addition to long-lasting beauty, builders and architects choose extrusion coatings for a wide range of applications. They prefer extrusion coating that fulfills the performance and appearance characteristics their projects demand.

Based on resin type, the fluoropolymer segment is estimated to account for one of the highest CAGR in architectural metal coatings market

Fluoropolymers play a pivotal role in the coatings industry, serving as binders for various applications. Notable fluoropolymer variants employed in coatings include polyvinylidene fluoride (PVDF), polytetrafluoroethylene (PTFE), fluorinated ethylene propylene (FEP), polyvinyl fluoride (PVF), ethylene tetrafluoroethylene copolymer (ETFE), and fluoroethylene vinyl ether (FEVE). Within the architectural systems domain, PVDF and FEVE stand out as the most extensively utilized fluoropolymers.In PVDF coatings, achieving optimal workability is crucial, and this is typically accomplished through a resin system consisting of 70% PVDF and 30% acrylic. The final formulations, however, can vary based on the choice of additives, acrylic resins, and pigment packages selected by paint producers. It's important to note that not all PVDF products are identical in terms of applied performance and application properties. Historically, PVDF coatings were exclusively available as factory-applied coil coating formulations, requiring a melting process before application. However, contemporary advancements have led to the availability of water-based formulations suitable for field-applied spray coatings.

ASIA PACIFIC region holds the largest share of the Architectural Metal Coatings Market.

The Asia Pacific territory is witnessing substantial advancement in the architectural metal coatings sector, propelled by its expansive industrial landscape and surging requirements for sophisticated coating technologies. Highlighted by its leading position in the market's value in 2022, forecasts suggest this region will see the most rapid annual growth rate from 2023 to 2028. Within this sphere, China, Japan, and India stand out as key contributors, with China taking the forefront due to its extensive manufacturing base and heightened demand for premium coating features. Despite economic hurdles, the construction arena in Asia Pacific achieved notable expansion in 2022, with a steady demand for housing projects in major economies and amplified funding in infrastructure development. Additionally, construction firms across the region are venturing into new territories, boosting the need for architectural metal coatings. This dynamic underscores the Asia Pacific's critical role as an epicenter of innovation and expansion in the global architectural metal coatings market.


Key Market Players

KEY PLAYERS IN THE Architectural Metal Coatings Market INCLUDE

Want to explore hidden markets that can drive new revenue in Architectural Metal Coatings Market?

Scope of the Report

Report Attribute Details
Market size available for years 2019-2028
Base year considered 2022
Forecast Period 2023-2028
Forecast Units Value (USD Million/Billion)
Segments Covered By Resin Type, By Application, and By Region
Geographies Covered North America, Europe, Asia Pacific, South America, and Middle East & Africa
Companies covered The Sherwin-Williams Company (US), PPG Industries, Inc. (US), AkzoNobel N.V. (Netherlands), Axalta Coating Systems Ltd (US), Beckers Group (Germany), Kansai Paint Co., Ltd. (Japan), Nippon Paint Holdings Co., Ltd (Japan), Wacker Chemie AG (Germany), Hempel A/S (Denmark), and NOROO Paint & Coatings Co., Ltd. (South Korea) A total of 15+ players are covered.


Key Questions Addressed by the Report

What is the current competitive landscape in the architectural metal coatings market in terms of new applications, production, and sales?
Various major, medium-sized, and small-scale firms operate globally. They continuously innovate, produce new items, and expand into developing regions, boosting sales.
Which countries contribute more to the architectural metal coatings market?
The US, Germany, China, and India are key contributors.
What is the total CAGR expected to be recorded for the architectural metal coatings market during 2023-2028?
The CAGR is expected to be 4.6% from 2023-2030.
Does this report cover the different resin types of the architectural metal coatings market?
Yes, the report covers various resin types used in the architectural metal coatings market.
Does this report cover the different applications of the architectural metal coatings?
Yes, the report includes different applications of architectural metal coatings.


Personalize This Research

  • Triangulate with your Own Data
  • Get Data as per your Format and Definition
  • Gain a Deeper Dive on a Specific Application, Geography, Customer or Competitor
  • Any level of Personalization
Request A Free Customisation

Let Us Help You

  • What are the Known and Unknown Adjacencies Impacting the Architectural Metal Coatings Market
  • What will your New Revenue Sources be?
  • Who will be your Top Customer; what will make them switch?
  • Defend your Market Share or Win Competitors
  • Get a Scorecard for Target Partners
Customized Workshop Request

Table of Contents

Exclusive indicates content/data unique to MarketsandMarkets and not available with any competitors.

TITLE
PAGE NO
TABLE OF CONTENTS
 
1 INTRODUCTION (Page No. - 47)
    1.1 STUDY OBJECTIVES 
    1.2 MARKET DEFINITION 
           1.2.1 INCLUSIONS AND EXCLUSIONS
           1.2.2 DEFINITION AND INCLUSIONS, BY RESIN TYPE
           1.2.3 DEFINITION AND INCLUSIONS, BY APPLICATION
    1.3 STUDY SCOPE 
          FIGURE 1 ARCHITECTURAL METAL COATINGS MARKET SEGMENTATION
           1.3.1 REGIONS COVERED
           1.3.2 YEARS CONSIDERED
           1.3.3 CURRENCY CONSIDERED
                    1.3.3.1 USD exchange rate, 2019–2022
           1.3.4 UNITS CONSIDERED
    1.4 STAKEHOLDERS 
    1.5 SUMMARY OF CHANGES 
           1.5.1 RECESSION IMPACT
 
2 RESEARCH METHODOLOGY (Page No. - 54)
    2.1 RESEARCH DATA 
          FIGURE 2 ARCHITECTURAL METAL COATINGS MARKET: RESEARCH DESIGN
           2.1.1 SECONDARY DATA
                    2.1.1.1 Key data from secondary sources
           2.1.2 PRIMARY DATA
                    2.1.2.1 Key data from primary sources
                    2.1.2.2 Breakdown of interviews with experts
                                FIGURE 3 BREAKDOWN OF INTERVIEWS WITH EXPERTS
                    2.1.2.3 Primary data sources
                    2.1.2.4 Key industry insights
    2.2 MARKET SIZE ESTIMATION 
           2.2.1 BOTTOM-UP APPROACH
                    FIGURE 4 MARKET SIZE ESTIMATION: BOTTOM-UP APPROACH
           2.2.2 TOP-DOWN APPROACH
                    FIGURE 5 MARKET SIZE ESTIMATION: TOP-DOWN APPROACH
                    FIGURE 6 ARCHITECTURAL METAL COATINGS MARKET, BY RESIN TYPE
                    FIGURE 7 ARCHITECTURAL METAL COATINGS MARKET SIZE ESTIMATION, BY REGION
    2.3 MARKET FORECAST APPROACH 
           2.3.1 SUPPLY-SIDE FORECAST
                    FIGURE 8 ARCHITECTURAL METAL COATINGS MARKET: SUPPLY-SIDE FORECAST
           2.3.2 DEMAND-SIDE FORECAST
                    FIGURE 9 METHODOLOGY FOR SUPPLY-SIDE SIZING OF ARCHITECTURAL METAL COATINGS MARKET
    2.4 FACTOR ANALYSIS 
          FIGURE 10 MAJOR FACTORS RESPONSIBLE FOR GLOBAL RECESSION AND THEIR IMPACT
    2.5 DATA TRIANGULATION 
          FIGURE 11 ARCHITECTURAL METAL COATINGS MARKET: DATA TRIANGULATION
    2.6 ASSUMPTIONS 
    2.7 LIMITATIONS 
    2.8 GROWTH FORECAST 
    2.9 RISK ASSESSMENT 
          TABLE 1 ARCHITECTURAL METAL COATINGS MARKET: RISK ASSESSMENT
    2.1 RECESSION IMPACT ANALYSIS 
 
3 EXECUTIVE SUMMARY (Page No. - 67)
    TABLE 2 ARCHITECTURAL METAL COATINGS MARKET SNAPSHOT (2023 VS. 2028)
    FIGURE 12 POLYESTER TO BE LARGEST RESIN SEGMENT IN ARCHITECTURAL METAL COATINGS MARKET
    FIGURE 13 COIL COATINGS APPLICATION TO DOMINATE MARKET DURING FORECAST PERIOD
    FIGURE 14 WALL PANELS & FACADES TO ACCOUNT FOR LARGEST SHARE IN COIL COATINGS APPLICATION
    FIGURE 15 CURTAIN WALLS TO ACCOUNT FOR LARGEST SHARE IN EXTRUSION COATINGS APPLICATION
    FIGURE 16 ASIA PACIFIC TO RECORD HIGHEST CAGR DURING FORECAST PERIOD
 
4 PREMIUM INSIGHTS (Page No. - 73)
    4.1 ATTRACTIVE OPPORTUNITIES FOR PLAYERS IN ARCHITECTURAL METAL COATINGS MARKET 
          FIGURE 17 EMERGING ECONOMIES TO OFFER LUCRATIVE GROWTH OPPORTUNITIES FOR MARKET PLAYERS
    4.2 ARCHITECTURAL METAL COATINGS MARKET, BY RESIN TYPE 
          FIGURE 18 POLYESTER SEGMENT TO DOMINATE MARKET DURING FORECAST PERIOD
    4.3 ARCHITECTURAL METAL COATINGS MARKET IN ASIA PACIFIC,  BY RESIN TYPE AND COUNTRY 
          FIGURE 19 CHINA ACCOUNTED FOR LARGEST SHARE OF ARCHITECTURAL METAL COATINGS MARKET IN ASIA PACIFIC
    4.4 ARCHITECTURAL METAL COATINGS MARKET, DEVELOPED VS. EMERGING ECONOMIES 
          FIGURE 20 EMERGING COUNTRIES TO WITNESS FASTER GROWTH THAN DEVELOPED COUNTRIES
    4.5 ARCHITECTURAL METAL COATINGS MARKET, BY KEY COUNTRIES 
          FIGURE 21 INDIA TO RECORD HIGHEST CAGR DURING FORECAST PERIOD
 
5 MARKET OVERVIEW (Page No. - 76)
    5.1 INTRODUCTION 
    5.2 MARKET DYNAMICS 
          FIGURE 22 DRIVERS, RESTRAINTS, OPPORTUNITIES, AND CHALLENGES IN ARCHITECTURAL METAL COATINGS MARKET
           5.2.1 DRIVERS
                    5.2.1.1 Growth of construction industry in emerging economies
                    5.2.1.2 Government investments in infrastructure projects
                    5.2.1.3 Increasing use of architectural metal coatings for wall cladding and roofing of buildings
           5.2.2 RESTRAINTS
                    5.2.2.1 Availability of low-cost products
                    5.2.2.2 Increasing demand for substitute products such as bio-based polymers
           5.2.3 OPPORTUNITIES
                    5.2.3.1 Growth in adoption of SMP coatings for architectural applications
                    5.2.3.2 Shift in production base of key players to emerging economies
           5.2.4 CHALLENGES
                    5.2.4.1 Rising cost of raw materials
    5.3 PORTER'S FIVE FORCES ANALYSIS 
          TABLE 3 ARCHITECTURAL METAL COATINGS MARKET: PORTER'S FIVE FORCES ANALYSIS
          FIGURE 23 PORTER'S FIVE FORCES ANALYSIS: ARCHITECTURAL METAL COATINGS MARKET
           5.3.1 THREAT FROM NEW ENTRANTS
           5.3.2 THREAT OF SUBSTITUTES
           5.3.3 BARGAINING POWER OF BUYERS
           5.3.4 BARGAINING POWER OF SUPPLIERS
           5.3.5 INTENSITY OF COMPETITIVE RIVALRY
    5.4 MACROECONOMIC INDICATORS 
           5.4.1 INTRODUCTION
           5.4.2 GDP TRENDS AND FORECAST
                    TABLE 4 GDP TRENDS AND FORECAST, PERCENTAGE CHANGE (2020–2027)
           5.4.3 TRENDS AND FORECASTS OF GLOBAL CONSTRUCTION INDUSTRY
    5.5 SUPPLY CHAIN ANALYSIS 
          FIGURE 24 ARCHITECTURAL METAL COATING MARKET: SUPPLY CHAIN ANALYSIS
    5.6 PATENT ANALYSIS 
           5.6.1 METHODOLOGY
           5.6.2 PUBLICATION TRENDS
                    FIGURE 25 PUBLISHED PATENTS, 2018–2023
           5.6.3 JURISDICTION ANALYSIS
                    FIGURE 26 PATENTS PUBLISHED, BY JURISDICTION (2018–2023)
           5.6.4 TOP APPLICANTS
                    FIGURE 27 PATENTS PUBLISHED, BY MAJOR APPLICANTS, 2018–2023
                    TABLE 5 TOP PATENT OWNERS
                    FIGURE 28 TOP PATENT APPLICANTS FOR ARCHITECTURAL METAL COATINGS
    5.7 ECOSYSTEM/MARKET MAP 
          TABLE 6 ARCHITECTURAL METAL COATINGS MARKET: ROLE IN ECOSYSTEM
          FIGURE 29 ARCHITECTURAL METAL COATINGS MARKET: ECOSYSTEM MAPPING
          FIGURE 30 ARCHITECTURAL METAL COATINGS: ECOSYSTEM MAP
    5.8 INVESTMENT AND FUNDING SCENARIO 
          TABLE 7 INVESTMENT AND FUNDING SCENARIO
    5.9 TRENDS AND DISRUPTIONS IMPACTING CUSTOMER BUSINESS 
          FIGURE 31 TRENDS IN END-USE INDUSTRIES IMPACTING BUSINESS OF ARCHITECTURAL METAL COATING MANUFACTURERS
    5.10 REGULATORY LANDSCAPE 
           5.10.1 REGULATIONS RELATED TO ARCHITECTURAL METAL COATINGS
                    5.10.1.1 Key regulations on PFAS
                    5.10.1.2 Regional regulations on PFAS
                               5.10.1.2.1 PFAS regulations in Europe
                               5.10.1.2.2 PFAS regulations in North America (US)
                               5.10.1.2.3 PFAS regulations in Latin America and Asia
                    5.10.1.3 PFAS impact on market
           5.10.2 REGULATORY BODIES, GOVERNMENT AGENCIES, AND OTHER ORGANIZATIONS
                     TABLE 8 NORTH AMERICA: REGULATORY BODIES, GOVERNMENT AGENCIES, AND  OTHER ORGANIZATIONS
                     TABLE 9 EUROPE: REGULATORY BODIES, GOVERNMENT AGENCIES, AND OTHER ORGANIZATIONS
                     TABLE 10 ASIA PACIFIC: REGULATORY BODIES, GOVERNMENT AGENCIES, AND OTHER ORGANIZATIONS
                     TABLE 11 REST OF THE WORLD: LIST OF REGULATORY BODIES, GOVERNMENT AGENCIES,  AND OTHER ORGANIZATIONS
    5.11 TECHNOLOGY ANALYSIS 
           5.11.1 KEY TECHNOLOGY
                    5.11.1.1 Polyester
           5.11.2 COMPLIMENTARY TECHNOLOGIES
                    5.11.2.1 Silicone-modified polyester
           5.11.3 ADJACENT TECHNOLOGIES
                    5.11.3.1 Silicone modified polyacrylates
                    5.11.3.2 Polyurethane
                    5.11.3.3 Polyvinylidene difluoride
                                 TABLE 12 COMPARISON OF DIFFERENT POLYESTERS
    5.12 PRICING ANALYSIS 
           5.12.1 AVERAGE SELLING PRICE TREND, BY REGION
                     FIGURE 32 AVERAGE SELLING PRICE TREND OF ARCHITECTURAL METAL COATINGS, BY REGION, 2019–2022
                     TABLE 13 AVERAGE SELLING PRICE OF ARCHITECTURAL METAL COATINGS, BY REGION, 2019–2022 (USD/KG)
           5.12.2 AVERAGE SELLING PRICE TREND, BY RESIN TYPE
                     FIGURE 33 AVERAGE SELLING PRICE TREND OF ARCHITECTURAL METAL COATINGS, BY RESIN TYPE (2022)
           5.12.3 AVERAGE SELLING PRICE TREND, BY APPLICATION
                     FIGURE 34 AVERAGE SELLING PRICE TREND OF ARCHITECTURAL METAL COATINGS, BY APPLICATION (2022)
           5.12.4 AVERAGE SELLING PRICE TREND OF KEY PLAYERS, BY APPLICATION
                     FIGURE 35 AVERAGE SELLING PRICE TREND OF KEY PLAYERS, BY APPLICATION
                     TABLE 14 AVERAGE SELLING PRICE TREND OF KEY PLAYERS, BY TOP APPLICATIONS, 2023 (USD/KG)
    5.13 KEY STAKEHOLDERS AND BUYING CRITERIA 
           5.13.1 KEY STAKEHOLDERS IN BUYING PROCESS
                     FIGURE 36 INFLUENCE OF STAKEHOLDERS ON BUYING PROCESS
                     TABLE 15 INFLUENCE OF STAKEHOLDERS ON BUYING PROCESS FOR TOP APPLICATIONS (%)
           5.13.2 BUYING CRITERIA
                     FIGURE 37 KEY BUYING CRITERIA FOR ARCHITECTURAL METAL COATINGS
                     TABLE 16 KEY BUYING CRITERIA FOR ARCHITECTURAL METAL COATINGS
    5.14 TRADE ANALYSIS 
           5.14.1 EXPORT SCENARIO
                     FIGURE 38 REGION-WISE EXPORT DATA, 2018–2022 (USD THOUSAND)
                     TABLE 17 COUNTRY-WISE EXPORT DATA, 2020–2022 (USD THOUSAND)
           5.14.2 IMPORT SCENARIO
                     FIGURE 39 REGION-WISE IMPORT DATA, 2018–2022 (USD THOUSAND)
                     TABLE 18 COUNTRY-WISE IMPORT DATA, 2020–2022 (USD THOUSAND)
    5.15 GLOBAL ECONOMIC SCENARIO AFFECTING MARKET GROWTH 
           5.15.1 RUSSIA–UKRAINE WAR
           5.15.2 CHINA
                    5.15.2.1 China's debt problem
                    5.15.2.2 Environmental commitments
           5.15.3 EUROPE
                    5.15.3.1 Energy crisis in Europe
           5.15.4 CHOKEPOINTS THREATENING GLOBAL TRADE
    5.16 CASE STUDY ANALYSIS 
           5.16.1 CASE STUDY 1: MAYNARD H. JACKSON JR. INTERNATIONAL TERMINAL HARTSFIELD-JACKSON INTERNATIONAL AIRPORT ATLANTA, GEORGIA
           5.16.2 CASE STUDY 2: DAVID L. LAWRENCE CONVENTION CENTER PITTSBURGH, PENNSYLVANIA
           5.16.3 CASE STUDY 3: DEL VALLE HIGH SCHOOL
    5.17 KEY CONFERENCES AND EVENTS IN 2024–2025 
           TABLE 19 ARCHITECTURAL METAL COATINGS MARKET: KEY CONFERENCES AND EVENTS, 2024–2025
 
6 ARCHITECTURAL METAL COATINGS MARKET, BY RESIN TYPE (Page No. - 132)
    6.1 INTRODUCTION 
          FIGURE 40 POLYESTER TO BE LARGEST RESIN TYPE FOR ARCHITECTURAL METAL COATINGS
          TABLE 20 ARCHITECTURAL METAL COATINGS MARKET SIZE, BY RESIN TYPE,  2019–2022 (USD MILLION)
          TABLE 21 ARCHITECTURAL METAL COATINGS MARKET SIZE, BY RESIN TYPE,  2023–2028 (USD MILLION)
          TABLE 22 ARCHITECTURAL METAL COATINGS MARKET SIZE, BY RESIN TYPE, 2019–2022 (KILOTON)
          TABLE 23 ARCHITECTURAL METAL COATINGS MARKET SIZE, BY RESIN TYPE, 2023–2028 (KILOTON)
    6.2 POLYESTER 
           6.2.1 ASIA PACIFIC TO DOMINATE MARKET FOR POLYESTER SEGMENT DURING FORECAST PERIOD
           6.2.2 SILICONE MODIFIED POLYESTERS
           6.2.3 OTHERS
                    TABLE 24 POLYESTER: ARCHITECTURAL METAL COATINGS MARKET, BY REGION, 2019–2022 (USD MILLION)
                    TABLE 25 POLYESTER: ARCHITECTURAL METAL COATINGS MARKET, BY REGION, 2023–2028 (USD MILLION)
                    TABLE 26 POLYESTER: ARCHITECTURAL METAL COATINGS MARKET, BY REGION, 2019–2022 (KILOTON)
                    TABLE 27 POLYESTER: ARCHITECTURAL METAL COATINGS MARKET, BY REGION, 2023–2028 (KILOTON)
                    TABLE 28 SILICONE MODIFIED POLYESTERS: ARCHITECTURAL METAL COATINGS MARKET, BY REGION, 2019–2022 (USD MILLION)
                    TABLE 29 SILICONE MODIFIED POLYESTERS: ARCHITECTURAL METAL COATINGS MARKET, BY REGION, 2023–2028 (USD MILLION)
                    TABLE 30 SILICONE MODIFIED POLYESTERS: ARCHITECTURAL METAL COATINGS MARKET, BY REGION, 2019–2022 (KILOTON)
                    TABLE 31 SILICONE MODIFIED POLYESTERS: ARCHITECTURAL METAL COATINGS MARKET, BY REGION, 2023–2028 (KILOTON)
                    TABLE 32 OTHER POLYESTERS: ARCHITECTURAL METAL COATINGS MARKET, BY REGION, 2019–2022 (USD MILLION)
                    TABLE 33 OTHER POLYESTERS: ARCHITECTURAL METAL COATINGS MARKET, BY REGION, 2023–2028 (USD MILLION)
                    TABLE 34 OTHER POLYESTERS: ARCHITECTURAL METAL COATINGS MARKET, BY REGION,  2019–2022 (KILOTON)
                    TABLE 35 OTHER POLYESTERS: ARCHITECTURAL METAL COATINGS MARKET, BY REGION,  2023–2028 (KILOTON)
    6.3 FLUOROPOLYMER 
           6.3.1 DEMAND FOR FLUOROPOLYMER-BASED COATINGS DRIVEN BY THEIR DURABILITY AND STABILITY
           6.3.2 POLYVINYLIDENE FLUORIDE
           6.3.3 OTHERS
                    TABLE 36 FLUOROPOLYMER: ARCHITECTURAL METAL COATINGS MARKET, BY REGION, 2019–2022 (USD MILLION)
                    TABLE 37 FLUOROPOLYMER: ARCHITECTURAL METAL COATINGS MARKET, BY REGION, 2023–2028 (USD MILLION)
                    TABLE 38 FLUOROPOLYMER: ARCHITECTURAL METAL COATINGS MARKET, BY REGION, 2019–2022 (KILOTON)
                    TABLE 39 FLUOROPOLYMER: ARCHITECTURAL METAL COATINGS MARKET, BY REGION, 2023–2028 (KILOTON)
                    TABLE 40 POLYVINYLIDENE FLUORIDE: ARCHITECTURAL METAL COATINGS MARKET, BY REGION, 2019–2022 (USD MILLION)
                    TABLE 41 POLYVINYLIDENE FLUORIDE: ARCHITECTURAL METAL COATINGS MARKET, BY REGION, 2023–2028 (USD MILLION)
                    TABLE 42 POLYVINYLIDENE FLUORIDE: ARCHITECTURAL METAL COATINGS MARKET, BY REGION, 2019–2022 (KILOTON)
                    TABLE 43 POLYVINYLIDENE FLUORIDE: ARCHITECTURAL METAL COATINGS MARKET, BY REGION, 2023–2028 (KILOTON)
                    TABLE 44 OTHER FLUOROPOLYMER: ARCHITECTURAL METAL COATINGS MARKET, BY REGION, 2019–2022 (USD MILLION)
                    TABLE 45 OTHER FLUOROPOLYMER: ARCHITECTURAL METAL COATINGS MARKET, BY REGION, 2023–2028 (USD MILLION)
                    TABLE 46 OTHER FLUOROPOLYMER: ARCHITECTURAL METAL COATINGS MARKET, BY REGION, 2019–2022 (KILOTON)
                    TABLE 47 OTHER FLUOROPOLYMER: ARCHITECTURAL METAL COATINGS MARKET, BY REGION, 2023–2028 (KILOTON)
    6.4 POLYURETHANE 
           6.4.1 GROWING CONSTRUCTION ACTIVITIES TO INCREASE DEMAND FOR POLYURETHANE RESIN
                    TABLE 48 POLYURETHANE: ARCHITECTURAL METAL COATINGS MARKET, BY REGION, 2019–2022 (USD MILLION)
                    TABLE 49 POLYURETHANE: ARCHITECTURAL METAL COATINGS MARKET, BY REGION, 2023–2028 (USD MILLION)
                    TABLE 50 POLYURETHANE: ARCHITECTURAL METAL COATINGS MARKET, BY REGION, 2019–2022 (KILOTON)
                    TABLE 51 POLYURETHANE: ARCHITECTURAL METAL COATINGS MARKET, BY REGION, 2023–2028 (KILOTON)
    6.5 OTHER RESIN TYPES 
          TABLE 52 OTHER RESIN TYPES: ARCHITECTURAL METAL COATINGS MARKET, BY REGION, 2019–2022 (USD MILLION)
          TABLE 53 OTHER RESIN TYPES: ARCHITECTURAL METAL COATINGS MARKET, BY REGION, 2023–2028 (USD MILLION)
          TABLE 54 OTHER RESIN TYPES: ARCHITECTURAL METAL COATINGS MARKET, BY REGION, 2019–2022 (KILOTON)
          TABLE 55 OTHER RESIN TYPES: ARCHITECTURAL METAL COATINGS MARKET, BY REGION, 2023–2028 (KILOTON)
 
7 ARCHITECTURAL METAL COATINGS MARKET, BY APPLICATION (Page No. - 153)
    7.1 COIL COATING 
           7.1.1 INTRODUCTION
                    FIGURE 41 WALL PANELS & FACADES SEGMENT TO LEAD MARKET DURING  FORECAST PERIOD
                    TABLE 56 ARCHITECTURAL METAL COATINGS MARKET SIZE, BY COIL COATINGS APPLICATION, 2019–2022 (USD MILLION)
                    TABLE 57 ARCHITECTURAL METAL COATINGS MARKET SIZE, BY COIL COATINGS APPLICATION, 2023–2028 (USD MILLION)
                    TABLE 58 ARCHITECTURAL METAL COATINGS MARKET SIZE, BY COIL COATINGS APPLICATION, 2019–2022 (KILOTON)
                    TABLE 59 ARCHITECTURAL METAL COATINGS MARKET SIZE, BY COIL COATINGS APPLICATION, 2023–2028 (KILOTON)
           7.1.2 ROOFING & CLADDING
                    7.1.2.1 Increase in use of pre-painted metal roofing to drive market
                                TABLE 60 ROOFING & CLADDING: ARCHITECTURAL METAL COATINGS MARKET, BY REGION,  2019–2022 (USD MILLION)
                                TABLE 61 ROOFING & CLADDING: ARCHITECTURAL METAL COATINGS MARKET, BY REGION,  2023–2028 (USD MILLION)
                                TABLE 62 ROOFING & CLADDING: ARCHITECTURAL METAL COATINGS MARKET, BY REGION,  2019–2022 (KILOTON)
                                TABLE 63 ROOFING & CLADDING: ARCHITECTURAL METAL COATINGS MARKET, BY REGION,  2023–2028 (KILOTON)
           7.1.3 WALL PANELS & FACADES
                    7.1.3.1 Popularity in commercial and industrial construction to drive demand
                                TABLE 64 WALL PANELS & FACADES: ARCHITECTURAL METAL COATINGS MARKET, BY REGION, 2019–2022 (USD MILLION)
                                TABLE 65 WALL PANELS & FACADES: ARCHITECTURAL METAL COATINGS MARKET, BY REGION, 2023–2028 (USD MILLION)
                                TABLE 66 WALL PANELS & FACADES: ARCHITECTURAL METAL COATINGS MARKET, BY REGION, 2019–2022 (KILOTON)
                                TABLE 67 WALL PANELS & FACADES: ARCHITECTURAL METAL COATINGS MARKET, BY REGION, 2023–2028 (KILOTON)
           7.1.4 FASCIA & SOFFITS
                    7.1.4.1 Fastest-growing segment in coil coating application
                                TABLE 68 FASCIA & SOFFITS: ARCHITECTURAL METAL COATINGS MARKET, BY REGION,  2019–2022 (USD MILLION)
                                TABLE 69 FASCIA & SOFFITS: ARCHITECTURAL METAL COATINGS MARKET, BY REGION,  2023–2028 (USD MILLION)
                                TABLE 70 FASCIA & SOFFITS: ARCHITECTURAL METAL COATINGS MARKET, BY REGION,  2019–2022 (KILOTON)
                                TABLE 71 FASCIA & SOFFITS: ARCHITECTURAL METAL COATINGS MARKET, BY REGION,  2023–2028 (KILOTON)
           7.1.5 OTHERS
                    TABLE 72 OTHER COIL COATING: ARCHITECTURAL METAL COATINGS MARKET, BY REGION,  2019–2022 (USD MILLION)
                    TABLE 73 OTHER COIL COATING: ARCHITECTURAL METAL COATINGS MARKET, BY REGION,  2023–2028 (USD MILLION)
                    TABLE 74 OTHER COIL COATING: ARCHITECTURAL METAL COATINGS MARKET,  BY REGION, 2019–2022 (KILOTON)
                    TABLE 75 OTHER COIL COATING: ARCHITECTURAL METAL COATINGS MARKET, BY REGION,  2023–2028 (KILOTON)
    7.2 EXTRUSION COATINGS 
           7.2.1 INTRODUCTION
                    FIGURE 42 CURTAIN WALLS TO BE LARGEST EXTRUSION COATING APPLICATION
                    TABLE 76 ARCHITECTURAL METAL COATINGS MARKET SIZE, BY EXTRUSION COATINGS APPLICATION, 2019–2022 (USD MILLION)
                    TABLE 77 ARCHITECTURAL METAL COATINGS MARKET SIZE, BY EXTRUSION COATINGS APPLICATION, 2023–2028 (USD MILLION)
                    TABLE 78 ARCHITECTURAL METAL COATINGS MARKET SIZE, BY EXTRUSION COATINGS APPLICATION, 2019–2022 (KILOTON)
                    TABLE 79 ARCHITECTURAL METAL COATINGS MARKET SIZE, BY EXTRUSION COATINGS APPLICATION, 2023–2028 (KILOTON)
           7.2.2 CURTAIN WALLS
                    7.2.2.1 Largest and fastest-growing segment in extrusion coatings application
                                TABLE 80 CURTAIN WALLS: ARCHITECTURAL METAL COATINGS MARKET, BY REGION,  2019–2022 (USD MILLION)
                                TABLE 81 CURTAIN WALLS: ARCHITECTURAL METAL COATINGS MARKET, BY REGION,  2023–2028 (USD MILLION)
                                TABLE 82 CURTAIN WALLS: ARCHITECTURAL METAL COATINGS MARKET, BY REGION,  2019–2022 (KILOTON)
                                TABLE 83 CURTAIN WALLS: ARCHITECTURAL METAL COATINGS MARKET, BY REGION,  2023–2028 (KILOTON)
           7.2.3 STORE FRONT
                    7.2.3.1 Fluoropolymer, polyester, silicone modified polyester, and PVDF majorly used in store front
                                TABLE 84 STORE FRONT: ARCHITECTURAL METAL COATINGS MARKET, BY REGION,  2019–2022 (USD MILLION)
                                TABLE 85 STORE FRONT: ARCHITECTURAL METAL COATINGS MARKET, BY REGION,  2023–2028 (USD MILLION)
                                TABLE 86 STORE FRONT: ARCHITECTURAL METAL COATINGS MARKET, BY REGION,  2019–2022 (KILOTON)
                                TABLE 87 STORE FRONT: ARCHITECTURAL METAL COATINGS MARKET, BY REGION,  2023–2028 (KILOTON)
           7.2.4 DOORS & WINDOWS
                    7.2.4.1 High demand for coatings for doors & windows from Asia Pacific region
                                TABLE 88 DOORS & WINDOWS: ARCHITECTURAL METAL COATINGS MARKET, BY REGION,  2019–2022 (USD MILLION)
                                TABLE 89 DOORS & WINDOWS: ARCHITECTURAL METAL COATINGS MARKET, BY REGION, 2023–2028 (USD MILLION)
                                TABLE 90 DOORS & WINDOWS: ARCHITECTURAL METAL COATINGS MARKET, BY REGION, 2019–2022 (KILOTON)
                                TABLE 91 DOORS & WINDOWS: ARCHITECTURAL METAL COATINGS MARKET, BY REGION, 2023–2028 (KILOTON)
           7.2.5 OTHERS
                    TABLE 92 OTHER EXTRUSION COATING: ARCHITECTURAL METAL COATINGS MARKET, BY REGION, 2019–2022 (USD MILLION)
                    TABLE 93 OTHER EXTRUSION COATING: ARCHITECTURAL METAL COATINGS MARKET, BY REGION, 2023–2028 (USD MILLION)
                    TABLE 94 OTHER EXTRUSION COATING: ARCHITECTURAL METAL COATINGS MARKET, BY REGION, 2019–2022 (KILOTON)
                    TABLE 95 OTHER EXTRUSION COATING: ARCHITECTURAL METAL COATINGS MARKET, BY REGION, 2023–2028 (KILOTON)
 
8 ARCHITECTURAL METAL COATINGS MARKET, BY REGION (Page No. - 175)
    8.1 INTRODUCTION 
          FIGURE 43 ASIA PACIFIC TO REGISTER HIGHEST CAGR BETWEEN 2023 AND 2028
          TABLE 96 ARCHITECTURAL METAL COATINGS MARKET, BY REGION, 2019–2022 (USD MILLION)
          TABLE 97 ARCHITECTURAL METAL COATINGS MARKET, BY REGION, 2023–2028 (USD MILLION)
          TABLE 98 ARCHITECTURAL METAL COATINGS MARKET, BY REGION, 2019–2022 (KILOTON)
          TABLE 99 ARCHITECTURAL METAL COATINGS MARKET, BY REGION, 2023–2028 (KILOTON)
    8.2 NORTH AMERICA 
           8.2.1 RECESSION IMPACT
                    FIGURE 44 NORTH AMERICA: ARCHITECTURAL METAL COATINGS MARKET SNAPSHOT
                    TABLE 100 NORTH AMERICA: ARCHITECTURAL METAL COATINGS MARKET, BY COUNTRY,  2019–2022 (USD MILLION)
                    TABLE 101 NORTH AMERICA: ARCHITECTURAL METAL COATINGS MARKET, BY COUNTRY, 2023–2028 (USD MILLION)
                    TABLE 102 NORTH AMERICA: ARCHITECTURAL METAL COATINGS MARKET, BY COUNTRY,  2019–2022 (KILOTON)
                    TABLE 103 NORTH AMERICA: ARCHITECTURAL METAL COATINGS MARKET, BY COUNTRY,  2023–2028 (KILOTON)
                    TABLE 104 NORTH AMERICA: ARCHITECTURAL METAL COATINGS MARKET, BY RESIN TYPE,  2019–2022 (USD MILLION)
                    TABLE 105 NORTH AMERICA: ARCHITECTURAL METAL COATINGS MARKET, BY RESIN TYPE,  2023–2028 (USD MILLION)
                    TABLE 106 NORTH AMERICA: ARCHITECTURAL METAL COATINGS MARKET, BY RESIN TYPE,  2019–2022 (KILOTON)
                    TABLE 107 NORTH AMERICA: ARCHITECTURAL METAL COATINGS MARKET, BY RESIN TYPE,  2023–2028 (KILOTON)
                    TABLE 108 NORTH AMERICA: ARCHITECTURAL METAL COATINGS MARKET, BY APPLICATION,  2019–2022 (USD MILLION)
                    TABLE 109 NORTH AMERICA: ARCHITECTURAL METAL COATINGS MARKET, BY APPLICATION,  2023–2028 (USD MILLION)
                    TABLE 110 NORTH AMERICA: ARCHITECTURAL METAL COATINGS MARKET, BY APPLICATION,  2019–2022 (KILOTON)
                    TABLE 111 NORTH AMERICA: ARCHITECTURAL METAL COATINGS MARKET, BY APPLICATION,  2023–2028 (KILOTON)
                    TABLE 112 NORTH AMERICA: ARCHITECTURAL METAL COATINGS MARKET, BY COIL COATINGS APPLICATION, 2019–2022 (USD MILLION)
                    TABLE 113 NORTH AMERICA: ARCHITECTURAL METAL COATINGS MARKET, BY COIL COATINGS APPLICATION, 2023–2028 (USD MILLION)
                    TABLE 114 NORTH AMERICA: ARCHITECTURAL METAL COATINGS MARKET, BY COIL COATINGS APPLICATION, 2019–2022 (KILOTON)
                    TABLE 115 NORTH AMERICA: ARCHITECTURAL METAL COATINGS MARKET, BY COIL COATINGS APPLICATION, 2023–2028 (KILOTON)
                    TABLE 116 NORTH AMERICA: ARCHITECTURAL METAL COATINGS MARKET, BY EXTRUSION COATINGS APPLICATION, 2019–2022 (USD MILLION)
                    TABLE 117 NORTH AMERICA: ARCHITECTURAL METAL COATINGS MARKET, BY EXTRUSION COATINGS APPLICATION, 2023–2028 (USD MILLION)
                    TABLE 118 NORTH AMERICA: ARCHITECTURAL METAL COATINGS MARKET, BY EXTRUSION COATINGS APPLICATION, 2019–2022 (KILOTON)
                    TABLE 119 NORTH AMERICA: ARCHITECTURAL METAL COATINGS MARKET, BY EXTRUSION COATINGS APPLICATION, 2023–2028 (KILOTON)
           8.2.2 US
                    8.2.2.1 Presence of major manufacturers fueling growth of market
                                TABLE 120 US: ARCHITECTURAL METAL COATINGS MARKET, BY RESIN TYPE, 2019–2022 (USD MILLION)
                                TABLE 121 US: ARCHITECTURAL METAL COATINGS MARKET, BY RESIN TYPE, 2023–2028 (USD MILLION)
                                TABLE 122 US: ARCHITECTURAL METAL COATINGS MARKET, BY RESIN TYPE, 2019–2022 (KILOTON)
                                TABLE 123 US: ARCHITECTURAL METAL COATINGS MARKET, BY RESIN TYPE, 2023–2028 (KILOTON)
           8.2.3 CANADA
                    8.2.3.1 Residential construction to be major contributor to growth of market
                                TABLE 124 CANADA: ARCHITECTURAL METAL COATINGS MARKET, BY RESIN TYPE, 2019–2022 (USD MILLION)
                                TABLE 125 CANADA: ARCHITECTURAL METAL COATINGS MARKET, BY RESIN TYPE, 2023–2028 (USD MILLION)
                                TABLE 126 CANADA: ARCHITECTURAL METAL COATINGS MARKET, BY RESIN TYPE, 2019–2022 (KILOTON)
                                TABLE 127 CANADA: ARCHITECTURAL METAL COATINGS MARKET, BY RESIN TYPE, 2023–2028 (KILOTON)
           8.2.4 MEXICO
                    8.2.4.1 Investments in infrastructure, energy, and commercial construction projects to drive market
                                TABLE 128 MEXICO: ARCHITECTURAL METAL COATINGS MARKET, BY RESIN TYPE, 2019–2022 (USD MILLION)
                                TABLE 129 MEXICO: ARCHITECTURAL METAL COATINGS MARKET, BY RESIN TYPE, 2023–2028 (USD MILLION)
                                TABLE 130 MEXICO: ARCHITECTURAL METAL COATINGS MARKET, BY RESIN TYPE, 2019–2022 (KILOTON)
                                TABLE 131 MEXICO: ARCHITECTURAL METAL COATINGS MARKET, BY RESIN TYPE, 2023–2028 (KILOTON)
    8.3 EUROPE 
           8.3.1 RECESSION IMPACT
                    FIGURE 45 EUROPE: ARCHITECTURAL METAL COATINGS MARKET SNAPSHOT
                    TABLE 132 EUROPE: ARCHITECTURAL METAL COATINGS MARKET, BY COUNTRY, 2019–2022 (USD MILLION)
                    TABLE 133 EUROPE: ARCHITECTURAL METAL COATINGS MARKET, BY COUNTRY 2023–2028 (USD MILLION)
                    TABLE 134 EUROPE: ARCHITECTURAL METAL COATINGS MARKET, BY COUNTRY, 2019–2022 (KILOTON)
                    TABLE 135 EUROPE: ARCHITECTURAL METAL COATINGS MARKET, BY COUNTRY, 2023–2028 (KILOTON)
                    TABLE 136 EUROPE: ARCHITECTURAL METAL COATINGS MARKET, BY RESIN TYPE, 2019–2022 (USD MILLION)
                    TABLE 137 EUROPE: ARCHITECTURAL METAL COATINGS MARKET, BY RESIN TYPE, 2023–2028 (USD MILLION)
                    TABLE 138 EUROPE: ARCHITECTURAL METAL COATINGS MARKET, BY RESIN TYPE, 2019–2022 (KILOTON)
                    TABLE 139 EUROPE: ARCHITECTURAL METAL COATINGS MARKET, BY RESIN TYPE, 2023–2028 (KILOTON)
                    TABLE 140 EUROPE: ARCHITECTURAL METAL COATINGS MARKET, BY APPLICATION, 2019–2022 (USD MILLION)
                    TABLE 141 EUROPE: ARCHITECTURAL METAL COATINGS MARKET, BY APPLICATION, 2023–2028 (USD MILLION)
                    TABLE 142 EUROPE: ARCHITECTURAL METAL COATINGS MARKET, BY APPLICATION, 2019–2022 (KILOTON)
                    TABLE 143 EUROPE: ARCHITECTURAL METAL COATINGS MARKET, BY APPLICATION, 2023–2028 (KILOTON)
                    TABLE 144 EUROPE: ARCHITECTURAL METAL COATINGS MARKET, BY COIL COATINGS APPLICATION, 2019–2022 (USD MILLION)
                    TABLE 145 EUROPE: ARCHITECTURAL METAL COATINGS MARKET, BY COIL COATINGS APPLICATION, 2023–2028 (USD MILLION)
                    TABLE 146 EUROPE: ARCHITECTURAL METAL COATINGS MARKET, BY COIL COATINGS APPLICATION, 2019–2022 (KILOTON)
                    TABLE 147 EUROPE: ARCHITECTURAL METAL COATINGS MARKET, BY COIL COATINGS APPLICATION, 2023–2028 (KILOTON)
                    TABLE 148 EUROPE: ARCHITECTURAL METAL COATINGS MARKET, BY EXTRUSION COATINGS APPLICATION, 2019–2022 (USD MILLION)
                    TABLE 149 EUROPE: ARCHITECTURAL METAL COATINGS MARKET, BY EXTRUSION COATINGS APPLICATION, 2023–2028 (USD MILLION)
                    TABLE 150 EUROPE: ARCHITECTURAL METAL COATINGS MARKET, BY EXTRUSION COATINGS APPLICATION, 2019–2022 (KILOTON)
                    TABLE 151 EUROPE: ARCHITECTURAL METAL COATINGS MARKET, BY EXTRUSION COATINGS APPLICATION, 2023–2028 (KILOTON)
           8.3.2 GERMANY
                    8.3.2.1 Fluoropolymer segment to register highest CAGR during forecast period
                                TABLE 152 GERMANY: ARCHITECTURAL METAL COATINGS MARKET, BY RESIN TYPE, 2019–2022 (USD MILLION)
                                TABLE 153 GERMANY: ARCHITECTURAL METAL COATINGS MARKET, BY RESIN TYPE, 2023–2028 (USD MILLION)
                                TABLE 154 GERMANY: ARCHITECTURAL METAL COATINGS MARKET, BY RESIN TYPE, 2019–2022 (KILOTON)
                                TABLE 155 GERMANY: ARCHITECTURAL METAL COATINGS MARKET, BY RESIN TYPE, 2023–2028 (KILOTON)
           8.3.3 UK
                    8.3.3.1 Growing construction sector to boost demand
                                TABLE 156 UK: ARCHITECTURAL METAL COATINGS MARKET, BY RESIN TYPE, 2019–2022 (USD MILLION)
                                TABLE 157 UK: ARCHITECTURAL METAL COATINGS MARKET, BY RESIN TYPE, 2023–2028 (USD MILLION)
                                TABLE 158 UK: ARCHITECTURAL METAL COATINGS MARKET, BY RESIN TYPE, 2019–2022 (KILOTON)
                                TABLE 159 UK: ARCHITECTURAL METAL COATINGS MARKET, BY RESIN TYPE, 2023–2028 (KILOTON)
           8.3.4 FRANCE
                    8.3.4.1 Population growth to increase demand for architectural metal coatings
                                TABLE 160 FRANCE: ARCHITECTURAL METAL COATINGS MARKET, BY RESIN TYPE, 2019–2022 (USD MILLION)
                                TABLE 161 FRANCE: ARCHITECTURAL METAL COATINGS MARKET, BY RESIN TYPE, 2023–2028 (USD MILLION)
                                TABLE 162 FRANCE: ARCHITECTURAL METAL COATINGS MARKET, BY RESIN TYPE, 2019–2022 (KILOTON)
                                TABLE 163 FRANCE: ARCHITECTURAL METAL COATINGS MARKET, BY RESIN TYPE, 2023–2028 (KILOTON)
           8.3.5 SPAIN
                    8.3.5.1 Recovery of construction industry to increase demand for architectural metal coatings
                                TABLE 164 SPAIN: ARCHITECTURAL METAL COATINGS MARKET, BY RESIN TYPE, 2019–2022 (USD MILLION)
                                TABLE 165 SPAIN: ARCHITECTURAL METAL COATINGS MARKET, BY RESIN TYPE, 2023–2028 (USD MILLION)
                                TABLE 166 SPAIN: ARCHITECTURAL METAL COATINGS MARKET, BY RESIN TYPE, 2019–2022 (KILOTON)
                                TABLE 167 SPAIN: ARCHITECTURAL METAL COATINGS MARKET, BY RESIN TYPE, 2023–2028 (KILOTON)
           8.3.6 REST OF EUROPE
                    TABLE 168 REST OF EUROPE: ARCHITECTURAL METAL COATINGS MARKET, BY RESIN TYPE, 2019–2022 (USD MILLION)
                    TABLE 169 REST OF EUROPE: ARCHITECTURAL METAL COATINGS MARKET, BY RESIN TYPE, 2023–2028 (USD MILLION)
                    TABLE 170 REST OF EUROPE: ARCHITECTURAL METAL COATINGS MARKET, BY RESIN TYPE, 2019–2022 (KILOTON)
                    TABLE 171 REST OF EUROPE: ARCHITECTURAL METAL COATINGS MARKET, BY RESIN TYPE, 2023–2028 (KILOTON)
    8.4 ASIA PACIFIC 
           8.4.1 RECESSION IMPACT
                    FIGURE 46 ASIA PACIFIC: ARCHITECTURAL METAL COATINGS MARKET SNAPSHOT
                    TABLE 172 ASIA PACIFIC: ARCHITECTURAL METAL COATINGS MARKET, BY COUNTRY, 2019–2022 (USD MILLION)
                    TABLE 173 ASIA PACIFIC: ARCHITECTURAL METAL COATINGS MARKET, BY COUNTRY, 2023–2028 (USD MILLION)
                    TABLE 174 ASIA PACIFIC: ARCHITECTURAL METAL COATINGS MARKET, BY COUNTRY, 2019–2022 (KILOTON)
                    TABLE 175 ASIA PACIFIC: ARCHITECTURAL METAL COATINGS MARKET, BY COUNTRY, 2023–2028 (KILOTON)
                    TABLE 176 ASIA PACIFIC: ARCHITECTURAL METAL COATINGS MARKET, BY RESIN TYPE, 2019–2022 (USD MILLION)
                    TABLE 177 ASIA PACIFIC: ARCHITECTURAL METAL COATINGS MARKET, BY RESIN TYPE, 2023–2028 (USD MILLION)
                    TABLE 178 ASIA PACIFIC: ARCHITECTURAL METAL COATINGS MARKET, BY RESIN TYPE, 2019–2022 (KILOTON)
                    TABLE 179 ASIA PACIFIC: ARCHITECTURAL METAL COATINGS MARKET, BY RESIN TYPE, 2023–2028 (KILOTON)
                    TABLE 180 ASIA PACIFIC: ARCHITECTURAL METAL COATINGS MARKET, BY APPLICATION, 2019–2022 (USD MILLION)
                    TABLE 181 ASIA PACIFIC: ARCHITECTURAL METAL COATINGS MARKET, BY APPLICATION, 2023–2028 (USD MILLION)
                    TABLE 182 ASIA PACIFIC: ARCHITECTURAL METAL COATINGS MARKET, BY APPLICATION, 2019–2022 (KILOTON)
                    TABLE 183 ASIA PACIFIC: ARCHITECTURAL METAL COATINGS MARKET, BY APPLICATION, 2023–2028 (KILOTON)
                    TABLE 184 ASIA PACIFIC: ARCHITECTURAL METAL COATINGS MARKET, BY COIL COATINGS APPLICATION, 2019–2022 (USD MILLION)
                    TABLE 185 ASIA PACIFIC: ARCHITECTURAL METAL COATINGS MARKET, BY COIL COATINGS APPLICATION, 2023–2028 (USD MILLION)
                    TABLE 186 ASIA PACIFIC: ARCHITECTURAL METAL COATINGS MARKET, BY COIL COATINGS APPLICATION, 2019–2022 (KILOTON)
                    TABLE 187 ASIA PACIFIC: ARCHITECTURAL METAL COATINGS MARKET, BY COIL COATINGS APPLICATION, 2023–2028 (KILOTON)
                    TABLE 188 ASIA PACIFIC: ARCHITECTURAL METAL COATINGS MARKET, BY EXTRUSION COATINGS APPLICATION, 2019–2022 (USD MILLION)
                    TABLE 189 ASIA PACIFIC: ARCHITECTURAL METAL COATINGS MARKET, BY EXTRUSION COATINGS APPLICATION, 2023–2028 (USD MILLION)
                    TABLE 190 ASIA PACIFIC: ARCHITECTURAL METAL COATINGS MARKET, BY EXTRUSION COATINGS APPLICATION, 2019–2022 (KILOTON)
                    TABLE 191 ASIA PACIFIC: ARCHITECTURAL METAL COATINGS MARKET, BY EXTRUSION COATINGS APPLICATION, 2023–2028 (KILOTON)
           8.4.2 CHINA
                    8.4.2.1 Significant increase in investments in real estate and non-residential construction to boost market
                                TABLE 192 CHINA: ARCHITECTURAL METAL COATINGS MARKET, BY RESIN TYPE, 2019–2022 (USD MILLION)
                                TABLE 193 CHINA: ARCHITECTURAL METAL COATINGS MARKET, BY RESIN TYPE, 2023–2028 (USD MILLION)
                                TABLE 194 CHINA: ARCHITECTURAL METAL COATINGS MARKET, BY RESIN TYPE, 2019–2022 (KILOTON)
                                TABLE 195 CHINA: ARCHITECTURAL METAL COATINGS MARKET, BY RESIN TYPE, 2023–2028 (KILOTON)
           8.4.3 INDIA
                    8.4.3.1 Growth of economy and rising FDI investment to drive market
                                TABLE 196 INDIA: ARCHITECTURAL METAL COATINGS MARKET, BY RESIN TYPE, 2019–2022 (USD MILLION)
                                TABLE 197 INDIA: ARCHITECTURAL METAL COATINGS MARKET, BY RESIN TYPE, 2023–2028 (USD MILLION)
                                TABLE 198 INDIA: ARCHITECTURAL METAL COATINGS MARKET, BY RESIN TYPE, 2019–2022 (KILOTON)
                                TABLE 199 INDIA: ARCHITECTURAL METAL COATINGS MARKET, BY RESIN TYPE, 2023–2028 (KILOTON)
           8.4.4 JAPAN
                    8.4.4.1 Investments by government in commercial and reconstruction to boost demand
                                TABLE 200 JAPAN: ARCHITECTURAL METAL COATINGS MARKET, BY RESIN TYPE, 2019–2022 (USD MILLION)
                                TABLE 201 JAPAN: ARCHITECTURAL METAL COATINGS MARKET, BY RESIN TYPE, 2023–2028 (USD MILLION)
                                TABLE 202 JAPAN: ARCHITECTURAL METAL COATINGS MARKET, BY RESIN TYPE, 2019–2022 (KILOTON)
                                TABLE 203 JAPAN: ARCHITECTURAL METAL COATINGS MARKET, BY RESIN TYPE, 2023–2028 (KILOTON)
           8.4.5 SOUTH KOREA
                    8.4.5.1 Significant expenditure on construction projects to boost demand for architectural metal coatings
                                TABLE 204 SOUTH KOREA: ARCHITECTURAL METAL COATINGS MARKET, BY RESIN TYPE, 2019–2022 (USD MILLION)
                                TABLE 205 SOUTH KOREA: ARCHITECTURAL METAL COATINGS MARKET, BY RESIN TYPE, 2023–2028 (USD MILLION)
                                TABLE 206 SOUTH KOREA: ARCHITECTURAL METAL COATINGS MARKET, BY RESIN TYPE, 2019–2022 (KILOTON)
                                TABLE 207 SOUTH KOREA: ARCHITECTURAL METAL COATINGS MARKET, BY RESIN TYPE, 2023–2028 (KILOTON)
           8.4.6 INDONESIA
                    8.4.6.1 Rising consumer spending and growing construction industry to boost market
                                TABLE 208 INDONESIA: ARCHITECTURAL METAL COATINGS MARKET, BY RESIN TYPE, 2019–2022 (USD MILLION)
                                TABLE 209 INDONESIA: ARCHITECTURAL METAL COATINGS MARKET, BY RESIN TYPE, 2023–2028 (USD MILLION)
                                TABLE 210 INDONESIA: ARCHITECTURAL METAL COATINGS MARKET, BY RESIN TYPE, 2019–2022 (KILOTON)
                                TABLE 211 INDONESIA: ARCHITECTURAL METAL COATINGS MARKET, BY RESIN TYPE, 2023–2028 (KILOTON)
           8.4.7 REST OF ASIA PACIFIC
                    TABLE 212 REST OF ASIA PACIFIC: ARCHITECTURAL METAL COATINGS MARKET, BY RESIN TYPE, 2019–2022 (USD MILLION)
                    TABLE 213 REST OF ASIA PACIFIC: ARCHITECTURAL METAL COATINGS MARKET, BY RESIN TYPE, 2023–2028 (USD MILLION)
                    TABLE 214 REST OF ASIA PACIFIC: ARCHITECTURAL METAL COATINGS MARKET, BY RESIN TYPE, 2019–2022 (KILOTON)
                    TABLE 215 REST OF ASIA PACIFIC: ARCHITECTURAL METAL COATINGS MARKET, BY RESIN TYPE, 2023–2028 (KILOTON)
    8.5 SOUTH AMERICA 
           8.5.1 RECESSION IMPACT
                    FIGURE 47 BRAZIL TO REGISTER HIGHEST CAGR BETWEEN 2023 AND 2028
                    TABLE 216 SOUTH AMERICA: ARCHITECTURAL METAL COATINGS MARKET, BY COUNTRY, 2019–2022 (USD MILLION)
                    TABLE 217 SOUTH AMERICA: ARCHITECTURAL METAL COATINGS MARKET, BY COUNTRY 2023–2028 (USD MILLION)
                    TABLE 218 SOUTH AMERICA: ARCHITECTURAL METAL COATINGS MARKET, BY COUNTRY, 2019–2022 (KILOTON)
                    TABLE 219 SOUTH AMERICA: ARCHITECTURAL METAL COATINGS MARKET, BY COUNTRY,  2023–2028 (KILOTON)
                    TABLE 220 SOUTH AMERICA: ARCHITECTURAL METAL COATINGS MARKET, BY RESIN TYPE,  2019–2022 (USD MILLION)
                    TABLE 221 SOUTH AMERICA: ARCHITECTURAL METAL COATINGS MARKET, BY RESIN TYPE, 2023–2028 (USD MILLION)
                    TABLE 222 SOUTH AMERICA: ARCHITECTURAL METAL COATINGS MARKET, BY RESIN TYPE, 2019–2022 (KILOTON)
                    TABLE 223 SOUTH AMERICA: ARCHITECTURAL METAL COATINGS MARKET, BY RESIN TYPE, 2023–2028 (KILOTON)
                    TABLE 224 SOUTH AMERICA: ARCHITECTURAL METAL COATINGS MARKET, BY APPLICATION, 2019–2022 (USD MILLION)
                    TABLE 225 SOUTH AMERICA: ARCHITECTURAL METAL COATINGS MARKET, BY APPLICATION, 2023–2028 (USD MILLION)
                    TABLE 226 SOUTH AMERICA: ARCHITECTURAL METAL COATINGS MARKET, BY APPLICATION, 2019–2022 (KILOTON)
                    TABLE 227 SOUTH AMERICA: ARCHITECTURAL METAL COATINGS MARKET, BY APPLICATION, 2023–2028 (KILOTON)
                    TABLE 228 SOUTH AMERICA: ARCHITECTURAL METAL COATINGS MARKET, BY COIL COATINGS APPLICATION, 2019–2022 (USD MILLION)
                    TABLE 229 SOUTH AMERICA: ARCHITECTURAL METAL COATINGS MARKET, BY COIL COATINGS APPLICATION, 2023–2028 (USD MILLION)
                    TABLE 230 SOUTH AMERICA: ARCHITECTURAL METAL COATINGS MARKET, BY COIL COATINGS APPLICATION, 2019–2022 (KILOTON)
                    TABLE 231 SOUTH AMERICA: ARCHITECTURAL METAL COATINGS MARKET, BY COIL COATINGS APPLICATION, 2023–2028 (KILOTON)
                    TABLE 232 SOUTH AMERICA: ARCHITECTURAL METAL COATINGS MARKET, BY EXTRUSION  COATINGS APPLICATION, 2019–2022 (USD MILLION)
                    TABLE 233 SOUTH AMERICA: ARCHITECTURAL METAL COATINGS MARKET, BY EXTRUSION COATINGS APPLICATION, 2023–2028 (USD MILLION)
                    TABLE 234 SOUTH AMERICA: ARCHITECTURAL METAL COATINGS MARKET, BY EXTRUSION COATINGS APPLICATION, 2019–2022 (KILOTON)
                    TABLE 235 SOUTH AMERICA: ARCHITECTURAL METAL COATINGS MARKET, BY EXTRUSION COATINGS APPLICATION, 2023–2028 (KILOTON)
           8.5.2 BRAZIL
                    8.5.2.1 Easy availability of raw materials to propel architectural metal coatings market
                                TABLE 236 BRAZIL: ARCHITECTURAL METAL COATINGS MARKET, BY RESIN TYPE, 2019–2022 (USD MILLION)
                                TABLE 237 BRAZIL: ARCHITECTURAL METAL COATINGS MARKET, BY RESIN TYPE, 2023–2028 (USD MILLION)
                                TABLE 238 BRAZIL: ARCHITECTURAL METAL COATINGS MARKET, BY RESIN TYPE, 2019–2022 (KILOTON)
                                TABLE 239 BRAZIL: ARCHITECTURAL METAL COATINGS MARKET, BY RESIN TYPE, 2023–2028 (KILOTON)
           8.5.3 ARGENTINA
                    8.5.3.1 Increase in population and improved economic conditions to drive demand
                                TABLE 240 ARGENTINA: ARCHITECTURAL METAL COATINGS MARKET, BY RESIN TYPE, 2019–2022 (USD MILLION)
                                TABLE 241 ARGENTINA: ARCHITECTURAL METAL COATINGS MARKET, BY RESIN TYPE, 2023–2028 (USD MILLION)
                                TABLE 242 ARGENTINA: ARCHITECTURAL METAL COATINGS MARKET, BY RESIN TYPE, 2019–2022 (KILOTON)
                                TABLE 243 ARGENTINA: ARCHITECTURAL METAL COATINGS MARKET, BY RESIN TYPE, 2023–2028 (KILOTON)
           8.5.4 REST OF SOUTH AMERICA
                    TABLE 244 REST OF SOUTH AMERICA: ARCHITECTURAL METAL COATINGS MARKET, BY RESIN TYPE, 2019–2022 (USD MILLION)
                    TABLE 245 REST OF SOUTH AMERICA: ARCHITECTURAL METAL COATINGS MARKET, BY RESIN TYPE, 2023–2028 (USD MILLION)
                    TABLE 246 REST OF SOUTH AMERICA: ARCHITECTURAL METAL COATINGS MARKET, BY RESIN TYPE, 2019–2022 (KILOTON)
                    TABLE 247 REST OF SOUTH AMERICA: ARCHITECTURAL METAL COATINGS MARKET, BY RESIN TYPE, 2023–2028 (KILOTON)
    8.6 MIDDLE EAST & AFRICA 
           8.6.1 RECESSION IMPACT
                    FIGURE 48 GCC COUNTRIES TO REGISTER HIGHEST CAGR BETWEEN 2023 AND 2028
                    TABLE 248 MIDDLE EAST & AFRICA: ARCHITECTURAL METAL COATINGS MARKET, BY COUNTRY, 2019–2022 (USD MILLION)
                    TABLE 249 MIDDLE EAST & AFRICA: ARCHITECTURAL METAL COATINGS MARKET, BY COUNTRY 2023–2028 (USD MILLION)
                    TABLE 250 MIDDLE EAST & AFRICA: ARCHITECTURAL METAL COATINGS MARKET, BY COUNTRY, 2019–2022 (KILOTON)
                    TABLE 251 MIDDLE EAST & AFRICA: ARCHITECTURAL METAL COATINGS MARKET, BY COUNTRY, 2023–2028 (KILOTON)
                    TABLE 252 MIDDLE EAST & AFRICA: ARCHITECTURAL METAL COATINGS MARKET, BY RESIN TYPE, 2019–2022 (USD MILLION)
                    TABLE 253 MIDDLE EAST & AFRICA: ARCHITECTURAL METAL COATINGS MARKET, BY RESIN TYPE,  2023–2028 (USD MILLION)
                    TABLE 254 MIDDLE EAST & AFRICA: ARCHITECTURAL METAL COATINGS MARKET, BY RESIN TYPE, 2019–2022 (KILOTON)
                    TABLE 255 MIDDLE EAST & AFRICA: ARCHITECTURAL METAL COATINGS MARKET, BY RESIN TYPE, 2023–2028 (KILOTON)
                    TABLE 256 MIDDLE EAST & AFRICA: ARCHITECTURAL METAL COATINGS MARKET, BY APPLICATION, 2019–2022 (USD MILLION)
                    TABLE 257 MIDDLE EAST & AFRICA: ARCHITECTURAL METAL COATINGS MARKET, BY APPLICATION, 2023–2028 (USD MILLION)
                    TABLE 258 MIDDLE EAST & AFRICA: ARCHITECTURAL METAL COATINGS MARKET, BY APPLICATION, 2019–2022 (KILOTON)
                    TABLE 259 MIDDLE EAST & AFRICA: ARCHITECTURAL METAL COATINGS MARKET, BY APPLICATION, 2023–2028 (KILOTON)
                    TABLE 260 MIDDLE EAST & AFRICA: ARCHITECTURAL METAL COATINGS MARKET, BY COIL COATINGS APPLICATION, 2019–2022 (USD MILLION)
                    TABLE 261 MIDDLE EAST & AFRICA: ARCHITECTURAL METAL COATINGS MARKET, BY COIL COATINGS APPLICATION, 2023–2028 (USD MILLION)
                    TABLE 262 MIDDLE EAST & AFRICA: ARCHITECTURAL METAL COATINGS MARKET, BY COIL COATINGS APPLICATION, 2019–2022 (KILOTON)
                    TABLE 263 MIDDLE EAST & AFRICA: ARCHITECTURAL METAL COATINGS MARKET, BY COIL COATINGS APPLICATION, 2023–2028 (KILOTON)
                    TABLE 264 MIDDLE EAST & AFRICA: ARCHITECTURAL METAL COATINGS MARKET, BY EXTRUSION COATINGS APPLICATION, 2019–2022 (USD MILLION)
                    TABLE 265 MIDDLE EAST & AFRICA: ARCHITECTURAL METAL COATINGS MARKET, BY EXTRUSION COATINGS APPLICATION, 2023–2028 (USD MILLION)
                    TABLE 266 MIDDLE EAST & AFRICA: ARCHITECTURAL METAL COATINGS MARKET, BY EXTRUSION COATINGS APPLICATION, 2019–2022 (KILOTON)
                    TABLE 267 MIDDLE EAST & AFRICA: ARCHITECTURAL METAL COATINGS MARKET, BY EXTRUSION COATINGS APPLICATION, 2023–2028 (KILOTON)
           8.6.2 GCC COUNTRIES
                    8.6.2.1 Saudi Arabia
                               8.6.2.1.1 Increased investments in multifarious sectors to propel demand
                                              TABLE 268 SAUDI ARABIA: ARCHITECTURAL METAL COATINGS MARKET, BY RESIN TYPE, 2019–2022 (USD MILLION)
                                              TABLE 269 SAUDI ARABIA: ARCHITECTURAL METAL COATINGS MARKET, BY RESIN TYPE, 2023–2028 (USD MILLION)
                                              TABLE 270 SAUDI ARABIA: ARCHITECTURAL METAL COATINGS MARKET, BY RESIN TYPE, 2019–2022 (KILOTON)
                                              TABLE 271 SAUDI ARABIA: ARCHITECTURAL METAL COATINGS MARKET, BY RESIN TYPE, 2023–2028 (KILOTON)
                    8.6.2.2 Rest of GCC countries
                                TABLE 272 REST OF GCC COUNTRIES: ARCHITECTURAL METAL COATINGS MARKET, BY RESIN TYPE, 2019–2022 (USD MILLION)
                                TABLE 273 REST OF GCC COUNTRIES: ARCHITECTURAL METAL COATINGS MARKET, BY RESIN TYPE, 2023–2028 (USD MILLION)
                                TABLE 274 REST OF GCC COUNTRIES: ARCHITECTURAL METAL COATINGS MARKET, BY RESIN TYPE, 2019–2022 (KILOTON)
                                TABLE 275 REST OF GCC COUNTRIES: ARCHITECTURAL METAL COATINGS MARKET, BY RESIN TYPE, 2023–2028 (KILOTON)
           8.6.3 SOUTH AFRICA
                    8.6.3.1 Substantial demand for architectural metal coatings witnessed in building projects
                                TABLE 276 SOUTH AFRICA: ARCHITECTURAL METAL COATINGS MARKET, BY RESIN TYPE, 2019–2022 (USD MILLION)
                                TABLE 277 SOUTH AFRICA: ARCHITECTURAL METAL COATINGS MARKET, BY RESIN TYPE, 2023–2028 (USD MILLION)
                                TABLE 278 SOUTH AFRICA: ARCHITECTURAL METAL COATINGS MARKET, BY RESIN TYPE, 2019–2022 (KILOTON)
                                TABLE 279 SOUTH AFRICA: ARCHITECTURAL METAL COATINGS MARKET, BY RESIN TYPE, 2023–2028 (KILOTON)
           8.6.4 REST OF MIDDLE EAST & AFRICA
                    TABLE 280 REST OF MIDDLE EAST & AFRICA: ARCHITECTURAL METAL COATINGS MARKET, BY RESIN TYPE, 2019–2022 (USD MILLION)
                    TABLE 281 REST OF MIDDLE EAST & AFRICA: ARCHITECTURAL METAL COATINGS MARKET, BY RESIN TYPE, 2023–2028 (USD MILLION)
                    TABLE 282 REST OF MIDDLE EAST & AFRICA: ARCHITECTURAL METAL COATINGS MARKET, BY RESIN TYPE, 2019–2022 (KILOTON)
                    TABLE 283 REST OF MIDDLE EAST & AFRICA: ARCHITECTURAL METAL COATINGS MARKET, BY RESIN TYPE, 2023–2028 (KILOTON)
 
9 COMPETITIVE LANDSCAPE (Page No. - 264)
    9.1 KEY PLAYER STRATEGIES 
           9.1.1 OVERVIEW OF STRATEGIES ADOPTED BY KEY MARKET PLAYERS (2018–2023)
                    TABLE 284 OVERVIEW OF STRATEGIES ADOPTED BY KEY MARKET PLAYERS (2018–2023)
    9.2 MARKET SHARE ANALYSIS 
          FIGURE 49 MARKET SHARE ANALYSIS, 2022
          TABLE 285 ARCHITECTURAL METAL COATINGS MARKET: DEGREE OF COMPETITION
           9.2.1 MARKET RANKING ANALYSIS
                    FIGURE 50 MARKET RANKING ANALYSIS, 2022
    9.3 REVENUE ANALYSIS 
          FIGURE 51 REVENUE ANALYSIS OF TOP FIVE PLAYERS
    9.4 COMPANY VALUATION AND FINANCIAL METRICS, 2023 
           9.4.1 COMPANY VALUATION
                    FIGURE 52 COMPANY VALUATION
           9.4.2 FINANCIAL METRICS
                    FIGURE 53 FINANCIAL METRICS
    9.5 BRAND/PRODUCT COMPARATIVE ANALYSIS 
          TABLE 286 BRAND/PRODUCT COMPARATIVE ANALYSIS
    9.6 COMPANY EVALUATION MATRIX, KEY PLAYERS 
           9.6.1 STARS
           9.6.2 EMERGING LEADERS
           9.6.3 PERVASIVE PLAYERS
           9.6.4 PARTICIPANTS
                    FIGURE 54 ARCHITECTURAL METAL COATINGS MARKET: COMPANY EVALUATION MATRIX (KEY PLAYERS), 2023
                    FIGURE 55 PRODUCT FOOTPRINT (20 COMPANIES)
           9.6.5 COMPANY OVERALL FOOTPRINT
                    TABLE 287 COMPANY OVERALL FOOTPRINT (20 COMPANIES)
                    TABLE 288 COMPANY REGION FOOTPRINT (20 COMPANIES)
                    TABLE 289 COMPANY APPLICATION FOOTPRINT (20 COMPANIES)
                    TABLE 290 COMPANY RESIN TYPE FOOTPRINT (20 COMPANIES)
    9.7 STARTUPS/SMES EVALUATION MATRIX 
           9.7.1 PROGRESSIVE COMPANIES
           9.7.2 RESPONSIVE COMPANIES
           9.7.3 DYNAMIC COMPANIES
           9.7.4 STARTING BLOCKS
                    FIGURE 56 ARCHITECTURAL METAL COATINGS MARKET: STARTUPS/SMES EVALUATION MATRIX, 2023
           9.7.5 COMPETITIVE BENCHMARKING
                    9.7.5.1 Detailed list of key startups/SMEs
                                TABLE 291 ARCHITECTURAL METAL COATINGS MARKET: DETAILED LIST OF KEY STARTUPS/SMES
                    9.7.5.2 Competitive benchmarking of key startups/SMEs
                                TABLE 292 ARCHITECTURAL METAL COATINGS MARKET: COMPETITIVE BENCHMARKING OF KEY PLAYERS [STARTUPS/SMES]
    9.8 COMPETITIVE SCENARIO AND TRENDS 
           9.8.1 ARCHITECTURAL METAL COATING MARKET: PRODUCT LAUNCHES, 2018–2023
                    TABLE 293 ARCHITECTURAL METAL COATINGS MARKET: PRODUCT LAUNCHES, 2018–2023
           9.8.2 ARCHITECTURAL METAL COATINGS MARKET: DEALS, 2018–2023
                    TABLE 294 ARCHITECTURAL METAL COATINGS MARKET: DEALS, 2018–2023
           9.8.3 ARCHITECTURAL METAL COATINGS MARKET: OTHER DEVELOPMENTS, 2018–2023
                    TABLE 295 ARCHITECTURAL METAL COATINGS MARKET: OTHER DEVELOPMENTS, 2018–2023
 
10 COMPANY PROFILES (Page No. - 285)
(Business overview, Products/Services/Solutions offered, Recent Developments, MNM view)*
     10.1 KEY PLAYERS 
             10.1.1 THE SHERWIN-WILLIAMS COMPANY
                        TABLE 296 THE SHERWIN-WILLIAMS COMPANY: COMPANY OVERVIEW
                        FIGURE 57 THE SHERWIN-WILLIAMS COMPANY: COMPANY SNAPSHOT
                        TABLE 297 THE SHERWIN-WILLIAMS COMPANY: PRODUCT LAUNCHES
             10.1.2 PPG INDUSTRIES, INC.
                        TABLE 298 PPG INDUSTRIES, INC.: COMPANY OVERVIEW
                        FIGURE 58 PPG INDUSTRIES, INC.: COMPANY SNAPSHOT
                        TABLE 299 PPG INDUSTRIES, INC.: DEALS
             10.1.3 AKZO NOBEL N.V.
                        TABLE 300 AKZO NOBEL N.V.: COMPANY OVERVIEW
                        FIGURE 59 AKZO NOBEL N.V.: COMPANY SNAPSHOT
                        TABLE 301 AKZO NOBEL N.V.: PRODUCT LAUNCHES
             10.1.4 AXALTA COATING SYSTEMS LTD.
                        TABLE 302 AXALTA COATING SYSTEMS LTD.: COMPANY OVERVIEW
                        FIGURE 60 AXALTA COATING SYSTEMS LTD.: COMPANY SNAPSHOT
                        TABLE 303 AXALTA COATING SYSTEMS LTD.: OTHERS
             10.1.5 NIPPON PAINT HOLDINGS CO., LTD.
                        TABLE 304 NIPPON PAINT HOLDINGS CO., LTD.: COMPANY OVERVIEW
                        FIGURE 61 NIPPON PAINT HOLDINGS CO., LTD.: COMPANY SNAPSHOT
                        TABLE 305 NIPPON PAINT HOLDINGS CO., LTD.: DEALS
             10.1.6 BECKERS GROUP
                        TABLE 306 BECKERS GROUP: COMPANY OVERVIEW
                        TABLE 307 BECKERS GROUP: OTHER DEVELOPMENTS
             10.1.7 KANSAI PAINT CO., LTD.
                        TABLE 308 KANSAI PAINT CO., LTD.: COMPANY OVERVIEW
                        FIGURE 62 KANSAI PAINT CO., LTD.: COMPANY SNAPSHOT
             10.1.8 WACKER CHEMIE AG
                        TABLE 309 WACKER CHEMIE AG: COMPANY OVERVIEW
                        FIGURE 63 WACKER CHEMIE AG: COMPANY SNAPSHOT
             10.1.9 HEMPEL A/S
                        TABLE 310 HEMPEL A/S: COMPANY OVERVIEW
                        FIGURE 64 HEMPEL A/S: COMPANY SNAPSHOT
                        TABLE 311 HEMPEL A/S: PRODUCT LAUNCHES
                        TABLE 312 HEMPEL A/S: OTHER DEVELOPMENTS
             10.1.10 NOROO COIL COATINGS CO., LTD.
                        TABLE 313 NOORO COIL COATINGS CO., LTD.: COMPANY OVERVIEW
     10.2 OTHER PLAYERS 
             10.2.1 YUNG CHI PAINT & VARNISH MFG. CO., LTD.
                        TABLE 314 YUNG CHI PAINT & VARNISH MFG. CO., LTD.: COMPANY OVERVIEW
             10.2.2 JOTUN A/S
                        TABLE 315 JOTUN A/S: COMPANY OVERVIEW
             10.2.3 ALCEA S.P.A.
                        TABLE 316 ALCEA S.P.A.: COMPANY OVERVIEW
             10.2.4 TITAN COATINGS, INC.
                        TABLE 317 TITAN COATINGS, INC.: COMPANY OVERVIEW
             10.2.5 REPLASA ADVANCED MATERIALS, SA
                        TABLE 318 REPLASA ADVANCED MATERIALS, SA: COMPANY OVERVIEW
             10.2.6 KCC CORPORATION
                        TABLE 319 KCC CORPORATION: COMPANY OVERVIEW
             10.2.7 JIANGSU KAOPULE NEW MATERIALS CO., LTD.
                        TABLE 320 JIANGSU KAOPULE NEW MATERIALS CO., LTD.: COMPANY OVERVIEW
             10.2.8 KGE GROUP
                        TABLE 321 KGE GROUP: COMPANY OVERVIEW
             10.2.9 JIANGSU LANLING CHEMICAL GROUP CO., LTD.
                        TABLE 322 JIANGSU LANLING CHEMICAL GROUP CO., LTD.: COMPANY OVERVIEW
             10.2.10 LINUO GROUP
                        TABLE 323 LINUO GROUP: COMPANY OVERVIEW
 
*Details on Business overview, Products/Services/Solutions offered, Recent Developments, MNM view might not be captured in case of unlisted companies.
 
11 ADJACENT AND RELATED MARKETS (Page No. - 331)
     11.1 INTRODUCTION 
     11.2 PAINTS & COATINGS MARKET 
             11.2.1 MARKET DEFINITION
             11.2.2 PAINTS & COATINGS: MARKET OVERVIEW
             11.2.3 PAINTS & COATINGS MARKET ANALYSIS, BY TECHNOLOGY
                        TABLE 324 INDUSTRIAL: PAINTS & COATINGS MARKET, BY TECHNOLOGY,  2017–2020 (USD MILLION)
                        TABLE 325 INDUSTRIAL: PAINTS & COATINGS MARKET, BY TECHNOLOGY,  2021–2027 (USD MILLION)
                        TABLE 326 INDUSTRIAL: PAINTS & COATINGS MARKET, BY TECHNOLOGY, 2017–2020 (KILOTON)
                        TABLE 327 INDUSTRIAL: PAINTS & COATINGS MARKET, BY TECHNOLOGY, 2021–2027 (KILOTON)
                        TABLE 328 DECORATIVE: PAINTS & COATINGS MARKET, BY TECHNOLOGY,  2017–2020 (USD MILLION)
                        TABLE 329 DECORATIVE: PAINTS & COATINGS MARKET, BY TECHNOLOGY,  2021–2027 (USD MILLION)
                        TABLE 330 DECORATIVE: PAINTS & COATINGS MARKET, BY TECHNOLOGY, 2017–2020 (KILOTON)
                        TABLE 331 DECORATIVE: PAINTS & COATINGS MARKET, BY TECHNOLOGY, 2021–2027 (KILOTON)
             11.2.4 PAINTS & COATINGS MARKET ANALYSIS, BY END-USE INDUSTRY
                        TABLE 332 PAINTS & COATINGS MARKET, BY END-USE INDUSTRY, 2017–2020 (USD MILLION)
                        TABLE 333 PAINTS & COATINGS MARKET, BY END-USE INDUSTRY, 2021–2027 (USD MILLION)
                        TABLE 334 PAINTS & COATINGS MARKET, BY END-USE INDUSTRY, 2017–2020 (KILOTON)
                        TABLE 335 PAINTS & COATINGS MARKET, BY END-USE INDUSTRY, 2021–2027 (KILOTON)
             11.2.5 PAINTS & COATINGS MARKET ANALYSIS, BY RESIN TYPE
                        TABLE 336 PAINTS & COATINGS MARKET, BY RESIN TYPE, 2017–2020 (USD MILLION)
                        TABLE 337 PAINTS & COATINGS MARKET, BY RESIN TYPE, 2021–2027 (USD MILLION)
                        TABLE 338 PAINTS & COATINGS MARKET, BY RESIN TYPE, 2017–2020 (KILOTON)
                        TABLE 339 PAINTS & COATINGS MARKET, BY RESIN TYPE, 2021–2027 (KILOTON)
                        TABLE 340 DECORATIVE PAINTS & COATINGS MARKET, BY RESIN TYPE, 2017–2020 (USD MILLION)
                        TABLE 341 DECORATIVE PAINTS & COATINGS MARKET, BY RESIN TYPE, 2021–2027 (USD MILLION)
                        TABLE 342 DECORATIVE PAINTS & COATINGS MARKET, BY RESIN TYPE, 2017–2020 (KILOTON)
                        TABLE 343 DECORATIVE PAINTS & COATINGS MARKET, BY RESIN TYPE, 2021–2027 (KILOTON)
                        TABLE 344 INDUSTRIAL PAINTS & COATINGS MARKET, BY RESIN TYPE, 2017–2020 (USD MILLION)
                        TABLE 345 INDUSTRIAL PAINTS & COATINGS MARKET, BY RESIN TYPE, 2021–2027 (USD MILLION)
                        TABLE 346 INDUSTRIAL PAINTS & COATINGS MARKET, BY RESIN TYPE, 2017–2020 (KILOTON)
                        TABLE 347 INDUSTRIAL PAINTS & COATINGS MARKET, BY RESIN TYPE, 2021–2027 (KILOTON)
             11.2.6 PAINTS & COATINGS MARKET ANALYSIS, BY REGION
                        TABLE 348 PAINTS & COATINGS MARKET, BY REGION, 2017–2020 (USD MILLION)
                        TABLE 349 PAINTS & COATINGS MARKET, BY REGION, 2021–2027 (USD MILLION)
                        TABLE 350 PAINTS & COATINGS MARKET, BY REGION, 2017–2020 (KILOTON)
                        TABLE 351 PAINTS & COATINGS MARKET, BY REGION, 2021–2027 (KILOTON)
 
12 APPENDIX (Page No. - 342)
     12.1 DISCUSSION GUIDE 
     12.2 KNOWLEDGESTORE: MARKETSANDMARKETS’  SUBSCRIPTION PORTAL 
     12.3 CUSTOMIZATION OPTIONS 
     12.4 RELATED REPORTS 
     12.5 AUTHOR DETAILS 

The study involved four major activities in estimating the current size of the architectural metal coatings market. Exhaustive secondary research was done to collect information on the market, peer market, and parent market. The next step was to validate these findings, assumptions, and sizing with industry experts across the value chain through primary research. Both top-down and bottom-up approaches were employed to estimate the complete market size. After that, market breakdown and data triangulation were used to estimate the market size of segments and subsegments.

Secondary Research

Secondary sources referred to for this research study include financial statements of companies offering architectural metal coatings information from various trade, business, and professional associations. The secondary data was collected and analyzed to arrive at the overall size of the architectural metal coatings market, which was validated by primary respondents.

Primary Research

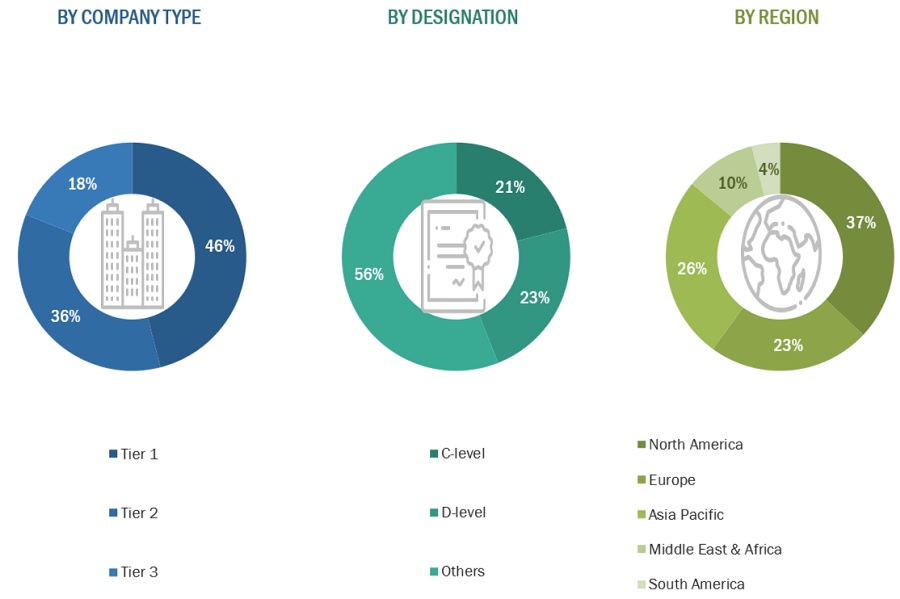
Extensive primary research was conducted after obtaining information regarding the architectural metal coatings market scenario through secondary research. Several primary interviews were conducted with market experts from both, the demand and supply sides across major countries of North America, Europe, Asia Pacific, the Middle East & Africa, and South America. Primary data was collected through questionnaires, emails, and telephonic interview. The primary sources from the supply side included various industry experts, such as Chief X Officers (CXOs), Vice Presidents (VPs), Directors, from business development, marketing, product development/innovation teams, and related key executives from architectural metal coatings vendors; raw material suppliers; distributors; and key opinion leaders. Primary interviews were conducted to gather insights such as market statistics, data of revenue collected from the products and services, market breakdowns, market size estimations, market forecasting, and data triangulation. Primary research also helped in understanding the various trends related to resin type, application, and region. Stakeholders from the demand side, such as CIOs, CTOs, and CSOs, and installation teams of the customer/end users who are using architectural metal coatings were interviewed to understand the buyer’s perspective on the suppliers, products, component providers, and their current usage of architectural metal coatings and future outlook of their business which will affect the overall market.

The Breakup of Primary Research:
Architectural Metal Coatings Market Size, and Share

To know about the assumptions considered for the study, download the pdf brochure

CoMPANY NAME

DESIGNATION

The Sherwin-Williams Company

Director

AkzoNobel N.V.

Project Manager

Becker Group

Individual Industry Expert

Axalta Coating Systems Ltd

Director

Market Size Estimation

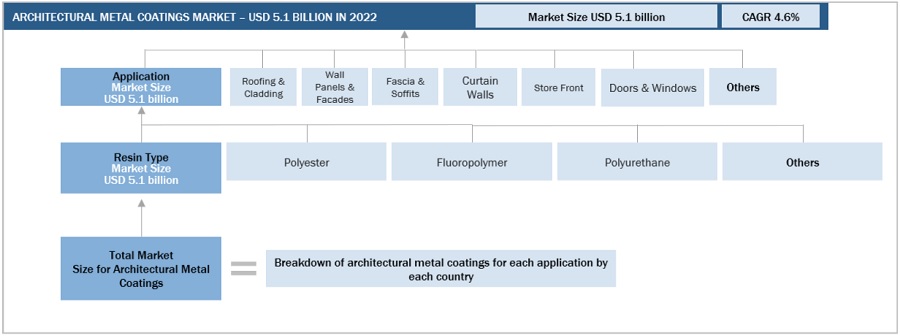
The research methodology used to estimate the size of the architectural metal coatings market includes the following details. The market sizing of the market was undertaken from the demand side. The market was upsized based on procurements and modernizations in the end-use industries at a regional level. Such procurements provide information on the demand aspects of architectural metal coatings.

Global Architectural Metal Coatings Market Size: Bottom-Up Approach
Architectural Metal Coatings Market Size, and Share

To know about the assumptions considered for the study, Request for Free Sample Report

Global Architectural Metal Coatings Market Size: Top-Down Approach

Architectural Metal Coatings Market Size, and Share

Data Triangulation

After arriving at the overall size from the market size estimation process explained above, the total market was split into several segments and subsegments. The data triangulation and market breakdown procedures explained below were implemented, wherever applicable, to complete the overall market engineering process and arrive at the exact statistics for various market segments and subsegments. The data was triangulated by studying various factors and trends from the demand and supply sides. Along with this, the market size was validated using both the top-down and bottom-up approaches.

Market Definition

According to the National Coil Coating Association, “Architectural metal coatings comprise two main coating types: coil coatings and extrusion coatings. Coil coatings are applied to coiled sheets of metal before it is formed, while extrusion coatings are spray applied after the aluminum extrusion has been formed. These coatings are used to finish metal building products such as wall panels, curtain walls, roofing, and metal facades

Key Stakeholders

  • End User
  • Raw Material Suppliers
  • Senior Management
  • Procurement Department

Report Objectives

  • To define, describe, segment, and forecast the size of the architectural metal coatings market based on resin type, application, and region.
  • To forecast the market size of segments with respect to various regions, including North America, Europe, Asia Pacific, South America, Middle East & Africa, along with major countries in each region
  • To identify and analyze key drivers, restraints, opportunities, and challenges influencing the growth of the architectural metal coatings market
  • To analyze technological advancements and product launches in the market
  • To strategically analyze micro markets, with respect to their growth trends, prospects, and their contribution to the market
  • To identify financial positions, key products, and key developments of leading companies in the market
  • To provide a detailed competitive landscape of the market, along with market share analysis
  • To provide a comprehensive analysis of business and corporate strategies adopted by the key players in the market
  • To strategically profile key players in the market and comprehensively analyze their core competencies

Available Customizations

MarketsandMarkets offers the following customizations for this market report:

  • Additional country-level analysis of the architectural metal coatings market
  • Profiling of additional market players (up to 5)

Product Analysis

  • Product matrix, which provides a detailed comparison of the product portfolio of each company in the architectural metal coatings Market

Previous Versions of this Report

Architectural Metal Coatings Market by Resin Type (Polyester, Fluoropolymer), Coil Coating Application (Roofing & Cladding, Wall Panels & Facades), Extrusion Coating Application (Curtain Walls, Store Front) and Region - Global Forecast to 2027

Report Code CH 8107
Published in May, 2022, By MarketsandMarkets™
"Our USP is "providing game-changing business opportunities reports with free customization" - so please feel free to provide us with your specific areas of interest / business challenges in much greater detail !!"

We appreciate your interest in this report. Once you fill out the form, you'll be immediately directed to an exclusive solution tailored to your needs. This high-value offering can help boost your revenue by 30% - a must-see opportunity for anyone looking to maximize growth.


By clicking the "Submit" button, you are agreeing to the Terms of Use and Privacy Policy.

Custom Market Research Services

We Will Customise The Research For You, In Case The Report Listed Above Does Not Meet With Your Requirements

Get 10% Free Customisation

Growth opportunities and latent adjacency in Architectural Metal Coatings Market

David

Jul, 2023

I need architectural metal coatings market report for North American region. .

DMCA.com Protection Status