We use cookies to enhance your experience. By continuing to visit this site you agree to our use of cookies . More info . X close

3D Imaging Market: Growth, Size, Share, and Trends

Report Code TC 1446
Published in Jan, 2024, By MarketsandMarkets™
Download PDF

Choose License Type

Buy Report Now Inquire Before Buying

3D Imaging Market by Hardware (3D Cameras, 3D Sensors, 3D Scanners), Software (Modeling, Scanning, Layout & Animation, Visualization & Rendering, Image Reconstruction), Technology (Stereoscopic Imaging, Laser-based Imaging) - Global Forecast to 2028

Overview

The global 3D imaging market growth forecasted to transform from USD 34.3 billion in 2023 to USD 88.4 billion by 2028, driven by a CAGR of 20.8%. 3D imaging finds diverse applications across numerous industries, revolutionizing fields from medicine to entertainment. In healthcare, it enables precise anatomical visualizations, aiding in diagnostics, surgical planning, and prosthetic development. Architects and engineers leverage 3D imaging for creating detailed models, improving designs, and showcasing concepts to clients vividly. Entertainment thrives on 3D technology, crafting immersive experiences in gaming, movies, and virtual reality. Archaeologists reconstruct historical artifacts, unraveling mysteries of the past. Manufacturing benefits from streamlined prototyping and production processes, reducing errors and optimizing efficiency. Environmental scientists use 3D imaging to map terrains and study ecosystems, aiding conservation efforts. Its multifaceted applications continue to expand, offering boundless possibilities across industries, shaping a future where innovation and visualization intertwine seamlessly.

Attractive Opportunities in the 3D Imaging Market

Asia Pacific

Emerging economies in the Asia Pacific regions to provide numerous opportunities across various end users.

The remarkable surge in the utilization of 3D imaging technologies, revolutionizing the way content is created, consumed, and experienced across the media and entertainment sector propels the growth of the market.

The increasing investments in AI by 3D medical imaging device manufacturers drive the growth of market

Acquisitions and mergers would offer lucrative opportunities to the market players in the next five

North America is expected to account for the largest market share during the forecast period. The region is a leader in technological advancements and is home to 3D imaging vendors.

Global 3D Imaging Market Dynamics

Driver: Growing application of 3D imaging entertainment & media industry

The entertainment and media industry has witnessed a remarkable surge in the utilization of 3D imaging technologies, revolutionizing the way content is created, consumed, and experienced. Advancements in 3D imaging have led to immersive experiences in movies, gaming, virtual reality (VR), and augmented reality (AR), captivating audiences in entirely new ways. In the film industry, 3D imaging has enabled the creation of visually stunning special effects and lifelike animations, enhancing the overall cinematic experience. This technology has elevated storytelling and drawn audiences seeking more engaging and immersive entertainment.Similarly, 3D imaging has been a game-changer in the gaming sector, allowing for more realistic and immersive gaming experiences. The ability to render intricate, three-dimensional environments and characters has redefined the boundaries of gaming, leading to more interactive and visually stunning gameplay. Moreover, the integration of VR and AR technologies powered by 3D imaging has opened up entirely new dimensions for storytelling and interactive experiences, creating unprecedented levels of engagement for users.

Restraint: Limited field of view and depth perception

The limited field of view and depth perception constraint in 3D imaging technologies can significantly impact the comprehensiveness and accuracy of captured scenes or objects. Some 3D imaging systems may struggle to capture a complete field of view or fail to render depth information accurately, especially in complex or crowded environments. This limitation can result in incomplete or distorted representations, compromising the fidelity of the generated 3D models. In applications like robotics, autonomous vehicles, or augmented reality, where precise spatial understanding is critical, these limitations can hinder the system’s ability to perceive and navigate environments effectively, potentially leading to errors or safety concerns.Addressing these constraints often involves advancements in sensor technologies, multi-view imaging techniques, or algorithms that enhance the system’s ability to capture a broader field of view and improve depth perception. Innovations aimed at widening the field of view and enhancing depth perception accuracy are crucial for expanding the applicability of 3D imaging in diverse fields, enabling more comprehensive and reliable spatial reconstructions essential for various applications ranging from healthcare to industrial inspections and immersive experiences.


Opportunity: Adoption of 3D printing in healthcare

3D printing in healthcare has brought a significant change by creating customized medical devices, implants, anatomical models, and prosthetics that perfectly fit a patient’s unique anatomy. One of the main benefits of 3D printing is the ability to produce complex and intricate structures that are tailored to a patient’s specific needs. This is particularly important in surgeries where precision and customization are crucial. Surgeons can now use 3D-printed anatomical models to plan procedures more efficiently, replicating a patient’s specific anatomy. With 3D printing, it’s now possible to create personalized healthcare solutions such as orthopedic implants, dental prosthetics, and even organ replicas, which were previously impossible to attain.

Challenge: Demand for data processing and storage

The challenge of processing and storing data in 3D imaging arises from the complexity and volume of generated data. High-resolution 3D scans from medical imaging devices or industrial scanners produce large datasets that can strain computational resources. Real-time processing of this data for applications such as medical diagnostics or rendering virtual environments requires robust computing systems and optimized algorithms to handle the intricacies of 3D data efficiently. Storing these vast datasets while ensuring accessibility and maintaining data integrity presents a considerable challenge. Balancing the need for high-capacity storage with cost-effectiveness and data retrieval speeds becomes crucial, especially as the amount of 3D imaging data grows with technological advancements and the expansion of application areas.

Global 3D Imaging Market Ecosystem Analysis

3D Imaging Market Ecosystem


By component services to hold the highest CAGR during the forecast period.

Services in 3D imaging play a pivotal role in bridging expertise and technology. It offer specialized solutions ranging from scanning and modeling to consultation and software development, catering to diverse needs across industries. These services provide accessibility to cutting-edge equipment and expertise, enabling businesses to harness the full potential of 3D imaging without significant investments in infrastructure. Additionally, it facilitates customized solutions, ensuring specific requirements are met efficiently. Service providers act as catalysts for innovation, empowering organizations to leverage the transformative capabilities of 3D imaging for enhanced productivity, problem-solving, and the creation of high-quality, immersive experiences.

Based on technology, Stereoscopic Imaging accounts for the largest market size during the forecast period.

Stereoscopic imaging creates a 3D effect by presenting two offset images separately to each eye, simulating depth perception. Using two slightly different perspectives, typically captured or displayed side by side, it mimics how human eyes perceive depth. This technique relies on the brain's ability to merge these images, resulting in the perception of depth and three-dimensional visuals. Commonly used in films, gaming, and medical imaging, it enhances realism and immersion by recreating a sense of depth and spatial dimension.

North America Region Holds the Largest Share of the 3D Imaging Market

North America stands as a forefront region, exhibiting a strong inclination towards innovation, witnessing significant interest from both enterprises and customers for cutting-edge solutions. The region's robust infrastructure, coupled with innovative initiatives, propels its growth in the 3D imaging market. The escalating demand for 3D technology-based products has fueled market expansion. Consumer electronics such as smartphones, tablets, PCs, and gaming consoles incorporate 3D imaging for gesture recognition, object measurement, and position tracking. Additionally, 3D imaging finds utility in developing facial recognition systems for identity verification. With a multitude of manufacturing industries in the region, there's a heightened need for monitoring and inspection services throughout product production and packaging processes.

Recent Developments of 3D Imaging Market industry

  • In November 2023, The University of Wisconsin and GE Healthcare announced a strategic 10-year collaboration, extending their 40-year partnership. This new research collaboration expands the existing scope beyond medical imaging to new frontiers in digital technologies and disease-focused solutions.
  • In October 2023, Autodesk announced the acquisition of Flexism with an intent to add factory simulation and operational efficiency analysis to its factory design tools.

Key Market Players

Key Players in the 3D Imaging Market Include

  • GE Healthcare (US)
  • Autodesk (US)
  • STMicroelectronics (Switzerland)
  • Panasonic (Japan)
  • Sony Corporation (Japan)
  • Trimble (US)
  • FARO Technologies (US)
  • Philips (Netherlands)
  • Google (US)
  • Adobe (US)
  • HP (US)
  • Dassault Systemes (France)
  • Bentley Systems (US)
  • Lockheed Martin (US)
  • Topcon (Japan)
  • Able Software (US)
  •   Maxon (Germany)
  • ESRI (US)
  • Archilogic (Switzerland)
  • Pix4D (Switzerland)
  • Brainkey (US)
  • Precismo (US)
  • Kaarta (US)
  • LightCode Photonics (Estonia)
  • Vzense Technology (US)
  • Capoom (Istanbul)
  • Atomontage (US)
  • Hivemapper (US)
  • Shapr3D (Hungary)
  • Innersight (UK)

Want to explore hidden markets that can drive new revenue in 3D Imaging Market?

Scope of the Report

Report Attribute Details
Market size available for years 2018–2028
Base year considered 2022
Forecast period 2023–2028
Forecast units USD Billion
Segments Covered Component, Technology, Vertical, and Region
Geographies covered North America, Europe, Asia Pacific, the Middle East & Africa, and Latin America
Companies covered GE Healthcare (US), Autodesk (US), STMicroelectronics (Switzerland), Panasonic (Japan), Sony Corporation (Japan), Trimble (US), FARO Technologies (US), Philips (Netherlands), Google (US), Adobe (US), HP (US), Dassault Systemes (France), Bentley Systems (US), Lockheed Martin (US), Topcon (Japan), Able Software (US),  Maxon (Germany), ESRI (US), Archilogic (Switzerland), Pix4D (Switzerland), Brainkey (US), Precismo (US), Kaarta (US), LightCode Photonics (Estonia), Vzense Technology (US), Capoom (Istanbul), Atomontage (US), Hivemapper (US), Shapr3D (Hungary), Innersight (UK).

Key Questions Addressed by the Report

What is 3D Imaging?
3D imaging is the process of creating the illusion of depth in an image. Technological advancements and specialized inspection techniques in industrial applications allow users to obtain accurate 3D data on objects, providing 3D images for testing purposes.
Which countries are considered in the European region?
The report includes an analysis of the UK, Germany, France, Italy, Spain, and Rest of Europe in the European region.
How does 3D Imaging work?
3D imaging generates depth-perceptive three-dimensional visuals on flat surfaces, mimicking real-world depth perception. This technology is widely used across industries such as aerospace, defense, manufacturing, retail, automotive, healthcare, and life sciences.
Which are the key drivers supporting the market growth for 3D Imaging Market?
The key drivers include rising demand for personalized medicine, growth in entertainment and media, increasing demand for 3D-enabled devices, urbanization, productivity push, and environmental concerns in architecture and construction.
What are the companies in the market for 3D Imaging?
Key companies in the global 3D Imaging market include GE Healthcare (US), Autodesk (US), STMicroelectronics (Switzerland), Panasonic (Japan), Sony Corporation (Japan), Trimble (US), FARO Technologies (US), Philips (Netherlands), Google (US), Adobe (US), HP (US), Dassault Systemes (France), Bentley Systems (US), Lockheed Martin (US), Topcon (Japan), Able Software (US), Maxon (Germany), ESRI (US), Archilogic (Switzerland), Pix4D (Switzerland), Brainkey (US), Precismo (US), Kaarta (US), LightCode Photonics (Estonia), Vzense Technology (US), Capoom (Istanbul), Atomontage (US), Hivemapper (US), Shapr3D (Hungary), Innersight (UK).


Personalize This Research

  • Triangulate with your Own Data
  • Get Data as per your Format and Definition
  • Gain a Deeper Dive on a Specific Application, Geography, Customer or Competitor
  • Any level of Personalization
Request A Free Customisation

Let Us Help You

  • What are the Known and Unknown Adjacencies Impacting the 3D Imaging Market
  • What will your New Revenue Sources be?
  • Who will be your Top Customer; what will make them switch?
  • Defend your Market Share or Win Competitors
  • Get a Scorecard for Target Partners
Customized Workshop Request

Table of Contents

Exclusive indicates content/data unique to MarketsandMarkets and not available with any competitors.

TITLE
PAGE NO
INTRODUCTION
29
RESEARCH METHODOLOGY
34
EXECUTIVE SUMMARY
46
PREMIUM INSIGHTS
52
MARKET OVERVIEW AND INDUSTRY TRENDS
55
  • 5.1 INTRODUCTION
  • 5.2 MARKET DYNAMICS
    DRIVERS
    - Rising demand for personalized medicines
    - Growth in entertainment & media industry
    - Rising demand for 3D-enabled devices across verticals
    - Increasing urbanization, push for productivity, and environment concerns in architecture and construction vertical
    RESTRAINTS
    - Limited field of view and depth perception
    - High maintenance cost of 3D imaging hardware
    - Interoperability issues with 3D imaging solutions and hardware
    OPPORTUNITIES
    - Adoption of 3D printing in healthcare
    - Increasing investments in AI by 3D medical imaging device manufacturers
    - High demand for 3D imaging solutions in retail & eCommerce vertical
    CHALLENGES
    - Need for education and training
    - Demand for data processing and storage
    - High power consumption requirements
  • 5.3 CASE STUDY ANALYSIS
    TATA INTERACTIVE SYSTEMS (TIS) COLLABORATED WITH AUTODESK TO INNOVATE ELEARNING WITH 3D ANIMATION
    JP CULLEN ADOPTED TRIMBLE’S SOLUTIONS TO BUILD HIGH-QUALITY PRODUCTS WITH 3D MODELING
    KOBELCO CONSTRUCTION MACHINERY COLLABORATED WITH DASSAULT SYSTÈMES TO MANAGE GLOBAL MANUFACTURING OPERATIONS
    FEOPS COLLABORATED WITH DASSAULT SYSTÈMES TO IMPROVE OUTCOMES IN HEART VALVE REPLACEMENT
    TRUEPOINT PROVIDED 3D LASER SCANNING AND MODELING SERVICES FOR POWER PLANT IN MICHIGAN
    CHINA RAILWAY DESIGN CORPORATION ADOPTED DASSAULT SYSTÈMES’ 3DEXPERIENCE PLATFORM TO DESIGN RAILWAY PROJECTS
    BIOLITE ADOPTED AUTODESK SOFTWARE TO CREATE ELECTRICITY-GENERATING BIOMASS STOVES FOR IMPROVING PUBLIC HEALTH
  • 5.4 TARIFF AND REGULATORY LANDSCAPE
    TARIFF RELATED TO 3D IMAGING MARKET
  • 5.5 REGULATORY BODIES, GOVERNMENT AGENCIES, AND OTHER ORGANIZATIONS
    NORTH AMERICA
    EUROPE
    ASIA PACIFIC
    MIDDLE EAST & AFRICA
    LATIN AMERICA
  • 5.6 TRADE ANALYSIS/HS CODE
    IMPORT SCENARIO OF TELEVISION CAMERAS, DIGITAL CAMERAS, AND VIDEO CAMERA RECORDERS
    EXPORT SCENARIO OF TELEVISION CAMERAS, DIGITAL CAMERAS, AND VIDEO CAMERA RECORDERS
  • 5.7 3D IMAGING MARKET EVOLUTION
  • 5.8 ECOSYSTEM/MARKET MAP
  • 5.9 SUPPLY CHAIN ANALYSIS
  • 5.10 PRICING ANALYSIS
    AVERAGE SELLING PRICE TREND OF KEY PLAYERS, BY HARDWARE
    INDICATIVE PRICING ANALYSIS OF 3D IMAGING SOFTWARE
  • 5.11 TRENDS/DISRUPTIONS IMPACTING CUSTOMERS’ BUSINESSES
  • 5.12 PATENT ANALYSIS
    METHODOLOGY
    PATENTS FILED, BY DOCUMENT TYPE
    INNOVATION AND PATENT APPLICATIONS
    TOP 10 PATENT APPLICANTS IN 3D IMAGING MARKET
  • 5.13 PORTER’S FIVE FORCES ANALYSIS
    THREAT OF NEW ENTRANTS
    THREAT OF SUBSTITUTES
    BARGAINING POWER OF SUPPLIERS
    BARGAINING POWER OF BUYERS
    INTENSITY OF COMPETITIVE RIVALRY
  • 5.14 KEY CONFERENCES & EVENTS
  • 5.15 KEY STAKEHOLDERS & BUYING CRITERIA
    KEY STAKEHOLDERS IN BUYING PROCESS
    BUYING CRITERIA
  • 5.16 TECHNOLOGY ANALYSIS
    KEY TECHNOLOGIES
    - Photogrammetry
    - 3D printing
    - Real-time simulation
    COMPLIMENTARY TECHNOLOGIES
    - Geographic information system
    - Digital twin
    ADJACENT TECHNOLOGIES
    - Artificial intelligence & machine learning
    - Cloud computing
    - Blockchain
  • 5.17 ROADMAP FOR 3D IMAGING MARKET
  • 5.18 BEST PRACTICES IN 3D IMAGING MARKET
  • 5.19 3D IMAGING TECHNIQUES
3D IMAGING MARKET, BY COMPONENT
92
  • 6.1 INTRODUCTION
    COMPONENTS: 3D IMAGING MARKET DRIVERS
  • 6.2 HARDWARE
    INCREASING DEMAND FOR ADVANCED 3D IMAGING HARDWARE AND DEVICES TO DRIVE GROWTH
    3D CAMERAS
    - 3D cameras to revolutionize industries with advanced 3D mapping techniques
    - Stereo vision
    - Time-of-flight (TOF)
    - Structured light
    - Laser triangulation
    3D SCANNERS
    - Need for improving efficiency and accuracy in manufacturing processes to drive use of 3D scanners
    - Laser scanners
    - Optimal scanners
    - Portable scanners
    - Handheld scanners
    - Others
    3D SENSORS
    - Rise in demand for 3D imaging sensors and their rapidly evolving applications in IoT and AI technologies to drive growth
    - Depth sensors
    - Image sensors
    - Position sensors
    - Accelerometers
    - Others
    3D DISPLAY
    - Need for evolution and expansion of 3D display technology and innovations to fuel market growth
    - Volumetric displays
    - Stereoscopic displays
    - Head-mounted displays
  • 6.3 SOFTWARE
    INCREASING REQUIREMENTS FOR ADVANCED SOFTWARE TO FUEL EVOLUTION OF 3D IMAGING
    SOFTWARE, BY TYPE
    - 3D modeling software
    - 3D scanning software
    - 3D layout & animation software
    - 3D visualization & rendering software
    - Image reconstruction software
    SOFTWARE, BY DEPLOYMENT MODE
    - On-premises
    - Cloud
  • 6.4 SERVICES
    PROFESSIONAL SERVICES
    - Vital role of professional services in navigating complex technological landscapes to drive market
    - Consulting services
    - Deployment & integration
    - Support & maintenance
    MANAGED SERVICES
    - Need for understanding importance of managed services for enhancing client experience to boost growth
3D IMAGING MARKET, BY TECHNOLOGY
120
  • 7.1 INTRODUCTION
    TECHNOLOGIES: 3D IMAGING MARKET DRIVERS
  • 7.2 STEREOSCOPIC IMAGING
    INCREASING APPLICATION OF STEREOSCOPIC IMAGING IN VARIOUS INDUSTRIES TO IMPROVE WORK QUALITY
    ANAGLYPHIC 3D
    POLARIZED 3D
    SHUTTER GLASSES
    AUTOSTEREOSCOPY
  • 7.3 STRUCTURED LIGHT IMAGING
    HIGH ACCURACY AND ROBUSTNESS OF STRUCTURED LIGHT IMAGING TO BOOST ITS POPULARITY
    TRIANGULATION METHOD
    PATTERN PROJECTION
    DEATH MAPPING AND RECONSTRUCTION
    OBJECT SCANNING AND MEASUREMENT
  • 7.4 LASER-BASED IMAGING
    LASER-BASED IMAGING DRIVES INNOVATION AND PRECISION ACROSS VARIOUS INDUSTRIES
    LIDAR
    LASER SCANNING
    LASER PROFILING
    LASER HOLOGRAPHY
  • 7.5 HOLOGRAPHIC IMAGING
    FOCUS ON ENHANCING VISUALIZATION AND DECISION-MAKING PROCESSES IN DIVERSE INDUSTRIES TO PROPEL GROWTH
    HOLOGRAPHIC DISPLAYS
    HOLOGRAPHIC PROJECTION
    HOLOGRAPHIC CAPTURE AND RECORDING
    HOLOGRAPHIC INTERFEROMETRY
  • 7.6 TIME-OF-FLIGHT (TOF) IMAGING
    INCREASING USE OF TOF SENSORS IN ENHANCING SAFETY AND EFFICIENCY IN AUTOMOTIVE AND INDUSTRIAL SECTORS TO ENCOURAGE GROWTH
    DEPTH SENSING & MAPPING
    GESTURE RECOGNITION
    3D SCANNING
    FACIAL RECOGNITION
3D IMAGING MARKET, BY VERTICAL
132
  • 8.1 INTRODUCTION
    VERTICALS: 3D IMAGING MARKET DRIVERS
  • 8.2 AEROSPACE & DEFENSE
    NEED FOR INTEGRATING 3D IMAGING SOLUTIONS TO REVOLUTIONIZE AEROSPACE & DEFENSE SECTOR
    AEROSPACE & DEFENSE: 3D IMAGING APPLICATIONS
    - Wing and airframe analysis
    - Surveillance & reconnaissance
    - Target area visualization
    - Flight simulators & virtual reality training
    - Others
  • 8.3 AUTOMOTIVE
    NEED FOR ASSESSING DRIVERS’ ATTENTIVENESS AND ENHANCING PARKING ASSISTANCE SYSTEMS TO DRIVE MARKET
    AUTOMOTIVE: 3D IMAGING APPLICATIONS
    - Automated parking systems
    - Collision avoidance systems
    - Driver assistance systems
    - Autonomous vehicles
    - Others
  • 8.4 MANUFACTURING
    3D IMAGING TECHNOLOGY TO REVOLUTIONIZE MANUFACTURING SECTOR WITH ITS TRANSFORMATIVE INFLUENCE
    MANUFACTURING: 3D IMAGING APPLICATIONS
    - Defect detection
    - Assembly line optimization
    - Inventory management
    - Manufacturing process optimization
    - Others
  • 8.5 HEALTHCARE & LIFE SCIENCES
    DEMAND FOR ADVANCED DIAGNOSTICS, PERSONALIZED TREATMENT, AND PATIENT ENGAGEMENT TO DRIVE 3D IMAGING TECHNOLOGY
    HEALTHCARE & LIFE SCIENCES: 3D IMAGING APPLICATIONS
    - Medical imaging
    - Surgical planning
    - Patient monitoring
    - Diagnostic imaging
    - Others
  • 8.6 ARCHITECTURE & CONSTRUCTION
    RISING NEED TO PROVIDE COMPREHENSIVE VISUALIZATIONS THAT GUIDE ON-SITE ACTIVITIES TO BOOST MARKET DEMAND
    ARCHITECTURE & CONSTRUCTION: 3D IMAGING APPLICATIONS
    - Architectural visualization
    - Building information modeling (BIM)
    - Site analysis & surveying
    - Restoration & preservation
    - Others
  • 8.7 MEDIA & ENTERTAINMENT
    EMPHASIS ON REDEFINING ENTERTAINMENT AND GAMING WITH UNPRECEDENTED REALISM AND ENGAGEMENT THROUGH 3D IMAGING TO DRIVE MARKET
    MEDIA & ENTERTAINMENT: 3D IMAGING APPLICATIONS
    - Character modeling and animation
    - Gaming
    - Visual effects (VFX)
    - Augmented reality & virtual reality
    - Others
  • 8.8 RETAIL & ECOMMERCE
    GROWING DEMAND FOR ENHANCED CUSTOMER EXPERIENCE TO DRIVE POPULARITY OF 3D IMAGING SOLUTIONS
    RETAIL & ECOMMERCE: 3D IMAGING APPLICATIONS
    - Virtual try-ons
    - Product visualization
    - Customization & personalization
    - AR-based shopping experiences
    - Others
  • 8.9 GOVERNMENT
    ABILITY TO CREATE DETAILED TOPOGRAPHIC MAPS AND MODELING STRUCTURES TO DRIVE DEMAND
    GOVERNMENT: 3D IMAGING APPLICATIONS
    - Urban planning & development
    - Environmental analysis
    - Disaster management
    - Archaeology & cultural preservation
    - Others
  • 8.10 ENERGY & UTILITIES
    RISING NEED TO EXTRACT RESOURCES BY CREATING DETAILED VISUALIZATIONS OF GEOLOGICAL FORMATIONS TO DRIVE MARKET
    ENERGY & UTILITIES: 3D IMAGING APPLICATIONS
    - Pipeline integrity assessments
    - Renewable energy site planning
    - Oil and gas exploration
    - Asset mapping & management
    - Others
  • 8.11 OTHER VERTICALS
3D IMAGING MARKET, BY REGION
159
  • 9.1 INTRODUCTION
  • 9.2 NORTH AMERICA
    NORTH AMERICA: 3D IMAGING MARKET DRIVERS
    NORTH AMERICA: RECESSION IMPACT ANALYSIS
    US
    - Rise of 3D printing technologies to rely on 3D imaging for creating digital models
    CANADA
    - Emphasis on research and development to drive growth
  • 9.3 EUROPE
    EUROPE: 3D IMAGING MARKET DRIVERS
    EUROPE: RECESSION IMPACT ANALYSIS
    UK
    - Demand for precise medical imaging techniques to propel growth
    GERMANY
    - Growing demand for immersive experiences in gaming, entertainment, and virtual experiences to fuel market
    FRANCE
    - Robust growth in entertainment and gaming industries to drive market
    ITALY
    - Need for preserving historical artifacts, artworks, and monuments to drive adoption of 3D imaging solutions
    SPAIN
    - Strong demand for advanced geospatial solutions to drive growth
    REST OF EUROPE
  • 9.4 ASIA PACIFIC
    ASIA PACIFIC: 3D IMAGING MARKET DRIVERS
    ASIA PACIFIC: RECESSION IMPACT ANALYSIS
    CHINA
    - Rising demand for cutting-edge imaging technologies to fuel growth
    JAPAN
    - Growing demand for comprehensive metaverse experience to boost demand for 3D imaging software
    INDIA
    - Growing initiatives taken by government to support digital innovation to propel growth
    ANZ
    - Rapid adoption of 3D technologies for high-fidelity imaging, intricate modeling, and immersive environment to drive growth
    SOUTH KOREA
    - Rising need to broaden global access to diagnostics to drive market growth
    REST OF ASIA PACIFIC
  • 9.5 MIDDLE EAST & AFRICA
    MIDDLE EAST & AFRICA: 3D IMAGING MARKET DRIVERS
    MIDDLE EAST & AFRICA: RECESSION IMPACT ANALYSIS
    SAUDI ARABIA
    - Need to embrace innovation and 3D imaging for enhanced diagnosis and treatment to propel demand
    UAE
    - Ability to restore and preserve cultural heritage to drive adoption of 3D imaging solutions
    SOUTH AFRICA
    - Increasing investments by businesses to adopt cutting-edge technologies to encourage market expansion
    TURKEY
    - Need for revolutionizing production processes and enabling rapid prototyping to support market growth
    REST OF MIDDLE EAST & AFRICA
  • 9.6 LATIN AMERICA
    LATIN AMERICA: 3D IMAGING MARKET DRIVERS
    LATIN AMERICA: RECESSION IMPACT ANALYSIS
    BRAZIL
    - Strategic technological integration to propel Brazil’s 3D imaging market expansion across industries
    MEXICO
    - Leveraging cutting-edge technologies and integrating 3D technologies to boost growth
    ARGENTINA
    - Rising demand for integrating 3D imaging to spur technological growth across sectors
    REST OF LATIN AMERICA
COMPETITIVE LANDSCAPE
207
  • 10.1 OVERVIEW
  • 10.2 KEY PLAYER STRATEGIES
  • 10.3 REVENUE ANALYSIS
  • 10.4 MARKET SHARE ANALYSIS
  • 10.5 BRAND/PRODUCT COMPARATIVE ANALYSIS
  • 10.6 COMPANY EVALUATION MATRIX
    STARS
    EMERGING LEADERS
    PERVASIVE PLAYERS
    PARTICIPANTS
    COMPANY FOOTPRINT
  • 10.7 STARTUP/SME EVALUATION MATRIX
    PROGRESSIVE COMPANIES
    RESPONSIVE COMPANIES
    DYNAMIC COMPANIES
    STARTING BLOCKS
    COMPETITIVE BENCHMARKING
  • 10.8 COMPETITIVE SCENARIO AND TRENDS
    PRODUCT LAUNCHES & ENHANCEMENTS
    DEALS
  • 10.9 VALUATION AND FINANCIAL METRICS OF KEY VENDORS
COMPANY PROFILES
237
  • 11.1 INTRODUCTION
  • 11.2 KEY PLAYERS
    GE HEALTHCARE
    - Business overview
    - Products/Solutions/Services offered
    - Recent developments
    - MnM view
    AUTODESK
    - Business overview
    - Products/Solutions/Services offered
    - Recent developments
    - MnM view
    STMICROELECTRONICS
    - Business overview
    - Products/Solutions/Services offered
    - Recent developments
    - MnM view
    PANASONIC
    - Business overview
    - Products/Solutions/Services offered
    - Recent developments
    - MnM view
    SONY
    - Business overview
    - Products/Solutions/Services offered
    - Recent developments
    - MnM view
    TRIMBLE
    - Business overview
    - Products/Solutions/Services offered
    - Recent developments
    FARO
    - Business overview
    - Products/Solutions/Services offered
    - Recent developments
    PHILIPS
    - Business overview
    - Products/Solutions/Services offered
    - Recent developments
    GOOGLE
    - Business overview
    - Products/Solutions/Services offered
    - Recent developments
    ADOBE
    - Business overview
    - Products/Solutions/Services offered
    - Recent developments
    HP
    - Business overview
    - Products/Solutions/Services offered
    - Recent developments
    DASSAULT SYSTEMES
    - Business overview
    - Products/Solutions/Services offered
    - Recent developments
    BENTLEY SYSTEMS
    - Business overview
    - Products/Solutions/Services offered
    - Recent developments
  • 11.3 OTHER KEY PLAYERS
    LOCKHEED MARTIN
    ESRI
    TOPCON
    ABLE SOFTWARE
  • 11.4 STARTUPS/SMES
    MAXON
    ESRI
    ARCHILOGIC
    PIX4D
    BRAINKEY
    PRECISMO
    KAARTA
    LIGTHCODE PHOTONICS
    VZENSE TECHNOLOGY
    CAPOOM
    ATOMONTAGE
    HIVEMAPPER
    SHAPR3D
    INNERSIGHT
ADJACENT & RELATED MARKETS
304
  • 12.1 INTRODUCTION
  • 12.2 3D MAPPING AND MODELING MARKET
    MARKET DEFINITION
    MARKET OVERVIEW
    - 3D mapping and modeling market, by offering
    - 3D mapping and modeling market, by deployment mode
    - 3D mapping and modeling market, by technology
    - 3D mapping and modeling market, by vertical
    - 3D mapping and modeling market, by region
  • 12.3 3D ANIMATION MARKET
    MARKET DEFINITION
    MARKET OVERVIEW
    - 3D animation market, by component
    - 3D animation market, by technology
    - 3D animation market, by vertical
    - 3D animation market, by region
APPENDIX
312
  • 13.1 DISCUSSION GUIDE
  • 13.2 KNOWLEDGESTORE: MARKETSANDMARKETS’ SUBSCRIPTION PORTAL
  • 13.3 CUSTOMIZATION OPTIONS
  • 13.4 RELATED REPORTS
  • 13.5 AUTHOR DETAILS
LIST OF TABLES
 
  • TABLE 1 USD EXCHANGE RATES, 2020–2022
  • TABLE 2 FACTOR ANALYSIS
  • TABLE 3 GLOBAL 3D IMAGING MARKET AND GROWTH RATE, 2018–2022 (USD MILLION, Y-O-Y GROWTH)
  • TABLE 4 GLOBAL MARKET AND GROWTH RATE, 2023–2028 (USD MILLION, Y-O-Y GROWTH)
  • TABLE 5 TARIFF RELATED TO MARKET, 2022
  • TABLE 6 NORTH AMERICA: LIST OF REGULATORY BODIES, GOVERNMENT AGENCIES, AND OTHER ORGANIZATIONS
  • TABLE 7 EUROPE: LIST OF REGULATORY BODIES, GOVERNMENT AGENCIES, AND OTHER ORGANIZATIONS
  • TABLE 8 ASIA PACIFIC: LIST OF REGULATORY BODIES, GOVERNMENT AGENCIES, AND OTHER ORGANIZATIONS
  • TABLE 9 MIDDLE EAST & AFRICA: LIST OF REGULATORY BODIES, GOVERNMENT AGENCIES, AND OTHER ORGANIZATIONS
  • TABLE 10 LATIN AMERICA: LIST OF REGULATORY BODIES, GOVERNMENT AGENCIES, AND OTHER ORGANIZATIONS
  • TABLE 11 ROLE OF PLAYERS IN MARKET ECOSYSTEM
  • TABLE 12 INDICATIVE PRICING LEVELS OF 3D IMAGING SOFTWARE
  • TABLE 13 PATENTS FILED, 2013–2023
  • TABLE 14 TOP 20 PATENT OWNERS IN MARKET, 2013–2023
  • TABLE 15 LIST OF PATENTS ISSUED IN MARKET, 2021–2022
  • TABLE 16 DETAILED LIST OF KEY CONFERENCES & EVENTS, 2023–2024
  • TABLE 17 INFLUENCE OF STAKEHOLDERS ON BUYING PROCESS FOR TOP 3 VERTICALS
  • TABLE 18 KEY BUYING CRITERIA FOR TOP 3 VERTICALS
  • TABLE 19 MARKET ROADMAP, 2023–2030
  • TABLE 20 BEST PRACTICES IN MARKET
  • TABLE 21 MARKET, BY COMPONENT, 2018–2022 (USD MILLION)
  • TABLE 22 MARKET, BY COMPONENT, 2023–2028 (USD MILLION)
  • TABLE 23 HARDWARE MARKET, BY REGION, 2018–2022 (USD MILLION)
  • TABLE 24 HARDWARE MARKET, BY REGION, 2023–2028 (USD MILLION)
  • TABLE 25 MARKET, BY HARDWARE, 2018–2022 (USD MILLION)
  • TABLE 26 MARKET, BY HARDWARE, 2023–2028 (USD MILLION)
  • TABLE 27 3D CAMERAS 3D IMAGING MARKET, BY REGION, 2018–2022 (USD MILLION)
  • TABLE 28 3D CAMERAS 3D IMAGING MARKET, BY REGION, 2023–2028 (USD MILLION)
  • TABLE 29 3D SCANNERS 3D IMAGING MARKET, BY REGION, 2018–2022 (USD MILLION)
  • TABLE 30 3D SCANNERS 3D IMAGING MARKET, BY REGION, 2023–2028 (USD MILLION)
  • TABLE 31 3D SENSORS 3D IMAGING MARKET, BY REGION, 2018–2022 (USD MILLION)
  • TABLE 32 3D SENSORS 3D IMAGING MARKET, BY REGION, 2023–2028 (USD MILLION)
  • TABLE 33 3D DISPLAY MARKET, BY REGION, 2018–2022 (USD MILLION)
  • TABLE 34 3D DISPLAY MARKET, BY REGION, 2023–2028 (USD MILLION)
  • TABLE 35 MARKET, BY SOFTWARE, 2018–2022 (USD MILLION)
  • TABLE 36 MARKET, BY SOFTWARE, 2023–2028 (USD MILLION)
  • TABLE 37 3D MODELING SOFTWARE MARKET, BY REGION, 2018–2022 (USD MILLION)
  • TABLE 38 3D MODELING SOFTWARE MARKET, BY REGION, 2023–2028 (USD MILLION)
  • TABLE 39 3D SCANNING SOFTWARE MARKET, BY REGION, 2018–2022 (USD MILLION)
  • TABLE 40 3D SCANNING SOFTWARE MARKET, BY REGION, 2023–2028 (USD MILLION)
  • TABLE 41 3D LAYOUT & ANIMATION SOFTWARE MARKET, BY REGION, 2018–2022 (USD MILLION)
  • TABLE 42 3D LAYOUT & ANIMATION SOFTWARE MARKET, BY REGION, 2023–2028 (USD MILLION)
  • TABLE 43 3D VISUALIZATION & RENDERING SOFTWARE MARKET, BY REGION, 2018–2022 (USD MILLION)
  • TABLE 44 3D VISUALIZATION & RENDERING SOFTWARE MARKET, BY REGION, 2023–2028 (USD MILLION)
  • TABLE 45 IMAGE RECONSTRUCTION SOFTWARE MARKET, BY REGION, 2018–2022 (USD MILLION)
  • TABLE 46 IMAGE RECONSTRUCTION SOFTWARE MARKET, BY REGION, 2023–2028 (USD MILLION)
  • TABLE 47 3D IMAGING SOFTWARE MARKET, BY DEPLOYMENT MODE, 2018–2022 (USD MILLION)
  • TABLE 48 3D IMAGING SOFTWARE MARKET, BY DEPLOYMENT MODE, 2023–2028 (USD MILLION)
  • TABLE 49 ON-PREMISES: 3D IMAGING SOFTWARE MARKET, BY REGION, 2018–2022 (USD MILLION)
  • TABLE 50 ON-PREMISES: 3D IMAGING SOFTWARE MARKET, BY REGION, 2023–2028 (USD MILLION)
  • TABLE 51 CLOUD: 3D IMAGING SOFTWARE MARKET, BY REGION, 2018–2022 (USD MILLION)
  • TABLE 52 CLOUD: 3D IMAGING SOFTWARE MARKET, BY REGION, 2023–2028 (USD MILLION)
  • TABLE 53 3D IMAGING MARKET, BY SERVICE, 2018–2022 (USD MILLION)
  • TABLE 54 3D IMAGING MARKET, BY SERVICE, 2023–2028 (USD MILLION)
  • TABLE 55 SERVICES: 3D IMAGING MARKET, BY REGION, 2018–2022 (USD MILLION)
  • TABLE 56 SERVICES: 3D IMAGING MARKET, BY REGION, 2023–2028 (USD MILLION)
  • TABLE 57 3D IMAGING MARKET, BY PROFESSIONAL SERVICE, 2018–2022 (USD MILLION)
  • TABLE 58 3D IMAGING MARKET, BY PROFESSIONAL SERVICE, 2023–2028 (USD MILLION)
  • TABLE 59 PROFESSIONAL SERVICES 3D IMAGING MARKET, BY REGION, 2018–2022 (USD MILLION)
  • TABLE 60 PROFESSIONAL SERVICES 3D IMAGING MARKET, BY REGION, 2023–2028 (USD MILLION)
  • TABLE 61 CONSULTING SERVICES 3D IMAGING MARKET, BY REGION, 2018–2022 (USD MILLION)
  • TABLE 62 CONSULTING SERVICES 3D IMAGING MARKET, BY REGION, 2023–2028 (USD MILLION)
  • TABLE 63 DEPLOYMENT & INTEGRATION 3D IMAGING MARKET, BY REGION, 2018–2022 (USD MILLION)
  • TABLE 64 DEPLOYMENT & INTEGRATION MARKET, BY REGION, 2023–2028 (USD MILLION)
  • TABLE 65 SUPPORT & MAINTENANCE MARKET, BY REGION, 2018–2022 (USD MILLION)
  • TABLE 66 SUPPORT & MAINTENANCE MARKET, BY REGION, 2023–2028 (USD MILLION)
  • TABLE 67 MANAGED SERVICES MARKET, BY REGION, 2018–2022 (USD MILLION)
  • TABLE 68 MANAGED SERVICES MARKET, BY REGION, 2023–2028 (USD MILLION)
  • TABLE 69 MARKET, BY TECHNOLOGY, 2018–2022 (USD MILLION)
  • TABLE 70 MARKET, BY TECHNOLOGY, 2023–2028 (USD MILLION)
  • TABLE 71 STEREOSCOPIC IMAGING MARKET, BY REGION, 2018–2022 (USD MILLION)
  • TABLE 72 STEREOSCOPIC IMAGING MARKET, BY REGION, 2023–2028 (USD MILLION)
  • TABLE 73 STRUCTURED LIGHT IMAGING MARKET, BY REGION, 2018–2022 (USD MILLION)
  • TABLE 74 STRUCTURED LIGHT IMAGING MARKET, BY REGION, 2023–2028 (USD MILLION)
  • TABLE 75 LASER-BASED IMAGING MARKET, BY REGION, 2018–2022 (USD MILLION)
  • TABLE 76 LASER-BASED IMAGING MARKET, BY REGION, 2023–2028 (USD MILLION)
  • TABLE 77 HOLOGRAPHIC IMAGING MARKET, BY REGION, 2018–2022 (USD MILLION)
  • TABLE 78 HOLOGRAPHIC IMAGING MARKET, BY REGION, 2023–2028 (USD MILLION)
  • TABLE 79 TIME-OF-FLIGHT IMAGING MARKET, BY REGION, 2018–2022 (USD MILLION)
  • TABLE 80 TIME-OF-FLIGHT IMAGING MARKET, BY REGION, 2023–2028 (USD MILLION)
  • TABLE 81 MARKET, BY VERTICAL, 2018–2022 (USD MILLION)
  • TABLE 82 MARKET, BY VERTICAL, 2023–2028 (USD MILLION)
  • TABLE 83 AEROSPACE & DEFENSE: MARKET, BY REGION, 2018–2022 (USD MILLION)
  • TABLE 84 AEROSPACE & DEFENSE: MARKET, BY REGION, 2023–2028 (USD MILLION)
  • TABLE 85 AUTOMOTIVE: MARKET, BY REGION, 2018–2022 (USD MILLION)
  • TABLE 86 AUTOMOTIVE: MARKET, BY REGION, 2023–2028 (USD MILLION)
  • TABLE 87 MANUFACTURING: 3D IMAGING MARKET, BY REGION, 2018–2022 (USD MILLION)
  • TABLE 88 MANUFACTURING: MARKET, BY REGION, 2023–2028 (USD MILLION)
  • TABLE 89 HEALTHCARE & LIFE SCIENCES: MARKET, BY REGION, 2018–2022 (USD MILLION)
  • TABLE 90 HEALTHCARE & LIFE SCIENCES: MARKET, BY REGION, 2023–2028 (USD MILLION)
  • TABLE 91 ARCHITECTURE & CONSTRUCTION: MARKET, BY REGION, 2018–2022 (USD MILLION)
  • TABLE 92 ARCHITECTURE & CONSTRUCTION: MARKET, BY REGION, 2023–2028 (USD MILLION)
  • TABLE 93 MEDIA & ENTERTAINMENT: MARKET, BY REGION, 2018–2022 (USD MILLION)
  • TABLE 94 MEDIA & ENTERTAINMENT: MARKET, BY REGION, 2023–2028 (USD MILLION)
  • TABLE 95 RETAIL & ECOMMERCE: MARKET, BY REGION, 2018–2022 (USD MILLION)
  • TABLE 96 RETAIL & ECOMMERCE: MARKET, BY REGION, 2023–2028 (USD MILLION)
  • TABLE 97 GOVERNMENT: MARKET, BY REGION, 2018–2022 (USD MILLION)
  • TABLE 98 GOVERNMENT: MARKET, BY REGION, 2023–2028 (USD MILLION)
  • TABLE 99 ENERGY & UTILITIES: MARKET, BY REGION, 2018–2022 (USD MILLION)
  • TABLE 100 ENERGY & UTILITIES: MARKET, BY REGION, 2023–2028 (USD MILLION)
  • TABLE 101 OTHER VERTICALS: MARKET, BY REGION, 2018–2022 (USD MILLION)
  • TABLE 102 OTHER VERTICALS: MARKET, BY REGION, 2023–2028 (USD MILLION)
  • TABLE 103 MARKET, BY REGION, 2018–2022 (USD MILLION)
  • TABLE 104 MARKET, BY REGION, 2023–2028 (USD MILLION)
  • TABLE 105 NORTH AMERICA: MARKET, BY COMPONENT, 2018–2022 (USD MILLION)
  • TABLE 106 NORTH AMERICA: MARKET, BY COMPONENT, 2023–2028 (USD MILLION)
  • TABLE 107 NORTH AMERICA: 3D IMAGING MARKET, BY HARDWARE, 2018–2022 (USD MILLION)
  • TABLE 108 NORTH AMERICA: MARKET, BY HARDWARE, 2023–2028 (USD MILLION)
  • TABLE 109 NORTH AMERICA: MARKET, BY SOFTWARE, 2018–2022 (USD MILLION)
  • TABLE 110 NORTH AMERICA: MARKET, BY SOFTWARE, 2023–2028 (USD MILLION)
  • TABLE 111 NORTH AMERICA: 3D IMAGING SOFTWARE MARKET, BY DEPLOYMENT MODE, 2018–2022 (USD MILLION)
  • TABLE 112 NORTH AMERICA: 3D IMAGING SOFTWARE MARKET, BY DEPLOYMENT MODE, 2023–2028 (USD MILLION)
  • TABLE 113 NORTH AMERICA: MARKET, BY SERVICE, 2018–2022 (USD MILLION)
  • TABLE 114 NORTH AMERICA: MARKET, BY SERVICE, 2023–2028 (USD MILLION)
  • TABLE 115 NORTH AMERICA: MARKET, BY PROFESSIONAL SERVICE, 2018–2022 (USD MILLION)
  • TABLE 116 NORTH AMERICA: MARKET, BY PROFESSIONAL SERVICE, 2023–2028 (USD MILLION)
  • TABLE 117 NORTH AMERICA: MARKET, BY TECHNOLOGY, 2018–2022 (USD MILLION)
  • TABLE 118 NORTH AMERICA: MARKET, BY TECHNOLOGY, 2023–2028 (USD MILLION)
  • TABLE 119 NORTH AMERICA: MARKET, BY VERTICAL, 2018–2022 (USD MILLION)
  • TABLE 120 NORTH AMERICA: MARKET, BY VERTICAL, 2023–2028 (USD MILLION)
  • TABLE 121 NORTH AMERICA: MARKET, BY COUNTRY, 2018–2022 (USD MILLION)
  • TABLE 122 NORTH AMERICA: MARKET, BY COUNTRY, 2023–2028 (USD MILLION)
  • TABLE 123 US: MARKET, BY COMPONENT, 2018–2022 (USD MILLION)
  • TABLE 124 US: MARKET, BY COMPONENT, 2023–2028 (USD MILLION)
  • TABLE 125 US: MARKET, BY SERVICE, 2018–2022 (USD MILLION)
  • TABLE 126 US: MARKET, BY SERVICE, 2023–2028 (USD MILLION)
  • TABLE 127 EUROPE: MARKET, BY COMPONENT, 2018–2022 (USD MILLION)
  • TABLE 128 EUROPE: 3D IMAGING MARKET, BY COMPONENT, 2023–2028 (USD MILLION)
  • TABLE 129 EUROPE: MARKET, BY HARDWARE, 2018–2022 (USD MILLION)
  • TABLE 130 EUROPE: MARKET, BY HARDWARE, 2023–2028 (USD MILLION)
  • TABLE 131 EUROPE: MARKET, BY SOFTWARE, 2018–2022 (USD MILLION)
  • TABLE 132 EUROPE: MARKET, BY SOFTWARE, 2023–2028 (USD MILLION)
  • TABLE 133 EUROPE: 3D IMAGING SOFTWARE MARKET, BY DEPLOYMENT MODE, 2018–2022 (USD MILLION)
  • TABLE 134 EUROPE: 3D IMAGING SOFTWARE MARKET, BY DEPLOYMENT MODE, 2023–2028 (USD MILLION)
  • TABLE 135 EUROPE: MARKET, BY SERVICE, 2018–2022 (USD MILLION)
  • TABLE 136 EUROPE: MARKET, BY SERVICE, 2023–2028 (USD MILLION)
  • TABLE 137 EUROPE: MARKET, BY PROFESSIONAL SERVICE, 2018–2022 (USD MILLION)
  • TABLE 138 EUROPE: MARKET, BY PROFESSIONAL SERVICE, 2023–2028 (USD MILLION)
  • TABLE 139 EUROPE: MARKET, BY TECHNOLOGY, 2018–2022 (USD MILLION)
  • TABLE 140 EUROPE: MARKET, BY TECHNOLOGY, 2023–2028 (USD MILLION)
  • TABLE 141 EUROPE: MARKET, BY VERTICAL, 2018–2022 (USD MILLION)
  • TABLE 142 EUROPE: MARKET, BY VERTICAL, 2023–2028 (USD MILLION)
  • TABLE 143 EUROPE: 3D IMAGING MARKET, BY COUNTRY, 2018–2022 (USD MILLION)
  • TABLE 144 EUROPE: MARKET, BY COUNTRY, 2023–2028 (USD MILLION)
  • TABLE 145 UK: MARKET, BY COMPONENT, 2018–2022 (USD MILLION)
  • TABLE 146 UK: MARKET, BY COMPONENT, 2023–2028 (USD MILLION)
  • TABLE 147 UK: MARKET, BY SERVICE, 2018–2022 (USD MILLION)
  • TABLE 148 UK: MARKET, BY SERVICE, 2023–2028 (USD MILLION)
  • TABLE 149 ASIA PACIFIC: MARKET, BY COMPONENT, 2018–2022 (USD MILLION)
  • TABLE 150 ASIA PACIFIC: MARKET, BY COMPONENT, 2023–2028 (USD MILLION)
  • TABLE 151 ASIA PACIFIC: MARKET, BY HARDWARE, 2018–2022 (USD MILLION)
  • TABLE 152 ASIA PACIFIC: MARKET, BY HARDWARE, 2023–2028 (USD MILLION)
  • TABLE 153 ASIA PACIFIC: MARKET, BY SOFTWARE, 2018–2022 (USD MILLION)
  • TABLE 154 ASIA PACIFIC: MARKET, BY SOFTWARE, 2023–2028 (USD MILLION)
  • TABLE 155 ASIA PACIFIC: 3D IMAGING SOFTWARE MARKET, BY DEPLOYMENT MODE, 2018–2022 (USD MILLION)
  • TABLE 156 ASIA PACIFIC: 3D IMAGING SOFTWARE MARKET, BY DEPLOYMENT MODE, 2023–2028 (USD MILLION)
  • TABLE 157 ASIA PACIFIC: MARKET, BY SERVICE, 2018–2022 (USD MILLION)
  • TABLE 158 ASIA PACIFIC: MARKET, BY SERVICE, 2023–2028 (USD MILLION)
  • TABLE 159 ASIA PACIFIC: MARKET, BY PROFESSIONAL SERVICE, 2018–2022 (USD MILLION)
  • TABLE 160 ASIA PACIFIC: 3D IMAGING MARKET, BY PROFESSIONAL SERVICE, 2023–2028 (USD MILLION)
  • TABLE 161 ASIA PACIFIC: MARKET, BY TECHNOLOGY, 2018–2022 (USD MILLION)
  • TABLE 162 ASIA PACIFIC: MARKET, BY TECHNOLOGY, 2023–2028 (USD MILLION)
  • TABLE 163 ASIA PACIFIC: MARKET, BY VERTICAL, 2018–2022 (USD MILLION)
  • TABLE 164 ASIA PACIFIC: MARKET, BY VERTICAL, 2023–2028 (USD MILLION)
  • TABLE 165 ASIA PACIFIC: MARKET, BY COUNTRY, 2018–2022 (USD MILLION)
  • TABLE 166 ASIA PACIFIC: MARKET, BY COUNTRY, 2023–2028 (USD MILLION)
  • TABLE 167 CHINA: MARKET, BY COMPONENT, 2018–2022 (USD MILLION)
  • TABLE 168 CHINA: MARKET, BY COMPONENT, 2023–2028 (USD MILLION)
  • TABLE 169 CHINA: MARKET, BY SERVICE, 2018–2022 (USD MILLION)
  • TABLE 170 CHINA: MARKET, BY SERVICE, 2023–2028 (USD MILLION)
  • TABLE 171 MIDDLE EAST & AFRICA: MARKET, BY COMPONENT, 2018–2022 (USD MILLION)
  • TABLE 172 MIDDLE EAST & AFRICA: MARKET, BY COMPONENT, 2023–2028 (USD MILLION)
  • TABLE 173 MIDDLE EAST & AFRICA: MARKET, BY HARDWARE, 2018–2022 (USD MILLION)
  • TABLE 174 MIDDLE EAST & AFRICA: MARKET, BY HARDWARE, 2023–2028 (USD MILLION)
  • TABLE 175 MIDDLE EAST & AFRICA: MARKET, BY SOFTWARE, 2018–2022 (USD MILLION)
  • TABLE 176 MIDDLE EAST & AFRICA: MARKET, BY SOFTWARE, 2023–2028 (USD MILLION)
  • TABLE 177 MIDDLE EAST & AFRICA: 3D IMAGING SOFTWARE MARKET, BY DEPLOYMENT MODE, 2018–2022 (USD MILLION)
  • TABLE 178 MIDDLE EAST & AFRICA: 3D IMAGING SOFTWARE MARKET, BY DEPLOYMENT MODE, 2023–2028 (USD MILLION)
  • TABLE 179 MIDDLE EAST & AFRICA: MARKET, BY SERVICE, 2018–2022 (USD MILLION)
  • TABLE 180 MIDDLE EAST & AFRICA: MARKET, BY SERVICE, 2023–2028 (USD MILLION)
  • TABLE 181 MIDDLE EAST & AFRICA: 3D IMAGING MARKET, BY PROFESSIONAL SERVICE, 2018–2022 (USD MILLION)
  • TABLE 182 MIDDLE EAST & AFRICA: MARKET, BY PROFESSIONAL SERVICE, 2023–2028 (USD MILLION)
  • TABLE 183 MIDDLE EAST & AFRICA: MARKET, BY TECHNOLOGY, 2018–2022 (USD MILLION)
  • TABLE 184 MIDDLE EAST & AFRICA: MARKET, BY TECHNOLOGY, 2023–2028 (USD MILLION)
  • TABLE 185 MIDDLE EAST & AFRICA: MARKET, BY VERTICAL, 2018–2022 (USD MILLION)
  • TABLE 186 MIDDLE EAST & AFRICA: MARKET, BY VERTICAL, 2023–2028 (USD MILLION)
  • TABLE 187 MIDDLE EAST & AFRICA: MARKET, BY COUNTRY, 2018–2022 (USD MILLION)
  • TABLE 188 MIDDLE EAST & AFRICA: MARKET, BY COUNTRY, 2023–2028 (USD MILLION)
  • TABLE 189 LATIN AMERICA: MARKET, BY COMPONENT, 2018–2022 (USD MILLION)
  • TABLE 190 LATIN AMERICA: MARKET, BY COMPONENT, 2023–2028 (USD MILLION)
  • TABLE 191 LATIN AMERICA: MARKET, BY HARDWARE, 2018–2022 (USD MILLION)
  • TABLE 192 LATIN AMERICA: MARKET, BY HARDWARE, 2023–2028 (USD MILLION)
  • TABLE 193 LATIN AMERICA: MARKET, BY SOFTWARE, 2018–2022 (USD MILLION)
  • TABLE 194 LATIN AMERICA: MARKET, BY SOFTWARE, 2023–2028 (USD MILLION)
  • TABLE 195 LATIN AMERICA: 3D IMAGING SOFTWARE MARKET, BY DEPLOYMENT MODE, 2018–2022 (USD MILLION)
  • TABLE 196 LATIN AMERICA: 3D IMAGING SOFTWARE MARKET, BY DEPLOYMENT MODE, 2023–2028 (USD MILLION)
  • TABLE 197 LATIN AMERICA: MARKET, BY SERVICE, 2018–2022 (USD MILLION)
  • TABLE 198 LATIN AMERICA: MARKET, BY SERVICE, 2023–2028 (USD MILLION)
  • TABLE 199 LATIN AMERICA: MARKET, BY PROFESSIONAL SERVICE, 2018–2022 (USD MILLION)
  • TABLE 200 LATIN AMERICA: MARKET, BY PROFESSIONAL SERVICE, 2023–2028 (USD MILLION)
  • TABLE 201 LATIN AMERICA: MARKET, BY TECHNOLOGY, 2018–2022 (USD MILLION)
  • TABLE 202 LATIN AMERICA: MARKET, BY TECHNOLOGY, 2023–2028 (USD MILLION)
  • TABLE 203 LATIN AMERICA: MARKET, BY VERTICAL, 2018–2022 (USD MILLION)
  • TABLE 204 LATIN AMERICA: MARKET, BY VERTICAL, 2023–2028 (USD MILLION)
  • TABLE 205 LATIN AMERICA: MARKET, BY COUNTRY, 2018–2022 (USD MILLION)
  • TABLE 206 LATIN AMERICA: MARKET, BY COUNTRY, 2023–2028 (USD MILLION)
  • TABLE 207 OVERVIEW OF STRATEGIES ADOPTED BY KEY 3D IMAGING VENDORS
  • TABLE 208 3D IMAGING MARKET: INTENSITY OF COMPETITIVE RIVALRY
  • TABLE 209 COMPONENT FOOTPRINT (17 COMPANIES)
  • TABLE 210 VERTICAL FOOTPRINT (17 COMPANIES)
  • TABLE 211 REGIONAL FOOTPRINT (17 COMPANIES)
  • TABLE 212 COMPANY FOOTPRINT (17 COMPANIES)
  • TABLE 213 MARKET: DETAILED LIST OF KEY STARTUPS/SMES
  • TABLE 214 MARKET: COMPETITIVE BENCHMARKING OF STARTUPS/SMES, 2022
  • TABLE 215 MARKET: PRODUCT LAUNCHES & ENHANCEMENTS, JULY 2019–NOVEMBER 2023
  • TABLE 216 MARKET: DEALS, JANUARY 2019–NOVEMBER 2023
  • TABLE 217 GE HEALTHCARE: BUSINESS OVERVIEW
  • TABLE 218 GE HEALTHCARE: PRODUCTS/SOLUTIONS/SERVICES OFFERED
  • TABLE 219 GE HEALTHCARE: PRODUCT LAUNCHES & ENHANCEMENTS
  • TABLE 220 GE HEALTHCARE: DEALS
  • TABLE 221 GE HEALTHCARE: OTHERS
  • TABLE 222 AUTODESK: BUSINESS OVERVIEW
  • TABLE 223 AUTODESK: PRODUCTS/SOLUTIONS/SERVICES OFFERED
  • TABLE 224 AUTODESK: PRODUCT LAUNCHES & ENHANCEMENTS
  • TABLE 225 AUTODESK: DEALS
  • TABLE 226 STMICROELECTRONICS: BUSINESS OVERVIEW
  • TABLE 227 STMICROELECTRONICS: PRODUCTS/SOLUTIONS/SERVICES OFFERED
  • TABLE 228 STMICROELECTRONICS: PRODUCT LAUNCHES & ENHANCEMENTS
  • TABLE 229 STMICROELECTRONICS: DEALS
  • TABLE 230 PANASONIC: BUSINESS OVERVIEW
  • TABLE 231 PANASONIC: PRODUCTS/SOLUTIONS/SERVICES OFFERED
  • TABLE 232 PANASONIC: PRODUCT LAUNCHES & ENHANCEMENTS
  • TABLE 233 PANASONIC: DEALS
  • TABLE 234 SONY: BUSINESS OVERVIEW
  • TABLE 235 SONY: PRODUCTS/SOLUTIONS/SERVICES OFFERED
  • TABLE 236 SONY: PRODUCT LAUNCHES & ENHANCEMENTS
  • TABLE 237 SONY: DEALS
  • TABLE 238 TRIMBLE: BUSINESS OVERVIEW
  • TABLE 239 TRIMBLE: PRODUCTS/SOLUTIONS/SERVICES OFFERED
  • TABLE 240 TRIMBLE: PRODUCT LAUNCHES & ENHANCEMENTS
  • TABLE 241 FARO: BUSINESS OVERVIEW
  • TABLE 242 FARO: PRODUCTS/SOLUTIONS/SERVICES OFFERED
  • TABLE 243 FARO: PRODUCT LAUNCHES & ENHANCEMENTS
  • TABLE 244 FARO: DEALS
  • TABLE 245 PHILIPS: BUSINESS OVERVIEW
  • TABLE 246 PHILIPS: PRODUCTS/SOLUTIONS/SERVICES OFFERED
  • TABLE 247 PHILIPS: PRODUCT LAUNCHES & ENHANCEMENTS
  • TABLE 248 GOOGLE: BUSINESS OVERVIEW
  • TABLE 249 GOOGLE: PRODUCTS/SOLUTIONS/SERVICES OFFERED
  • TABLE 250 GOOGLE: PRODUCT LAUNCHES & ENHANCEMENTS
  • TABLE 251 GOOGLE: DEALS
  • TABLE 252 ADOBE: BUSINESS OVERVIEW
  • TABLE 253 ADOBE: PRODUCTS/SOLUTIONS/SERVICES OFFERED
  • TABLE 254 ADOBE: PRODUCT LAUNCHES & ENHANCEMENTS
  • TABLE 255 ADOBE: DEALS
  • TABLE 256 HP: BUSINESS OVERVIEW
  • TABLE 257 HP: PRODUCTS/SOLUTIONS/SERVICES OFFERED
  • TABLE 258 HP: DEALS
  • TABLE 259 DASSAULT SYSTEMES: BUSINESS OVERVIEW
  • TABLE 260 DASSAULT SYSTEMES: PRODUCTS/SOLUTIONS/SERVICES OFFERED
  • TABLE 261 DASSAULT SYSTEMES: PRODUCT LAUNCHES & ENHANCEMENTS
  • TABLE 262 DASSAULT SYSTEMES: DEALS
  • TABLE 263 BENTLEY SYSTEMS: COMPANY OVERVIEW
  • TABLE 264 BENTLEY SYSTEMS: PRODUCTS/SOLUTIONS/SERVICES OFFERED
  • TABLE 265 BENTLEY SYSTEMS: PRODUCT LAUNCHES & ENHANCEMENTS
  • TABLE 266 BENTLEY SYSTEMS: DEALS
  • TABLE 267 3D MAPPING AND MODELING MARKET, BY OFFERING, 2017–2022 (USD MILLION)
  • TABLE 268 3D MAPPING AND MODELING MARKET, BY OFFERING, 2023–2028 (USD MILLION)
  • TABLE 269 3D MAPPING AND MODELING MARKET, BY DEPLOYMENT MODE, 2017–2022 (USD MILLION)
  • TABLE 270 3D MAPPING AND MODELING MARKET, BY DEPLOYMENT MODE, 2023–2028 (USD MILLION)
  • TABLE 271 3D MAPPING AND MODELING MARKET, BY TECHNOLOGY, 2017–2022 (USD MILLION)
  • TABLE 272 3D MAPPING AND MODELING MARKET, BY TECHNOLOGY, 2023–2028 (USD MILLION)
  • TABLE 273 3D MAPPING AND MODELING MARKET, BY VERTICAL, 2017–2022 (USD MILLION)
  • TABLE 274 3D MAPPING AND MODELING MARKET, BY VERTICAL, 2023–2028 (USD MILLION)
  • TABLE 275 3D MAPPING AND MODELING MARKET, BY REGION, 2017–2022 (USD MILLION)
  • TABLE 276 3D MAPPING AND MODELING MARKET, BY REGION, 2023–2028 (USD MILLION)
  • TABLE 277 3D ANIMATION MARKET, BY COMPONENT, 2015–2022 (USD MILLION)
  • TABLE 278 3D ANIMATION MARKET, BY TECHNOLOGY, 2015–2022 (USD MILLION)
  • TABLE 279 3D ANIMATION MARKET, BY VERTICAL, 2015–2022 (USD MILLION)
  • TABLE 280 3D ANIMATION MARKET, BY REGION, 2015–2022 (USD MILLION)
LIST OF FIGURES
 
  • FIGURE 1 MARKET: RESEARCH DESIGN
  • FIGURE 2 DATA TRIANGULATION
  • FIGURE 3 3D IMAGING MARKET: TOP-DOWN AND BOTTOM-UP APPROACHES
  • FIGURE 4 MARKET SIZE ESTIMATION METHODOLOGY – APPROACH 1 (SUPPLY SIDE): REVENUE OF HARDWARE/SOFTWARE/SERVICES OF 3D IMAGING MARKET
  • FIGURE 5 MARKET SIZE ESTIMATION METHODOLOGY – APPROACH 2, BOTTOM-UP (SUPPLY SIDE): COLLECTIVE REVENUE OF ALL HARDWARE/SOFTWARE/ SERVICES OF 3D IMAGING MARKET
  • FIGURE 6 MARKET SIZE ESTIMATION METHODOLOGY – APPROACH 3, TOP-DOWN (DEMAND SIDE): SHARE OF 3D IMAGING SOFTWARE THROUGH OVERALL 3D IMAGING SPENDING
  • FIGURE 7 MARKET SIZE ESTIMATION METHODOLOGY: APPROACH 4, BOTTOM-UP (DEMAND SIDE)
  • FIGURE 8 HARDWARE SEGMENT TO BE DOMINANT MARKET IN 2023
  • FIGURE 9 3D DISPLAY SEGMENT TO LEAD MARKET IN 2023
  • FIGURE 10 3D MODELING SOFTWARE SEGMENT TO LEAD MARKET IN 2023
  • FIGURE 11 STRUCTURED LIGHT IMAGING SEGMENT TO ACCOUNT FOR LARGEST SHARE IN 2023
  • FIGURE 12 PROFESSIONAL SERVICES SEGMENT TO LEAD MARKET IN 2023
  • FIGURE 13 DEPLOYMENT & INTEGRATION SEGMENT TO ACCOUNT FOR LARGEST SHARE IN 2023
  • FIGURE 14 AUTOMOTIVE SEGMENT TO LEAD MARKET IN 2023
  • FIGURE 15 3D IMAGING MARKET SNAPSHOT: REGIONAL ANALYSIS
  • FIGURE 16 RISING DEMAND FOR 3D-ENABLED DEVICES ACROSS VERTICALS AND INCREASING URBANIZATION TO DRIVE 3D IMAGING MARKET GROWTH
  • FIGURE 17 3D IMAGING MARKET TO WITNESS MINOR DECLINE IN Y-O-Y GROWTH RATE IN 2023
  • FIGURE 18 MANUFACTURING VERTICAL TO GROW AT HIGHEST CAGR DURING FORECAST PERIOD
  • FIGURE 19 NORTH AMERICA TO ACCOUNT FOR LARGEST SHARE IN 2023
  • FIGURE 20 HARDWARE AND AUTOMOTIVE SEGMENTS TO ACCOUNT FOR SIGNIFICANT SHARE IN 2023
  • FIGURE 21 3D IMAGING MARKET: DRIVERS, RESTRAINTS, OPPORTUNITIES, AND CHALLENGES
  • FIGURE 22 IMPORT DATA FOR TELEVISION CAMERAS, DIGITAL CAMERAS, AND VIDEO CAMERA RECORDERS, BY KEY COUNTRY, 2015–2022 (USD MILLION)
  • FIGURE 23 EXPORT DATA FOR TELEVISION CAMERAS, DIGITAL CAMERAS, AND VIDEO CAMERA RECORDERS, BY KEY COUNTRY, 2015–2022 (USD MILLION)
  • FIGURE 24 EVOLUTION OF 3D IMAGING TECHNOLOGIES
  • FIGURE 25 KEY PLAYERS IN 3D IMAGING MARKET ECOSYSTEM
  • FIGURE 26 SUPPLY CHAIN ANALYSIS
  • FIGURE 27 AVERAGE SELLING PRICE TREND OF KEY PLAYERS, BY HARDWARE
  • FIGURE 28 TRENDS/DISRUPTIONS IMPACTING CUSTOMERS’ BUSINESSES
  • FIGURE 29 NUMBER OF PATENTS GRANTED, 2013–2023
  • FIGURE 30 TOP 10 PATENT APPLICANTS IN 3D IMAGING MARKET, 2013–2023
  • FIGURE 31 REGIONAL ANALYSIS OF PATENTS GRANTED, 2013–2023
  • FIGURE 32 PORTER’S FIVE FORCES ANALYSIS
  • FIGURE 33 INFLUENCE OF STAKEHOLDERS ON BUYING PROCESS FOR TOP 3 VERTICALS
  • FIGURE 34 KEY BUYING CRITERIA FOR TOP 3 VERTICALS
  • FIGURE 35 3D IMAGING TECHNIQUES
  • FIGURE 36 SERVICES SEGMENT TO GROW AT HIGHEST CAGR DURING FORECAST PERIOD
  • FIGURE 37 3D SENSORS SEGMENT TO GROW AT HIGHEST CAGR BY 2028
  • FIGURE 38 3D MODELING SOFTWARE SEGMENT TO ACCOUNT FOR LARGEST MARKET DURING FORECAST PERIOD
  • FIGURE 39 MANAGED SERVICES SEGMENT TO GROW AT HIGHER CAGR DURING FORECAST PERIOD
  • FIGURE 40 DEPLOYMENT & INTEGRATION SEGMENT TO ACCOUNT FOR LARGEST MARKET DURING FORECAST PERIOD
  • FIGURE 41 STEREOSCOPIC IMAGING SEGMENT TO ACCOUNT FOR LARGEST MARKET DURING FORECAST PERIOD
  • FIGURE 42 MANUFACTURING SEGMENT TO RECORD HIGHEST CAGR DURING FORECAST PERIOD
  • FIGURE 43 ASIA PACIFIC TO GROW AT HIGHEST CAGR DURING FORECAST PERIOD
  • FIGURE 44 INDIA TO ACHIEVE HIGHEST GROWTH DURING FORECAST PERIOD
  • FIGURE 45 NORTH AMERICAN 3D IMAGING MARKET SNAPSHOT
  • FIGURE 46 ASIA PACIFIC 3D IMAGING MARKET SNAPSHOT
  • FIGURE 47 REVENUE ANALYSIS FOR KEY PLAYERS, 2018–2022 (USD BILLION)
  • FIGURE 48 MARKET SHARE ANALYSIS, 2022
  • FIGURE 49 BRAND/PRODUCT COMPARATIVE ANALYSIS
  • FIGURE 50 COMPANY EVALUATION MATRIX, 2022
  • FIGURE 51 STARTUP/SME EVALUATION MATRIX, 2022
  • FIGURE 52 VALUATION AND FINANCIAL METRICS OF KEY VENDORS
  • FIGURE 53 YEAR-TO-DATE (YTD) PRICE TOTAL RETURN AND 5-YEAR STOCK BETA OF KEY VENDORS
  • FIGURE 54 GE HEALTHCARE: COMPANY SNAPSHOT
  • FIGURE 55 AUTODESK: COMPANY SNAPSHOT
  • FIGURE 56 STMICROELECTRONICS: COMPANY SNAPSHOT
  • FIGURE 57 PANASONIC: COMPANY SNAPSHOT
  • FIGURE 58 SONY: COMPANY SNAPSHOT
  • FIGURE 59 TRIMBLE: COMPANY SNAPSHOT
  • FIGURE 60 FARO: COMPANY SNAPSHOT
  • FIGURE 61 PHILIPS: COMPANY SNAPSHOT
  • FIGURE 62 GOOGLE: COMPANY SNAPSHOT
  • FIGURE 63 ADOBE: COMPANY SNAPSHOT
  • FIGURE 64 HP: COMPANY SNAPSHOT
  • FIGURE 65 DASSAULT SYSTEMES: COMPANY SNAPSHOT
  • FIGURE 66 BENTLEY SYSTEMS: COMPANY SNAPSHOT


The research study for the 3D imaging market involved the use of extensive secondary sources, directories, as well as several journals, such as the Journal of the American College of Radiology, Journal of Imaging Science and Technology, and the International Journal of Imaging Processing to identify and collect the information useful for the comprehensive market research study on the 3D imaging market. The primary sources were mainly industry experts from the core and related industries, preferred 3D imaging hardware and solution providers, third-party service providers, consulting service providers, end users, and other commercial enterprises. In-depth interviews were conducted with various primary respondents, including key industry participants and subject-matter experts, to obtain and verify critical qualitative and quantitative information, as well as assess the prospects.

Secondary Research

In the secondary research process, various sources were referred to, for identifying and collecting information for this study. The secondary sources included annual reports, press releases, and investor presentations of companies; white papers, journals, and certified publications; and articles from recognized authors, directories, and databases. The data was also collected from secondary sources, such as journals, and related magazines. Additionally, 3D imaging spending of various countries was extracted from the respective sources.

Secondary research was mainly used to obtain key information about the industry’s value chain and supply chain to identify the key players by various hardware, solutions, services, market classifications, and segmentations according to offerings of the major players and industry trends related to components, verticals, and regions, and key developments from both market- and technology-oriented perspectives.

Primary Research

In the primary research process, various primary sources from both supply and demand sides have been In the primary research process, various primary sources from both supply and demand sides were interviewed to obtain qualitative and quantitative information of the market. The primary sources from the supply side included various industry experts, such as Chief Experience Officers (CXOs), Vice Presidents (VPs), directors, from business development, marketing, product development/innovation teams, and related key executives from 3D imaging solution vendors, system integrators, professional service providers, industry associations, and key opinion leaders.

Primary interviews were conducted to gather insights, such as market statistics, data of revenue collected from the hardware, solutions, and services, market breakups, market size estimations, market forecasting, and data triangulation. Primary research also helped in understanding the various trends related to technology, application, deployment, and region. Stakeholders from demand side, such as Chief Information Officers (CIOs), Chief Technology Officers (CTOs), and Chief Strategy Officers (CSOs), and installation teams of the governments/end users who are using 3D imaging solutions were interviewed to understand the buyer’s perspective on the suppliers, products, service providers, and their current usage of 3D imaging hardware and solutions which would affect the overall 3D imaging market.

The following is the breakup of primary profiles:
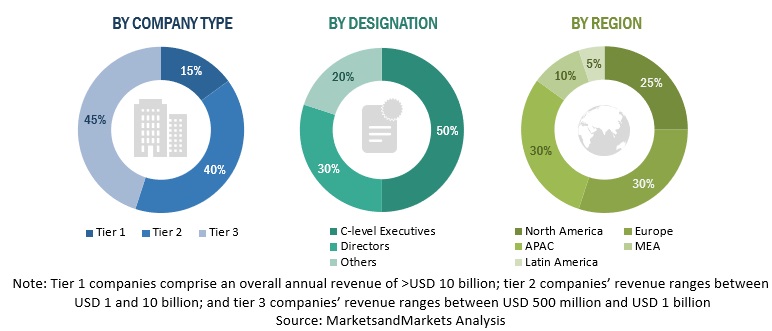
3D Imaging Market Size, and Share

To know about the assumptions considered for the study, download the pdf brochure

Market Size Estimation

For making market estimates and forecasting the 3D Imaging market and the other dependent submarkets, top-down and bottom-up approaches were used. The bottom-up procedure was used to arrive at the overall market size of the global 3D Imaging market, using the revenue from the key companies and their offerings in the market. With data triangulation and validation through primary interviews, this study determined and confirmed the exact value of the overall parent market size. The overall market size was then used in the top-down procedure to estimate the size of other individual markets via percentage splits of the market seents.

In the top-down approach, an exhaustive list of all the vendors who offer the hardware, solutions, and services in the global 3D imaging market was prepared. The revenue contribution of all the vendors in the market was estimated through annual reports, press releases, funding, investor presentations, paid databases, and primary interviews. Each vendor was evaluated based on its offerings by deployment mode, organization size, and vertical. The aggregate of all the companies’ revenue was extrapolated to reach the overall market size. Each subsegment was studied and analyzed for its global market size and regional penetration. The markets were triangulated through both primary and secondary research. The primary procedure included extensive interviews for key insights from the industry leaders, such as CEOs, VPs, directors, and marketing executives. The market numbers were further triangulated with the existing MarketsandMarkets’ repository for validation.

In the bottom-up approach, the adoption of 3D imaging hardware and solutions among different end users in key countries with respect to their regions that contribute the most to the market share was identified. For cross-validation, the adoption of 3D imaging hardware, solutions, and services among different industries, along with different use cases with respect to their regions, was identified and extrapolated. In addition, weightages have been given to use cases identified in different regions for the market size calculation.

All the possible parameters that affect the market covered in the research study have been accounted for, viewed in extensive detail, verified through primary research, and analyzed to get the final quantitative and qualitative data. The data is consolidated and added with detailed inputs and analysis from MarketsandMarkets.

  • The pricing trend is assumed to vary over time.
  • All the forecasts are made with the standard assumption that the accepted currency is USD.
  • For the conversion of various currencies to USD, average historical exchange rates are used according to the year specified. For all the historical and current exchange rates required for calculations and currency conversions, the US Internal Revenue Service's website is used.
  • All the forecasts are made under the standard assumption that the globally accepted currency USD, remains constant during the next five years.
  • Vendor-side analysis: The market size estimates of associated solutions and services are factored in from the vendor side by assuming an average of licensing and subscription-based models of leading and innovative vendors.
  • Demand/end-user analysis: End users operating in verticals across regions are analyzed in terms of market spending on geospatial analytics based on some of the key use cases. These factors for the geospatial analytics per region are separately analyzed, and the average spending was extrapolated with an approximation based on assumed weightage. This factor is derived by averaging various market influencers, including recent developments, regulations, mergers and acquisitions, enterprise/SME adoption, start-up ecosystem, IT spending, technology propensity and maturity, use cases, and the estimated number of organizations per region.

Market Size Estimation: Top Down And Bottom Up Approach
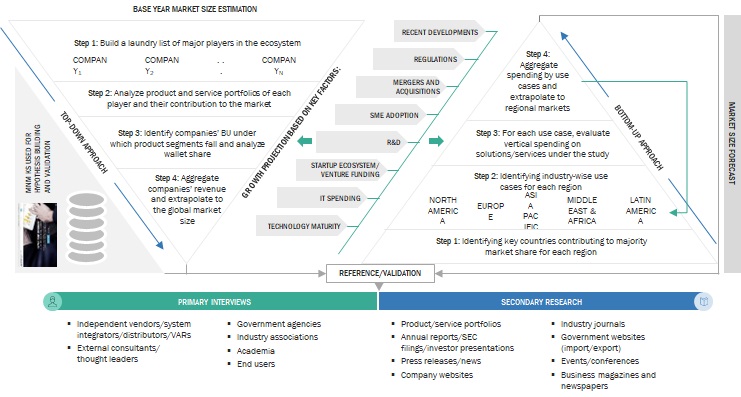
3D Imaging Market by Top Down And Bottom Up Approach

To know about the assumptions considered for the study, Request for Free Sample Report

Data Triangulation

After arriving at the overall market size using the market size estimation processes as explained above, the market was split into several segments and subsegments. To complete the overall market engineering process and arrive at the exact statistics of each market segment and subsegment, data triangulation and market breakup procedures were employed, wherever applicable. The overall market size was then used in the top-down procedure to estimate the size of other individual markets via percentage splits of the market segmentation.

Market Definition

According to Jesse Garant Metrology Center, 3D imaging is the process of creating the illusion of depth in an image. Technological advancements and evolution of specialized inspection techniques in industrial applications, have enabled users to obtain accurate and timeless 3D data on objects, by providing 3D images for testing purposes.

Key Stakeholders

  • 3D imaging hardware manufacturers/vendors
  • 3D imaging solution vendors
  • Value-added Resellers (VARs)
  • Government Agencies
  • System Integrators (SIs)

Report Objectives

  • To To define, describe, and forecast the 3D imaging market by component, technology, vertical, and region
  • To provide detailed information about the major factors (drivers, restraints, opportunities, and industry-specific challenges) influencing the market growth
  • To analyze the opportunities in the market and provide details of the competitive landscape for stakeholders and market leaders
  • To forecast the market size of the segments with respect to five main regions: North America, Europe, Asia Pacific (APAC), Middle East and Africa (MEA), and Latin America
  • To profile the key players and comprehensively analyze their market rankings and core competencies
  • To analyze competitive developments, such as Mergers and Acquisitions (M&A), new product developments, and Research and Development (R&D) activities, in the market

Available Customizations

With the given market data, MarketsandMarkets offers customizations as per the company’s specific needs. The following customization options are available for the report:

Product Analysis

  • Product matrix provides a detailed comparison of the product portfolio of each company

Geographic Analysis

  • Further breakup of the North American market for 3D Imaging  
  • Further breakup of the European market for 3D Imaging
  • Further breakup of the Asia Pacific market for 3D Imaging
  • Further breakup of the Latin American market for 3D Imaging
  • Further breakup of the Middle East & Africa market for 3D Imaging

Company Information

  • Detailed analysis and profiling of additional market players (up to five)

Previous Versions of this Report

3D Imaging Market by Component (Hardware, Solutions, and Services), Deployment Mode, Organization Size, Vertical (Manufacturing, Media and Entertainment, and Architecture and Construction), and Region - Global Forecast to 2025

Report Code TC 1446
Published in Apr, 2020, By MarketsandMarkets™

3D Imaging Market by Display Technology (Anaglyphy, Stereoscopy, Auto-stereoscopy), Imaging Solution (3D Modeling, 3D Scanning), Hardware (3D Display, 3D Sensor), Industry Vertical, & Region - Global Forecast to 2020

Report Code TC 1446
Published in Aug, 2015, By MarketsandMarkets™

3D Imaging Market [3D Modeling; 3D Scanning; 3D rendering; Layout and Animation; Image Reconstruction]: Global Advancements, Market Forecasts and Analysis (2013 - 2018)

Report Code TC 1446
Published in Jun, 2013, By MarketsandMarkets™
"Our USP is "providing game-changing business opportunities reports with free customization" - so please feel free to provide us with your specific areas of interest / business challenges in much greater detail !!"

We appreciate your interest in this report. Once you fill out the form, you'll be immediately directed to an exclusive solution tailored to your needs. This high-value offering can help boost your revenue by 30% - a must-see opportunity for anyone looking to maximize growth.


By clicking the "Submit" button, you are agreeing to the Terms of Use and Privacy Policy.

Custom Market Research Services

We Will Customise The Research For You, In Case The Report Listed Above Does Not Meet With Your Requirements

Get 10% Free Customisation

Growth opportunities and latent adjacency in 3D Imaging Market

DMCA.com Protection Status