Wire & Cable Market

Report Code CH 9137
Published in Aug, 2024, By MarketsandMarkets™
Download PDF

Choose License Type

Buy Report Now Inquire Before Buying

Wire & Cable Market by Product Type (Electronic Wire, Power Cable, Control & Instrumentation Cable, Communication Cable, Flexible & Specialty Cable), Material Type, Voltage, Installation, End-Use Industry, and Region - Global Forecast to 2029

Overview

The global wire and cable market is valued at USD 201.0 billion in 2024 and is projected to reach USD 266.2 billion by 2029, growing at 5.8% cagr from 2024 to 2029. Due to the pressing need for cables in the renewable energy sector, governments worldwide are investing significantly in renewable energy projects, particularly offshore wind energy. The rising emphasis on renewable energy in the power sector creates substantial demand for wires and cables in various regions, leading to market growth and innovative developments.

Attractive Opportunities in the Wire & Cable Market

Asia Pacific

The market growth in Asia Pacific region can be attributed to the rising demand for wire and cables from the EV sector.

Increasing investments in renewable energy projects in Asia Pacific are boosting the demand for wires & cables.

Asia Pacific is expected to be the largest market for global wire & cable industry.

New product launches and mergers & acquisitions are the key strategies adopted by companies operating in this market.

Surging demand in developed and developing countries creates opportunities for various market players.

Global Wire & Cable Market Dynamics

Drivers: Rising demand for cables from renewable energy sector

The global shift toward renewable energy sources such as wind, solar, and hydroelectric power significantly impacts the wire & cable market. This transition is leading to an increasing demand for specialized cables that can effectively meet the unique requirements of renewable energy systems.The immense focus on wind, solar, and hydroelectric power significantly impacts this market. According to the US Energy Information Administration, in January 2024, renewable energy generated through wind and solar power had a significant share in the total energy generated. Thus, companies and governments have made significant investments in renewable projects, further driving the wire and cable demand globally.The immense focus on wind, solar, and hydroelectric power significantly impacts this market. According to the US Energy Information Administration, in January 2024, renewable energy generated through wind and solar power had a significant share in the total energy generated. Thus, companies and governments have made significant investments in renewable projects, further driving the wire and cable demand globally.The immense focus on wind, solar, and hydroelectric power significantly impacts this market. According to the US Energy Information Administration, in January 2024, renewable energy generated through wind and solar power had a significant share in the total energy generated. Thus, companies and governments have made significant investments in renewable projects, further driving the wire and cable demand globally.

Restraints: Fluctuating raw material prices

The wire and cable industry is significantly influenced by the fluctuating prices of raw materials, particularly copper and aluminum. These metals are essential in manufacturing wires and cables due to their excellent electrical conductivity properties. No substitute materials have been developed for these metals, but they are susceptible to price fluctuations due to global economic conditions, trade wars, and recessions.The price volatility experienced in the wire and cable industry poses a significant vulnerability for manufacturers, serving as a major constraint on their business operations.The price volatility experienced in the wire and cable industry poses a significant vulnerability for manufacturers, serving as a major constraint on their business operations.


Opportunities: Surge in demand for cables in EV infrastructure

The rapid expansion of EV infrastructure influences the wire and cable industry, causing a surge in demand for cables adhering to EV standards. Countries worldwide are planning to boost the EV market and reduce carbon footprints. As the number of EVs continues to increase, there is a growing need for EV charging infrastructure.EVs and EV infrastructure require level 1, level 2, and DC fast charging cables. Leading manufacturers provide these specialty cables and capture a significant share of the EV cables market.EVs and EV infrastructure require level 1, level 2, and DC fast charging cables. Leading manufacturers provide these specialty cables and capture a significant share of the EV cables market.

Challenges: Enhancing insulation durability

Increasing cost and complexity pose significant challenges to insulation durability in the wire and cable industry. High and extra-high-voltage cables require advanced insulations, increasing their cost. For instance, submarine cables on the seabed must survive salinity, temperature variations, and extreme water pressure. These extreme conditions degrade insulation over time. Thus, wire and cable manufacturers must develop durable and resilient insulation solutions to ensure a prolonged cable life.

Global Wire & Cable Market Ecosystem Analysis

This ecosystem includes raw material suppliers, such as manufacturers of metals (like copper and aluminum) and polymers (such as PVC and polyethylene) used for conductors and insulation. Cable manufacturers use these materials to produce various types of cables, including power, data, and specialty cables for different applications.


Infrastructural development and rapid urbanization to drive demand for underground cable installation

Underground cables hold the largest market share in the installation segment of the wire & cable market. Infrastructural development and rapid urbanization in developing economies primarily drive the need for underground cables, providing superior protection over other installation types. These cables are less vulnerable to extreme weather conditions, making them ideal for urban settings. Moreover, the rising focus on technological advancements in telecommunication generates a massive demand for underground cables.

Rising dependence on computers and high–end automobiles to boost demand for electronic wires.

Electronic wires are expected to record the fastest growth in the wire & cable market due to the extensive manufacturing of electronic devices and technological advancements in several industries. In an era where smartphones, computers, and high-end automobiles have become indispensable in our daily lives, the world witnesses an increasing dependence on these electronic devices. Thus, there is a rising demand for efficient and innovative wiring solutions to support this technological reliance. Furthermore, the surge in IoT devices and data centers boosts the demand for reliable and durable electronic wires.

Asia Pacific region holds the largest share of the Wire & Cable Market.

Asia Pacific is the largest regional market for wires and cables due to significant infrastructural developments, rising urban population, fast economic growth, and increasing concerns about environmental pollution. China, Japan, and India generate a substantial demand for wires and cables due to their large-scale investments in power generation, transportation, and innovative city projects. These countries are expanding electrical grids via advanced technologies, thus driving Asia Pacific’s wire & cable market.


Recent Developments of Wire & Cable Market industry

  • In June 2024, Nexans acquired La Triveneta Cavi, a European company manufacturing medium and low-voltage cables. This acquisition by Nexans aims to expand its European customer base and enhance its business portfolio.
  • In April 2024, Prysmian acquired Encore Wire, a US-based company, for USD 290.0 per share. This acquisition aims to expand Prysmian’s geographical presence in North America.

Key Market Players

KEY PLAYERS IN THE Wire & Cable Market INCLUDE

Want to explore hidden markets that can drive new revenue in Wire & Cable Market?

Scope of the Report

Report Attribute Details
Years considered for the study 2022–2029
Base year 2023
Forecast period 2024–2029
Units considered Value (USD Billion)
Segments Product Type, Material, Installation, Voltage, End-Use Industry, and Region
Regions covered Europe, North America, Asia Pacific, Middle East & Africa, and Latin America
Companies profiled Prysmian (Italy), Fujikura Ltd. (Japan), Leoni Ag (Germany), Nexans (France), NKT A/S (Denmark), Belden Inc. (US), and LS Cable and System (South Korea)


Key Questions Addressed by the Report

What factors influence the growth of the wire & cable market?
Increasing demand from the energy & power sector drives the wire & cable market.
Which is the fastest-growing country-level market for wires & cables?
China is the fastest-growing wire & cable market due to the high cable demand from EV manufacturers.
Which factors contribute to the final cost of wires & cables?
Raw materials are crucial in determining the final cost, mainly impacting the pricing of wires and cables.
What are the opportunities in the wire & cable market?
Increasing EV infrastructure is a significant opportunity in the wire & cable market.
Which installation of wire & cable is expected to register the highest CAGR in the wire & cable market?
Underground cables will likely record the highest CAGR in the market due to their significant advantages over other installation types.
Who are the major wire & cable manufacturers?
Prysmian (Italy), Fujikura Ltd. (Japan), Leoni Ag (Germany), Nexans (France), NKT A/S (Denmark), and LS Cable and System (South Korea).
Which is the largest voltage segment in the wire & cable market?
Low voltage is the largest wire & cable market segment.


Personalize This Research

  • Triangulate with your Own Data
  • Get Data as per your Format and Definition
  • Gain a Deeper Dive on a Specific Application, Geography, Customer or Competitor
  • Any level of Personalization
Request A Free Customisation

Let Us Help You

  • What are the Known and Unknown Adjacencies Impacting the Wire & Cable Market
  • What will your New Revenue Sources be?
  • Who will be your Top Customer; what will make them switch?
  • Defend your Market Share or Win Competitors
  • Get a Scorecard for Target Partners
Customized Workshop Request

Table of Contents

Exclusive indicates content/data unique to MarketsandMarkets and not available with any competitors.

TITLE
PAGE NO
INTRODUCTION
24
RESEARCH METHODOLOGY
29
EXECUTIVE SUMMARY
40
PREMIUM INSIGHTS
45
MARKET OVERVIEW
50
  • 5.1 INTRODUCTION
  • 5.2 MARKET DYNAMICS
    DRIVERS
    - Rising demand for cables from renewable energy sector
    - Increased focus on safety and compliance
    - Surging government investments in grid technology and infrastructure projects
    RESTRAINTS
    - Fluctuating raw material prices
    - Global trade war escalation
    OPPORTUNITIES
    - Growing demand for cables in EV infrastructure
    - Expansion of offshore wind energy projects
    - Rising need to modernize electrical grids
    CHALLENGES
    - Enhancing insulation durability under harsh conditions
    - Requirement for technical expertise to develop and install advanced cables
  • 5.3 PORTER’S FIVE FORCES ANALYSIS
    THREAT OF NEW ENTRANTS
    THREAT OF SUBSTITUTES
    BARGAINING POWER OF SUPPLIERS
    BARGAINING POWER OF BUYERS
    INTENSITY OF COMPETITIVE RIVALRY
  • 5.4 KEY STAKEHOLDERS AND BUYING CRITERIA
    KEY STAKEHOLDERS IN BUYING PROCESS
    BUYING CRITERIA
  • 5.5 MACROECONOMIC OUTLOOK
    INTRODUCTION
    GDP TRENDS AND FORECAST
    TRENDS IN GLOBAL CONSTRUCTION INDUSTRY
    TRENDS IN GLOBAL AUTOMOTIVE INDUSTRY
    TRENDS IN GLOBAL APPLIANCES INDUSTRY
  • 5.6 SUPPLY CHAIN ANALYSIS
    RAW MATERIAL ANALYSIS
    PRODUCT TYPE ANALYSIS
    - Electronic wires/coaxial cables
    - Power cables
    - Control & instrumentation cables
    - Communication cables
    - Flexible & specialty cables
    VOLTAGE ANALYSIS
    INSTALLATION ANALYSIS
    FINAL PRODUCT ANALYSIS
  • 5.7 VALUE CHAIN ANALYSIS
  • 5.8 ECOSYSTEM ANALYSIS
  • 5.9 PRICING ANALYSIS
    AVERAGE SELLING PRICE TREND OF KEY PLAYERS, BY END-USE INDUSTRY
    AVERAGE SELLING PRICE TREND, BY REGION
  • 5.10 TRADE ANALYSIS
    IMPORT SCENARIO FOR HS CODE 761410
    EXPORT SCENARIO FOR HS CODE 761410
  • 5.11 TECHNOLOGY ANALYSIS
    KEY TECHNOLOGIES
    - Wire drawing
    - Annealing
    - Twisting and stranding
    - Extrusion
    - Cabling
    COMPLEMENTARY TECHNOLOGIES
    - 3D printed wires
    - Smart wires & cables
    - Nanotechnology
  • 5.12 PATENT ANALYSIS
    INTRODUCTION
    METHODOLOGY
    DOCUMENT TYPES
    INSIGHTS
    LEGAL STATUS
    JURISDICTION ANALYSIS
    TOP APPLICANTS
    TOP 10 PATENT OWNERS (US) IN LAST 5 YEARS
  • 5.13 REGULATORY LANDSCAPE
    REGULATORY BODIES, GOVERNMENT AGENCIES, AND OTHER ORGANIZATIONS
  • 5.14 KEY CONFERENCES & EVENTS, 2024–2025
  • 5.15 CASE STUDY ANALYSIS
    CASE STUDY 1: SOUTHWIRE TO DESIGN AND INSTALL ONSHORE HIGH-VOLTAGE CABLES
    CASE STUDY 2: NEXANS AND EQUINOR PARTNERSHIP
    CASE STUDY 3: SUMITOMO ELECTRIC ACQUIRES MAJORITY STAKE IN SÜDKABEL
  • 5.16 TRENDS/DISRUPTIONS IMPACTING CUSTOMER BUSINESS
  • 5.17 INVESTMENT AND FUNDING SCENARIO
  • 5.18 IMPACT OF AI/GEN AI
    TOP USE CASES AND MARKET POTENTIAL
    CASE STUDIES OF AI IMPLEMENTATION IN WIRE & CABLE MARKET
WIRE & CABLE MARKET, BY PRODUCT TYPE
90
  • 6.1 INTRODUCTION
  • 6.2 ELECTRONIC WIRES
  • 6.3 POWER CABLES
  • 6.4 CONTROL & INSTRUMENTATION CABLES
  • 6.5 COMMUNICATION CABLES
  • 6.6 FLEXIBLE & SPECIALTY CABLES
WIRE & CABLE MARKET, BY MATERIAL TYPE
94
  • 7.1 INTRODUCTION
  • 7.2 METAL
    SUPERIOR ELECTRICAL CONDUCTIVITY AND DURABILITY TO DRIVE MARKET
  • 7.3 POLYMER
    CAPACITY TO PROVIDE LONG-LASTING PROTECTION AND ADAPT TO VARIOUS ENVIRONMENTAL SITUATIONS TO DRIVE MARKET
WIRE & CABLE MARKET, BY INSTALLATION
98
  • 8.1 INTRODUCTION
  • 8.2 OVERHEAD
    GOVERNMENT INVESTMENTS IN INFRASTRUCTURE DEVELOPMENT TO DRIVE MARKET
  • 8.3 UNDERGROUND
    RAPID URBANIZATION TO BOOST MARKET GROWTH
  • 8.4 SUBMARINE
    INCREASING GLOBAL CONNECTIVITY TO PROPEL MARKET
WIRE & CABLE MARKET, BY VOLTAGE
103
  • 9.1 INTRODUCTION
  • 9.2 LOW VOLTAGE
    RISE OF SMART HOME TECHNOLOGIES TO DRIVE MARKET
  • 9.3 MEDIUM VOLTAGE
    ADVANCEMENTS IN ELECTRICAL GRID TECHNOLOGY TO PROPEL MARKET
  • 9.4 HIGH VOLTAGE
    RISING DEMAND FOR ROBUST AND RELIABLE POWER TRANSMISSION SYSTEMS TO PROPEL MARKET
  • 9.5 EXTRA-HIGH VOLTAGE
    RISING NUMBER OF SUBMARINE PROJECTS TO DRIVE DEMAND
WIRE & CABLE MARKET, BY END-USE INDUSTRY
109
  • 10.1 INTRODUCTION
  • 10.2 AEROSPACE & DEFENSE
    SURGE IN GOVERNMENT SPENDING IN DEFENSE SECTOR TO DRIVE MARKET
  • 10.3 BUILDING & CONSTRUCTION
    GROWING INVESTMENTS IN INFRASTRUCTURE DEVELOPMENT IN DEVELOPING COUNTRIES TO PROPEL MARKET
  • 10.4 OIL & GAS
    RISING INVESTMENTS IN OIL & GAS INDUSTRY TO DRIVE MARKET
  • 10.5 ENERGY & POWER
    GROWING RENEWABLE ENERGY PROJECTS TO BOOST MARKET
  • 10.6 IT & TELECOM
    ADVANCEMENTS IN DATA CENTERS TO DRIVE MARKET
  • 10.7 AUTOMOTIVE
    RISING DEMAND FOR EV VEHICLES TO DRIVE MARKET
  • 10.8 MEDICAL EQUIPMENT
    GROWTH IN REMOTE AND WEARABLE HEALTH TECHNOLOGIES TO DRIVE MARKET
  • 10.9 OTHER END-USE INDUSTRIES
WIRE & CABLE MARKET, BY REGION
119
  • 11.1 INTRODUCTION
  • 11.2 NORTH AMERICA
    US
    - Booming aerospace & defense industry to drive demand for wires & cables
    CANADA
    - Advancements in IT & telecom industry to drive market
  • 11.3 EUROPE
    GERMANY
    - Rapid electrification of transportation to boost demand for wires & cables
    FRANCE
    - Rising demand for grid installation to drive market
    UK
    - Rising focus on offshore wind generation to boost market
    ITALY
    - Surge in Italian data centers to drive market
    SPAIN
    - Advancements in IT & Telecom industry to drive market
    RUSSIA
    - Rising investments in defense to boost demand for wire & cable products
    REST OF EUROPE
  • 11.4 ASIA PACIFIC
    CHINA
    - Rising demand for EVs in China to drive market
    JAPAN
    - Pressing need for clean energy to drive market
    INDIA
    - Growth of automotive industry to drive market
    SOUTH KOREA
    - Government incentives to promote EV demand to drive market
    AUSTRALIA
    - Growing renewable energy demand to drive market
    REST OF ASIA PACIFIC
  • 11.5 LATIN AMERICA
    BRAZIL
    - Increasing investments in infrastructure projects to drive demand
    MEXICO
    - Growing focus on energy and power sector to drive market
    REST OF LATIN AMERICA
  • 11.6 MIDDLE EAST & AFRICA
    GCC COUNTRIES
    - UAE
    - Saudi Arabia
    - Rest of GCC countries
    SOUTH AFRICA
    - Government initiatives in the energy & power sector to boost demand
    REST OF MIDDLE EAST & AFRICA
COMPETITIVE LANDSCAPE
157
  • 12.1 INTRODUCTION
  • 12.2 KEY PLAYER STRATEGIES
  • 12.3 REVENUE ANALYSIS, 2019–2023
  • 12.4 MARKET SHARE ANALYSIS
  • 12.5 BRAND/PRODUCT COMPARISON
    BRAND/PRODUCT COMPARISON, BY WIRE & CABLE PRODUCTS
    ALPHA WIRE
    DRAKA
    AMER CABLE
    GLEASON REEL CORPORATION
  • 12.6 COMPANY EVALUATION MATRIX: KEY PLAYERS, 2023
    STARS
    EMERGING LEADERS
    PERVASIVE PLAYERS
    PARTICIPANTS
    COMPANY FOOTPRINT
    - Company footprint
    - Product type footprint
    - Installation footprint
    - Voltage footprint
    - End-use industry footprint
    - Region footprint
  • 12.7 COMPANY EVALUATION MATRIX: STARTUPS/SMES, 2023
    PROGRESSIVE COMPANIES
    RESPONSIVE COMPANIES
    DYNAMIC COMPANIES
    STARTING BLOCKS
    COMPETITIVE BENCHMARKING OF KEY STARTUPS/SMES, 2023
    - Detailed list of key startups/SMEs
    - Competitive benchmarking of key startups/SMES
  • 12.8 VALUATION AND FINANCIAL METRICS OF WIRE AND CABLE MANUFACTURERS
  • 12.9 COMPETITIVE SCENARIO AND TRENDS
    PRODUCT LAUNCHES
    DEALS
    EXPANSIONS
    OTHER DEVELOPMENTS
COMPANY PROFILES
183
  • 13.1 KEY COMPANIES
    BELDEN INC.
    - Business overview
    - Products offered
    - Recent developments
    - MnM view
    FUJIKURA LTD.
    - Business overview
    - Products offered
    - Recent developments
    - MnM view
    FURUKAWA ELECTRIC CO., LTD.
    - Business overview
    - Products offered
    - Recent developments
    - MnM view
    LEONI AG
    - Business overview
    - Products offered
    - Recent developments
    - MnM view
    EMERSON ELECTRIC CO.
    - Business overview
    - Products offered
    - MnM view
    PRYSMIAN
    - Business overview
    - Products offered
    - Recent developments
    - MnM view
    HELLENIC CABLES
    - Business overview
    - Products offered
    - Recent developments
    - MnM view
    KEI INDUSTRIES
    - Business overview
    - Products offered
    - Recent developments
    - MnM view
    AMPHENOL
    - Business overview
    - Products offered
    - Recent developments
    - MnM view
    FINOLEX CABLES LTD.
    - Business overview
    - Products offered
    - Recent developments
    - MnM view
    NKT A/S
    - Business overview
    - Products offered
    - Recent developments
    - MnM view
    SUMITOMO ELECTRIC INDUSTRIES, LTD.
    - Business overview
    - Products offered
    - Recent developments
    - MnM view
    HELUKABEL
    - Business overview
    - Products offered
    - MnM view
    LS CABLE & SYSTEM
    - Business overview
    - Products offered
    - Recent developments
    - MnM view
    NEXANS
    - Business overview
    - Products offered
    - Recent developments
    - MnM view
  • 13.2 OTHER PLAYERS
    SAREL
    REMEE WIRE & CABLE
    HUBBELL
    TRATOS GROUP
    DONCASTER CABLES
    TT CABLES
    BRUGG CABLES
    STUDER CABLES AG
    HENAN CENTRAL PLAIN CABLES AND WIRES CO., LTD.
    CORDS CABLE
APPENDIX
250
  • 14.1 DISCUSSION GUIDE
  • 14.2 KNOWLEDGESTORE: MARKETSANDMARKETS’ SUBSCRIPTION PORTAL
  • 14.3 CUSTOMIZATION OPTIONS
  • 14.4 RELATED REPORTS
  • 14.5 AUTHOR DETAILS
LIST OF TABLES
 
  • TABLE 1 WIRE & CABLE MARKET: PORTER’S FIVE FORCES ANALYSIS
  • TABLE 2 INFLUENCE OF STAKEHOLDERS ON BUYING PROCESS FOR TOP THREE END-USE INDUSTRIES
  • TABLE 3 KEY BUYING CRITERIA FOR TOP THREE END-USE INDUSTRIES
  • TABLE 4 GDP PERCENTAGE (%) CHANGE, KEY COUNTRY, 2020–2029
  • TABLE 5 TRENDS OF GLOBAL AUTOMOTIVE INDUSTRY
  • TABLE 6 WIRE & CABLE MARKET: ROLE OF COMPANIES IN ECOSYSTEM
  • TABLE 7 AVERAGE SELLING PRICE TREND, BY REGION
  • TABLE 8 LEADING IMPORTING COUNTRIES FOR HS CODE 761410 IN 2023
  • TABLE 9 LEADING EXPORTING COUNTRIES FOR HS CODE 761410 IN 2023
  • TABLE 10 WIRE & CABLE MARKET: TOTAL NUMBER OF PATENTS
  • TABLE 11 LIST OF PATENTS BY HITACHI METALS LTD.
  • TABLE 12 LIST OF PATENTS BY SUMITOMO ELECTRIC INDUSTRY
  • TABLE 13 NORTH AMERICA: REGULATORY BODIES, GOVERNMENT AGENCIES, AND OTHER ORGANIZATIONS
  • TABLE 14 EUROPE: REGULATORY BODIES, GOVERNMENT AGENCIES, AND OTHER ORGANIZATIONS
  • TABLE 15 ASIA PACIFIC: REGULATORY BODIES, GOVERNMENT AGENCIES, AND OTHER ORGANIZATIONS
  • TABLE 16 REST OF WORLD: REGULATORY BODIES, GOVERNMENT AGENCIES, AND OTHER ORGANIZATIONS
  • TABLE 17 WIRE & CABLE MARKET: DETAILED LIST OF CONFERENCES & EVENTS, 2024–2025
  • TABLE 18 TOP USE CASES AND MARKET POTENTIAL
  • TABLE 19 CASE STUDIES OF GEN AI IMPLEMENTATION IN WIRE & CABLE MARKET
  • TABLE 20 WIRE & CABLE MARKET, BY PRODUCT TYPE, 2022–2029 (USD BILLION)
  • TABLE 21 WIRE & CABLE MARKET, BY MATERIAL TYPE, 2022–2029 (USD BILLION)
  • TABLE 22 METAL: WIRE & CABLE MARKET, BY REGION, 2022–2029 (USD BILLION)
  • TABLE 23 POLYMER: WIRE & CABLE MARKET, BY REGION, 2022–2029 (USD BILLION)
  • TABLE 24 WIRE & CABLE MARKET, BY INSTALLATION, 2022–2029 (USD BILLION)
  • TABLE 25 OVERHEAD: WIRE & CABLE MARKET, BY REGION, 2022–2029 (USD BILLION)
  • TABLE 26 UNDERGROUND: WIRE & CABLE MARKET, BY REGION, 2022–2029 (USD BILLION)
  • TABLE 27 SUBMARINE: WIRE & CABLE MARKET, BY REGION, 2022–2029 (USD BILLION)
  • TABLE 28 WIRE & CABLE MARKET, BY VOLTAGE, 2022–2029 (USD BILLION)
  • TABLE 29 LOW VOLTAGE: WIRE & CABLE MARKET, BY REGION, 2022–2029 (USD BILLION)
  • TABLE 30 MEDIUM VOLTAGE: WIRE & CABLE MARKET, BY REGION, 2022–2029 (USD BILLION)
  • TABLE 31 HIGH VOLTAGE: WIRE & CABLE MARKET, BY REGION, 2022–2029 (USD BILLION)
  • TABLE 32 EXTRA-HIGH VOLTAGE: WIRE & CABLE MARKET, BY REGION, 2022–2029 (USD BILLION)
  • TABLE 33 WIRE & CABLE MARKET, BY END-USE INDUSTRY, 2022–2029 (USD BILLION)
  • TABLE 34 AEROSPACE & DEFENSE: WIRE & CABLE MARKET, BY REGION, 2022–2029 (USD BILLION)
  • TABLE 35 BUILDING & CONSTRUCTION: WIRE & CABLE MARKET, BY REGION, 2022–2029 (USD BILLION)
  • TABLE 36 OIL & GAS: WIRE & CABLE MARKET, BY REGION, 2022–2029 (USD BILLION)
  • TABLE 37 ENERGY & POWER: WIRE & CABLE MARKET, BY REGION, 2022–2029 (USD BILLION)
  • TABLE 38 IT & TELECOM: WIRE & CABLE MARKET, BY REGION, 2022–2029 (USD BILLION)
  • TABLE 39 AUTOMOTIVE: WIRE & CABLE MARKET, BY REGION, 2022–2029 (USD BILLION)
  • TABLE 40 MEDICAL EQUIPMENT: WIRE & CABLE MARKET, BY REGION, 2022–2029 (USD BILLION)
  • TABLE 41 OTHER END-USE INDUSTRIES: WIRE & CABLE MARKET, BY REGION, 2022–2029 (USD BILLION)
  • TABLE 42 WIRE & CABLE MARKET, BY REGION, 2022–2029 (USD BILLION)
  • TABLE 43 NORTH AMERICA: WIRE & CABLE MARKET, BY MATERIAL TYPE, 2022–2029 (USD BILLION)
  • TABLE 44 NORTH AMERICA: WIRE & CABLE MARKET, BY VOLTAGE, 2022–2029 (USD BILLION)
  • TABLE 45 NORTH AMERICA: WIRE & CABLE MARKET, BY INSTALLATION, 2022–2029 (USD BILLION)
  • TABLE 46 NORTH AMERICA: WIRE & CABLE MARKET, BY END-USE INDUSTRY, 2022–2029 (USD BILLION)
  • TABLE 47 NORTH AMERICA: WIRE & CABLE MARKET, BY COUNTRY, 2022–2029 (USD BILLION)
  • TABLE 48 US: WIRE & CABLE MARKET, BY END-USE INDUSTRY 2022–2029 (USD BILLION)
  • TABLE 49 CANADA: WIRE & CABLE MARKET, BY END-USE INDUSTRY, 2022–2029 (USD BILLION)
  • TABLE 50 EUROPE: WIRE & CABLE MARKET, BY MATERIAL TYPE, 2022–2029 (USD BILLION)
  • TABLE 51 EUROPE: WIRE & CABLE MARKET, BY VOLTAGE, 2022–2029 (USD BILLION)
  • TABLE 52 EUROPE: WIRE & CABLE MARKET, BY INSTALLATION, 2022–2029 (USD BILLION)
  • TABLE 53 EUROPE: WIRE & CABLE MARKET, BY END-USE INDUSTRY, 2022–2029 (USD BILLION)
  • TABLE 54 EUROPE: WIRE & CABLE MARKET, BY COUNTRY, 2022–2029 (USD BILLION)
  • TABLE 55 GERMANY: WIRE & CABLE MARKET, BY END-USE INDUSTRY, 2022–2029 (USD BILLION)
  • TABLE 56 FRANCE: WIRE & CABLE MARKET, BY END-USE INDUSTRY, 2022–2029 (USD BILLION)
  • TABLE 57 UK: WIRE & CABLE MARKET, BY END-USE INDUSTRY, 2022–2029 (USD BILLION)
  • TABLE 58 ITALY: WIRE & CABLE MARKET, BY END-USE INDUSTRY, 2022–2029 (USD BILLION)
  • TABLE 59 SPAIN: WIRE & CABLE MARKET, BY END-USE INDUSTRY, 2022–2029 (USD BILLION)
  • TABLE 60 RUSSIA: WIRE & CABLE MARKET, BY END-USE INDUSTRY, 2022–2029 (USD BILLION)
  • TABLE 61 REST OF EUROPE: WIRE & CABLE MARKET, BY END-USE INDUSTRY, 2022–2029 (USD BILLION)
  • TABLE 62 ASIA PACIFIC: WIRE & CABLE MARKET, BY MATERIAL TYPE, 2022–2029 (USD BILLION)
  • TABLE 63 ASIA PACIFIC: WIRE & CABLE MARKET, BY VOLTAGE, 2022–2029 (USD BILLION)
  • TABLE 64 ASIA PACIFIC: WIRE & CABLE MARKET, BY INSTALLATION, 2022–2029 (USD BILLION)
  • TABLE 65 ASIA PACIFIC: WIRE & CABLE MARKET, BY END-USE INDUSTRY, 2022–2029 (USD BILLION)
  • TABLE 66 ASIA PACIFIC: WIRE & CABLE MARKET, BY COUNTRY, 2022–2029 (USD BILLION)
  • TABLE 67 CHINA: WIRE & CABLE MARKET, BY END-USE INDUSTRY, 2022–2029 (USD BILLION)
  • TABLE 68 JAPAN: WIRE & CABLE MARKET, BY END-USE INDUSTRY, 2022–2029 (USD BILLION)
  • TABLE 69 INDIA: WIRE & CABLE MARKET, BY END-USE INDUSTRY, 2022–2029 (USD BILLION)
  • TABLE 70 SOUTH KOREA: WIRE & CABLE MARKET, BY END-USE INDUSTRY, 2022–2029 (USD BILLION)
  • TABLE 71 AUSTRALIA: WIRE & CABLE MARKET, BY END-USE INDUSTRY, 2022–2029 (USD BILLION)
  • TABLE 72 REST OF ASIA PACIFIC: WIRE & CABLE MARKET, BY END-USE INDUSTRY, 2022–2029 (USD BILLION)
  • TABLE 73 LATIN AMERICA: WIRE & CABLE MARKET, BY MATERIAL TYPE, 2022–2029 (USD BILLION)
  • TABLE 74 LATIN AMERICA: WIRE & CABLE MARKET, BY VOLTAGE, 2022–2029 (USD BILLION)
  • TABLE 75 LATIN AMERICA: WIRE & CABLE MARKET, BY INSTALLATION, 2022–2029 (USD BILLION)
  • TABLE 76 LATIN AMERICA: WIRE & CABLE MARKET, BY END-USE INDUSTRY, 2022–2029 (USD BILLION)
  • TABLE 77 LATIN AMERICA: WIRE & CABLE MARKET, BY COUNTRY, 2022–2029 (USD BILLION)
  • TABLE 78 BRAZIL: WIRE & CABLE MARKET, BY END-USE INDUSTRY, 2022–2029 (USD BILLION)
  • TABLE 79 MEXICO: WIRE & CABLE MARKET, BY END-USE INDUSTRY, 2022–2029 (USD BILLION)
  • TABLE 80 REST OF LATIN AMERICA: WIRE & CABLE MARKET, BY END-USE INDUSTRY, 2022–2029 (USD BILLION)
  • TABLE 81 MIDDLE EAST & AFRICA: WIRE & CABLE MARKET, BY MATERIAL TYPE, 2022–2029 (USD BILLION)
  • TABLE 82 MIDDLE EAST & AFRICA: WIRE & CABLE MARKET, BY VOLTAGE, 2022–2029 (USD BILLION)
  • TABLE 83 MIDDLE EAST & AFRICA: WIRE & CABLE MARKET, BY INSTALLATION, 2022–2029 (USD BILLION)
  • TABLE 84 MIDDLE EAST & AFRICA: WIRE & CABLE MARKET, BY END-USE INDUSTRY, 2022–2029 (USD BILLION)
  • TABLE 85 MIDDLE EAST & AFRICA: WIRE & CABLE MARKET, BY COUNTRY, 2022–2029 (USD BILLION)
  • TABLE 86 UAE: WIRE & CABLE MARKET, BY END-USE INDUSTRY, 2022–2029 (USD BILLION)
  • TABLE 87 SAUDI ARABIA: WIRE & CABLE MARKET, BY END-USE INDUSTRY, 2022–2029 (USD BILLION)
  • TABLE 88 REST OF GCC COUNTRIES: WIRE & CABLE MARKET, BY END-USE INDUSTRY, 2022–2029 (USD BILLION)
  • TABLE 89 SOUTH AFRICA: WIRE & CABLE MARKET, BY END-USE INDUSTRY, 2022–2029 (USD BILLION)
  • TABLE 90 REST OF MIDDLE EAST & AFRICA: WIRE & CABLE MARKET, BY END-USE INDUSTRY, 2022–2029 (USD BILLION)
  • TABLE 91 STRATEGIES ADOPTED BY WIRE AND CABLE MANUFACTURERS
  • TABLE 92 DEGREE OF COMPETITION: WIRE & CABLE MARKET
  • TABLE 93 WIRE & CABLE MARKET: PRODUCT TYPE FOOTPRINT
  • TABLE 94 WIRE & CABLE MARKET: INSTALLATION FOOTPRINT
  • TABLE 95 WIRE & CABLE MARKET: VOLTAGE FOOTPRINT
  • TABLE 96 WIRE & CABLE MARKET: END-USE INDUSTRY FOOTPRINT
  • TABLE 97 WIRE & CABLE MARKET: REGION FOOTPRINT
  • TABLE 98 WIRE & CABLE MARKET: KEY STARTUPS/SMES
  • TABLE 99 WIRE & CABLE MARKET: COMPETITIVE BENCHMARKING OF KEY STARTUPS/SMES
  • TABLE 100 WIRE & CABLE MARKET: PRODUCT LAUNCHES, JANUARY 2019–JULY 2024
  • TABLE 101 WIRE & CABLE MARKET: DEALS, JANUARY 2019–JULY 2024
  • TABLE 102 WIRE & CABLE MARKET: EXPANSIONS, JANUARY 2019–JULY 2024
  • TABLE 103 WIRE & CABLE MARKET: OTHER DEVELOPMENTS, JANUARY 2019–JULY 2024
  • TABLE 104 BELDEN INC.: COMPANY OVERVIEW
  • TABLE 105 BELDEN INC.: PRODUCTS OFFERED
  • TABLE 106 BELDEN INC.: PRODUCT LAUNCHES, JANUARY 2019–JULY 2024
  • TABLE 107 FUJIKURA LTD.: COMPANY OVERVIEW
  • TABLE 108 FUJIKURA LTD.: PRODUCTS OFFERED
  • TABLE 109 FUJIKURA LTD.: PRODUCT LAUNCHES, JANUARY 2019–JULY 2024
  • TABLE 110 FUJIKURA LTD.: DEALS, JANUARY 2019–JULY 2024
  • TABLE 111 FUJIKURA LTD.: EXPANSIONS, JANUARY 2019–JULY 2024
  • TABLE 112 FURUKAWA ELECTRIC CO., LTD.: COMPANY OVERVIEW
  • TABLE 113 FURUKAWA ELECTRIC CO., LTD.: PRODUCTS OFFERED
  • TABLE 114 FURUKAWA ELECTRIC CO., LTD.: DEALS, JANUARY 2019–JULY 2024
  • TABLE 115 FURUKAWA ELECTRIC CO., LTD.: OTHER DEVELOPMENTS, JANUARY 2019–JULY 2024
  • TABLE 116 LEONI AG: COMPANY OVERVIEW
  • TABLE 117 LEONI AG: PRODUCTS OFFERED
  • TABLE 118 LEONI AG: PRODUCT LAUNCHES, JANUARY 2019–JULY 2024
  • TABLE 119 LEONI AG: EXPANSIONS, JANUARY 2019–JULY 2024
  • TABLE 120 LEONI AG: OTHER DEVELOPMENTS, JANUARY 2019–JULY 2024
  • TABLE 121 EMERSON ELECTRIC CO.: COMPANY OVERVIEW
  • TABLE 122 EMERSON ELECTRIC CO.: PRODUCTS OFFERED
  • TABLE 123 PRYSMIAN: COMPANY OVERVIEW
  • TABLE 124 PRYSMIAN: PRODUCTS OFFERED
  • TABLE 125 PRYSMIAN: PRODUCT LAUNCHES, JANUARY 2019–JULY 2024
  • TABLE 126 PRYSMIAN: DEALS, JANUARY 2019–JULY 2024
  • TABLE 127 PRYSMIAN: EXPANSIONS, JANUARY 2019–JULY 2024
  • TABLE 128 HELLENIC CABLES: COMPANY OVERVIEW
  • TABLE 129 HELLENIC CABLES: PRODUCTS OFFERED
  • TABLE 130 HELLENIC CABLES: PRODUCT LAUNCHES, JANUARY 2019–JULY 2024
  • TABLE 131 HELLENIC CABLES: DEALS, JANUARY 2019–JULY 2024
  • TABLE 132 HELLENIC CABLES: OTHER DEVELOPMENTS, JANUARY 2019–JULY 2024
  • TABLE 133 KEI INDUSTRIES: COMPANY OVERVIEW
  • TABLE 134 KEI INDUSTRIES: PRODUCTS OFFERED
  • TABLE 135 KEI INDUSTRIES: DEALS, JANUARY 2019–JULY 2024
  • TABLE 136 AMPHENOL: COMPANY OVERVIEW
  • TABLE 137 AMPHENOL: PRODUCTS OFFERED
  • TABLE 138 AMPHENOL: PRODUCT LAUNCHES, JANUARY 2019–JULY 2024
  • TABLE 139 AMPHENOL: EXPANSIONS, JANUARY 2019–JULY 2024
  • TABLE 140 AMPHENOL: DEALS, JANUARY 2019–JULY 2024
  • TABLE 141 FINOLEX CABLES LTD.: COMPANY OVERVIEW
  • TABLE 142 FINOLEX CABLES LTD.: PRODUCTS OFFERED
  • TABLE 143 FINOLEX CABLES LTD.: DEALS, JANUARY 2019–JULY 2024
  • TABLE 144 NKT A/S: COMPANY OVERVIEW
  • TABLE 145 NKT A/S: PRODUCTS OFFERED
  • TABLE 146 NKT A/S: DEALS, JANUARY 2019–JULY 2024
  • TABLE 147 NKT A/S: OTHER DEVELOPMENTS, JANUARY 2019–JULY 2024
  • TABLE 148 SUMITOMO ELECTRIC INDUSTRIES, LTD.: COMPANY OVERVIEW
  • TABLE 149 SUMITOMO ELECTRIC INDUSTRIES, LTD.: PRODUCTS OFFERED
  • TABLE 150 SUMITOMO ELECTRIC INDUSTRIES, LTD.: DEALS, JANUARY 2019–JULY 2024
  • TABLE 151 SUMITOMO ELECTRIC INDUSTRIES, LTD.: EXPANSIONS, JANUARY 2019–JULY 2024
  • TABLE 152 SUMITOMO ELECTRIC INDUSTRIES, LTD.: OTHER DEVELOPMENTS, JANUARY 2019–JULY 2024
  • TABLE 153 HELUKABEL: COMPANY OVERVIEW
  • TABLE 154 HELUKABEL: PRODUCTS OFFERED
  • TABLE 155 LS CABLE & SYSTEM: COMPANY OVERVIEW
  • TABLE 156 LS CABLE & SYSTEM: PRODUCTS OFFERED
  • TABLE 157 LS CABLE & SYSTEM: PRODUCT LAUNCHES, JANUARY 2019–JULY 2024
  • TABLE 158 LS CABLE & SYSTEM: DEALS, JANUARY 2019–JULY 2024
  • TABLE 159 NEXANS: COMPANY OVERVIEW
  • TABLE 160 NEXANS: PRODUCTS OFFERED
  • TABLE 161 NEXANS: PRODUCT LAUNCHES, JANUARY 2019–JULY 2024
  • TABLE 162 NEXANS: DEALS, JANUARY 2019–JULY 2024
  • TABLE 163 NEXANS: OTHER DEVELOPMENTS, JANUARY 2019–JULY 2024
  • TABLE 164 SAREL: COMPANY OVERVIEW
  • TABLE 165 REMEE WIRE & CABLE: COMPANY OVERVIEW
  • TABLE 166 HUBBELL: COMPANY OVERVIEW
  • TABLE 167 TRATOS GROUP: COMPANY OVERVIEW
  • TABLE 168 DONCASTER CABLES: COMPANY OVERVIEW
  • TABLE 169 TT CABLES: COMPANY OVERVIEW
  • TABLE 170 BRUGG CABLES: COMPANY OVERVIEW
  • TABLE 171 STUDER CABLES AG: COMPANY OVERVIEW
  • TABLE 172 HENAN CENTRAL PLAIN CABLES AND WIRES CO., LTD.: COMPANY OVERVIEW
  • TABLE 173 CORDS CABLE: COMPANY OVERVIEW
LIST OF FIGURES
 
  • FIGURE 1 WIRE & CABLE MARKET SEGMENTATION
  • FIGURE 2 WIRE & CABLE MARKET: RESEARCH DESIGN
  • FIGURE 3 MARKET SIZE ESTIMATION METHODOLOGY: BOTTOM-UP APPROACH
  • FIGURE 4 MARKET SIZE ESTIMATION METHODOLOGY: TOP-DOWN APPROACH
  • FIGURE 5 WIRE & CABLE MARKET: DATA TRIANGULATION
  • FIGURE 6 ELECTRONIC WIRES ACCOUNTED FOR HIGHEST MARKET SHARE IN 2023
  • FIGURE 7 METAL SEGMENT REGISTERED HIGHEST MARKET SHARE IN 2023
  • FIGURE 8 LOW VOLTAGE WIRE & CABLE ACCOUNTED FOR LARGEST SHARE IN 2023
  • FIGURE 9 OVERHEAD INSTALLATION LED MARKET IN 2023
  • FIGURE 10 ENERGY & POWER SEGMENT DOMINATED MARKET IN 2023
  • FIGURE 11 ASIA PACIFIC TO BE FASTEST–GROWING REGION DURING FORECAST PERIOD
  • FIGURE 12 RISING INVESTMENTS IN OFFSHORE WIND ENERGY PROJECTS TO BOOST DEMAND FOR WIRES & CABLES
  • FIGURE 13 ENERGY & POWER END-USE INDUSTRY & ASIA PACIFIC DOMINATED MARKET IN 2023
  • FIGURE 14 ELECTRONIC WIRES TO HOLD LARGEST SHARE IN 2029
  • FIGURE 15 METAL SEGMENT EXPECTED TO DOMINATE MARKET IN 2029
  • FIGURE 16 LOW VOLTAGE WIRE & CABLE SEGMENT TO DOMINATE MARKET IN 2029
  • FIGURE 17 OVERHEAD WIRE & CABLE SEGMENT TO HOLD LARGEST SHARE IN 2029
  • FIGURE 18 CHINA TO DOMINATE MARKET DURING FORECAST PERIOD
  • FIGURE 19 WIRE & CABLE MARKET: DRIVES, RESTRAINTS, OPPORTUNITIES, AND CHALLENGES
  • FIGURE 20 RENEWABLE ENERGY PRODUCTION CONTRIBUTION IN TOTAL ELECTRICITY PRODUCTION IN US, BY SOURCE TYPE, 2023
  • FIGURE 21 TOTAL OFFSHORE WIND INSTALLATIONS, 2023
  • FIGURE 22 WIRE & CABLE MARKET: PORTER’S FIVE FORCES ANALYSIS
  • FIGURE 23 INFLUENCE OF STAKEHOLDERS ON BUYING PROCESS FOR TOP THREE END-USE INDUSTRIES
  • FIGURE 24 KEY BUYING CRITERIA FOR TOP THREE END-USE INDUSTRIES
  • FIGURE 25 WIRE & CABLE MARKET: SUPPLY CHAIN ANALYSIS
  • FIGURE 26 WIRE & CABLE MARKET: VALUE CHAIN ANALYSIS
  • FIGURE 27 WIRE & CABLE MARKET: KEY STAKEHOLDERS IN ECOSYSTEM
  • FIGURE 28 WIRE & CABLE MARKET: ECOSYSTEM
  • FIGURE 29 AVERAGE SELLING PRICE TREND OF KEY PLAYERS, BY END-USE INDUSTRY
  • FIGURE 30 IMPORT FOR HS CODE 761410, BY KEY COUNTRY, 2019–2023 (USD MILLION)
  • FIGURE 31 EXPORT FOR HS CODE 761410, BY KEY COUNTRY, 2019–2023 (USD MILLION)
  • FIGURE 32 PATENT ANALYSIS, BY DOCUMENT TYPE
  • FIGURE 33 PATENT PUBLICATION TREND, 2018−2023
  • FIGURE 34 WIRE & CABLE MARKET: LEGAL STATUS OF PATENTS
  • FIGURE 35 CHINESE JURISDICTION REGISTERED HIGHEST NUMBER OF PATENTS BETWEEN 2018 AND 2023
  • FIGURE 36 HITACHI METALS LTD. REGISTERED HIGHEST NUMBER OF PATENTS
  • FIGURE 37 TRENDS/DISRUPTIONS IMPACTING CUSTOMER BUSINESS IN WIRE & CABLE MARKET
  • FIGURE 38 DEALS AND FUNDING IN WIRE & CABLE MARKET SOARED IN 2024
  • FIGURE 39 PROMINENT WIRE & CABLE MANUFACTURING FIRMS IN 2024 (USD BILLION)
  • FIGURE 40 ELECTRONIC WIRES SEGMENT TO REGISTER HIGHEST CAGR DURING FORECAST PERIOD
  • FIGURE 41 METAL SEGMENT TO LEAD WIRE & CABLE MARKET DURING FORECAST PERIOD
  • FIGURE 42 UNDERGROUND INSTALLATION SEGMENT TO LEAD WIRE & CABLE MARKET DURING FORECAST PERIOD
  • FIGURE 43 LOW-VOLTAGE SEGMENT TO CONTINUE TO DOMINATE MARKET IN 2029
  • FIGURE 44 ENERGY & POWER INDUSTRY TO DOMINATE WIRE & CABLE MARKET DURING FORECAST PERIOD
  • FIGURE 45 CHINA TO BE FASTEST-GROWING WIRE & CABLE MARKET DURING FORECAST PERIOD
  • FIGURE 46 NORTH AMERICA: WIRE & CABLE MARKET SNAPSHOT
  • FIGURE 47 EUROPE: WIRE & CABLE MARKET SNAPSHOT
  • FIGURE 48 ASIA PACIFIC: WIRE & CABLE MARKET SNAPSHOT
  • FIGURE 49 WIRE & CABLE MARKET: REVENUE ANALYSIS OF TOP 5 MARKET PLAYERS
  • FIGURE 50 SHARES OF TOP COMPANIES IN WIRE & CABLE MARKET
  • FIGURE 51 WIRE & CABLE MARKET: TOP TRENDING BRAND/PRODUCTS
  • FIGURE 52 BRAND/PRODUCT COMPARISON, BY WIRE & CABLE PRODUCTS
  • FIGURE 53 WIRE & CABLE MARKET: COMPANY EVALUATION MATRIX (KEY PLAYERS), 2023
  • FIGURE 54 WIRE & CABLE MARKET: COMPANY FOOTPRINT
  • FIGURE 55 WIRE & CABLE MARKET: COMPANY EVALUATION MATRIX (STARTUPS/SMES), 2023
  • FIGURE 56 EV/EBITDA OF KEY MANUFACTURERS
  • FIGURE 57 YEAR-TO-DATE (YTD) PRICE TOTAL RETURN AND 5-YEAR STOCK BETA OF KEY MANUFACTURERS
  • FIGURE 58 BELDEN INC.: COMPANY SNAPSHOT
  • FIGURE 59 FUJIKURA LTD.: COMPANY SNAPSHOT
  • FIGURE 60 FURUKAWA ELECTRIC CO., LTD.: COMPANY SNAPSHOT
  • FIGURE 61 LEONI AG: COMPANY SNAPSHOT
  • FIGURE 62 EMERSON ELECTRIC CO.: COMPANY SNAPSHOT
  • FIGURE 63 PRYSMIAN: COMPANY SNAPSHOT
  • FIGURE 64 HELLENIC CABLES: COMPANY SNAPSHOT
  • FIGURE 65 KEI INDUSTRIES: COMPANY SNAPSHOT
  • FIGURE 66 AMPHENOL: COMPANY SNAPSHOT
  • FIGURE 67 FINOLEX CABLES LTD.: COMPANY SNAPSHOT
  • FIGURE 68 NKT A/S.: COMPANY SNAPSHOT
  • FIGURE 69 SUMITOMO ELECTRIC INDUSTRIES, LTD.: COMPANY SNAPSHOT
  • FIGURE 70 LS CABLE & SYSTEM: COMPANY SNAPSHOT
  • FIGURE 71 NEXANS: COMPANY SNAPSHOT

The study involves two major activities in estimating the current size of the wire & cable market. Exhaustive secondary research was done to collect information on the market, the peer market, and the parent market. The next step was to validate these findings, assumptions, and sizing with industry experts across the value chain through primary research. Both the top-down and bottom-up approaches were employed to estimate the total market size. After that, market breakdown and data triangulation procedures were used to determine the extent of market segments and sub-segments.

Secondary Research

Secondary sources referred to for this research study include financial statements of companies offering wire & cable and information from various trade, business, and professional associations. Secondary research has been used to obtain critical information about the industry’s value chain, the total pool of key players, market classification, and segmentation according to industry trends to the bottom-most level and regional markets. The secondary data was collected and analyzed to arrive at the overall size of the wire & cable market, which was validated by primary respondents.

Primary Research

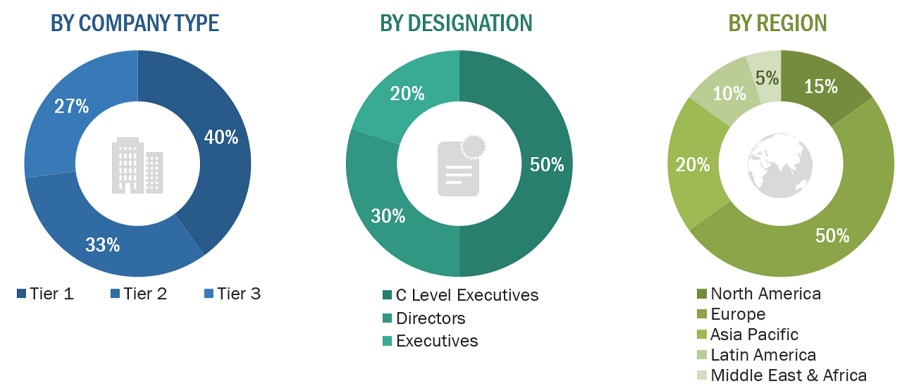
Extensive primary research was conducted after obtaining information regarding the wire & cable market scenario through secondary research. Several primary interviews were conducted with market experts from both the demand and supply sides across major countries of North America, Europe, Asia Pacific, the Middle East & Africa, and Latin America. Primary data was collected through questionnaires, emails, and telephonic interviews. The primary sources from the supply side included various industry experts, such as Chief X Officers (CXOs), Vice Presidents (VPs), Directors from business development, marketing, product development/innovation teams, and related key executives from wire & cable industry vendors; system integrators; component providers; distributors; and key opinion leaders. Primary interviews were conducted to gather insights such as market statistics, data on revenue collected from the products and services, market breakdowns, market size estimations, market forecasting, and data triangulation. Primary research also helped in understanding the various trends related to technology, application, vertical, and region. Stakeholders from the demand side, such as CIOs, CTOs, CSOs, and installation teams of the customer/end users who are using the composites, were interviewed to understand the buyer’s perspective on the suppliers, products, component providers, and their current usage of wire & cables and future outlook of their business which will affect the overall market.

Following is the breakdown of primary respondents:
Wire & Cable Market Size, and Share

Notes: Tiers of companies are selected based on their ownership and revenues in 2023.

Source: Secondary Research, Expert Interviews, and MarketsandMarkets Analysis

To know about the assumptions considered for the study, download the pdf brochure

Market Size Estimation:

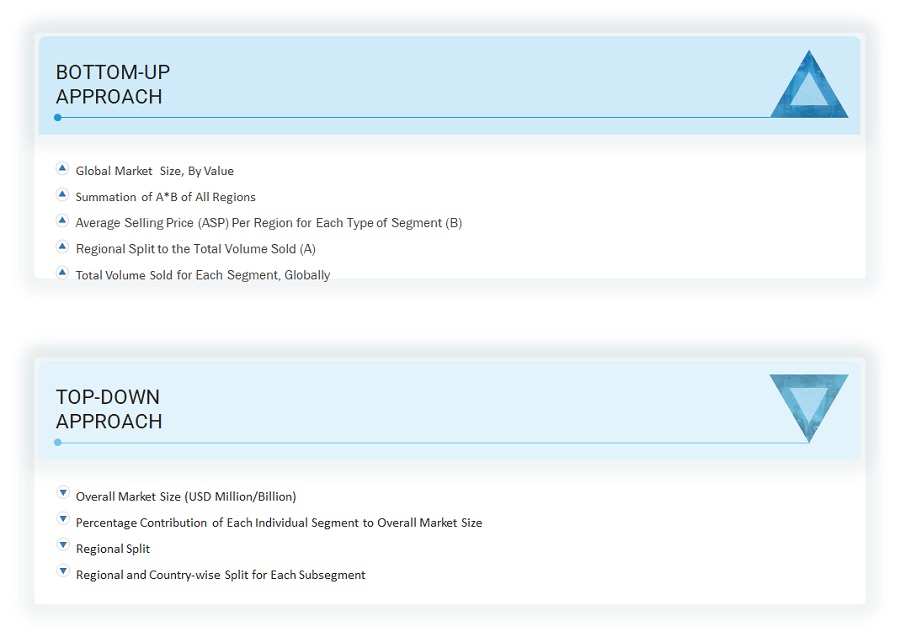
The research methodology used to estimate the size of the wire & cable market includes the following details. The market sizing of the market was undertaken from the demand side. The market was upsized based on procurements and modernizations of wire & cables in different end-use industries at a regional level. Such procurements provide information on the demand aspects of the wire & cable industry for each application. For each application, all possible segments of the wire & cable market were integrated and mapped.
Wire & Cable Market Size: Botton Up Approach

Wire & Cable Market Size, and Share

To know about the assumptions considered for the study, Request for Free Sample Report

Wire & Cable Market Size: Top Down Approach

Wire & Cable Market Size, and Share

Data Triangulation

After arriving at the overall wire & cable market size using the market size estimation processes as explained above, the market was split into several segments and sub-segments. To complete the whole market engineering process and arrive at the exact statistics of each market segment and subsegment, the data triangulation, and market breakdown procedures were employed, wherever applicable. The data was triangulated by studying various factors and trends from both the demand and supply sides, mainly from different end-use industries. Along with this, the market size was validated using both the top-down and bottom-up approaches.

Market Definition

Wires and cables are often used as two different terms but they represent two different electrical conduits. A wire is a single conductor that consists of an electrically conductive material, it can be aluminum or copper. This conductor can consist of a single strand or a number of strands bundled together and can be also bare or have a colored sheath. A cable is simply a collection of many numbers of conductors which are enclosed by some kind of insulation. Wire thickness is expressed in terms of the American Wire Gauge (AWG), which is a system of units of measurement based on the wire diameter. The smaller the number the wider the wire and the more amperage it can handle or conduct. AWG is primarily used for the definition of a single conductor with a single strand of metallic material but it can also be used for stranded and cable conductors.

Key Stakeholders

  • Wire & cable manufacturers and distributors
  • Key end-use industries
  • Research and consulting firms
  • R&D institutions
  • Associations and government institutions
  • Environmental support agencies

Report Objectives

  • To analyze and forecast the global wire & cable market.
  • To provide detailed information about the key factors (drivers, restraints, opportunities, and challenges) influencing the growth of the market
  • To analyze the market segmentation and forecast the market size based on voltage, installation, and end-use industry
  • To strategically analyze the markets with respect to individual growth trends, prospects, and contributions to the global market
  • To analyze the opportunities in the market for stakeholders and provide a competitive landscape for market leaders
  • To analyze competitive development strategies, such as acquisition, new product launch, and expansion in the market
  • To strategically profile key players and comprehensively analyze their market shares and core competencies*

Available Customizations

With the given market data, MarketsandMarkets offers customizations according to the company’s specific needs.

The following customization options are available for the report:

Product Analysis

  • Product matrix, which gives a detailed comparison of the product portfolio of each company

Regional Analysis

  • Further breakdown of Rest of Asia Pacific Wire & cable market
  • Further breakdown of Rest of European Wire & cable market
  • Further breakdown of Rest of North American Wire & cable market
  • Further breakdown of Rest of Middle East & Africa Wire & cable market
  • Further breakdown of Rest of Latin American Wire & cable market

Company Information

  • Detailed analysis and profiling of additional market players (up to 10)

Previous Versions of this Report

"Our USP is "providing game-changing business opportunities reports with free customization" - so please feel free to provide us with your specific areas of interest / business challenges in much greater detail !!"

We appreciate your interest in this report. Once you fill out the form, you'll be immediately directed to an exclusive solution tailored to your needs. This high-value offering can help boost your revenue by 30% - a must-see opportunity for anyone looking to maximize growth.


By clicking the "Submit" button, you are agreeing to the Terms of Use and Privacy Policy.

Custom Market Research Services

We Will Customise The Research For You, In Case The Report Listed Above Does Not Meet With Your Requirements

Get 10% Free Customisation

Growth opportunities and latent adjacency in Wire & Cable Market

DMCA.com Protection Status