Wind Turbine Protection Market

Wind Turbine Protection Market by Equipment (Blades, Nacelles, Towers), Protection Type (Coatings (Epoxy, Polyurethane) and Tapes & Films), End User (Onshore and Offshore), & Region (North America, Europe, APAC, MEA) - Global Forecast to 2029

Report Code: EP 9089 Jul, 2024, by marketsandmarkets.com

[214 Pages Report] The wind turbine protection market is forecast to reach USD 2.8 billion by 2029 from an estimated USD 1.7 billion in 2024, at a CAGR of 10.5% during the forecast period (2024-2029). The expansion of wind energy generation is one of the essential efforts to reduce global warming. However, the competitiveness of wind energy compared to the conventional sources is influenced by the energy costs, which can be influenced by relatively high operational and maintenance costs of wind turbines. Thus, the market dynamics of wind turbine protection depend on growth and advancements in solutions offered by the companies.

Wind Turbine Protection Market

To know about the assumptions considered for the study, Request for Free Sample Report

Wind Turbine Protection Market  Opportunities

To know about the assumptions considered for the study, download the pdf brochure

Wind Turbine Protection Market Dynamics

Driver:  Rising demand for renewable energy sources

Electricity production from renewable sources has seen significant growth in recent years in developed nations. Wind energy is one of the most important methods for producing renewable energy. The increase in the production of energy with the use of renewable sources has many advantages. It ensures vast and continuous supply of energy as well as provides environmental benefits such as very less or almost zero greenhouse gases and carbon emission.

Renewable energy sources are sustainable, and hence, there is no fear of their depletion. Non-renewable sources of energy such as oil, gas, and coal are exhaustive in nature and also cause negative impact on the environment by emitting greenhouse gases and other toxic materials during the energy production process. Emerging economies such Brazil and India are increasing their wind energy production to reduce the burden on non-renewable sources.

It is an important goal for developed and developing countries to reduce the dependence on fossil fuel consumption and focus on renewable sources for generation of power. Thus, the increased number of wind installations is expected to drive the wind turbine protection market.

Restraint: High capital investment of wind turbines installation

Although costs for generating wind power have been falling over the years, the initial capital costs involved in setting up a functional wind power project remain high. As opposed to traditional fuel-based power plants, majority of the costs are not incurred on fuel for the project. More than 70% of the cost is due to the wind turbine alone (of which rotor blade is a part), while the remainder cost is incurred on installation and maintenance of the facility. Hence, companies need to bear the biggest proportion of costs at the start itself, which may be a restraint in initiating new projects. The effect is particularly felt in the recent years when general economic conditions are not upbeat, and investors run shy of investing huge capital. Apart from construction and installation of wind turbines, costs may also increase, depending on the load factor and capacity factor of the turbines, which vary from according to the location of the project and the quality of wind resource. This high initial cost act as the restraining factor for the growth of wind turbine protection market.

Opportunities: Growing R&D towards the improved efficiency of wind protection coating materials

The possibilities of developing improved anti-erosion coatings for wind turbines surface protection using nanoengineered polymers are being pushed by the companies. The companies investing in the R&D of solutions containing graphene and hybrid nano reinforcements for anti-erosion performance. Graphene and hybrid reinforced polymer coatings can give greater erosion protection than non-reinforced polyurethanes, with lifetimes up to multiple times longer.

Apart from extreme weather, the nano-engineered multifunctional coatings materials made of polymer/ceramic composites can also protect blades from lightning strikes that can significantly damage wind turbine blades. These coatings provide an in-situ 3D conductive network, which allows lightning currents to discharge safely.

However, the cost of these advanced techniques is higher compared to the conventional protection solutions. Graphene is an expensive material. High-quality graphene with constant properties is critical for effective reinforcement for producing LEP solutions. Scaling up production of these advanced coating materials, while maintaining quality will remain a cost-intensive process. Further, coating wind turbine blades with graphene-based materials requires specialized techniques and equipment due to their unique properties.

Challenges: Complex maintenance requirements of wind turbines

Wind turbines are huge structures that can reach over 100 meters in height. Accessing the blades for inspection, maintenance, or cleaning necessitates specific equipment and trained personnel.  These turbines operate in harsh conditions, subjected to severe winds, rain, temperature variations, and UV radiation. These conditions exacerbate wear and tear, making maintenance more difficult. To capture the most energy, blades must retain an aerodynamic form. Even a little corrosion or erosion can impair efficiency and degrade overall turbine performance.

Further, detecting possible issues in advance such as cracks, delamination, or lightning strikes before they cause substantial damage demands extensive monitoring of these structures. All these factors pose challenges for the growth of wind turbine protection market.

Wind Turbine Protection Market Ecosystem

Leading companies in this market include well-established, financially secure producers of wind turbine protection. These corporations have been long operating in the market and have a differentiated product portfolio, modern manufacturing technologies, and robust sales and marketing networks. Some of the major companies in this market include BASF SE (Germany), 3M (US), Akzo Nobel N.V. (Netherlands), Trelleborg AB (Sweden), Hempel A/S (Denmark).

Top Companies in Wind Turbine Protection Market

The Coatings segment is expected to be the fastest market by protection type during the forecast period.

By protection type, the wind turbine protection market is divided into Coatings, Tapes & Films. The Coatings segment is expected to be the fastest in the wind turbine protection market. Wind power coatings have been formulated for blades, towers, bolts, and magnets. Most coatings are for blades because they constantly move in the air and are exposed to the weather. Blades need coatings because their pitting can roughen the surfaces enough to create unstable harmonics that decrease a turbine's efficiency, thereby increasing maintenance and repair costs.

By End user, onshore is expected to remain the largest segment during the forecast period.

The onshore segment is expected to remain the largest segment in the wind turbine protection market due to the easy installations which provides easier access for maintenance and repair compared to offshore installations. This reduces the need for specialized equipment and personnel, making the process more cost-effective. Onshore wind turbines often benefit from established infrastructure such as roads, power lines, and communication networks. This reduces the need for additional infrastructure development, which can save costs and time.

“Asia pacific”: The fastest region in the wind turbine protection market.

Asia Pacific is the fastest region in the wind turbine protection market owing to the region experiencing significant population growth and economic development, leading to a corresponding increase in energy demand. The Asia-Pacific region, led by countries like China, India, and Japan, is rapidly expanding its installed wind power capacity to meet growing energy demands and renewable energy targets. The combination of rapid capacity additions, supportive policies, offshore wind expansion, aging turbine fleets, and technological advancements make the Asia-Pacific region the fastest growing market for wind turbine protection solutions.

Asia Pacific Wind Turbine Protection Market  Size, and Share

Key Market Players

The wind turbine protection market is dominated by a few major players that have a wide regional presence. The major players in the wind turbine protection market are Akzo Nobel NV (Netherlands), Hempel A/S (Denmark), BASF SE (Germany), 3M (US), and Trelleborg AB (Sweden). Between 2020 and 2024, strategies such as product launches, contracts, agreements, partnerships, collaborations, alliances, acquisitions, and expansions are followed by these companies to capture a larger share of the wind turbine protection market.

Get online access to the report on the World's First Market Intelligence Cloud

  • Easy to Download Historical Data & Forecast Numbers
  • Company Analysis Dashboard for high growth potential opportunities
  • Research Analyst Access for customization & queries
  • Competitor Analysis with Interactive dashboard
  • Latest News, Updates & Trend analysis
Request Sample

Scope of the Report

Report Metric

Details

Market size available for years

2021–2029

Base year considered

2023

Forecast period

2024–2029

Forecast units

Value (USD)

Segments Covered

Protection type, Equipment, End user

Geographies covered

Asia Pacific, North America, Europe, Middle East & Africa, and South America

Companies covered

3M (US), Hempel A/S (Denmark), Akzo Nobel N.V. (Netherlands), Trelleborg AB (Sweden), BASF SE (Germany), Covestro AG (Germany), The Sherwin-Williams Company (US), Sika AG (Switzerland), Teknos Group (Finland), Jotun (Norway), Polytech (Denmark), PPG Industries, Inc. (US), LM WIND POWER (Denmark),  GEV Wind Power Limited (UK), Mankiewicz (Germany), DuPont (US), Belzona International Ltd. (UK), KRAIBURG Holding SE & Co. KG  (Germany), tesa Tapes (India) Private Limited (Germany), DOPAG INDIA PVT LTD. (Germany), Aerox (Spain), PES-Performance (UK), Thermion (US), Parafix Tapes & Conversions Ltd (UK), Bergolin GmbH & Co. KG (Germany)

This research report categorizes the wind turbine protection market by Protection type, Equipment, End user, and region.

On the basis of Protection type:
  • Coatings
  • Tapes & Films
On the basis of end user:
  • Onshore
  • Offshore
On the basis of equipment:
  • Blades
  • Towers
  • Nacelles
  • Others
On the basis of region:
  • Asia Pacific
  • Europe
  • North America
  • Middle East & Africa
  • South America

Recent Developments

  • In June 2021, Hempel A/S acquired ground-breaking technology from Das Lack Enertherm (DLE) to develop insulation coatings, enhancing worker safety and lowering environmental footprint as part of their Double Impact strategy.
  • In June 2024, AkzoNobel N.V. has opened the world’s first purpose-built wind turbine blade testing facility at its Felling plant in the UK. The facility supports the development of the International protective coatings brand, capable of running rain erosion simulations at 176 meters per second. It includes a 1,000-liter water recycling tank to simulate harsh weather conditions and aims to triple the number of weekly rain erosion tests.
  • In February 2021, BASF contracted EDF Energy North America to enhance the energy balance and reduce CO2 emissions at its Texas production sites. The contract included a 35 MW Wind Power Purchase Agreement (PPA) for two sites and 55 MW Solar PPA for Freeport site.

Frequently Asked Questions (FAQ):

To speak to our analyst for a discussion on the above findings, click Speak to Analyst

TABLE OF CONTENTS
 
1 INTRODUCTION (Page No. - 32)
    1.1 STUDY OBJECTIVES 
    1.2 MARKET DEFINITION 
    1.3 STUDY SCOPE 
           1.3.1 MARKETS COVERED
                    FIGURE 1 WIND TURBINE PROTECTION MARKET SEGMENTATION
           1.3.2 INCLUSIONS AND EXCLUSIONS
           1.3.3 REGIONAL SCOPE
           1.3.4 YEARS CONSIDERED
    1.4 CURRENCY CONSIDERED 
    1.5 UNITS CONSIDERED 
    1.6 LIMITATIONS 
    1.7 STAKEHOLDERS 
    1.8 IMPACT OF RECESSION 
 
2 RESEARCH METHODOLOGY (Page No. - 36)
    2.1 RESEARCH APPROACH 
           FIGURE 2 WIND TURBINE PROTECTION MARKET: RESEARCH DESIGN
    2.2 DATA TRIANGULATION 
           FIGURE 3 DATA TRIANGULATION
           2.2.1 SECONDARY DATA
                    2.2.1.1 Key data from secondary sources
                    2.2.1.2 List of major secondary sources
           2.2.2 PRIMARY DATA
                    2.2.2.1 Key data from primary sources
                    2.2.2.2 Key industry insights
                    2.2.2.3 Participants for primary interviews with experts
                    2.2.2.4 Breakdown of primaries
                               FIGURE 4 KEY METRICS CONSIDERED TO ANALYZE DEMAND FOR WIND TURBINE PROTECTION SOLUTIONS
    2.3 MARKET SIZE ESTIMATION METHODOLOGY 
           2.3.1 BOTTOM-UP APPROACH
                    FIGURE 5 MARKET SIZE ESTIMATION METHODOLOGY: BOTTOM-UP APPROACH
           2.3.2 TOP-DOWN APPROACH
                    FIGURE 6 MARKET SIZE ESTIMATION METHODOLOGY: TOP-DOWN APPROACH
           2.3.3 DEMAND-SIDE ANALYSIS
                    2.3.3.1 Regional analysis
                    2.3.3.2 Country-level analysis
                    2.3.3.3 Assumptions for demand-side analysis
                    2.3.3.4 Calculations for demand-side analysis
           2.3.4 SUPPLY-SIDE ANALYSIS
                    FIGURE 7 KEY STEPS CONSIDERED TO ASSESS SUPPLY OF WIND TURBINE PROTECTION SOLUTIONS
                    FIGURE 8 MARKET: SUPPLY-SIDE ANALYSIS
                    2.3.4.1 Assumptions for supply-side analysis
                    2.3.4.2 Calculations for supply-side analysis
    2.4 FORECAST 
    2.5 RISK ASSESSMENT 
    2.6 RESEARCH ASSUMPTIONS 
    2.7 LIMITATIONS 
    2.8 RECESSION IMPACT 
 
3 EXECUTIVE SUMMARY (Page No. - 49)
    TABLE 1 WIND TURBINE PROTECTION MARKET SNAPSHOT 
    FIGURE 9 ASIA PACIFIC TO REGISTER HIGHEST CAGR IN MARKET DURING FORECAST PERIOD 
    FIGURE 10 OFFSHORE SEGMENT TO REGISTER HIGHER CAGR DURING FORECAST PERIOD 
    FIGURE 11 COATINGS SEGMENT TO ACCOUNT FOR LARGER SHARE OF MARKET IN 2029 
    FIGURE 12 BLADES SEGMENT TO ACCOUNT FOR LARGEST SHARE OF MARKET IN 2029 
 
4 PREMIUM INSIGHTS (Page No. - 52)
    4.1 ATTRACTIVE OPPORTUNITIES FOR PLAYERS IN MARKET 
           FIGURE 13 INCREASING DEMAND FOR RENEWABLE ENERGY TO CREATE GROWTH OPPORTUNITIES FOR MARKET PLAYERS
    4.2 MARKET, BY REGION 
           FIGURE 14 ASIA PACIFIC TO REGISTER HIGHEST CAGR DURING FORECAST PERIOD
    4.3 MARKET IN ASIA PACIFIC,  BY PROTECTION TYPE AND COUNTRY 
           FIGURE 15 COATINGS SEGMENT AND CHINA TO DOMINATE MARKET IN ASIA PACIFIC IN 2024
    4.4 MARKET, BY EQUIPMENT 
           FIGURE 16 BLADES SEGMENT TO HOLD LARGEST MARKET SHARE IN 2029
    4.5 MARKET, BY PROTECTION TYPE 
           FIGURE 17 COATINGS SEGMENT TO DOMINATE MARKET IN 2029
    4.6 MARKET, BY END USER 
           FIGURE 18 ONSHORE SEGMENT TO HOLD LARGER MARKET SHARE IN 2029
 
5 MARKET OVERVIEW (Page No. - 56)
    5.1 INTRODUCTION 
    5.2 MARKET DYNAMICS 
           FIGURE 19 WIND TURBINE PROTECTION MARKET: DRIVERS, RESTRAINTS, OPPORTUNITIES, AND CHALLENGES
           5.2.1 DRIVERS
                    5.2.1.1 Rising electricity production from renewable energy sources
                               FIGURE 20 GLOBAL INSTALLED WIND TURBINE CAPACITY, 2011–2021 (GIGAWATTS)
                    5.2.1.2 Growing demand for protection solutions to extend life and reduce operational cost of wind turbines
           5.2.2 RESTRAINTS
                    5.2.2.1 High investments in wind turbine installation
           5.2.3 OPPORTUNITIES
                    5.2.3.1 Growing research and development (R&D) for improving efficiency of wind protection coating materials
           5.2.4 CHALLENGES
                    5.2.4.1 Development of cost-effective protection materials under stringent environmental regulations
    5.3 TRENDS/DISRUPTIONS IMPACTING CUSTOMERS’ BUSINESSES 
           FIGURE 21 TRENDS/DISRUPTIONS IMPACTING CUSTOMERS’ BUSINESSES
    5.4 VALUE CHAIN ANALYSIS 
           FIGURE 22 WIND TURBINE PROTECTION MARKET: VALUE CHAIN ANALYSIS
    5.5 ECOSYSTEM ANALYSIS 
           TABLE 2 ROLES OF COMPANIES IN WIND TURBINE PROTECTION ECOSYSTEM
           FIGURE 23 PARTICIPANTS IN WIND TURBINE PROTECTION ECOSYSTEM
    5.6 CASE STUDY ANALYSIS 
           5.6.1 COVESTRO WITH ZHUZHOU TIMES NEW MATERIAL TECHNOLOGY (TMT) DEVELOPED AND IMPLEMENTED POLYURETHANE RESIN FOR WIND TURBINE BLADES
           5.6.2 POLYTECH IMPLEMENTED RAIN EROSION TESTER FROM R&D TEST SYSTEMS TO VALIDATE DURABILITY OF PRODUCTS AGAINST RAIN EROSION
           5.6.3 RESEARCHERS MITIGATED RAIN EROSION IMPACT ON WIND TURBINE BLADES IN WESTERN EUROPE BY IMPLEMENTING TARGETED EROSION PROTECTION MEASURES, SUCH AS ADVANCED COATINGS AND BLADE DESIGNS
    5.7 TECHNOLOGY ANALYSIS 
           5.7.1 KEY TECHNOLOGY
                    5.7.1.1 Leading edge protection coatings
           5.7.2 ADJACENT TECHNOLOGY
                    5.7.2.1 Ice prevention coatings
    5.8 TRADE ANALYSIS 
           5.8.1 EXPORT SCENARIO (HS CODE 320890)
                    TABLE 3 EXPORT DATA RELATED TO HS CODE 320890-COMPLIANT PRODUCTS, BY COUNTRY, 2020–2022 (USD THOUSAND)
                    FIGURE 24 EXPORT DATA RELATED TO HS CODE 320890-COMPLIANT PRODUCTS  FOR TOP FIVE COUNTRIES, 2020–2022 (USD THOUSAND)
           5.8.2 IMPORT SCENARIO (HS CODE 320890)
                    TABLE 4 IMPORT DATA RELATED TO HS CODE 320890-COMPLIANT PRODUCTS,  BY COUNTRY, 2020–2022 (USD THOUSAND)
                    FIGURE 25 IMPORT DATA RELATED TO HS CODE 320890-COMPLIANT PRODUCTS  FOR TOP FIVE COUNTRIES, 2020–2022 (USD THOUSAND)
           5.8.3 EXPORT SCENARIO (HS CODE 850231)
                    TABLE 5 EXPORT DATA RELATED TO HS CODE 850231-COMPLIANT PRODUCTS, BY COUNTRY, 2020–2022 (USD THOUSAND)
                    FIGURE 26 EXPORT DATA RELATED TO HS CODE 850231-COMPLIANT PRODUCTS FOR TOP FIVE COUNTRIES, 2020–2022 (USD THOUSAND)
           5.8.4 IMPORT SCENARIO (HS CODE 850231)
                    TABLE 6 IMPORT DATA RELATED TO HS CODE 850231-COMPLIANT PRODUCTS, BY COUNTRY, 2020–2022 (USD THOUSAND)
                    FIGURE 27 IMPORT DATA RELATED TO HS CODE 850231-COMPLIANT PRODUCTS FOR TOP FIVE COUNTRIES, 2020–2022 (USD THOUSAND)
    5.9 PATENT ANALYSIS 
           FIGURE 28 INNOVATIONS AND PATENT REGISTRATIONS PERTAINING WIND TURBINE PROTECTION SOLUTIONS, 2013–2023
           TABLE 7 MARKET: LIST OF PATENTS RELATED TO WIND TURBINE PROTECTION SOLUTIONS, 2017–2024
    5.10 KEY CONFERENCES AND EVENTS, 2023–2024 
           TABLE 8 MARKET: LIST OF CONFERENCES AND EVENTS, 2023–2024
    5.11 PRICING ANALYSIS 
           5.11.1 INDICATIVE PRICING TREND, BY PROTECTION TYPE
                    FIGURE 29 INDICATIVE PRICING TREND OF WIND TURBINE PROTECTION SOLUTIONS,  BY PROTECTION TYPE, 2021–2023 (USD/KG)
                    TABLE 9 INDICATIVE PRICING TREND OF WIND TURBINE PROTECTION SOLUTIONS, BY PROTECTION TYPE, 2021–2023 (USD/KG)
           5.11.2 AVERAGE SELLING PRICE (ASP) TREND, BY REGION
                    TABLE 10 AVERAGE SELLING PRICE (ASP) OF WIND TURBINE PROTECTION SOLUTIONS, BY REGION, 2021–2023 (USD/KG)
                    FIGURE 30 AVERAGE SELLING PRICE (ASP) OF WIND TURBINE PROTECTION SOLUTIONS,  BY REGION, 2021–2023 (USD/KG)
    5.12 INVESTMENT AND FUNDING SCENARIO 
                    FIGURE 31 INVESTMENT AND FUNDING SCENARIO OF PLAYERS IN MARKET, 2024 (USD BILLION)
    5.13 TARIFFS AND REGULATORY LANDSCAPE 
           5.13.1 TARIFF RELATED TO WIND TURBINE PROTECTION SOLUTIONS
                    TABLE 11 IMPORT TARIFF RELATED TO HS 320890-COMPLIANT PRODUCTS, 2022
                    TABLE 12 IMPORT TARIFF RELATED TO HS 850231-COMPLIANT PRODUCTS, 2022
           5.13.2 REGULATORY BODIES, GOVERNMENT AGENCIES, AND OTHER ORGANIZATIONS
                    TABLE 13 NORTH AMERICA: REGULATORY BODIES, GOVERNMENT AGENCIES, AND OTHER ORGANIZATIONS
                    TABLE 14 EUROPE: REGULATORY BODIES, GOVERNMENT AGENCIES, AND OTHER ORGANIZATIONS
                    TABLE 15 ASIA PACIFIC: REGULATORY BODIES, GOVERNMENT AGENCIES, AND OTHER ORGANIZATIONS
                    TABLE 16 ROW: REGULATORY BODIES, GOVERNMENT AGENCIES, AND OTHER ORGANIZATIONS
           5.13.3 CODES AND REGULATIONS
                    TABLE 17 NORTH AMERICA: REGULATIONS
                    TABLE 18 ASIA PACIFIC: REGULATIONS
                    TABLE 19 GLOBAL: CODES AND REGULATIONS
    5.14 PORTER’S FIVE FORCES ANALYSIS 
                    FIGURE 32 MARKET: PORTER’S FIVE FORCES ANALYSIS
                    TABLE 20 MARKET: PORTER’S FIVE FORCES ANALYSIS
           5.14.1 THREAT OF NEW ENTRANTS
           5.14.2 BARGAINING POWER OF SUPPLIERS
           5.14.3 BARGAINING POWER OF BUYERS
           5.14.4 THREAT OF SUBSTITUTES
           5.14.5 INTENSITY OF COMPETITIVE RIVALRY
    5.15 KEY STAKEHOLDERS AND BUYING CRITERIA 
           5.15.1 KEY STAKEHOLDERS IN BUYING PROCESS
                    FIGURE 33 INFLUENCE OF STAKEHOLDERS ON BUYING PROCESS, BY END USER
                    TABLE 21 INFLUENCE OF STAKEHOLDERS ON BUYING PROCESS, BY END USER
           5.15.2 BUYING CRITERIA
                    FIGURE 34 KEY BUYING CRITERIA, BY END USER
                    TABLE 22 KEY BUYING CRITERIA, BY END USER
 
6 WIND TURBINE PROTECTION MARKET, BY PROTECTION TYPE (Page No. - 83)
    6.1 INTRODUCTION 
           FIGURE 35 MARKET, BY PROTECTION TYPE, 2023
           TABLE 23 MARKET, BY PROTECTION TYPE, 2021–2023 (USD MILLION)
           TABLE 24 MARKET, BY PROTECTION TYPE, 2024–2029 (USD MILLION)
    6.2 COATINGS 
           6.2.1 RISING APPLICATIONS OF COATINGS TO ENHANCE DURABILITY AND REDUCE MAINTENANCE COST OF WIND TURBINES INSTALLED IN DIVERSE ENVIRONMENTAL CONDITIONS TO DRIVE MARKET
                    TABLE 25 COATINGS: MARKET, BY REGION,  2021–2023 (USD MILLION)
                    TABLE 26 COATINGS: MARKET, BY REGION,  2024–2029 (USD MILLION)
                    TABLE 27 COATINGS: MARKET, BY TYPE, 2021–2023 (USD MILLION)
                    TABLE 28 COATINGS: MARKET, BY TYPE, 2024–2029 (USD MILLION)
           6.2.2 POLYURETHANE COATINGS
                    6.2.2.1 High durability, adhesion strength, and weather resistance features to drive demand
                               TABLE 29 POLYURETHANE COATINGS: MARKET, BY REGION,  2021–2023 (USD MILLION)
                               TABLE 30 POLYURETHANE COATINGS: MARKET, BY REGION,  2024–2029 (USD MILLION)
           6.2.3 EPOXY COATINGS
                    6.2.3.1 Excellent longevity and reliability features to fuel demand
                               TABLE 31 EPOXY COATINGS: MARKET, BY REGION,  2021–2023 (USD MILLION)
                               TABLE 32 EPOXY COATINGS: MARKET, BY REGION,  2024–2029 (USD MILLION)
           6.2.4 OTHER COATINGS
                    TABLE 33 OTHER COATINGS: MARKET, BY REGION,  2021–2023 (USD MILLION)
                    TABLE 34 OTHER COATINGS: MARKET, BY REGION,  2024–2029 (USD MILLION)
    6.3 TAPES & FILMS 
           6.3.1 EASE OF APPLICATION AND PROTECTION AGAINST EROSION AND UV TO FUEL DEMAND
                    TABLE 35 TAPES & FILMS: MARKET, BY REGION,  2021–2023 (USD MILLION)
                    TABLE 36 TAPES & FILMS: MARKET, BY REGION,  2024–2029 (USD MILLION)
 
7 WIND TURBINE PROTECTION MARKET, BY EQUIPMENT (Page No. - 91)
    7.1 INTRODUCTION 
           FIGURE 36 MARKET, BY EQUIPMENT, 2023
           TABLE 37 MARKET, BY EQUIPMENT, 2021–2023 (USD MILLION)
           TABLE 38 MARKET, BY EQUIPMENT, 2024–2029 (USD MILLION)
    7.2 TOWERS 
           7.2.1 ADVANCEMENTS IN TOWER PROTECTIVE SOLUTIONS TO DRIVE DEMAND
                    TABLE 39 TOWERS: MARKET, BY REGION,  2021–2023 (USD MILLION)
                    TABLE 40 TOWERS: MARKET, BY REGION,  2024–2029 (USD MILLION)
    7.3 BLADES 
           7.3.1 NEED TO PROTECT WIND TURBINE BLADES TO ENSURE EFFICIENCY AND LONGEVITY OF WIND TURBINES TO DRIVE DEMAND
                    TABLE 41 BLADES: MARKET, BY REGION,  2021–2023 (USD MILLION)
                    TABLE 42 BLADES: MARKET, BY REGION,  2024–2029 (USD MILLION)
    7.4 NACELLES 
           7.4.1 USE TO SAFEGUARD CRUCIAL COMPONENTS FROM HARSH ENVIRONMENTAL AND OPERATIONAL STRESSES TO DRIVE MARKET
                    TABLE 43 NACELLES: MARKET, BY REGION,  2021–2023 (USD MILLION)
                    TABLE 44 NACELLES: MARKET, BY REGION,  2024–2029 (USD MILLION)
    7.5 OTHERS 
           TABLE 45 OTHERS: MARKET, BY REGION,  2021–2023 (USD MILLION)
           TABLE 46 OTHERS: MARKET, BY REGION,  2024–2029 (USD MILLION)
 
8 WIND TURBINE PROTECTION MARKET, BY END USER (Page No. - 98)
    8.1 INTRODUCTION 
           FIGURE 37 MARKET, BY END USER, 2023
           TABLE 47 MARKET, BY END USER, 2021–2023 (USD MILLION)
           TABLE 48 MARKET, BY END USER, 2024–2029 (USD MILLION)
    8.2 ONSHORE 
           8.2.1 NEED TO ENHANCE DURABILITY AND PERFORMANCE OF WIND TURBINE COMPONENTS TO FUEL DEMAND
                    TABLE 49 ONSHORE: MARKET, BY REGION,  2021–2023 (USD MILLION)
                    TABLE 50 ONSHORE: MARKET, BY REGION,  2024–2029 (USD MILLION)
    8.3 OFFSHORE 
           8.3.1 NEED FOR ROBUST SOLUTIONS TO WITHSTAND HARSH MARINE ENVIRONMENTS TO DRIVE DEMAND
                    TABLE 51 OFFSHORE: MARKET, BY REGION,  2021–2023 (USD MILLION)
                    TABLE 52 OFFSHORE: MARKET, BY REGION,  2024–2029 (USD MILLION)
 
9 WIND TURBINE PROTECTION MARKET, BY REGION (Page No. - 103)
    9.1 INTRODUCTION 
           FIGURE 38 MARKET IN ASIA PACIFIC TO REGISTER HIGHEST CAGR DURING FORECAST PERIOD
           FIGURE 39 MARKET, BY REGION
           TABLE 53 MARKET, BY REGION, 2021–2023 (USD MILLION)
           TABLE 54 MARKET, BY REGION, 2024–2029 (USD MILLION)
           TABLE 55 MARKET, BY REGION, 2021–2023 (KT)
           TABLE 56 MARKET, BY REGION, 2024–2029 (KT)
    9.2 NORTH AMERICA 
           9.2.1 IMPACT OF RECESSION ON MARKET IN NORTH AMERICA
                    TABLE 57 NORTH AMERICA: MARKET, BY PROTECTION TYPE,  2021–2023 (USD MILLION)
                    TABLE 58 NORTH AMERICA: MARKET, BY PROTECTION TYPE,  2024–2029 (USD MILLION)
                    TABLE 59 NORTH AMERICA: MARKET FOR COATINGS, BY TYPE,  2021–2023 (USD MILLION)
                    TABLE 60 NORTH AMERICA: MARKET FOR COATINGS, BY TYPE,  2024–2029 (USD MILLION)
                    TABLE 61 NORTH AMERICA: MARKET, BY EQUIPMENT,  2021–2023 (USD MILLION)
                    TABLE 62 NORTH AMERICA: MARKET, BY EQUIPMENT,  2024–2029 (USD MILLION)
                    TABLE 63 NORTH AMERICA: MARKET, BY END USER,  2021–2023 (USD MILLION)
                    TABLE 64 NORTH AMERICA: MARKET, BY END USER,  2024–2029 (USD MILLION)
                    TABLE 65 NORTH AMERICA: MARKET, BY COUNTRY,  2021–2023 (USD MILLION)
                    TABLE 66 NORTH AMERICA: MARKET, BY COUNTRY,  2024–2029 (USD MILLION)
                    9.2.1.1 US
                               9.2.1.1.1 Increasing renewable energy mandates and number of sales contracts to propel market
                               TABLE 67 US: MARKET, BY END USER, 2021–2023 (USD MILLION)
                               TABLE 68 US: MARKET, BY END USER, 2024–2029 (USD MILLION)
                    9.2.1.2 Canada
                               9.2.1.2.1 Active government initiatives to reduce greenhouse gas emissions to boost market growth
                               TABLE 69 CANADA: MARKET, BY END USER,  2021–2023 (USD MILLION)N
                               TABLE 70 CANADA: MARKET, BY END USER,  2024–2029 (USD MILLION)
                    9.2.1.3 Mexico
                               9.2.1.3.1 Strategic investments in expanding offshore wind capacities and clean energy commitments to drive market
                               TABLE 71 MEXICO: MARKET, BY END USER,  2021–2023 (USD MILLION)
                               TABLE 72 MEXICO: MARKET, BY END USER,  2024–2029 (USD MILLION)
    9.3 ASIA PACIFIC 
           9.3.1 IMPACT OF RECESSION ON MARKET IN ASIA PACIFIC
                    FIGURE 40 ASIA PACIFIC: MARKET SNAPSHOT
                    TABLE 73 ASIA PACIFIC: MARKET, BY EQUIPMENT,  2021–2023 (USD MILLION)
                    TABLE 74 ASIA PACIFIC: MARKET, BY EQUIPMENT,  2024–2029 (USD MILLION)
                    TABLE 75 ASIA PACIFIC: MARKET, BY END USER,  2021–2023 (USD MILLION)
                    TABLE 76 ASIA PACIFIC: MARKET, BY END USER,  2024–2029 (USD MILLION)
                    TABLE 77 ASIA PACIFIC: MARKET, BY PROTECTION TYPE,  2021–2023 (USD MILLION)
                    TABLE 78 ASIA PACIFIC: MARKET, BY PROTECTION TYPE,  2024–2029 (USD MILLION)
                    TABLE 79 ASIA PACIFIC: MARKET FOR COATINGS, BY TYPE,  2021–2023 (USD MILLION)
                    TABLE 80 ASIA PACIFIC: MARKET FOR COATINGS, BY TYPE,  2024–2029 (USD MILLION)
                    TABLE 81 ASIA PACIFIC: MARKET, BY COUNTRY,  2021–2023 (USD MILLION)
                    TABLE 82 ASIA PACIFIC: MARKET, BY COUNTRY,  2024–2029 (USD MILLION)
           9.3.2 CHINA
                    9.3.2.1 Expanding wind turbine industry to drive demand
                               TABLE 83 CHINA: MARKET, BY END USER, 2021–2023 (USD MILLION)
                               TABLE 84 CHINA: MARKET, BY END USER, 2024–2029 (USD MILLION)
           9.3.3 INDIA
                    9.3.3.1 Promotion of wind power projects through private sector investment by providing various fiscal and financial incentives to drive demand
                               TABLE 85 INDIA: MARKET, BY END USER, 2021–2023 (USD MILLION)
                               TABLE 86 INDIA: MARKET, BY END USER, 2024–2029 (USD MILLION)
           9.3.4 AUSTRALIA
                    9.3.4.1 Presence of onshore wind farms to drive demand
                               TABLE 87 AUSTRALIA: MARKET, BY END USER,  2021–2023 (USD MILLION)
                               TABLE 88 AUSTRALIA: MARKET, BY END USER,  2024–2029 (USD MILLION)
           9.3.5 JAPAN
                    9.3.5.1 Need to diversify energy sources and increased wind power capacity to fuel market growth
                               TABLE 89 JAPAN: MARKET, BY END USER, 2021–2023 (USD MILLION)
                               TABLE 90 JAPAN: MARKET, BY END USER, 2024–2029 (USD MILLION)
           9.3.6 REST OF ASIA PACIFIC
                    TABLE 91 REST OF ASIA PACIFIC: MARKET, BY END USER,  2021–2023 (USD MILLION)
                    TABLE 92 REST OF ASIA PACIFIC: MARKET, BY END USER,  2024–2029 (USD MILLION)
    9.4 SOUTH AMERICA 
           9.4.1 IMPACT OF RECESSION ON MARKET IN SOUTH AMERICA
                    TABLE 93 SOUTH AMERICA: MARKET, BY PROTECTION TYPE,  2021–2023 (USD MILLION)
                    TABLE 94 SOUTH AMERICA: MARKET, BY PROTECTION TYPE,  2024–2029 (USD MILLION)
                    TABLE 95 SOUTH AMERICA: MARKET FOR COATINGS, BY TYPE,  2021–2023 (USD MILLION)
                    TABLE 96 SOUTH AMERICA: MARKET FOR COATINGS, BY TYPE,  2024–2029 (USD MILLION)
                    TABLE 97 SOUTH AMERICA: MARKET, BY EQUIPMENT,  2021–2023 (USD MILLION)
                    TABLE 98 SOUTH AMERICA: MARKET, BY EQUIPMENT,  2024–2029 (USD MILLION)
                    TABLE 99 SOUTH AMERICA: MARKET, BY END USER,  2021–2023 (USD MILLION)
                    TABLE 100 SOUTH AMERICA: MARKET, BY END USER,  2024–2029 (USD MILLION)
                    TABLE 101 SOUTH AMERICA: MARKET, BY COUNTRY,  2021–2023 (USD MILLION)
                    TABLE 102 SOUTH AMERICA: MARKET, BY COUNTRY,  2024–2029 (USD MILLION)
                    9.4.1.1 Brazil
                               9.4.1.1.1 Favorable wind conditions and comprehensive government support to propel market
                               TABLE 103 BRAZIL: MARKET, BY END USER, 2021–2023 (USD MILLION)
                               TABLE 104 BRAZIL: MARKET, BY END USER, 2024–2029 (USD MILLION)
                    9.4.1.2 Argentina
                               9.4.1.2.1 Abundant wind resources to boost market growth
                               TABLE 105 ARGENTINA: MARKET, BY END USER,  2021–2023 (USD MILLION)
                               TABLE 106 ARGENTINA: MARKET, BY END USER,  2024–2029 (USD MILLION)
                    9.4.1.3 Rest of South America
                               TABLE 107 REST OF SOUTH AMERICA: MARKET, BY END USER,  2021–2023 (USD MILLION)
                               TABLE 108 REST OF SOUTH AMERICA: MARKET, BY END USER,  2024–2029 (USD MILLION)
    9.5 MIDDLE EAST & AFRICA 
           9.5.1 IMPACT OF RECESSION ON MARKET IN MIDDLE EAST & AFRICA
                    TABLE 109 MIDDLE EAST & AFRICA: MARKET, BY EQUIPMENT,  2021–2023 (USD MILLION)
                    TABLE 110 MIDDLE EAST & AFRICA: MARKET, BY EQUIPMENT,  2024–2029 (USD MILLION)
                    TABLE 111 MIDDLE EAST & AFRICA: MARKET, BY END USER,  2021–2023 (USD MILLION)
                    TABLE 112 MIDDLE EAST & AFRICA: MARKET, BY END USER,  2024–2029 (USD MILLION)
                    TABLE 113 MIDDLE EAST & AFRICA: MARKET, BY PROTECTION TYPE, 2021–2023 (USD MILLION)
                    TABLE 114 MIDDLE EAST & AFRICA: MARKET, BY PROTECTION TYPE, 2024–2029 (USD MILLION)
                    TABLE 115 MIDDLE EAST & AFRICA: MARKET FOR COATINGS, BY TYPE, 2021–2023 (USD MILLION)
                    TABLE 116 MIDDLE EAST & AFRICA: MARKET FOR COATINGS, BY TYPE, 2024–2029 (USD MILLION)
                    TABLE 117 MIDDLE EAST & AFRICA: MARKET, BY COUNTRY,  2021–2023 (USD MILLION)
                    TABLE 118 MIDDLE EAST & AFRICA: MARKET, BY COUNTRY,  2024–2029 (USD MILLION)
                    9.5.1.1 South Africa
                               9.5.1.1.1 Expansion of renewable energy capacity with several new wind projects in various stages of development to fuel demand
                               TABLE 119 SOUTH AFRICA: MARKET, BY END USER,  2021–2023 (USD MILLION)
                               TABLE 120 SOUTH AFRICA: MARKET, BY END USER,  2024–2029 (USD MILLION)
                    9.5.1.2 Egypt
                               9.5.1.2.1 Expansion of wind farms to drive demand
                               TABLE 121 EGYPT: MARKET, BY END USER, 2021–2023 (USD MILLION)
                               TABLE 122 EGYPT: MARKET, BY END USER, 2024–2029 (USD MILLION)
                    9.5.1.3 Jordan
                               9.5.1.3.1 Strategic focus on renewable energy and upcoming new wind farms to fuel market growth
                               TABLE 123 JORDAN: MARKET, BY END USER,  2021–2023 (USD MILLION)
                               TABLE 124 JORDAN: MARKET, BY END USER,  2024–2029 (USD MILLION)
                    9.5.1.4 Rest of Middle East & Africa
                               TABLE 125 REST OF MIDDLE EAST & AFRICA: MARKET, BY END USER, 2021–2023 (USD MILLION)
                               TABLE 126 REST OF MIDDLE EAST & AFRICA: MARKET, BY END USER, 2024–2029 (USD MILLION)
    9.6 EUROPE 
           9.6.1 IMPACT OF RECESSION ON WIND TURBINE PROTECTION MARKET IN EUROPE
                    FIGURE 41 EUROPE: MARKET SNAPSHOT
                    TABLE 127 EUROPE: MARKET, BY EQUIPMENT,  2021–2023 (USD MILLION)
                    TABLE 128 EUROPE: MARKET, BY EQUIPMENT,  2024–2029 (USD MILLION)
                    TABLE 129 EUROPE: MARKET, BY END USER,  2021–2023 (USD MILLION)
                    TABLE 130 EUROPE: MARKET, BY END USER,  2024–2029 (USD MILLION)
                    TABLE 131 EUROPE: MARKET, BY PROTECTION TYPE,  2021–2023 (USD MILLION)
                    TABLE 132 EUROPE: MARKET, BY PROTECTION TYPE,  2024–2029 (USD MILLION)
                    TABLE 133 EUROPE: MARKET FOR COATINGS, BY TYPE,  2021–2023 (USD MILLION)
                    TABLE 134 EUROPE: MARKET FOR COATINGS, BY TYPE,  2024–2029 (USD MILLION)
                    TABLE 135 EUROPE: MARKET, BY COUNTRY,  2021–2023 (USD MILLION)
                    TABLE 136 EUROPE: MARKET, BY COUNTRY,  2024–2029 (USD MILLION)
                    9.6.1.1 Germany
                               9.6.1.1.1 Increasing wind turbine installations to drive market
                               TABLE 137 GERMANY: MARKET, BY END USER,  2021–2023 (USD MILLION)
                               TABLE 138 GERMANY: MARKET, BY END USER,  2024–2029 (USD MILLION)
                    9.6.1.2 Spain
                               9.6.1.2.1 Expanding onshore and potentially offshore capacities to drive demand
                               TABLE 139 SPAIN: MARKET, BY END USER, 2021–2023 (USD MILLION)
                               TABLE 140 SPAIN: MARKET, BY END USER, 2024–2029 (USD MILLION)
                    9.6.1.3 UK
                               9.6.1.3.1 Presence of extensive offshore farms to drive demand
                               TABLE 141 UK: MARKET, BY END USER, 2021–2023 (USD MILLION)
                               TABLE 142 UK: MARKET, BY END USER, 2024–2029 (USD MILLION)
                    9.6.1.4 France
                               9.6.1.4.1 Increasing onshore and offshore wind turbine installations in northern and western regions to fuel demand
                               TABLE 143 FRANCE: MARKET, BY END USER,  2021–2023 (USD MILLION)
                               TABLE 144 FRANCE: MARKET, BY END USER,  2024–2029 (USD MILLION)
                    9.6.1.5 Sweden
                               9.6.1.5.1 Ambitious decarbonization and electrification goals to drive market
                               TABLE 145 SWEDEN: MARKET, BY END USER,  2021–2023 (USD MILLION)
                               TABLE 146 SWEDEN: MARKET, BY END USER,  2024–2029 (USD MILLION)
                    9.6.1.6 Rest of Europe
                               TABLE 147 REST OF EUROPE: MARKET, BY END USER,  2021–2023 (USD MILLION)
                               TABLE 148 REST OF EUROPE: MARKET, BY END USER,  2024–2029 (USD MILLION)
 
10 COMPETITIVE LANDSCAPE (Page No. - 145)
     10.1 OVERVIEW 
     10.2 KEY PLAYER STRATEGIES/RIGHT TO WIN, 2021–2023 
               TABLE 149 MARKET: OVERVIEW OF STRATEGIES ADOPTED BY KEY PLAYERS, 2021–2023
     10.3 MARKET SHARE ANALYSIS, 2023 
               TABLE 150 MARKET: DEGREE OF COMPETITION, 2023
               FIGURE 42 MARKET SHARE ANALYSIS, 2023
     10.4 REVENUE ANALYSIS, 2019–2023 
               FIGURE 43 REVENUE ANALYSIS OF FIVE KEY PLAYERS, 2019–2023 (USD BILLION)
     10.5 COMPANY EVALUATION MATRIX: KEY PLAYERS, 2023 
             10.5.1 STARS
             10.5.2 EMERGING LEADERS
             10.5.3 PERVASIVE PLAYERS
             10.5.4 PARTICIPANTS
                       FIGURE 44 MARKET: COMPANY EVALUATION MATRIX (KEY PLAYERS), 2023
             10.5.5 COMPANY FOOTPRINT: KEY PLAYERS, 2023
                       10.5.5.1 Overall footprint
                                   FIGURE 45 MARKET: OVERALL FOOTPRINT
                       10.5.5.2 End user footprint
                                   TABLE 151 MARKET: END USER FOOTPRINT
                       10.5.5.3 Region footprint
                                   TABLE 152 MARKET: REGION FOOTPRINT
                       10.5.5.4 Protection type footprint
                                   TABLE 153 MARKET: PROTECTION TYPE FOOTPRINT
                       10.5.5.5 Equipment footprint
                                   TABLE 154 MARKET: EQUIPMENT FOOTPRINT
     10.6 COMPANY EVALUATION MATRIX: STARTUPS/SMES, 2023 
             10.6.1 PROGRESSIVE COMPANIES
             10.6.2 RESPONSIVE COMPANIES
             10.6.3 DYNAMIC COMPANIES
             10.6.4 STARTING BLOCKS
                       FIGURE 46 MARKET: COMPANY EVALUATION MATRIX (STARTUPS/SMES), 2023
             10.6.5 COMPETITIVE BENCHMARKING: STARTUPS/SMES, 2023
                       10.6.5.1 List of key startups/SMEs
                                   TABLE 155 MARKET: LIST OF KEY STARTUPS/SMES
                       10.6.5.2 Competitive benchmarking of key startups/SMEs
                                   TABLE 156 MARKET: COMPETITIVE BENCHMARKING OF KEY STARTUPS/SMES
     10.7 COMPETITIVE SCENARIOS AND TRENDS 
             10.7.1 PRODUCT LAUNCHES
                       TABLE 157 MARKET: PRODUCT LAUNCHES,  FEBRUARY 2019–MARCH 2022
             10.7.2 OTHERS
                       TABLE 158 MARKET: OTHERS, FEBRUARY 2019–MARCH 2022
             10.7.3 DEALS
                       TABLE 159 MARKET: DEALS, FEBRUARY 2019–MARCH 2022
             10.7.4 EXPANSIONS
                       TABLE 160 MARKET: EXPANSIONS, FEBRUARY 2019–MARCH 2022
     10.8 COMPANY VALUATION AND FINANCIAL METRICS 
               FIGURE 47 COMPANY FINANCIAL METRICS OF KEY PLAYERS IN MARKET, 2024
               FIGURE 48 COMPANY VALUATION OF KEY PLAYERS IN MARKET, 2024 (USD BILLION)
     10.9 BRAND/PRODUCT COMPARISON 
               FIGURE 49 BRAND/PRODUCT COMPARISON
 
11 COMPANY PROFILES (Page No. - 162)
(Business overview, Products/Services/Solutions offered, Recent Developments, MNM view)*
     11.1 KEY PLAYERS 
             11.1.1 3M
                       TABLE 161 3M: COMPANY OVERVIEW
                       FIGURE 50 3M: COMPANY SNAPSHOT
                       TABLE 162 3M: PRODUCTS/SERVICES/SOLUTIONS OFFERED
             11.1.2 HEMPEL A/S
                       TABLE 163 HEMPEL A/S: COMPANY OVERVIEW
                       FIGURE 51 HEMPEL A/S: COMPANY SNAPSHOT
                       TABLE 164 HEMPEL A/S: PRODUCTS/SERVICES/SOLUTIONS OFFERED
                       TABLE 165 HEMPEL A/S: PRODUCT LAUNCHES
                       TABLE 166 HEMPEL A/S: DEALS
             11.1.3 AKZO NOBEL N.V.
                       TABLE 167 AKZO NOBEL N.V.: COMPANY OVERVIEW
                       FIGURE 52 AKZO NOBEL N.V.: COMPANY SNAPSHOT
                       TABLE 168 AKZO NOBEL N.V.: PRODUCTS/SERVICES/SOLUTIONS OFFERED
                       TABLE 169 AKZO NOBEL N.V.: EXPANSIONS
             11.1.4 TRELLEBORG AB
                       TABLE 170 TRELLEBORG AB: COMPANY OVERVIEW
                       FIGURE 53 TRELLEBORG AB: COMPANY SNAPSHOT
                       TABLE 171 TRELLEBORG AB: PRODUCTS/SERVICES/SOLUTIONS OFFERED
             11.1.5 BASF SE
                       TABLE 172 BASF SE: COMPANY OVERVIEW
                       FIGURE 54 BASF SE: COMPANY SNAPSHOT
                       TABLE 173 BASF SE: PRODUCTS/SERVICES/SOLUTIONS OFFERED
                       TABLE 174 BASF SE: OTHERS
             11.1.6 COVESTRO AG
                       TABLE 175 COVESTRO AG: COMPANY OVERVIEW
                       FIGURE 55 COVESTRO AG: COMPANY SNAPSHOT
                       TABLE 176 COVESTRO AG: PRODUCTS/SERVICES/SOLUTIONS OFFERED
             11.1.7 THE SHERWIN-WILLIAMS COMPANY
                       TABLE 177 THE SHERWIN-WILLIAMS COMPANY: COMPANY OVERVIEW
                       FIGURE 56 THE SHERWIN-WILLIAMS COMPANY: COMPANY SNAPSHOT
                       TABLE 178 THE SHERWIN-WILLIAMS COMPANY: PRODUCTS/SERVICES/SOLUTIONS OFFERED
                       TABLE 179 THE SHERWIN-WILLIAMS COMPANY: DEALS
                       TABLE 180 THE SHERWIN-WILLIAMS COMPANY: EXPANSIONS
             11.1.8 SIKA AG
                       TABLE 181 SIKA AG: COMPANY OVERVIEW
                       FIGURE 57 SIKA AG: COMPANY SNAPSHOT
                       TABLE 182 SIKA AG: PRODUCTS/SERVICES/SOLUTIONS OFFERED
             11.1.9 TEKNOS GROUP
                       TABLE 183 TEKNOS GROUP: COMPANY OVERVIEW
                       TABLE 184 TEKNOS GROUP: PRODUCTS/SERVICES/SOLUTIONS OFFERED
               11.1.10 JOTUN
                                   TABLE 185 JOTUN: COMPANY OVERVIEW
                                   TABLE 186 JOTUN: PRODUCTS/SERVICES/SOLUTIONS OFFERED
               11.1.11 POLYTECH
                                   TABLE 187 POLYTECH: COMPANY OVERVIEW
                                   TABLE 188 POLYTECH: PRODUCTS/SERVICES/SOLUTIONS OFFERED
                                   TABLE 189 POLYTECH: PRODUCT LAUNCHES
                                   TABLE 190 POLYTECH: DEALS
               11.1.12 PPG INDUSTRIES, INC.
                                   TABLE 191 PPG INDUSTRIES, INC.: COMPANY OVERVIEW
                                   FIGURE 58 PPG INDUSTRIES, INC.: COMPANY SNAPSHOT
                                   TABLE 192 PPG INDUSTRIES, INC.: PRODUCTS/SERVICES/SOLUTIONS OFFERED
                                   TABLE 193 PPG INDUSTRIES, INC.: PRODUCT LAUNCHES
               11.1.13 LM WIND POWER
                                   TABLE 194 LW WIND POWER: COMPANY OVERVIEW
                                   TABLE 195 LM WIND POWER: PRODUCTS/SERVICES/SOLUTIONS OFFERED
               11.1.14 GEV WIND POWER LIMITED
                                   TABLE 196 GEV WIND POWER LIMITED: COMPANY OVERVIEW
                                   TABLE 197 GEV WIND POWER LIMITED: PRODUCTS/SERVICES/SOLUTIONS OFFERED
                                   TABLE 198 GEV WIND POWER LIMITED: DEALS
               11.1.15 MANKIEWICZ
                                   TABLE 199 MANKIEWICZ: COMPANY OVERVIEW
                                   TABLE 200 MANKIEWICZ: PRODUCTS/SERVICES/SOLUTIONS OFFERED
                                   TABLE 201 MANKIEWICZ: DEALS
               11.1.16 DUPONT
                                   TABLE 202 DUPONT: COMPANY OVERVIEW
                                   FIGURE 59 DUPONT: COMPANY SNAPSHOT
                                   TABLE 203 DUPONT: PRODUCTS/SERVICES/SOLUTIONS OFFERED
               11.1.17 BELZONA INTERNATIONAL LTD.
                                   TABLE 204 BELZONA INTERNATIONAL LTD.: COMPANY OVERVIEW
                                   TABLE 205 BELZONA INTERNATIONAL LTD.: PRODUCTS/SERVICES/SOLUTIONS OFFERED
               11.1.18 KRAIBURG HOLDING SE & CO. KG
                                   TABLE 206 KRAIBURG HOLDING SE & CO. KG: COMPANY OVERVIEW
                                   TABLE 207 KRAIBURG HOLDING SE & CO. KG: PRODUCTS/SERVICES/SOLUTIONS OFFERED
               11.1.19 TESA TAPES (INDIA) PRIVATE LIMITED
                                   TABLE 208 TESA TAPES (INDIA) PRIVATE LIMITED: COMPANY OVERVIEW
                                   TABLE 209 TESA TAPES (INDIA) PRIVATE LIMITED: PRODUCTS/SERVICES/SOLUTIONS OFFERED
               11.1.20 DOPAG INDIA PVT LTD.
                                   TABLE 210 DOPAG INDIA PVT LTD.: COMPANY OVERVIEW
                                   TABLE 211 DOPAG INDIA PVT LTD.: PRODUCTS/SERVICES/SOLUTIONS OFFERED
     11.2 OTHER PLAYERS 
             11.2.1 AEROX
             11.2.2 PES-PERFORMANCE
             11.2.3 THERMION
             11.2.4 PARAFIX TAPES & CONVERSIONS LTD
             11.2.5 BERGOLIN GMBH & CO. KG
*Details on Business overview, Products/Services/Solutions offered, Recent Developments, MNM view might not be captured in case of unlisted companies.
 
12 APPENDIX (Page No. - 207)
     12.1 INSIGHTS FROM INDUSTRY EXPERTS 
     12.2 DISCUSSION GUIDE 
     12.3 KNOWLEDGESTORE: MARKETSANDMARKETS’  SUBSCRIPTION PORTAL 
     12.4 CUSTOMIZATION OPTIONS 
     12.5 RELATED REPORTS 
     12.6 AUTHOR DETAILS 

The study involved major activities in estimating the current size of the wind turbine protection  market. Exhaustive secondary research was done to collect information on the peer and parent markets. The next step was to validate these findings, assumptions, and sizing with industry experts across the value chain through primary research. Both top-down and bottom-up approaches were employed to estimate the complete market size. Thereafter, market breakdown and data triangulation were used to estimate the market size of the segments and subsegments.

Secondary Research

This research study on the wind turbine protection  market involved the use of extensive secondary sources, directories, and databases, such as Hoovers, Bloomberg, Businessweek, Factiva, International Energy Agency, and United States Energy Association, to identify and collect information useful for a technical, market-oriented, and commercial study of the global wind turbine protection  market. The other secondary sources included annual reports of the companies involved in the market, press releases & investor presentations of companies, white papers, certified publications, articles by recognized authors, manufacturer associations, trade directories, and databases.
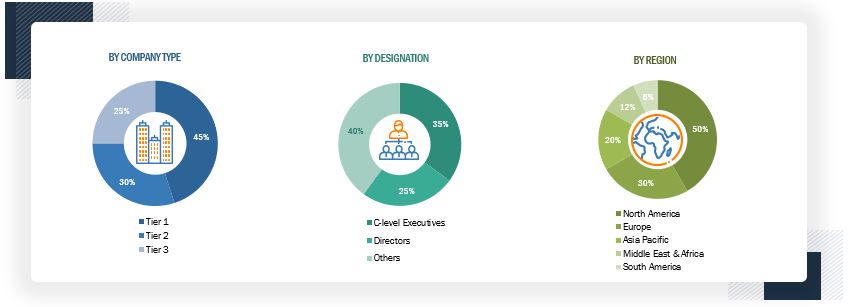
Primary Research

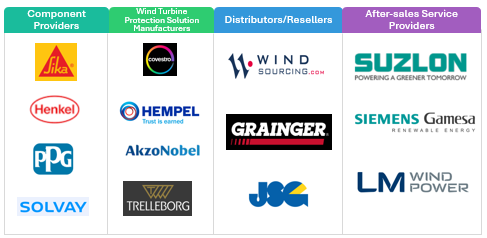
The wind turbine protection  market comprises several stakeholders such as wind turbine protection  manufacturers, wind turbine protection  service companies, suppliers and distributors of wind turbine protection  in the supply chain. The demand side of this market is characterized by the increasing oil & gas exploration activities. The supply side is characterized by rising demand for contracts from the oil & gas sector and mergers & acquisitions among big players. Various primary sources from both the supply and demand sides of the market were interviewed to obtain qualitative and quantitative information.

Following is the breakdown of primary respondents: 

Wind Turbine Protection Market  Size, and Share

To know about the assumptions considered for the study, download the pdf brochure

Market Size Estimation

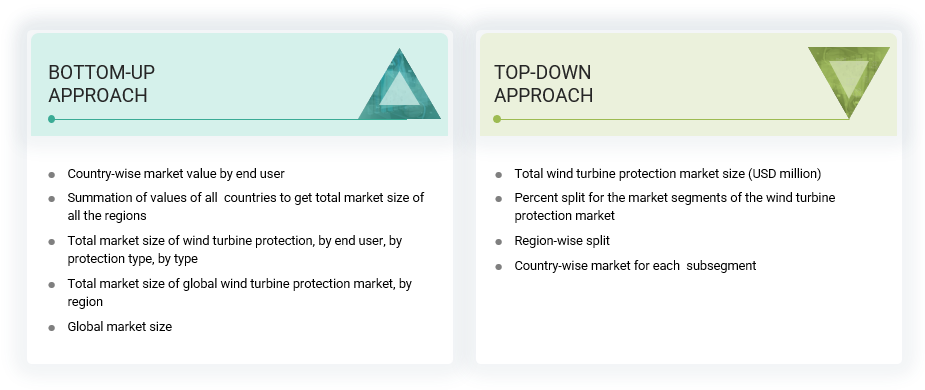
Both top-down and bottom-up approaches were used to estimate and validate the total size of the wind turbine protection  market. These methods were also used extensively to estimate the size of various subsegments in the market. The research methodology used to estimate the market size includes the following:

  • The key players in the industry and market have been identified through extensive secondary research, and their market share in the respective regions has been determined through both secondary and primary research.
  • The industry’s value chain and market size, in terms of value, have been determined through primary and secondary research processes.
  • All percentage shares, splits, and breakdowns have been determined using secondary sources and verified through primaries.

Global Wind Turbine Protection Market Size: Top-down Approach

Wind Turbine Protection Market  Top Down Approach

Global Wind Turbine Protection Market Size: Bottom-Up Approach

Wind Turbine Protection Market  Bottom Up Approach

Data Triangulation

After arriving at the overall market size from the estimation process explained above, the total market has been split into several segments and subsegments. The complete market engineering process is done to arrive at the exact statistics for all the segments and subsegments, also data triangulation and market breakdown processes have been employed, wherever applicable. The data has been triangulated by examining various factors and trends from both the demand- and supply sides. Along with this, the market has been validated through both the top-down and bottom-up approaches.

Market Definition

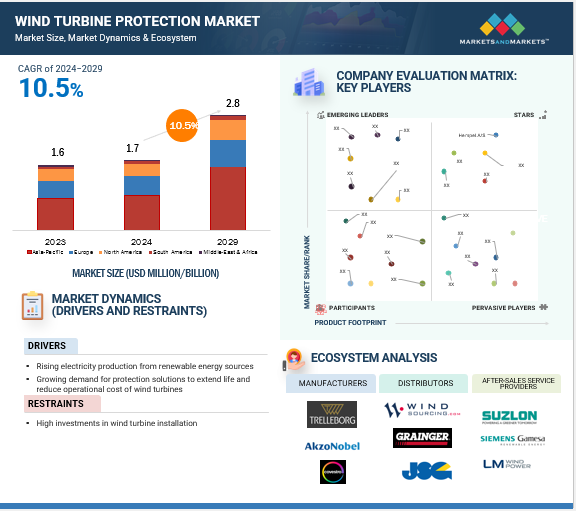
The wind turbine protection market encompasses the materials and technologies designed to safeguard wind turbine components such as blades, nacelle, tower etc. from environmental damage and operational wear. This includes leading-edge protection systems, anti-corrosion coatings, and erosion-resistant materials. These solutions addresses challenges such as rain erosion, UV radiation, and mechanical impacts, which can reduce turbine efficiency and lifespan. The players in this market innovate to enhance the durability and performance of wind turbines, ensuring reliability and reducing maintenance costs, thereby supporting the growth of the renewable energy sector.

Key Stakeholders

  • Wind turbine protection equipment manufacturers
  • Wind turbine manufacturers
  • Wind turbine distributors and suppliers
  • Research institutes and companies.
  • Wind Farm Operators
  • Industry, energy, and environmental associations
  • Renewable Energy Advocates
  • Government and research organizations

Objectives of the Study

  • To define, describe, segment, and forecast the wind turbine protection market, by equipment, protection type, and end user, in terms of value.
  • To define, describe, segment, and forecast the market, by end user and region, in terms of volume.
  • To describe and forecast the market size of various segments across five key regions: North America, South America, Europe, Asia Pacific, and the Middle East & Africa.
  • To provide detailed information regarding the drivers, restraints, opportunities, and challenges influencing the market growth
  • To strategically analyze the market with respect to individual growth trends, prospects, and contributions of each segment to the market
  • To analyze market opportunities for stakeholders and provide a detailed competitive landscape for market leaders.
  • To strategically analyze the regulatory landscape, tariff, standards, patents, Porter’s five forces, import and export scenarios, trade values, and case studies pertaining to the market under study.
  • To strategically profile the key players and comprehensively analyze their market ranking and core competencies*
  • To analyze competitive developments in the wind turbine protection market, such as product launches, contracts, expansions, and mergers & acquisitions.

Available Customizations:

With the given market data, MarketsandMarkets offers customizations as per the client’s specific needs. The following customization options are available for this report:

Geographic Analysis

  • Further breakdown of region or country-specific analysis

Company Information

  • Detailed analyses and profiling of additional market players (up to 5)
Custom Market Research Services

We will customize the research for you, in case the report listed above does not meet with your exact requirements. Our custom research will comprehensively cover the business information you require to help you arrive at strategic and profitable business decisions.

Request Customization
Report Code
EP 9089
Published ON
Jul, 2024
Choose License Type
BUY NOW
  • SHARE
X
Request Customization
Speak to Analyst
Speak to Analyst
OR FACE-TO-FACE MEETING
PERSONALIZE THIS RESEARCH
  • Triangulate with your Own Data
  • Get Data as per your Format and Definition
  • Gain a Deeper Dive on a Specific Application, Geography, Customer or Competitor
  • Any level of Personalization
REQUEST A FREE CUSTOMIZATION
LET US HELP YOU!
  • What are the Known and Unknown Adjacencies Impacting the Wind Turbine Protection Market
  • What will your New Revenue Sources be?
  • Who will be your Top Customer; what will make them switch?
  • Defend your Market Share or Win Competitors
  • Get a Scorecard for Target Partners
CUSTOMIZED WORKSHOP REQUEST
  • Call Us
  • +1-888-600-6441 (Corporate office hours)
  • +1-888-600-6441 (US/Can toll free)
  • +44-800-368-9399 (UK office hours)
CONNECT WITH US
ABOUT TRUST ONLINE
©2024 MarketsandMarkets Research Private Ltd. All rights reserved
DMCA.com Protection Status Website Feedback