Water Bus Market

Water Bus Market by Propulsion (Fully Electric, Fuel-Powered, Hybrid Electric), Capacity (<25 Pax, 26–50 Pax, 51-75 Pax), Operation (Intercity, Intra City), and Region Global Forecast to 2030

Report Code: AS 9153 Sep, 2024, by marketsandmarkets.com

[203 Pages Report] The water bus market is projected to grow from USD 1.22 billion in 2024 to reach a value of USD 1.64 billion by 2030 at a CAGR of 5.1%. The need for eco-friendly and alternative modes of transport, especially in regions with large waterways, drives the need for water buses. Water buses are integrated with the Smart City transport system, which ensures seamless connectivity via real-time tracking and digital ticketing. Such technological developments would drive the popularity of water buses and highlight their exceptional utility as a convenient mode of transport. Other drivers of the market include rapid urbanization, technological advancements, and a rising need for environmental sustainability, spurring the demand for electric and hybrid engines to encourage carbon-free emissions.

Water Bus Market

Water Bus Market

Water Bus Market Forecast to 2030

To know about the assumptions considered for the study, Request for Free Sample Report

Market Dynamics:

Driver: Growing urbanization and population

Due to rapid urbanization and rising population, water transportation has become an important part of urban transportation systems. Water buses offer a comfortable travel experience during peak hours, especially in areas affected by severe traffic congestion. Compared to conventional road transport, water buses, especially electric and hybrid models, are environmentally friendly, with almost negligible contribution to air pollution and climate change. This factor has driven the demand for water buses in recent years.

Restraint: Limited coverage and accessibility of water buses

Water buses are restricted to areas with adequate waterways, which hinders their adoption in regions with limited canal systems or rivers. Also, water bus services require sufficient infrastructure, such as docking facilities and accessible boarding options, which may not be present in all areas. These limitations regulate the effectiveness of water buses as a viable alternative transportation option across regions, which, if not attended to, would act as a long-term restraint for the growth of the global water bus market in the years to come.

Opportunity: Increasing focus on sustainability

As cities and governments seek eco-friendly transportation solutions to reduce carbon emissions and their subsequent environmental impact, water transportation emerges as a viable option. Water buses utilize electric or hybrid propulsion systems, which align well with global sustainability targets and enhance the ‘Green’ goals in cities and towns. This sustained emphasis on promoting sustainable transit options would potentially attract investment and development in water bus services from environmentally conscious consumers and policymakers.

Challenge: High cost of investment

High investment costs are a challenge for the growth of the water bus market. The cost of acquiring vessels, constructing docking facilities, and establishing operational infrastructure can deter potential investors and government agencies from adopting or expanding water bus services. High capital requirements may also impact the pricing of services of water buses, potentially limiting their affordability and accessibility. These factors hinder the adoption of water buses across regions.

Market Ecosystem:

Water Bus Market by Ecosystem

By propulsion, the fuel powered segment is projected to lead the water bus market during the forecast period

By propulsion, the fuel powered segment is projected to account for the largest share of the water bus market during the forecast period. Fuel-powered water buses running on diesel or other traditional fuel types warrant reliability and performance, which makes them dependable and attractive to operators. Despite the growing interest of people in electric or hybrid models of water buses, fuel-powered water buses remain a dominant choice of operators.

By capacity, the 51-75 Pax segment is projected to grow at the highest rate during the forecast period

By capacity, the 51–75 Pax segment is projected to grow at the highest rate during the forecast period. Water buses with a capacity between 51 and 75 passengers guarantee efficient operations in urban environments with varying water conditions. These water buses facilitate enhanced docking, quick turning, and adaptability to different routes. These capabilities enhance their appeal, especially in regions looking to expand or introduce water-based transit solutions.

By operation, the intra city segment is projected to grow at the highest CAGR during the forecast period

By operation, the water bus market is segmented into intercity and intra city. Intra city water buses offer efficient, localized transportation within urban areas. These water buses effectively alleviate road congestion, connect key points within cities, and offer a scenic and enjoyable alternative to traditional transport. Their integration into the public transit system, aided by the increasing demand for sustainable and alternative transportation solutions, makes these water buses a significant catalyst in implementing urban transit strategies.

Europe is estimated to account for the largest share of the water bus market in 2024

Water Bus Market by Region

Water Bus Market by Region

To know about the assumptions considered for the study, download the pdf brochure

Europe is estimated to account for the largest share of the water bus market in 2024. The region’s growth in the market can be attributed to its long-established tradition of using water-based transport services. European cities feature extensive canal systems and rivers, which provide navigable waterways to water vessels of all types. The region’s robust infrastructure, investment in sustainable transport solutions, and high level of urbanization support the growth of its water bus services. All these factors, adding to the region’s focus on environmental sustainability and establishing an efficient public transport system, further drive the expansion of the water bus market in Europe.

Key Market Players:

The major players in the water bus market are Damen Shipyards Group (Netherlands), Icarus Marine (South Africa), Mavi Deniz Çevre Hiz A.S. (Turkey), Incat Crowther (Australia), and Ares Shipyard Inc.(Turkey). These players have adopted organic and inorganic strategies to expand their presence in the water bus market.

Get online access to the report on the World's First Market Intelligence Cloud

  • Easy to Download Historical Data & Forecast Numbers
  • Company Analysis Dashboard for high growth potential opportunities
  • Research Analyst Access for customization & queries
  • Competitor Analysis with Interactive dashboard
  • Latest News, Updates & Trend analysis
Request Sample

Scope of the Report

Report Metric

Details

Market size available for years

2020–2030

Base year considered

2023

Forecast period

2024–2030

Forecast units

Value (USD)

Segments covered

By Propulsion, By Capacity, By Operation, By Region


Geographies covered

North America, Asia Pacific, Europe, Middle East, Latin America & Africa

Companies covered

Damen Shipyards Group (Netherlands), Icarus Marine (South Africa), Mavi Deniz Çevre Hiz A.S. (Turkey), Incat Crowther (Australia), and Ares Shipyard Inc.(Turkey)

Water Bus Market Highlights

This research report categorizes the water bus market based on Propulsion, Capacity, Operation and Region.

Segment

Subsegment

By Propulsion

  • Fuel Powered
  • Fully Electric
  • Hybrid Electric

By Operation

  • Intercity
  • Intracity

By Capacity

  • <25 passenger
  • 25-50 passenger
  • 50- 75 passenger

By Region

  • North America
  • Europe
  • Asia Pacific
  • Middle East
  • Latin America & Africa

Recent Developments:

  • In June 2021, Damen Shipyards Group (Netherlands) and Hydromaster (Netherlands) partnered to develop new ferry thrusters for Blue Amigo, a customer of Damen Shipyards. The companies would deliver nine passenger vessels to Blue Amigo.
  • In January 2024, Damen Shipyards Group (Netherlands) secured a contract to deliver four fully electric passenger ferries to BC Ferries (Canada).
  • In February 2024, Incat Crowther (Australia) signed a contract with Majestic Fast Ferry Pte Ltd. (Singapore) to deliver a new second-generation 39-meter passenger ferry.

FAQs:

To speak to our analyst for a discussion on the above findings, click Speak to Analyst

TABLE OF CONTENTS
 
1 INTRODUCTION (Page No. - 21)
    1.1 STUDY OBJECTIVES 
    1.2 MARKET DEFINITION 
    1.3 STUDY SCOPE 
           1.3.1 MARKET SEGMENTATION
           1.3.2 INCLUSIONS & EXCLUSIONS
    1.4 YEARS CONSIDERED 
    1.5 CURRENCY CONSIDERED 
    1.6 STAKEHOLDERS 
 
2 RESEARCH METHODOLOGY (Page No. - 25)
    2.1 RESEARCH DATA 
           2.1.1 SECONDARY DATA
                    2.1.1.1 Key data from secondary sources
           2.1.2 PRIMARY DATA
                    2.1.2.1 Key data from primary sources
    2.2 FACTOR ANALYSIS 
           2.2.1 INTRODUCTION
           2.2.2 DEMAND-SIDE INDICATORS
           2.2.3 SUPPLY-SIDE ANALYSIS
    2.3 MARKET SIZE ESTIMATION 
    2.4 RESEARCH APPROACH AND METHODOLOGY 
           2.4.1 BOTTOM-UP APPROACH
                    2.4.1.1 Market estimation steps
           2.4.2 TOP-DOWN APPROACH
    2.5 DATA TRIANGULATION 
    2.6 RESEARCH ASSUMPTIONS 
    2.7 RISK ASSESSMENT 
    2.8 RESEARCH LIMITATIONS 
 
3 EXECUTIVE SUMMARY (Page No. - 35)
 
4 PREMIUM INSIGHTS (Page No. - 38)
    4.1 ATTRACTIVE OPPORTUNITIES FOR PLAYERS IN WATER BUS MARKET 
    4.2 WATER BUS MARKET, BY PROPULSION 
    4.3 WATER BUS MARKET, BY CAPACITY 
    4.4 WATER BUS MARKET, BY OPERATION 
    4.5 WATER BUS MARKET, BY COUNTRY 
 
5 MARKET OVERVIEW (Page No. - 41)
    5.1 INTRODUCTION 
    5.2 MARKET DYNAMICS 
           5.2.1 DRIVERS
                    5.2.1.1 Need for alternative travel options due to growing urbanization and population
                    5.2.1.2 Growing water tourism industry
                    5.2.1.3 Rise in government initiatives and funding for sustainable and innovative transportation solutions
                    5.2.1.4 Enhanced urban mobility strategies
                    5.2.1.5 Growth in technological advancements
           5.2.2 RESTRAINTS
                    5.2.2.1 Stringent regulatory and safety standards
                    5.2.2.2 Limited coverage and accessibility
           5.2.3 OPPORTUNITIES
                    5.2.3.1 Modernization and expansion of waterfront infrastructure
                    5.2.3.2 Increasing focus on sustainability
           5.2.4 CHALLENGES
                    5.2.4.1 Need for high investments
                    5.2.4.2 Supply chain disruptions in marine industry
    5.3 TRENDS/DISRUPTIONS IMPACTING CUSTOMER BUSINESS 
    5.4 VALUE CHAIN ANALYSIS 
           5.4.1 RESEARCH & DEVELOPMENT
           5.4.2 RAW MATERIALS
           5.4.3 COMPONENT/PRODUCT MANUFACTURERS (OEMS)
           5.4.4 ASSEMBLERS & INTEGRATORS
           5.4.5 END USERS
    5.5 ECOSYSTEM ANALYSIS 
           5.5.1 PROMINENT COMPANIES
           5.5.2 PRIVATE AND SMALL ENTERPRISES
           5.5.3 END USERS
    5.6 MACROECONOMIC OUTLOOK 
           5.6.1 INTRODUCTION
           5.6.2 NORTH AMERICA: MACROECONOMIC OUTLOOK
           5.6.3 EUROPE: MACROECONOMIC OUTLOOK
           5.6.4 ASIA PACIFIC: MACROECONOMIC OUTLOOK
           5.6.5 MIDDLE EAST: MACROECONOMIC OUTLOOK
           5.6.6 LATIN AMERICA & AFRICA: MACROECONOMIC OUTLOOK
    5.7 PRICING ANALYSIS 
           5.7.1 AVERAGE SELLING PRICE, BY PROPULSION AND CAPACITY
           5.7.2 INDICATIVE PRICING ANALYSIS, BY PROPULSION
    5.8 REGULATORY LANDSCAPE 
    5.9 TRADE ANALYSIS 
           5.9.1 IMPORT SCENARIO OF CRUISE SHIPS, EXCURSION BOATS, FERRYBOATS, CARGO SHIPS, BARGES, AND SIMILAR VESSELS
           5.9.2 EXPORT SCENARIO OF CRUISE SHIPS, EXCURSION BOATS, FERRYBOATS, CARGO SHIPS, BARGES, AND SIMILAR VESSELS
    5.10 TECHNOLOGY ANALYSIS 
           5.10.1 KEY TECHNOLOGIES
                    5.10.1.1 Electric and hybrid propulsion systems
                    5.10.1.2 Advanced navigation systems
           5.10.2 COMPLEMENTARY TECHNOLOGIES
                    5.10.2.1 Automated docking systems
                    5.10.2.2 Advanced safety and security systems
    5.11 KEY STAKEHOLDERS & BUYING CRITERIA 
           5.11.1 KEY STAKEHOLDERS IN BUYING PROCESS
           5.11.2 BUYING CRITERIA
    5.12 USE CASES 
           5.12.1 MODERNIZING CITY TRANSIT WITH HIGH-SPEED, DOUBLE-DECKER PASSENGER FERRY
           5.12.2 WATERTAXI OPERATION SYSTEMS (WOS) FOR WATERTAXI ROTTERDAM
           5.12.3 ENHANCEMENT OF COMMUNICATION OF WATER TAXIS
    5.13 KEY CONFERENCES & EVENTS, 2024–2025 
    5.14 INVESTMENTS AND FUNDING SCENARIO 
    5.15 TOTAL COST OF OWNERSHIP 
    5.16 BUSINESS MODELS 
    5.17 BILL OF MATERIALS 
    5.18 IMPACT OF GENERATIVE AI ON WATER BUS MARKET 
           5.18.1 INTRODUCTION
           5.18.2 ADOPTION OF AI IN MARINE BY TOP COUNTRIES
           5.18.3 IMPACT OF AI ON MARINE SECTOR: USE CASES
           5.18.4 IMPACT OF AI ON WATER BUS MARKET
 
6 INDUSTRY TRENDS (Page No. - 76)
    6.1 INTRODUCTION 
    6.2 TECHNOLOGY TRENDS 
           6.2.1 ELECTRIC AND HYBRID PROPULSION SYSTEMS
           6.2.2 ADVANCED NAVIGATION SYSTEMS
           6.2.3 SMART CONTROL SYSTEMS
           6.2.4 AUTONOMOUS AND SEMI-AUTONOMOUS TECHNOLOGIES
           6.2.5 DIGITAL TWIN SYSTEMS
           6.2.6 AUTOMATED DOCKING SYSTEMS
    6.3 MEGATRENDS AND THEIR IMPACT ON WATER BUS MARKET 
           6.3.1 DIGITALIZATION AND ARTIFICIAL INTELLIGENCE (AI)
           6.3.2 ADVANCED MATERIALS AND MANUFACTURING TECHNOLOGIES
           6.3.3 BIG DATA ANALYTICS
           6.3.4 ENVIRONMENTAL MONITORING SYSTEMS
    6.4 SUPPLY CHAIN ANALYSIS 
    6.5 PATENT ANALYSIS 
 
7 WATER BUS MARKET, BY CAPACITY (Page No. - 85)
    7.1 INTRODUCTION 
    7.2 <25 PAX 
           7.2.1 CHANGING PASSENGER DEMANDS AND OPERATIONAL REQUIREMENTS TO DRIVE MARKET
    7.3 25–50 PAX 
           7.3.1 NEED FOR LOW OPERATIONAL AND MAINTENANCE COSTS TO BOOST DEMAND
    7.4 51–70 PAX 
           7.4.1 NEED FOR EASE OF MANEUVERABILITY TO SPUR DEMAND
 
8 WATER BUS MARKET, BY OPERATION (Page No. - 88)
    8.1 INTRODUCTION 
    8.2 INTERCITY 
           8.2.1 GROWING URBANIZATION AND INCREASED TRAFFIC TO DRIVE MARKET GROWTH
    8.3 INTRA CITY 
           8.3.1 NEED FOR ENHANCED SHORT-HAUL TRANSPORT SERVICES TO DRIVE DEMAND FOR INTRACITY OPERATIONS
 
9 WATER BUS MARKET, BY PROPULSION (Page No. - 91)
    9.1 INTRODUCTION 
           9.1.1 FULLY ELECTRIC
                    9.1.1.1 Increasing demand for sustainable transportation to drive demand for fully electric water buses
           9.1.2 FUEL POWERED
                    9.1.2.1 Low initial cost of fuel-powered water buses to boost their popularity
           9.1.3 HYBRID ELECTRIC
                    9.1.3.1 Hybrid electric water buses use electric and combustion engines to optimize energy use
 
10 WATER BUS MARKET, BY REGION (Page No. - 95)
     10.1 INTRODUCTION 
     10.2 NORTH AMERICA 
             10.2.1 NORTH AMERICA: PESTLE ANALYSIS
             10.2.2 US
                        10.2.2.1 Growth in recreational sea transport to drive market
             10.2.3 CANADA
                        10.2.3.1 Rising emphasis on sustainable transportation to spur demand for water buses
     10.3 EUROPE 
             10.3.1 EUROPE: PESTLE ANALYSIS
             10.3.2 UK
                        10.3.2.1 Presence of major network of inland waterways to drive market
             10.3.3 FRANCE
                        10.3.3.1 Increased investment in R&D to drive market
             10.3.4 FRANCE
                        10.3.4.1 Increased demand for recreational boating to boost market
             10.3.5 DENMARK
                        10.3.5.1 Increasing environmental concerns and focus on sustainability to drive market
             10.3.6 NORWAY
                        10.3.6.1 International maritime organization rule implementation to drive market
             10.3.7 ITALY
                        10.3.7.1 Increasing urban mobility and sustainability concerns to boost growth
             10.3.8 REST OF EUROPE
     10.4 ASIA PACIFIC 
             10.4.1 ASIA PACIFIC: PESTLE ANALYSIS
             10.4.2 CHINA
                        10.4.2.1 Initiatives to promote waterfront infrastructure to drive market
             10.4.3 INDIA
                        10.4.3.1 Growth of maritime industry to boost market
             10.4.4 JAPAN
                        10.4.4.1 Growth of shipbuilding industry to drive market
             10.4.5 SOUTH KOREA
                        10.4.5.1 Emission control regulations to positively impact water bus market
                        10.4.5.2 Rest of Asia Pacific
     10.5 MIDDLE EAST 
             10.5.1 MIDDLE EAST: PESTLE ANALYSIS
             10.5.2 GULF COOPERATION COUNCIL (GCC)
                        10.5.2.1 UAE
                                     10.5.2.1.1 Increasing development of waterfronts and canals to drive market
                        10.5.2.2 Saudi Arabia
                                     10.5.2.2.1 Increasing affordability and ease of travel to drive demand
             10.5.3 REST OF MIDDLE EAST
     10.6 LATIN AMERICA & AFRICA 
             10.6.1 LATIN AMERICA & AFRICA: PESTLE ANALYSIS
             10.6.2 BRAZIL
                        10.6.2.1 Development of smart ports to drive market
             10.6.3 MEXICO
                        10.6.3.1 Rise in urban populations and growth in tourism to drive growth
             10.6.4 AFRICA
                        10.6.4.1 Launch of African Marine Autonomous Research Initiative (AMARI) to boost market
 
11 COMPETITIVE LANDSCAPE (Page No. - 144)
     11.1 INTRODUCTION 
     11.2 KEY PLAYER STRATEGIES/RIGHT TO WIN 
     11.3 MARKET SHARE ANALYSIS 
     11.4 REVENUE ANALYSIS 
     11.5 BRAND COMPARISON 
     11.6 COMPANY EVALUATION MATRIX: KEY PLAYERS, 2023 
             11.6.1 STARS
             11.6.2 EMERGING LEADERS
             11.6.3 PERVASIVE PLAYERS
             11.6.4 PARTICIPANTS
     11.7 COMPANY FOOTPRINT 
     11.8 COMPANY EVALUATION MATRIX: STARTUPS/SMES, 2023 
             11.8.1 PROGRESSIVE COMPANIES
             11.8.2 RESPONSIVE COMPANIES
             11.8.3 DYNAMIC COMPANIES
             11.8.4 STARTING BLOCKS
             11.8.5 COMPETITIVE BENCHMARKING: STARTUPS/SMES, 2023
     11.9 COMPETITIVE SCENARIO 
     11.10 DEALS 
     11.11 OTHER DEVELOPMENTS 
 
12 COMPANY PROFILES (Page No. - 161)
     12.1 INTRODUCTION 
     12.2 KEY PLAYERS 
             12.2.1 DAMEN SHIPYARDS GROUP
                        12.2.1.1 Business overview
                        12.2.1.2 Products/Solutions/Services offered
                        12.2.1.3 Recent developments
                                     12.2.1.3.1 Deals
                                     12.2.1.3.2 Other developments
                        12.2.1.4 MnM view
                                     12.2.1.4.1 Key strengths
                                     12.2.1.4.2 Strategic choices
                                     12.2.1.4.3 Weaknesses & competitive threats
             12.2.2 MAVI DENIZ ÇEVRE HIZ A.S.
                        12.2.2.1 Business overview
                        12.2.2.2 Products/Solutions/Services offered
                        12.2.2.3 MnM view
                                     12.2.2.3.1 Key strengths
                                     12.2.2.3.2 Strategic choices
                                     12.2.2.3.3 Weaknesses & competitive threats
             12.2.3 ARES SHIPYARD INC.
                        12.2.3.1 Business overview
                        12.2.3.2 Products/Solutions/Services offered
                        12.2.3.3 MnM view
                                     12.2.3.3.1 Key strengths
                                     12.2.3.3.2 Strategic choices made
                                     12.2.3.3.3 Weaknesses & competitive threats
             12.2.4 ICARUS MARINE (PTY) LTD.
                        12.2.4.1 Business overview
                        12.2.4.2 Products/Solutions/Services offered
                        12.2.4.3 MnM view
                                     12.2.4.3.1 Key strengths
                                     12.2.4.3.2 Strategic choices made
                                     12.2.4.3.3 Weaknesses & competitive threats
             12.2.5 INCAT CROWTHER
                        12.2.5.1 Business overview
                        12.2.5.2 Products/Solutions/Services offered
                                     12.2.5.2.1 Other developments
                        12.2.5.3 MnM view
                                     12.2.5.3.1 Key strengths
                                     12.2.5.3.2 Strategic choices
                                     12.2.5.3.3 Weaknesses & competitive threats
             12.2.6 NAVALT
                        12.2.6.1 Business overview
                        12.2.6.2 Products/Solutions/Services offered
             12.2.7 MUNSON BOATS
                        12.2.7.1 Business overview
                        12.2.7.2 Products/Solutions/Services offered
             12.2.8 QUER BARCELONA
                        12.2.8.1 Business overview
                        12.2.8.2 Products/Solutions/Services offered
             12.2.9 ENP, S.A.
                        12.2.9.1 Business overview
                        12.2.9.2 Products/Solutions/Services offered
             12.2.10 LITMUS MARINE
                        12.2.10.1 Business overview
                        12.2.10.2 Products/Solutions/Services offered
             12.2.11 CANDELA
                        12.2.11.1 Business overview
                        12.2.11.2 Products/Solutions/Services offered
                        12.2.11.3 Recent developments
                                     12.2.11.3.1 Deals
             12.2.12 SWEDE SHIP
                        12.2.12.1 Business overview
                        12.2.12.2 Products/Solutions/Services offered
             12.2.13 QINGDAO GRANDSEA BOAT CO., LTD
                        12.2.13.1 Business overview
                        12.2.13.2 Products/Solutions/Services offered
             12.2.14 MERCAN YACHTING
                        12.2.14.1 Business overview
                        12.2.14.2 Products/Solutions/Services offered
             12.2.15 STREAMLINE MARINE COMPOSITE DEVELOPMENTS LTD.
                        12.2.15.1 Business overview
                        12.2.15.2 Products/Solutions/Services offered
     12.3 OTHER PLAYERS 
             12.3.1 METAL SHARK
             12.3.2 SEABUBBLES
             12.3.3 WATERBUS
             12.3.4 ARTEMIS TECHNOLOGIES
             12.3.5 WILLARD MARINE INC.
             12.3.6 HYKE (HYDROLIFT SMART CITY FERRIES AS)
             12.3.7 SWIMBUS
             12.3.8 SMART OWN
             12.3.9 MS BOAT
             12.3.10 LONG BEACH TRANSIT
 
13 APPENDIX (Page No. - 197)
     13.1 DISCUSSION GUIDE 
     13.2 KNOWLEDGESTORE: MARKETSANDMARKETS’ SUBSCRIPTION PORTAL 
     13.3 CUSTOMIZATION OPTIONS 
     13.4 RELATED REPORTS 
     13.5 AUTHOR DETAILS 
 
LIST OF TABLES (199 TABLES)
 
TABLE 1 USD EXCHANGE RATES, 2020–2023
TABLE 2 ROLE OF COMPANIES IN MARKET ECOSYSTEM
TABLE 3 INDICATIVE PRICING ANALYSIS FOR WATER BUS PROPULSIONS
TABLE 4 NORTH AMERICA: LIST OF REGULATORY BODIES, GOVERNMENT AGENCIES, AND OTHER AGENCIES
TABLE 5 EUROPE: LIST OF REGULATORY BODIES, GOVERNMENT AGENCIES, AND OTHER AGENCIES
TABLE 6 ASIA PACIFIC: LIST OF REGULATORY BODIES, GOVERNMENT AGENCIES, AND OTHER AGENCIES
TABLE 7 MIDDLE EAST: LIST OF REGULATORY BODIES, GOVERNMENT AGENCIES, AND OTHER AGENCIES
TABLE 8 LATIN AMERICA & AFRICA: LIST OF REGULATORY BODIES, GOVERNMENT AGENCIES, AND OTHER AGENCIES
TABLE 9 IMPORT DATA FOR CRUISE SHIPS, EXCURSION BOATS, FERRYBOATS, CARGO SHIPS, BARGES, AND SIMILAR VESSELS, BY KEY COUNTRY, 2019–2023 (USD THOUSAND)
TABLE 10 EXPORT DATA FOR CRUISE SHIPS, EXCURSION BOATS, FERRYBOATS, CARGO SHIPS, BARGES, AND SIMILAR VESSELS, BY KEY COUNTRY, 2019–2023 (USD THOUSAND)
TABLE 11 INFLUENCE OF STAKEHOLDERS ON BUYING PROCESS FOR OPERATIONS (%)
TABLE 12 KEY BUYING CRITERIA, BY OPERATION
TABLE 13 DETAILED LIST OF CONFERENCES & EVENTS, 2024–2025
TABLE 14 COMPARISON BETWEEN BUSINESS MODELS
TABLE 15 BILL OF MATERIALS FOR WATER BUSES, BY PROPULSION SYSTEM
TABLE 16 IMPACT OF AI ON MARINE APPLICATIONS
TABLE 17 LIST OF MAJOR PATENTS PERTAINING TO WATER VESSELS, 2022–2024
TABLE 18 WATER BUS MARKET, BY CAPACITY, 2020–2023 (USD MILLION)
TABLE 19 WATER BUS MARKET, BY CAPACITY, 2024–2030 (USD MILLION)
TABLE 20 WATER BUS MARKET, BY OPERATION, 2020–2023 (USD MILLION)
TABLE 21 WATER BUS MARKET, BY OPERATION, 2024–2030 (USD MILLION)
TABLE 22 WATER BUS MARKET, BY PROPULSION, 2020–2023 (USD MILLION)
TABLE 23 WATER BUS MARKET, BY PROPULSION, 2024–2030 (USD MILLION)
TABLE 24 WATER BUS MARKET, BY REGION, 2020–2023 (USD MILLION)
TABLE 25 WATER BUS MARKET, BY REGION, 2024–2030 (USD MILLION)
TABLE 26 NORTH AMERICA: WATER BUS MARKET, BY COUNTRY, 2020–2023 (USD MILLION)
TABLE 27 NORTH AMERICA: WATER BUS MARKET, BY COUNTRY, 2024–2030 (USD MILLION)
TABLE 28 NORTH AMERICA: WATER BUS MARKET, BY CAPACITY, 2020–2023 (USD MILLION)
TABLE 29 NORTH AMERICA: WATER BUS MARKET, BY CAPACITY, 2024–2030 (USD MILLION)
TABLE 30 NORTH AMERICA: WATER BUS MARKET, BY PROPULSION, 2020–2023 (USD MILLION)
TABLE 31 NORTH AMERICA: WATER BUS MARKET, BY PROPULSION, 2024–2030 (USD MILLION)
TABLE 32 NORTH AMERICA: WATER BUS MARKET, BY OPERATION, 2020–2023 (USD MILLION)
TABLE 33 NORTH AMERICA: WATER BUS MARKET, BY OPERATION, 2024–2030 (USD MILLION)
TABLE 34 US: WATER BUS MARKET, BY CAPACITY, 2020–2023 (USD MILLION)
TABLE 35 US: WATER BUS MARKET, BY CAPACITY, 2024–2030 (USD MILLION)
TABLE 36 US: WATER BUS MARKET, BY PROPULSION, 2020–2023 (USD MILLION)
TABLE 37 US: WATER BUS MARKET, BY PROPULSION, 2024–2030 (USD MILLION)
TABLE 38 CANADA: WATER BUS MARKET, BY CAPACITY, 2020–2023 (USD MILLION)
TABLE 39 CANADA: WATER BUS MARKET, BY CAPACITY, 2024–2030 (USD MILLION)
TABLE 40 CANADA: WATER BUS MARKET, BY PROPULSION, 2020–2023 (USD MILLION)
TABLE 41 CANADA: WATER BUS MARKET, BY PROPULSION, 2024–2030 (USD MILLION)
TABLE 42 EUROPE: WATER BUS MARKET, BY COUNTRY, 2020–2023 (USD MILLION)
TABLE 43 EUROPE: WATER BUS MARKET, BY COUNTRY, 2024–2030 (USD MILLION)
TABLE 44 EUROPE: WATER BUS MARKET, BY CAPACITY, 2020–2023 (USD MILLION)
TABLE 45 EUROPE: WATER BUS MARKET, BY CAPACITY, 2024–2030 (USD MILLION)
TABLE 46 EUROPE: WATER BUS MARKET, BY PROPULSION, 2020–2023 (USD MILLION)
TABLE 47 EUROPE: WATER BUS MARKET, BY PROPULSION, 2024–2030 (USD MILLION)
TABLE 48 EUROPE: WATER BUS MARKET, BY OPERATION, 2020–2023 (USD MILLION)
TABLE 49 EUROPE: WATER BUS MARKET, BY OPERATION, 2024–2030 (USD MILLION)
TABLE 50 UK: WATER BUS MARKET, BY CAPACITY, 2020–2023 (USD MILLION)
TABLE 51 UK: WATER BUS MARKET, BY CAPACITY, 2024–2030 (USD MILLION)
TABLE 52 UK: WATER BUS MARKET, BY PROPULSION, 2020–2023 (USD MILLION)
TABLE 53 UK: WATER BUS MARKET, BY PROPULSION, 2024–2030 (USD MILLION)
TABLE 54 FRANCE: WATER BUS MARKET, BY CAPACITY, 2020–2023 (USD MILLION)
TABLE 55 FRANCE: WATER BUS MARKET, BY CAPACITY, 2024–2030 (USD MILLION)
TABLE 56 FRANCE: WATER BUS MARKET, BY PROPULSION, 2020–2023 (USD MILLION)
TABLE 57 FRANCE: WATER BUS MARKET, BY PROPULSION, 2024–2030 (USD MILLION)
TABLE 58 GERMANY: WATER BUS MARKET, BY CAPACITY, 2020–2023 (USD MILLION)
TABLE 59 GERMANY: WATER BUS MARKET, BY CAPACITY, 2024–2030 (USD MILLION)
TABLE 60 GERMANY: WATER BUS MARKET, BY PROPULSION, 2020–2023 (USD MILLION)
TABLE 61 GERMANY: WATER BUS MARKET, BY PROPULSION, 2024–2030 (USD MILLION)
TABLE 62 DENMARK: WATER BUS MARKET, BY CAPACITY, 2020–2023 (USD MILLION)
TABLE 63 DENMARK: WATER BUS MARKET, BY CAPACITY, 2024–2030 (USD MILLION)
TABLE 64 DENMARK: WATER BUS MARKET, BY PROPULSION, 2020–2023 (USD MILLION)
TABLE 65 DENMARK: WATER BUS MARKET, BY PROPULSION, 2024–2030 (USD MILLION)
TABLE 66 NORWAY: WATER BUS MARKET, BY CAPACITY, 2020–2023 (USD MILLION)
TABLE 67 NORWAY: WATER BUS MARKET, BY CAPACITY, 2024–2030 (USD MILLION)
TABLE 68 NORWAY: WATER BUS MARKET, BY PROPULSION, 2020–2023 (USD MILLION)
TABLE 69 NORWAY: WATER BUS MARKET, BY PROPULSION, 2024–2030 (USD MILLION)
TABLE 70 ITALY: WATER BUS MARKET, BY CAPACITY, 2020–2023 (USD MILLION)
TABLE 71 ITALY: WATER BUS MARKET, BY CAPACITY, 2024–2030 (USD MILLION)
TABLE 72 ITALY: WATER BUS MARKET, BY PROPULSION, 2020–2023 (USD MILLION)
TABLE 73 ITALY: WATER BUS MARKET, BY PROPULSION, 2024–2030 (USD MILLION)
TABLE 74 REST OF EUROPE: WATER BUS MARKET, BY CAPACITY, 2020–2023 (USD MILLION)
TABLE 75 REST OF EUROPE: WATER BUS MARKET, BY CAPACITY, 2024–2030 (USD MILLION)
TABLE 76 REST OF EUROPE: WATER BUS MARKET, BY PROPULSION, 2020–2023 (USD MILLION)
TABLE 77 REST OF EUROPE: WATER BUS MARKET, BY PROPULSION, 2024–2030 (USD MILLION)
TABLE 78 ASIA PACIFIC: WATER BUS MARKET, BY COUNTRY, 2020–2023 (USD MILLION)
TABLE 79 ASIA PACIFIC: WATER BUS MARKET, BY COUNTRY, 2024–2030 (USD MILLION)
TABLE 80 ASIA PACIFIC: WATER BUS MARKET, BY CAPACITY, 2020–2023 (USD MILLION)
TABLE 81 ASIA PACIFIC: WATER BUS MARKET, BY CAPACITY, 2024–2030 (USD MILLION)
TABLE 82 ASIA PACIFIC: WATER BUS MARKET, BY PROPULSION, 2020–2023 (USD MILLION)
TABLE 83 ASIA PACIFIC: WATER BUS MARKET, BY PROPULSION, 2024–2030 (USD MILLION)
TABLE 84 ASIA PACIFIC: WATER BUS MARKET, BY OPERATION, 2020–2023 (USD MILLION)
TABLE 85 ASIA PACIFIC: WATER BUS MARKET, BY OPERATION, 2024–2030 (USD MILLION)
TABLE 86 CHINA: WATER BUS MARKET, BY CAPACITY, 2020–2023 (USD MILLION)
TABLE 87 CHINA: WATER BUS MARKET, BY CAPACITY, 2024–2030 (USD MILLION)
TABLE 88 CHINA: WATER BUS MARKET, BY PROPULSION, 2020–2023 (USD MILLION)
TABLE 89 CHINA: WATER BUS MARKET, BY PROPULSION, 2024–2030 (USD MILLION)
TABLE 90 INDIA: WATER BUS MARKET, BY CAPACITY, 2020–2023 (USD MILLION)
TABLE 91 INDIA: WATER BUS MARKET, BY CAPACITY, 2024–2030 (USD MILLION)
TABLE 92 INDIA: WATER BUS MARKET, BY PROPULSION, 2020–2023 (USD MILLION)
TABLE 93 INDIA: WATER BUS MARKET, BY PROPULSION, 2024–2030 (USD MILLION)
TABLE 94 JAPAN: WATER BUS MARKET, BY CAPACITY, 2020–2023 (USD MILLION)
TABLE 95 JAPAN: WATER BUS MARKET, BY CAPACITY, 2024–2030 (USD MILLION)
TABLE 96 JAPAN: WATER BUS MARKET, BY PROPULSION, 2020–2023 (USD MILLION)
TABLE 97 JAPAN: WATER BUS MARKET, BY PROPULSION, 2024–2030 (USD MILLION)
TABLE 98 SOUTH KOREA: WATER BUS MARKET, BY CAPACITY, 2020–2023 (USD MILLION)
TABLE 99 SOUTH KOREA: WATER BUS MARKET, BY CAPACITY, 2024–2030 (USD MILLION)
TABLE 100 SOUTH KOREA: WATER BUS MARKET, BY PROPULSION, 2020–2023 (USD MILLION)
TABLE 101 SOUTH KOREA: WATER BUS MARKET, BY PROPULSION, 2024–2030 (USD MILLION)
TABLE 102 REST OF ASIA PACIFIC: WATER BUS MARKET, BY CAPACITY, 2020–2023 (USD MILLION)
TABLE 103 REST OF ASIA PACIFIC: WATER BUS MARKET, BY CAPACITY, 2024–2030 (USD MILLION)
TABLE 104 REST OF ASIA PACIFIC: WATER BUS MARKET, BY PROPULSION, 2020–2023 (USD MILLION)
TABLE 105 REST OF ASIA PACIFIC: WATER BUS MARKET, BY PROPULSION, 2024–2030 (USD MILLION)
TABLE 106 MIDDLE EAST: WATER BUS MARKET, BY COUNTRY, 2020–2023 (USD MILLION)
TABLE 107 MIDDLE EAST: WATER BUS MARKET, BY COUNTRY, 2024–2030 (USD MILLION)
TABLE 108 MIDDLE EAST: WATER BUS MARKET, BY CAPACITY, 2020–2023 (USD MILLION)
TABLE 109 MIDDLE EAST: WATER BUS MARKET, BY CAPACITY, 2024–2030 (USD MILLION)
TABLE 110 MIDDLE EAST: WATER BUS MARKET, BY PROPULSION, 2020–2023 (USD MILLION)
TABLE 111 MIDDLE EAST: WATER BUS MARKET, BY PROPULSION, 2024–2030 (USD MILLION)
TABLE 112 MIDDLE EAST: WATER BUS MARKET, BY OPERATION, 2020–2023 (USD MILLION)
TABLE 113 MIDDLE EAST: WATER BUS MARKET, BY OPERATION, 2024–2030 (USD MILLION)
TABLE 114 UAE: WATER BUS MARKET, BY CAPACITY, 2020–2023 (USD MILLION)
TABLE 115 UAE: WATER BUS MARKET, BY CAPACITY, 2024–2030 (USD MILLION)
TABLE 116 UAE: WATER BUS MARKET, BY PROPULSION, 2020–2023 (USD MILLION)
TABLE 117 UAE: WATER BUS MARKET, BY PROPULSION, 2024–2030 (USD MILLION)
TABLE 118 SAUDI ARABIA: WATER BUS MARKET, BY CAPACITY, 2020–2023 (USD MILLION)
TABLE 119 SAUDI ARABIA: WATER BUS MARKET, BY CAPACITY, 2024–2030 (USD MILLION)
TABLE 120 SAUDI ARABIA: WATER BUS MARKET, BY PROPULSION, 2020–2023 (USD MILLION)
TABLE 121 SAUDI ARABIA: WATER BUS MARKET, BY PROPULSION, 2024–2030 (USD MILLION)
TABLE 122 REST OF MIDDLE EAST: WATER BUS MARKET, BY CAPACITY, 2020–2023 (USD MILLION)
TABLE 123 REST OF MIDDLE EAST: WATER BUS MARKET, BY CAPACITY, 2024–2030 (USD MILLION)
TABLE 124 REST OF MIDDLE EAST: WATER BUS MARKET, BY PROPULSION, 2020–2023 (USD MILLION)
TABLE 125 REST OF MIDDLE EAST: WATER BUS MARKET, BY PROPULSION, 2024–2030 (USD MILLION)
TABLE 126 LATIN AMERICA & AFRICA: WATER BUS MARKET, BY COUNTRY, 2020–2023 (USD MILLION)
TABLE 127 LATIN AMERICA & AFRICA: WATER BUS MARKET, BY COUNTRY, 2024–2030 (USD MILLION)
TABLE 128 LATIN AMERICA & AFRICA: WATER BUS MARKET, BY CAPACITY, 2020–2023 (USD MILLION)
TABLE 129 LATIN AMERICA & AFRICA: WATER BUS MARKET, BY CAPACITY, 2024–2030 (USD MILLION)
TABLE 130 LATIN AMERICA & AFRICA: WATER BUS MARKET, BY PROPULSION, 2020–2023 (USD MILLION)
TABLE 131 LATIN AMERICA & AFRICA: WATER BUS MARKET, BY PROPULSION, 2024–2030 (USD MILLION)
TABLE 132 LATIN AMERICA & AFRICA: WATER BUS MARKET, BY OPERATION, 2020–2023 (USD MILLION)
TABLE 133 LATIN AMERICA & AFRICA: WATER BUS MARKET, BY OPERATION, 2024–2030 (USD MILLION)
TABLE 134 BRAZIL: WATER BUS MARKET, BY CAPACITY, 2020–2023 (USD MILLION)
TABLE 135 BRAZIL: WATER BUS MARKET, BY CAPACITY, 2024–2030 (USD MILLION)
TABLE 136 BRAZIL: WATER BUS MARKET, BY PROPULSION, 2020–2023 (USD MILLION)
TABLE 137 BRAZIL: WATER BUS MARKET, BY PROPULSION, 2024–2030 (USD MILLION)
TABLE 138 MEXICO: WATER BUS MARKET, BY CAPACITY, 2020–2023 (USD MILLION)
TABLE 139 MEXICO: WATER BUS MARKET, BY CAPACITY, 2024–2030 (USD MILLION)
TABLE 140 MEXICO: WATER BUS MARKET, BY PROPULSION, 2020–2023 (USD MILLION)
TABLE 141 MEXICO: WATER BUS MARKET, BY PROPULSION, 2024–2030 (USD MILLION)
TABLE 142 AFRICA: WATER BUS MARKET, BY CAPACITY, 2020–2023 (USD MILLION)
TABLE 143 AFRICA: WATER BUS MARKET, BY CAPACITY, 2024–2030 (USD MILLION)
TABLE 144 AFRICA: WATER BUS MARKET, BY PROPULSION, 2020–2023 (USD MILLION)
TABLE 145 AFRICA: WATER BUS MARKET, BY PROPULSION, 2024–2030 (USD MILLION)
TABLE 146 OVERVIEW OF STRATEGIES ADOPTED BY KEY PLAYERS, 2020–2024
TABLE 147 WATER BUS MARKET: DEGREE OF COMPETITION
TABLE 148 COMPANY PROPULSION FOOTPRINT
TABLE 149 COMPANY CAPACITY FOOTPRINT
TABLE 150 COMPANY OPERATION FOOTPRINT
TABLE 151 COMPANY REGIONAL FOOTPRINT
TABLE 152 DETAILED LIST OF STARTUPS/SMES
TABLE 153 COMPETITIVE BENCHMARKING OF STARTUPS/SMES
TABLE 154 WATER BUS MARKET: DEALS, JANUARY 2020–MARCH 2024
TABLE 155 WATER BUS MARKET: OTHER DEVELOPMENTS, JANUARY 2020–MARCH 2024
TABLE 156 DAMEN SHIPYARDS GROUP: COMPANY OVERVIEW
TABLE 157 DAMEN SHIPYARDS GROUP: PRODUCTS/SOLUTIONS/SERVICES OFFERED
TABLE 158 DAMEN SHIPYARDS GROUP: DEALS
TABLE 159 DAMEN SHIPYARDS GROUP: OTHER DEVELOPMENTS
TABLE 160 MAVI DENIZ ÇEVRE HIZ A.S.: COMPANY OVERVIEW
TABLE 161 MAVI DENIZ ÇEVRE HIZ A.S: PRODUCTS/SOLUTIONS/SERVICES OFFERED
TABLE 162 ARES SHIPYARD INC.: COMPANY OVERVIEW
TABLE 163 ARES SHIPYARD INC.: PRODUCTS/SOLUTIONS/SERVICES OFFERED
TABLE 164 ICARUS MARINE (PTY) LTD: COMPANY OVERVIEW
TABLE 165 ICARUS MARINE (PTY) LTD.: PRODUCTS/SOLUTIONS/SERVICES OFFERED
TABLE 166 INCAT CROWTHER: COMPANY OVERVIEW
TABLE 167 INCAT CROWTHER: PRODUCTS/SOLUTIONS/SERVICES OFFERED
TABLE 168 INCAT CROWTHER: OTHER DEVELOPMENTS
TABLE 169 NAVALT: COMPANY OVERVIEW
TABLE 170 NAVALT: PRODUCTS/SOLUTIONS/SERVICES OFFERED
TABLE 171 MUNSON BOATS: COMPANY OVERVIEW
TABLE 172 MUNSON BOATS: PRODUCTS/SOLUTIONS/SERVICES OFFERED
TABLE 173 QUER BARCELONA: COMPANY OVERVIEW
TABLE 174 QUER BARCELONA: PRODUCTS/SOLUTIONS/SERVICES OFFERED
TABLE 175 ENP, S.A.: COMPANY OVERVIEW
TABLE 176 ENP, S.A.: PRODUCTS/SOLUTIONS/SERVICES OFFERED
TABLE 177 LITMUS MARINE: COMPANY OVERVIEW
TABLE 178 LITMUS MARINE: PRODUCTS/SOLUTIONS/SERVICES OFFERED
TABLE 179 CANDELA: COMPANY OVERVIEW
TABLE 180 CANDELA: PRODUCTS/SOLUTIONS/SERVICES OFFERED
TABLE 181 CANDELA: DEALS
TABLE 182 SWEDE SHIP: COMPANY OVERVIEW
TABLE 183 SWEDE SHIP: PRODUCTS/SOLUTIONS/SERVICES OFFERED
TABLE 184 QINGDAO GRANDSEA BOAT CO., LTD: COMPANY OVERVIEW
TABLE 185 QINGDAO GRANDSEA BOAT CO., LTD: PRODUCTS/SOLUTIONS/SERVICES OFFERED
TABLE 186 MERCAN YACHTING: COMPANY OVERVIEW
TABLE 187 MERCAN YACHTING: PRODUCTS/SOLUTIONS/SERVICES OFFERED
TABLE 188 STREAMLINE MARINE COMPOSITE DEVELOPMENTS LTD.: COMPANY OVERVIEW
TABLE 189 STREAMLINE MARINE COMPOSITE DEVELOPMENTS LTD: PRODUCTS/SOLUTIONS/SERVICES OFFERED
TABLE 190 METAL SHARK: COMPANY OVERVIEW
TABLE 191 SEABUBBLES: COMPANY OVERVIEW
TABLE 192 WATERBUS: COMPANY OVERVIEW
TABLE 193 ARTEMIS TECHNOLOGIES: COMPANY OVERVIEW
TABLE 194 WILLARD MARINE INC.: COMPANY OVERVIEW
TABLE 195 HYKE (HYDROLIFT SMART CITY FERRIES AS): COMPANY OVERVIEW
TABLE 196 SWIMBUS: COMPANY OVERVIEW
TABLE 197 SMART OWN: COMPANY OVERVIEW
TABLE 198 MS BOAT: COMPANY OVERVIEW
TABLE 199 LONG BEACH TRANSIT: COMPANY OVERVIEW
 
LIST OF FIGURES (51 FIGURES)
 
FIGURE 1 REPORT PROCESS FLOW
FIGURE 2 RESEARCH DESIGN
FIGURE 3 BREAKDOWN OF PRIMARY INTERVIEWS
FIGURE 4 MARKET SIZE ESTIMATION METHODOLOGY: BOTTOM-UP APPROACH (SUPPLY SIDE)
FIGURE 5 TOP-DOWN APPROACH
FIGURE 6 DATA TRIANGULATION
FIGURE 7 FUEL POWERED SEGMENT TO LEAD MARKET DURING FORECAST PERIOD
FIGURE 8 51–75 PAX SEGMENT TO REGISTER HIGHEST CAGR DURING FORECAST PERIOD
FIGURE 9 INTERCITY SEGMENT TO LEAD MARKET DURING FORECAST PERIOD
FIGURE 10 EUROPE ACCOUNTED FOR LARGEST SHARE IN 2024
FIGURE 11 TECHNOLOGICAL ADVANCEMENTS TO DRIVE POPULARITY OF WATER BUSES
FIGURE 12 FUEL POWERED SEGMENT TO LEAD MARKET IN 2024
FIGURE 13 51–75 PAX SEGMENT TO ACHIEVE HIGHEST GROWTH DURING FORECAST PERIOD
FIGURE 14 INTERCITY SEGMENT TO ACCOUNT FOR LARGEST SHARE DURING FORECAST PERIOD
FIGURE 15 NORWAY TO BE FASTEST-GROWING MARKET DURING FORECAST PERIOD
FIGURE 16 WATER BUS MARKET: DRIVERS, RESTRAINTS, OPPORTUNITIES, AND CHALLENGES
FIGURE 17 TRENDS AND DISRUPTIONS IMPACTING CUSTOMER BUSINESS
FIGURE 18 VALUE CHAIN ANALYSIS
FIGURE 19 ECOSYSTEM ANALYSIS
FIGURE 20 AVERAGE SELLING PRICE, BY PROPULSION AND CAPACITY
FIGURE 21 IMPORT DATA FOR CRUISE SHIPS, EXCURSION BOATS, FERRYBOATS, CARGO SHIPS, BARGES, AND SIMILAR VESSELS, BY KEY COUNTRY, 2019–2023 (USD THOUSAND)
FIGURE 22 EXPORT DATA FOR CRUISE SHIPS, EXCURSION BOATS, FERRYBOATS, CARGO SHIPS, BARGES, AND SIMILAR VESSELS, BY KEY COUNTRY, 2019-2023 (USD THOUSAND)
FIGURE 23 INFLUENCE OF STAKEHOLDERS ON BUYING PROCESS FOR OPERATIONS
FIGURE 24 BUYING CRITERIA FOR KEY OPERATIONS
FIGURE 25 INVESTMENT AND FUNDING SCENARIO, 2020–2024
FIGURE 26 TOTAL COST OF OWNERSHIP FOR WATER BUSES
FIGURE 27 TOTAL COST OF OWNERSHIP (TCO) COMPARISON OF WATER BUSES, BY PROPULSION
FIGURE 28 BILL OF MATERIALS FOR FULLY ELECTRIC WATER BUSES
FIGURE 29 BILL OF MATERIALS FOR FUEL-POWERED WATER BUS
FIGURE 30 BILL OF MATERIALS FOR HYBRID ELECTRIC WATER BUSES
FIGURE 31 USE OF AI IN MARINE INDUSTRY
FIGURE 32 ADOPTION OF AI IN MARINE INDUSTRY BY TOP COUNTRIES
FIGURE 33 IMPACT OF AI ON DIFFERENT MARINE VESSELS
FIGURE 34 IMPACT OF AI ON WATER BUS MARKET
FIGURE 35 WATER BUS MARKET: TECHNOLOGY TRENDS
FIGURE 36 SUPPLY CHAIN ANALYSISC
FIGURE 37 LIST OF MAJOR PATENTS GRANTED FOR WATER VESSELS, 2013–2023
FIGURE 38 WATER BUS MARKET, BY CAPACITY, 2024 VS. 2030 (USD MILLION)
FIGURE 39 WATER BUS MARKET, BY OPERATION 2024 VS. 2030 (USD MILLION)
FIGURE 40 WATER BUS MARKET, BY PROPULSION, 2024 VS. 2030 (USD MILLION)
FIGURE 41 WATER BUS MARKET, BY REGION
FIGURE 42 NORTH AMERICA: WATER BUS MARKET SNAPSHOT
FIGURE 43 EUROPE: WATER BUS MARKET SNAPSHOT
FIGURE 44 ASIA PACIFIC: WATER BUS MARKET SNAPSHOT
FIGURE 45 MIDDLE EAST: WATER BUS MARKET SNAPSHOT
FIGURE 46 LATIN AMERICA & AFRICA: WATER BUS MARKET SNAPSHOT
FIGURE 47 MARKET SHARE ANALYSIS OF TOP PLAYERS, 2023
FIGURE 48 REVENUE ANALYSIS OF KEY PLAYERS, 2020–2023
FIGURE 49 WATER BUS MARKET: COMPANY EVALUATION MATRIX (KEY PLAYERS), 2023
FIGURE 50 COMPANY FOOTPRINT
FIGURE 51 WATER BUS MARKET: COMPANY EVALUATION MATRIX (STARTUPS/SMES), 2023
 

The research study conducted on the water bus market involved the extensive use of secondary sources, directories, and databases, such as D&B Hoovers, Bloomberg, and Factiva, to identify and collect relevant information. Primary sources included industry experts from the market as well as suppliers, manufacturers, solution providers, technology developers, alliances, and organizations related to all segments of the value chain of this industry. In-depth interviews of various primary respondents, including key industry participants, subject matter experts (SMEs), industry consultants, and C-level executives, were conducted to obtain and verify critical qualitative and quantitative information pertaining to the market as well as assess the growth prospects of the market. A deductive approach, also known as the bottom-up approach combined with the top-down approach, was used to forecast the market size of different market segments.

Secondary Research

In the secondary research process, various secondary sources were referred to identify and collect information for this study on the water bus market. Secondary sources included annual reports, press releases, and investor presentations of companies; white papers and certified publications; articles from recognized authors; manufacturers' associations; directories; and databases. Secondary research was mainly used to obtain key information about the supply chain of the marine industry, the monetary chain of the market, the total pool of key players, market classification and segmentation according to the industry trends to the bottom-most level, regional markets, and key developments from both market and technology-oriented perspectives.

Primary Research

Extensive Extensive primary research was conducted to obtain qualitative and quantitative information for this report on the water bus market. Several primary interviews were conducted with market experts from both the demand and supply sides across major regions, namely, North America, Europe, Asia Pacific, the Middle East, Latin America & Africa. Primary sources from the supply side included industry experts such as business development managers, sales heads, technology and innovation directors, and related key executives from various key companies and organizations operating in the autonomous boats market.

Water Bus Market Size, and Share

To know about the assumptions considered for the study, download the pdf brochure

Market Size Estimation

The top-down and bottom-up approaches were used to estimate and validate the size of the autonomous boats market. The research methodology used to estimate the market size includes the following details. Key players in the market were identified through secondary research, and their market share was determined through primary and secondary research. This included a study of the annual and financial reports of top market players and extensive interviews with industry stakeholders such as CEOs, technical advisors, military experts, marine vessel maintenance professionals, and SMEs of leading companies operating in the water bus market.

All percentage shares, splits, and breakdowns were determined using secondary sources and verified through primary sources. All possible parameters that affect the markets covered in this research study were accounted for, viewed in extensive detail, verified through primary research, and analyzed to obtain the final quantitative and qualitative data on the water bus market. This data was consolidated, enhanced with detailed inputs, analyzed by MarketsandMarkets, and presented in this report.

Bottom-Up Approach

The bottom-up approach was employed to determine the overall size of the water bus market. Calculations for the market relied on water bus market were based on regional demand for each country. The bottom-up approach was also implemented to extract secondary research data to validate different market segments' revenues. With the data triangulation procedure and data validation through primaries, the overall sizes of the water bus market from the revenues of key players and their shares in the market and each market segment were determined and confirmed in this study.

Water Bus Market Size, and Bottom-Up Approach

Top-Down Approach

In the top-down approach, the overall market size was used to estimate the size of individual markets (mentioned in market segmentation) through percentage splits based on secondary and primary research.

For calculating the sizes of specific market segments, the most appropriate and immediate parent market size was used to implement the top-down approach. The bottom-up approach was also implemented to validate the market segment revenues obtained.

Market shares were then estimated for each company to verify the revenue shares used earlier in the bottom-up approach. With the data triangulation procedure and validation of data through primaries, the sizes of the parent market and each individual market were determined and confirmed in this study. The data triangulation procedure used for this study is explained in the market breakdown and triangulation section.

Water Bus Market Size, and Top-Down Approach

Data triangulation

After arriving at the overall market size through the market size estimation process explained above, the total market was split into several segments and subsegments. To complete the overall market engineering process and arrive at the exact statistics for market segments and subsegments, market breakdown & data triangulation procedures explained below were implemented, wherever applicable. Data was triangulated by studying various factors and trends from both the demand and supply sides. Along with this, the market size was validated using both top-down and bottom-up approaches.

Market Definition

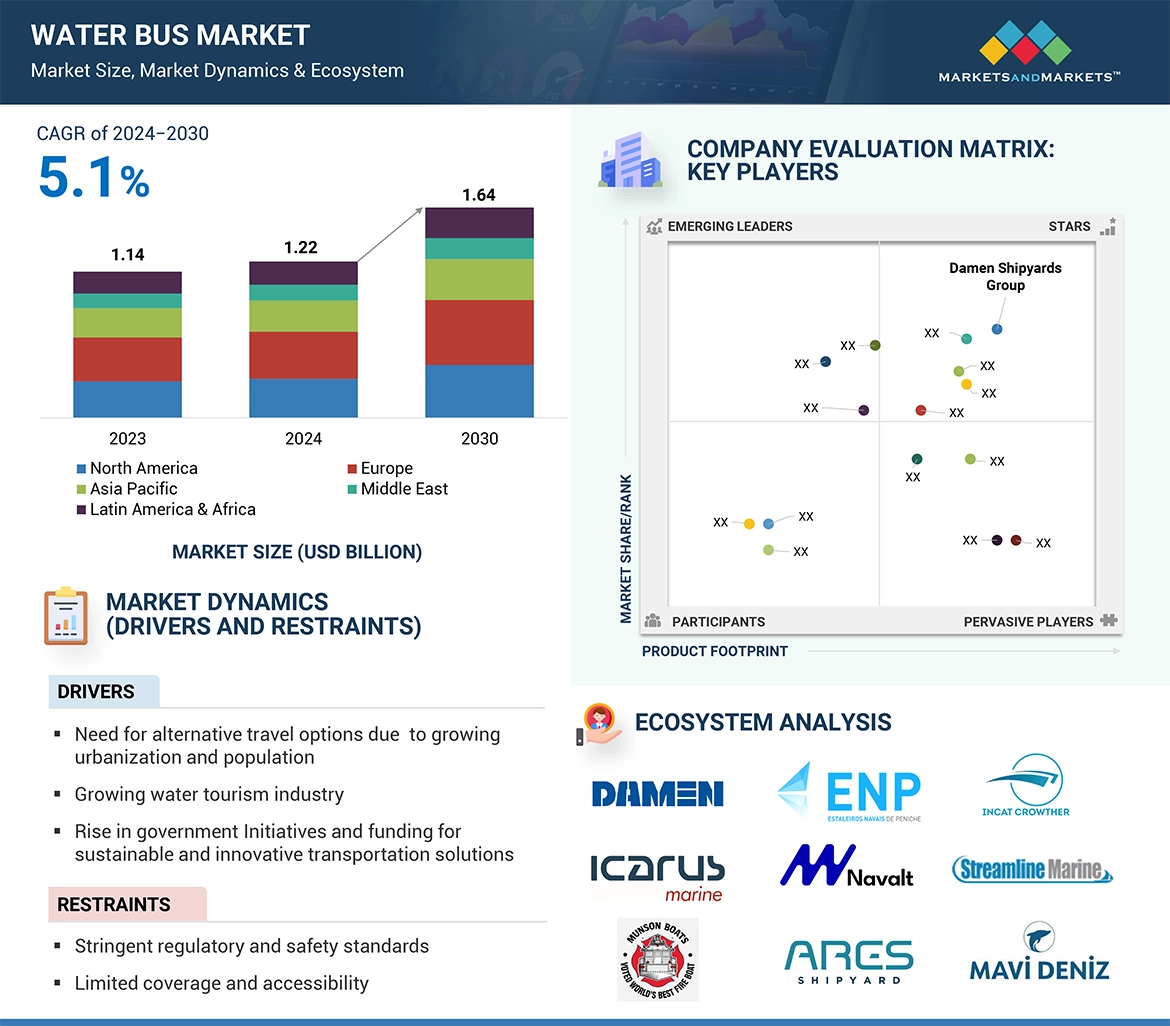
Water bus refers to marine vessels that are used to navigate through rivers, canals, or harbors within cities and tourist areas and accommodating around 50 to 75 people. Water buses  provide public transportation services by offering scheduled or on-demand services, connecting various points along waterways. Water buses follow fixed routes or schedules for commutes and focus on connecting specific points across a waterway, making them suitable for short and longe intercity and intra city travel.

Stakeholders

Various stakeholders of the market are listed below:

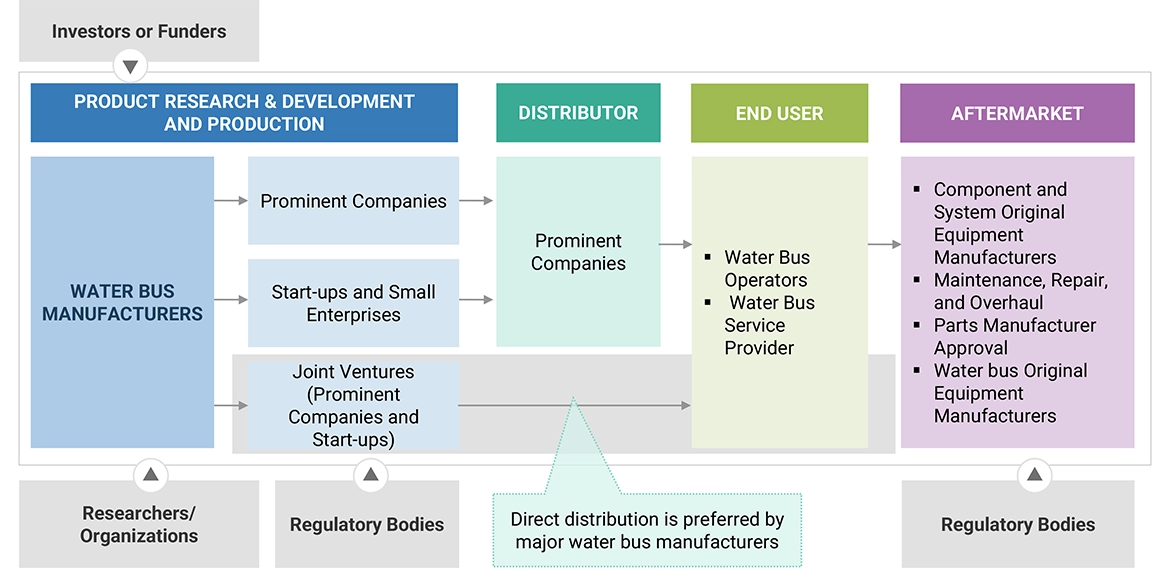
  • Water Bus Manufacturers
  • Subcomponent Manufacturers
  • Water Bus Service Providers
  • Raw Material Suppliers
  • Technology Support Providers
  • System Integrators
  • Government Agencies
  • Commercial Vessel Operators
  • Research Organizations

Report Objectives

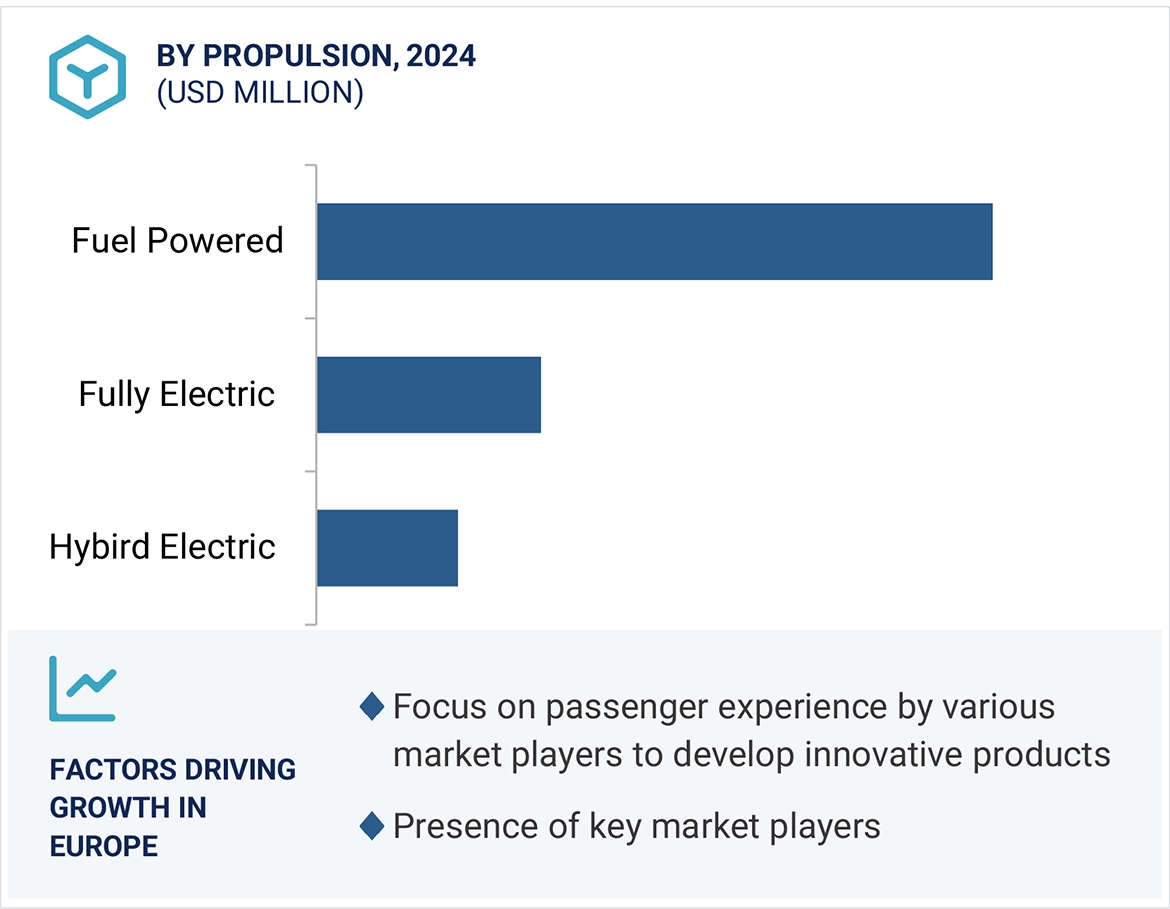
  • To define, describe, segment, and forecast the size of the water bus market based on propulsion, capacity, operation, and region.
  • To analyze the degree of competition in the market by mapping the recent developments, products, and services of key market players
  • To understand the structure of the water bus market by identifying its various segments and subsegments.
  • To identify and analyze key drivers, restraints, opportunities, and challenges that influence market growth.
  • To forecast the size of market segments across North America, Europe, Asia Pacific, Middle East, Latin America & Africa along with major countries in each region
  • To analyze micromarkets1 with respect to individual technological trends and their contribution to the total market
  • To profile key market players and comprehensively analyze their market share and core competencies2.
  • To provide a detailed competitive landscape of the market, along with an analysis of business and strategies, such as mergers and acquisitions, partnerships, and agreements, in the water bus market.
  • To identify detailed financial positions, key products, and unique selling points of leading companies in the market.

1. Micromarkets are further segments and subsegments of the water bus market  market.

2. Core competencies of companies were captured in terms of their key developments and strategies adopted to sustain their position in the market

Available customizations

Along with the market data, MarketsandMarkets offers customizations as per the specific needs of companies. The following customization options are available for the report:

Product Analysis

  • Product matrix, which gives a detailed comparison of the product portfolio of each company.

Regional Analysis

  • Further breakdown of the market segments at the country level

Company Information

  • Detailed analysis and profiling of additional market players (up to 5)
Custom Market Research Services

We will customize the research for you, in case the report listed above does not meet with your exact requirements. Our custom research will comprehensively cover the business information you require to help you arrive at strategic and profitable business decisions.

Request Customization
Report Code
AS 9153
Published ON
Sep, 2024
Choose License Type
BUY NOW
  • SHARE
X
Request Customization
Speak to Analyst
Speak to Analyst
OR FACE-TO-FACE MEETING
PERSONALIZE THIS RESEARCH
  • Triangulate with your Own Data
  • Get Data as per your Format and Definition
  • Gain a Deeper Dive on a Specific Application, Geography, Customer or Competitor
  • Any level of Personalization
REQUEST A FREE CUSTOMIZATION
LET US HELP YOU!
  • What are the Known and Unknown Adjacencies Impacting the Water Bus Market
  • What will your New Revenue Sources be?
  • Who will be your Top Customer; what will make them switch?
  • Defend your Market Share or Win Competitors
  • Get a Scorecard for Target Partners
CUSTOMIZED WORKSHOP REQUEST
  • Call Us
  • +1-888-600-6441 (Corporate office hours)
  • +1-888-600-6441 (US/Can toll free)
  • +44-800-368-9399 (UK office hours)
CONNECT WITH US
ABOUT TRUST ONLINE
©2024 MarketsandMarkets Research Private Ltd. All rights reserved
DMCA.com Protection Status Website Feedback