Urea Market

Report Code CH 9217
Published in Nov, 2024, By MarketsandMarkets™
Download PDF

Choose License Type

Buy Report Now Inquire Before Buying

Urea Market by Grade (Agricultural, Technical, Feed, Medical), Product Type (Granular, Prilled), End-Use Industry (Agriculture, Chemical, Automotive, Medical), Application, Technology & Region - Global Forecast to 2029

Overview

The global urea market is valued at USD 80.25 billion in 2024 and is projected to reach USD 93.25 billion by 2029, growing at 3.05% cagr from 2024 to 2029. The world population, according to the UN, is estimated to be 9.8 billion by 2050 and 8.6 billion by 2030. The population has been estimated to grow to 11.2 billion by 2100; therefore, the demand for food will increase as well. Thus, with an increased population, improved agricultural productivity is needed to maintain food security; therefore, urea becomes an input of importance for crop yields. The challenge of feeding approximately 9.8 billion people by 2050 makes the need to produce more food extremely challenging. Most use of urea is as a nitrogen fertilizer for a wide array of crops: cereal crops (wheat, rice, corn); oilseed crops (soybean, canola, etc.); fruits, and vegetables. Urea has high solubility that ensures good delivery of nutrients. Its progressive release of nitrogen leads to a reduction in losses as well as preserving availability over the long term. Other key drivers include the production of pharmaceutical drugs, diesel exhaust fluid for the automotive industry, and other industrial applications.

Attractive Opportunities in the Urea Market

Asia Pacific

Market growth in the Asia Pacific can be attributed to presence of a large and growing population, an increase for agricultural products, exports of urea , along with government aid.

Rising agricultural activity, due to a demand from the increasing population leads to growth in demand. Further demand from pharmaceutical companies for making drugs and the automotive industry in the reduction of nitrous oxides leads to an increase in demand.

Advancements in technology, such as more efficient synthesis methods and enhanced emission control systems, are creating lucrative opportunities for market players to improve sustainability and profitability in urea production

The urea market in the Asia Pacific is expected to be USD 61.7 billion by 2029.

Issues associated with supply chain disruptions and raw material price changes to pose a challenge to the growth of this market.

Global Urea Market Dynamics

DRIVER: Increasing demand for nitrogenous fertilizers

Urea is among the most common nitrogen fertilizers used in agriculture because of its high content of 46% nitrogen. Nitrogen boosts plant growth, leading to better crop yield and produce quality. As the global population continues to rise, agricultural production must increase to accommodate the high demand for food. This, in turn, has triggered increased fertilizer consumption mainly within agricultural economies. Asia, especially countries such as China and India, along with many parts of Africa, have vast growth in their agricultural activity, leading to an increase in urea consumption. It is observed that urea plays a critical role in crop growth in agricultural fields. Rice, maize, potatoes, and fruits are highly in demand; their application requires enormous amounts of urea 300-600 Kg/ha, and it is found that fertilizer consumption in farms is very constant. Increased demand for food globally and the expansion of agricultural activities in developing regions would increase the dependency on urea. The government supports more productivity in crops to meet food demands, which increases its demand further and works as a driving factor in sustaining agricultural productivity.

RESTRAINT: Raw material price fluctuations

Urea relies heavily on natural gas as a key feedstock in its production. The cost of producing urea changes with the price of natural gas. Erratic natural gas prices in any region would make urea uneconomical to produce. Increased input costs will push the price of urea fertilizers which makes them less attractive for farmers, particularly in lower purchasing power regions and with few available subsidies. This then leaves producers with the choice of absorbing the extra costs, which would hurt margins, or passing on the costs to the consumer, thereby lowering demand. Volatility in the urea market and price pressures are some of the major issues for producers and traders. Prices are influenced by global demand-supply fluctuations, currency fluctuations, prevailing climate and weather conditions, and geopolitical events. This volatility affects profitability, investment decisions, and competitiveness, which means that the implementation of risk management strategies, hedging mechanisms, and optimization of supply chains by urea producers and traders is necessary to counter price risks and ensure market stability.


OPPORTUNITY: Nano Urea: A growing market opportunity

Nano-fertilizers improve nutrient availability and uptake by plants by encapsulating the nutrients into nanomaterials that can be released at a controlled rate. This slow diffusion into soil improves the efficiency of nutrient utilization and limits losses compared to conventional fertilizers, which could be applied in large amounts due mainly to usually low absorption rates, especially for phosphorus and nitrogen. Compared to the traditional urea, the Nano fertilizers possess 10,000 times more surface area. This leads to achieving around 80% improvement in nutrient availability as well as better usage of nutrients. The nano-fertilizers increase agricultural yields and contribute to environmental sustainability due to reduced ecological impacts. With more focus on sustainable agriculture, demand for nano urea will increase; therefore, it is one of the key innovations in the fertilizer industry. In India, the government actively promotes nano urea to enhance agricultural productivity while reducing chemical fertilizer usage and its side effects on the environment.

CHALLENGES: Environmental and energy challenges in urea manufacturing and Supply chain disruptions

Urea manufacturing presents significant environmental and energy-related challenges. The process is accompanied by such emissions of pollutants as ammonia, particulate matter, and sometimes hazardous materials such as formaldehyde and methanol. In addition, the production of urea is highly energy-intensive. Energy makes up 70–80% of total production costs. It contributes to about 0.93% of global greenhouse gas emissions. While some firms have created several strategies to reduce their emissions, for example, such as making prilling tower emissions safer, these market impacts on the environment still present some severe challenges that demand continued efforts toward reduced pollution and also energy efficiency. The supply chain system of urea is sensitive to disruptions in supply within regions that rely on imports for their fertilizer needs. Geopolitical tensions may also become a disruption in the flow of urea while port congestion generally causes disruptions in the supply of urea. For instance, political instability in major exporting regions - such as Russia and parts of the Middle East - may cause a shortage even in global markets; their prices tend to rise, and supply in total remains uncertain.

Global Urea Market Ecosystem Analysis

The ecosystem of urea involves raw material suppliers, manufacturers, distributors, and end users. Raw materials include ammonia and carbon dioxide. It is acquired by urea manufacturers who manufacture the product through processing. It is either sold directly to end users or distributors for further sale to customers.


Prilled Urea is projected to be the fastest-growing product type segment of the urea market.

Prilled urea is projected to dominate the product type segment in the urea market, fueled by its ease of application and high nitrogen content, which make it highly effective for crops. Its uniform granule size improves nutrient delivery and uptake while minimizing nitrogen losses when applied to soil. Prilled urea is a nitrogen-rich solid fertilizer celebrated for its rapid dissolution in water and stability when blended with other fertilizers. Commonly known as ice melting or deicing urea, it effectively manages ice at temperatures as low as -6 °C. It is characterized by smooth, round pellets of 1.5-1.9 mm in diameter with a low moisture content of between 0.15% and 0.25%. The melt from the concentrated urea is diluted to 99.7% pure after evaporation before being dropped into droplets in the prilling tower where they form into pellets as they travel down through rising streams of air. At the bottom, prills are collected, cooled, and screened for uniformity. Other alternatives to the production process include the Fluidized Bed Method, Crystal-Melting Technique, and the Use of Inert Gas in Prilling. On the other hand, prilled urea is also further used for water-soluble fertilizers, horticulture, and aquaculture applications that further depict how relevant prilled fertilizer is in agricultural management and environmental protection.

Agricultural Grade is the fastest-growing segment by grade in the urea market.

By grade, the agricultural-grade sectors are growing the fastest among all others. Some factors contributing to the growth of agricultural-grade urea include increasing global food demand relative to a population that continues to rise at a rapid rate. Population growth means that crops have to be harvested in much higher quantities as well. Urea with a high nitrogen content, of 46%, is an efficient fertilizer that increases crop yields and fertilizes the soil. Therefore, it remains an integral part of modern agriculture. Government support through grants and programs encouraging fertilizer use also increases demand. Besides, the rise in sustainable application encourages more uptake of urea since it is easy to use in precision farming applications to adjust the nutrient for more efficient production with minimal adverse environmental effects. Lastly, increased agricultural techniques like controlled-release fertilizers, slow-release fertilizers, and nano-fertilizers encourage fertilizers such as urea for high production, ensuring minimal environmental impact. These factors collectively contribute to the robust growth of agricultural-grade urea in the market.

Asia Pacific is estimated to be the fastest-growing region in the urea market.

Asia Pacific is viewed as the fastest-evolving market for urea, primarily driven by a booming population and rapid urbanization in this region. Some of the major agricultural products-producing countries in the world can be found within this region, and because of this, the demand for urea within fertilizers is increasing. With the increasing world population, demand for food production must also go up, which means there is a huge call for innovative solutions with which farmers can enhance crop yields and ensure better food security. Urea, with a relatively high percentage of nitrogen (46%), is an extremely important fertilizer that provides essential nutrients like nitrogen, phosphorus, and potassium, which are vital to successful plant growth. Therefore, it will continue to be one of the popular types of fertilizers applied by farmers who would want to see the fertility of soils increase and subsequently see crop production rise. Higher levels of agricultural activity in countries such as India and China, coupled with progress in economic expansion, are expected to propel growth in the market for urea. The export ability from these areas and the resultant demand for urea by farmers to meet both domestic and international markets also fuel the growth in this market. Furthermore, the Asia-Pacific automotive industry is also gaining due to stringent emission regulations where the use of urea-based technologies, diesel exhaust fluid (DEF), will be used in the selective catalytic reduction (SCR) technology for nitrogen oxide production. All these factors contribute to ensuring the high market growth in this region.

HIGHEST CAGR MARKET IN 2024-2029
ASIA PACIFIC GROWING MARKET IN THE REGION

Recent Developments of Urea Market

  • In August 2024, Yara International ASA announced strategic divestments from its fertilizer import and distribution business in Ivory Coast, which is part of a strategy to concentrate on African markets that are likely to grow better.
  • In July 2024, BASF SE and ENGIE formed an agreement to use sustainable biomethane at both its sites in Ludwigshafen and Antwerp, reducing the company's carbon footprint and expanding its portfolio with lower or zero PCF for its products.
  • In June 2024, Yara Brasil Fertilizantes S.A. and Petrobras agreed to the nonbinding Master Agreement to find synergy opportunities and strengthen efficiency in the Brazilian fertilizer market with decarbonization options on the table.
  • In November 2023, BASF and Yuntianhua collaborated to present a climate-smart farming project in China, which will allow the verification of CO2 emissions that are saved in the use of Yuntianhua's stabilized urea fertilizer with BASF's urease inhibitor Limus. The initiative is to support climate-smart farming projects in China, further exploring opportunities for global expansion.

Key Market Players

KEY PLAYERS IN THE UREA MARKET INCLUDE

Want to explore hidden markets that can drive new revenue in Urea Market?

Scope of the Report

Report Metric Details
Market size available for years 2022-2029
Base Year Considered 2023
Forecast period 2024-2029
Forecast units Value (USD Million) Volume (Kiloton)
Segments covered Product Type, Grade, Technology, Application, End-use Industry, and Region
Geographies covered North America, Europe, Asia Pacific, Middle East & Africa, South America


Key Questions Addressed by the Report

What primary factor is propelling the growth of the urea market?
The primary factors propelling the growth of the urea market include Increasing demand for nitrogenous fertilizers due to the rising global population, Supporting government initiatives in some regions, and Adopting sustainable practices for agriculture.
How is the urea market segmented?
The urea market is segmented into product type, Grade, Applications, Technology, End-use industry, and Region.
What are the major challenges in the urea market?
Supply chain disruptions and Environmental and energy challenges in urea manufacturing are the major challenges in the urea market.
What are the major opportunities in the urea market?
Growing demand in emerging markets and Nano Urea: An innovative fertilizer provides lucrative opportunities for the urea market over the next five years.
Which region has the largest demand?
The Asia Pacific (APAC) region stands out with the highest demand for urea.
Who are the major manufacturers of urea?
Major players in the urea market are CF Industries Holdings, Inc. (US), Pupuk Indonesia (Persero) (Indonesia), Yara International ASA (Norway), SABIC (Saudi Arabia), OCI (Netherlands), Nutrien (Canada), EuroChem Group (Switzerland), Qatar Fertiliser Company (Qatar), BASF SE (Germany), CNPC (China), IFFCO (India) among others.
How are rising natural gas prices impacting urea production and prices?
Natural gas is the primary feedstock for urea production, so fluctuations in natural gas prices have a direct impact on urea production costs. With recent spikes in natural gas prices, production costs for urea have increased, leading to higher prices for end-users, especially in regions heavily dependent on natural gas imports. Many producers are seeking alternative feedstocks or adjusting production schedules to mitigate costs, while the downstream market adjusts to the new pricing dynamics.
What are the environmental concerns associated with urea use, and how is the industry addressing them?
Urea, while an efficient nitrogen source, can contribute to nitrogen runoff and greenhouse gas emissions (like nitrous oxide) when not used efficiently. There is growing pressure on the industry to adopt environmentally friendly practices. In response, companies are investing in enhanced efficiency fertilizers (EEFs) and urea products with urease inhibitors, which help reduce nitrogen loss. Additionally, producers are exploring sustainable production methods to lower carbon emissions associated with urea manufacturing.
What are the key drivers behind the growth of the urea market?

Key Drivers Behind Urea Market Growth

  1. Increasing Agricultural Demand
  2. Adoption of Modern Farming Practices
  3. Government Initiatives and Subsidies
  4. Industrial Applications
  5. Technological Advancements
  6. Economic Factors
  7. Environmental Regulations
These drivers collectively indicate a robust outlook for the urea market, with continuous growth expected as global agricultural practices evolve to meet increasing food demands while considering sustainability and environmental impact.
 
Why is the Asia-Pacific region dominant in urea production and consumption?

Key Factors for Asia-Pacific's Dominance in Urea Production and Consumption

  1. Large Agricultural Sector
  2. Growing Population
  3. Government Support and Subsidies
  4. Adoption of Modern Farming Practices
  5. Economic Development
  6. Industrial Applications
  7. Strategic Trade Position
  8. Environmental Initiatives
The combination of a large agricultural base, population growth, supportive government policies, modern farming practices, and industrial demand positions the Asia-Pacific region as a leader in both urea production and consumption on a global scale.


Personalize This Research

  • Triangulate with your Own Data
  • Get Data as per your Format and Definition
  • Gain a Deeper Dive on a Specific Application, Geography, Customer or Competitor
  • Any level of Personalization
Request A Free Customisation

Let Us Help You

  • What are the Known and Unknown Adjacencies Impacting the Urea Market
  • What will your New Revenue Sources be?
  • Who will be your Top Customer; what will make them switch?
  • Defend your Market Share or Win Competitors
  • Get a Scorecard for Target Partners
Customized Workshop Request

Table of Contents

Exclusive indicates content/data unique to MarketsandMarkets and not available with any competitors.

TITLE
PAGE NO
INTRODUCTION
25
RESEARCH METHODOLOGY
29
EXECUTIVE SUMMARY
38
PREMIUM INSIGHTS
43
MARKET OVERVIEW
47
  • 5.1 INTRODUCTION
  • 5.2 MARKET DYNAMICS
    DRIVERS
    - Increasing use to produce nitrogenous fertilizers
    - Supporting government initiatives in some regions
    - Adoption of sustainable practices
    RESTRAINTS
    - Raw material price fluctuations
    - Competition from alternatives
    OPPORTUNITIES
    - Growing demand in emerging markets
    - Growing market opportunity for nano urea
    CHALLENGES
    - Supply chain disruptions
    - Environmental and energy challenges in urea manufacturing
INDUSTRY TRENDS
54
  • 6.1 TRENDS & DISRUPTIONS IMPACTING CUSTOMER BUSINESS
    TRENDS & DISRUPTION IMPACTING CUSTOMER BUSINESS
    PRICING ANALYSIS
  • 6.2 VALUE CHAIN ANALYSIS
  • 6.3 ECOSYSTEM ANALYSIS
  • 6.4 TECHNOLOGY ANALYSIS
    KEY TECHNOLOGIES
    COMPLEMENTARY TECHNOLOGIES
    ADJACENT TECHNOLOGY
  • 6.5 IMPACT OF GEN AI/AI ON UREA MARKET
  • 6.6 PATENT ANALYSIS
    INTRODUCTION
    METHODOLOGY
    UREA MARKET, PATENT ANALYSIS (2014–2023)
  • 6.7 TRADE ANALYSIS
    EXPORT SCENARIO (HS CODE 310210)
    IMPORT SCENARIO (HS CODE 310210)
  • 6.8 KEY CONFERENCES AND EVENTS IN 2024–2025
  • 6.9 TARIFF AND REGULATORY LANDSCAPE
    TARIFF (HS CODE: 310210)
    REGULATORY BODIES, GOVERNMENT AGENCIES, AND OTHER ORGANIZATIONS
    KEY REGULATIONS
    - ISO 18642:2016 (International standard specification for urea, fertilizer grade)
    - ISO 19746:2017 (International standard for determination of urea content in urea-based fertilizers by high-performance liquid chromatography (HPLC))
    - Regulation (EC) No 1907/2006, known as REACH (Registration, Evaluation, Authorisation and Restriction of Chemicals)
    - IS 14832:2000 (Indian standard for specification of urea, Feed grade)
    - IS 1781:1975 (Indian standard for specification of urea, technical grade)
    - OSHA standards
  • 6.10 PORTER’S FIVE FORCES ANALYSIS
    THREAT OF NEW ENTRANTS
    THREAT OF SUBSTITUTES
    BARGAINING POWER OF SUPPLIERS
    BARGAINING POWER OF BUYERS
    INTENSITY OF COMPETITIVE RIVALRY
  • 6.11 KEY STAKEHOLDERS AND BUYING CRITERIA
    KEY STAKEHOLDERS IN BUYING PROCESS
    BUYING CRITERIA
  • 6.12 CASE STUDY ANALYSIS
    MODIFIED UREA FERTILIZERS AND THEIR EFFECTS ON IMPROVING NITROGEN USE EFFICIENCY (NUE)
    UREA-MOLASSES MINERAL BLOCKS: AN EFFECTIVE SUPPLEMENT FOR LIVESTOCK NUTRITION
    ECONOMIC EFFECTS OF NEEM-COATED UREA ON INDIAN AGRICULTURE
  • 6.13 MACROECONOMIC ANALYSIS
    INTRODUCTION
    GDP TRENDS AND FORECASTS
  • 6.14 AGRICULTURE, FORESTRY, AND FISHING, VALUE ADDED (% OF GDP)
  • 6.15 INVESTMENT AND FUNDING SCENARIO
UREA MARKET, BY GRADE
91
  • 7.1 INTRODUCTION
  • 7.2 TECHNICAL GRADE
    GROWING APPLICATIONS IN MODERN INDUSTRY
  • 7.3 AGRICULTURAL GRADE
    ESSENTIAL FERTILIZER FOR SUSTAINABLE CROP PRODUCTION
  • 7.4 FEED GRADE
    REQUIRED FOR ENHANCING LIVESTOCK NUTRITION
  • 7.5 MEDICAL GRADE
    VERSATILE SOLUTION IN DERMATOLOGY
UREA MARKET, BY APPLICATION
95
  • 8.1 INTRODUCTION
  • 8.2 NITROGENOUS FERTILIZER
    ENHANCING AGRICULTURAL EFFICIENCY AND SUSTAINABILITY
  • 8.3 CATTLE FEED
    BOOSTING LIVESTOCK NUTRITION
  • 8.4 MELAMINE
    VERSATILE APPLICATIONS FROM RESINS TO SLOW-RELEASE FERTILIZERS
  • 8.5 OTHER APPLICATIONS
UREA MARKET, BY END-USE INDUSTRY
99
  • 9.1 INTRODUCTION
  • 9.2 AGRICULTURE
    INCREASING USE IN MAKING NITROGENOUS FERTILIZERS FOR HIGH AGRICULTURAL PRODUCTIVITY
  • 9.3 CHEMICAL
    GROWING USE IN DIVERSE CHEMICAL APPLICATIONS
  • 9.4 AUTOMOTIVE
    NOX EMISSION REDUCTION IN AUTOMOTIVE SECTOR
  • 9.5 MEDICAL
    VERSATILE COMPOUND IN MEDICAL AND DERMATOLOGICAL CARE
  • 9.6 OTHER END-USE INDUSTRIES
UREA MARKET, BY PRODUCT TYPE
104
  • 10.1 INTRODUCTION
  • 10.2 GRANULAR UREA
    ESSENTIAL FERTILIZER FOR AGRICULTURAL PRODUCTIVITY
  • 10.3 PRILLED UREA
    VERSATILE APPLICATIONS AND INDUSTRIAL SIGNIFICANCE
  • 10.4 OTHER PRODUCT TYPES
UREA MARKET, BY TECHNOLOGY
108
  • 11.1 INTRODUCTION
  • 11.2 STAMICARBON
    EFFICIENT AND SUSTAINABLE SOLUTIONS FOR NITROGEN FERTILIZER PRODUCTION
  • 11.3 SAIPEM
    EFFICIENCY, SUSTAINABILITY, AND FLEXIBILITY OF ADVANCED UREA PRODUCTION TECHNOLOGY
  • 11.4 TEC
    ADVANCEMENTS IN FERTILIZER PRODUCTION
  • 11.5 CASALE
    EFFICIENCY AND SUSTAINABILITY IN AGRICULTURE
  • 11.6 NIIK
    ADVANCING UREA PRODUCTION WITH CUTTING-EDGE TECHNOLOGIES
  • 11.7 OTHER TECHNOLOGIES
UREA MARKET, BY REGION
114
  • 12.1 INTRODUCTION
  • 12.2 ASIA PACIFIC
    CHINA
    - Increased exports, sustainable agricultural practices, and economic growth
    INDIA
    - Growing population and innovative solutions in urea fertilizers
    INDONESIA
    - Agricultural growth and significant investments in urea production
    VIETNAM
    - Driving growth through sustainable agricultural practices
    JAPAN
    - Demographic changes and rapid innovation in automotive industry
    REST OF ASIA PACIFIC
  • 12.3 SOUTH AMERICA
    BRAZIL
    - Economic growth and technological innovation
    ARGENTINA
    - Impact of urea imports and tariff reforms
    REST OF SOUTH AMERICA
  • 12.4 NORTH AMERICA
    US
    - Increasing demand from agriculture industry
    CANADA
    - Supportive economic insights and research investments
    MEXICO
    - Government initiatives and growth potential in agricultural activities
  • 12.5 EUROPE
    GERMANY
    - Economic growth boosts demand for urea
    FRANCE
    - Robust urea export activity
    UK
    - Agricultural dynamics and regulatory changes
    ITALY
    - Growth in agricultural sector
    RUSSIA
    - Growing food industry and precision agriculture
    UKRAINE
    - Resurgence in agricultural demand
    REST OF EUROPE
  • 12.6 MIDDLE EAST & AFRICA
    GCC COUNTRIES
    - Saudi Arabia
    - UAE
    - Rest of GCC Countries
    SOUTH AFRICA
    - Interconnected role of agriculture and automotive industries
    NIGERIA
    - Growing demand for urea in expanding agricultural sector
    TÜRKIYE
    - Import dependency to drive market
    REST OF MIDDLE EAST & AFRICA
COMPETITIVE LANDSCAPE
197
  • 13.1 OVERVIEW
  • 13.2 KEY PLAYER STRATEGIES/RIGHT TO WIN, 2019–2024
  • 13.3 MARKET SHARE ANALYSIS, 2023
  • 13.4 REVENUE ANALYSIS (2019–2023)
  • 13.5 COMPANY VALUATION AND FINANCIAL METRICS, 2024
  • 13.6 PRODUCT COMPARISON ANALYSIS
  • 13.7 COMPANY EVALUATION MATRIX: KEY PLAYERS, 2023
    STARS
    EMERGING LEADERS
    PERVASIVE PLAYERS
    PARTICIPANTS
    COMPANY FOOTPRINT: KEY PLAYERS, 2023
    - Company footprint
    - Product type footprint
    - Grade type footprint
    - Application footprint
    - End-use industry footprint
    - Region footprint
  • 13.8 COMPANY EVALUATION MATRIX: STARTUPS/SMES, 2023
    PROGRESSIVE COMPANIES
    RESPONSIVE COMPANIES
    DYNAMIC COMPANIES
    STARTING BLOCKS
    COMPETITIVE BENCHMARKING: STARTUPS/SMES, 2023
    - Detailed list of key startups/SMEs
    - Competitive benchmarking of key startups/SMEs
  • 13.9 COMPETITIVE SCENARIO
    PRODUCT LAUNCHES
    DEALS
    EXPANSIONS
COMPANY PROFILES
225
  • 14.1 KEY PLAYERS
    CF INDUSTRIES HOLDINGS, INC.
    - Business overview
    - Products/Solutions/Services offered
    - Recent developments
    - MnM view
    PUPUK INDONESIA (PERSERO)
    - Business overview
    - Products/Solutions/Services offered
    - Recent developments
    - MnM view
    YARA INTERNATIONAL ASA
    - Business overview
    - Products/Solutions/Services offered
    - Recent developments
    - MnM view
    SABIC
    - Business overview
    - Products/Solutions/Services offered
    - Recent developments
    - MnM view
    OCI
    - Business overview
    - Products/Solutions/Services offered
    - Recent developments
    - MnM view
    NUTRIEN
    - Business overview
    - Products/Solutions/Services offered
    - Recent developments
    - MnM view
    EUROCHEM GROUP
    - Business overview
    - Products/Solutions/Services offered
    - Recent developments
    - MnM view
    QATAR FERTILIZER COMPANY
    - Business overview
    - Products/Solutions/Services offered
    - Recent developments
    - MnM view
    BASF SE
    - Business overview
    - Products/Solutions/Services offered
    - Recent developments
    - MnM view
    CNPC
    - Business overview
    - Products/solutions/services offered
    - Recent developments
    - MnM view
    IFFCO
    - Business overview
    - Products/solutions/services offered
    - Recent developments
    - MnM view
  • 14.2 OTHER PLAYERS
    AMERICAN PLANT FOOD CORPORATION
    GREENWAY BIOTECH, INC.
    GAC CHEMICAL CORPORATION
    RAVENSDOWN
    VINIPUL INORGANICS PVT. LTD.
    GUJARAT STATE FERTILIZERS & CHEMICALS LIMITED (GSFC)
    GROUP DF
    FERTIBERIA
    KANTO CHEMICAL CO., INC.
    DUBI CHEM MARINE INTERNATIONAL
    PT PUPUK SRIWIDJAJA PALEMBANG (PUSRI)
    JSC TOGLIATTIAZOT (TOAZ)
    ANMOL CHEMICALS PRIVATE LIMITED
    GREENSTAR FERTILIZERS LIMITED
    MATIX FERTILISERS AND CHEMICALS LIMITED
    KOCH FERTILIZER, LLC
ADJACENT & RELATED MARKETS
285
  • 15.1 INTRODUCTION
    MARKET DEFINITION
    MARKET OVERVIEW
    AMMONIUM SULFATE MARKET, BY TYPE
    AMMONIUM SULFATE MARKET, BY APPLICATION
    AMMONIUM SULFATE MARKET, BY REGION
  • 15.2 NITROGENOUS FERTILIZERS MARKET
    MARKET DEFINITION
    MARKET OVERVIEW
  • 15.3 NITROGENOUS FERTILIZERS MARKET, BY TYPE
  • 15.4 NITROGENOUS FERTILIZERS MARKET, BY CROP TYPE
  • 15.5 NITROGENOUS FERTILIZERS MARKET, BY FORM
  • 15.6 NITROGENOUS FERTILIZERS MARKET, BY REGION
APPENDIX
293
  • 16.1 DISCUSSION GUIDE
  • 16.2 KNOWLEDGESTORE: MARKETSANDMARKETS’ SUBSCRIPTION PORTAL
  • 16.3 AVAILABLE CUSTOMIZATIONS
  • 16.4 RELATED REPORTS
  • 16.5 AUTHOR DETAILS
LIST OF TABLES
 
  • TABLE 1 RECOMMENDED UREA APPLICATION RATES BY CROP TYPE
  • TABLE 2 NITROGEN/SULFUR ANALYSIS FOR DIFFERENT FERTILIZER TYPES
  • TABLE 3 AVERAGE PRICE TREND OF KEY PLAYERS, BY GRADE (USD/TON ), 2023
  • TABLE 4 AVERAGE PRICE TREND BY REGIONS (USD/TON)
  • TABLE 5 ECOSYSTEM OF UREA MARKET
  • TABLE 6 LIST OF PATENTS FOR UREA
  • TABLE 7 UREA MARKET: DETAILED LIST OF CONFERENCES & EVENTS, 2024–2025
  • TABLE 8 TARIFF RELATED TO HARMONIZED SYSTEM (HS CODE 310210))
  • TABLE 9 NORTH AMERICA: LIST OF REGULATORY BODIES, GOVERNMENT AGENCIES, INDUSTRY ASSOCIATIONS, AND OTHER ORGANIZATIONS
  • TABLE 10 EUROPE: LIST OF REGULATORY BODIES, GOVERNMENT AGENCIES, INDUSTRY ASSOCIATIONS, AND OTHER ORGANIZATIONS
  • TABLE 11 ASIA PACIFIC: LIST OF REGULATORY BODIES, GOVERNMENT AGENCIES, INDUSTRY ASSOCIATIONS, AND OTHER ORGANIZATIONS
  • TABLE 12 OCCUPATIONAL EXPOSURE LIMITS (OELS)
  • TABLE 13 PORTER’S FIVE FORCES ANALYSIS
  • TABLE 14 INFLUENCE OF STAKEHOLDERS ON BUYING PROCESS OF UREA
  • TABLE 15 KEY BUYING CRITERIA FOR UREA IN THREE END-USE INDUSTRIES
  • TABLE 16 WORLD GDP GROWTH PROJECTION, 2021–2028 (USD TRILLION)
  • TABLE 17 AGRICULTURE, FORESTRY, AND FISHING, VALUE ADDED (% OF GDP)
  • TABLE 18 UREA MARKET, BY GRADE, 2022–2029 (USD MILLION)
  • TABLE 19 UREA MARKET, BY GRADE, 2022–2029 (KILOTON)
  • TABLE 20 UREA MARKET, BY APPLICATION, 2022–2029 (USD MILLION)
  • TABLE 21 UREA MARKET, BY APPLICATION, 2022–2029 (KILOTON)
  • TABLE 22 UREA MARKET, BY END-USE INDUSTRY, 2022–2029 (USD MILLION)
  • TABLE 23 UREA MARKET, BY END-USE INDUSTRY, 2022–2029 (KILOTON)
  • TABLE 24 UREA MARKET, BY PRODUCT TYPE, 2022–2029 (USD MILLION)
  • TABLE 25 UREA MARKET, BY PRODUCT TYPE, 2022–2029 (KILOTON)
  • TABLE 26 PROPERTIES OF GRANULAR, PRILLED, AND PASTILLES UREA
  • TABLE 27 UREA MARKET, BY TECHNOLOGY, 2022–2029 (USD MILLION)
  • TABLE 28 UREA MARKET, BY TECHNOLOGY, 2022–2029 (KILOTON)
  • TABLE 29 UREA MARKET, BY REGION, 2022–2029 (USD MILLION)
  • TABLE 30 UREA MARKET, BY REGION, 2022–2029 (KILOTON)
  • TABLE 31 ASIA PACIFIC: UREA MARKET, BY COUNTRY, 2022–2029 (USD MILLION)
  • TABLE 32 ASIA PACIFIC: MARKET, BY COUNTRY, 2022–2029 (KILOTON)
  • TABLE 33 ASIA PACIFIC: MARKET, BY PRODUCT TYPE, 2022–2029 (USD MILLION)
  • TABLE 34 ASIA PACIFIC: MARKET, BY PRODUCT TYPE, 2022–2029 (KILOTON)
  • TABLE 35 ASIA PACIFIC: MARKET, BY GRADE, 2022–2029 (USD MILLION)
  • TABLE 36 ASIA PACIFIC: MARKET, BY GRADE, 2022–2029 (KILOTON)
  • TABLE 37 ASIA PACIFIC: MARKET, BY APPLICATION, 2022–2029 (USD MILLION)
  • TABLE 38 ASIA PACIFIC: MARKET, BY APPLICATION, 2022–2029 (KILOTON)
  • TABLE 39 ASIA PACIFIC: MARKET, BY END-USE INDUSTRY, 2022–2029 (USD MILLION)
  • TABLE 40 ASIA PACIFIC: MARKET, BY END-USE INDUSTRY, 2022–2029 (KILOTON)
  • TABLE 41 CHINA: UREA MARKET, BY GRADE, 2022–2029 (USD MILLION)
  • TABLE 42 CHINA: MARKET, BY GRADE, 2022–2029 (KILOTON)
  • TABLE 43 CHINA: MARKET, BY APPLICATION, 2022–2029 (USD MILLION)
  • TABLE 44 CHINA: MARKET, BY APPLICATION, 2022–2029 (KILOTON)
  • TABLE 45 CHINA: MARKET, BY END-USE INDUSTRY, 2022–2029 (USD MILLION)
  • TABLE 46 CHINA: MARKET, BY END-USE INDUSTRY, 2022–2029 (KILOTON)
  • TABLE 47 INDIA: UREA MARKET, BY GRADE, 2022–2029 (USD MILLION)
  • TABLE 48 INDIA: MARKET, BY GRADE, 2022–2029 (KILOTON)
  • TABLE 49 INDIA: MARKET, BY APPLICATION, 2022–2029 (USD MILLION)
  • TABLE 50 INDIA: MARKET, BY APPLICATION, 2022–2029 (KILOTON)
  • TABLE 51 INDIA: MARKET, BY END-USE INDUSTRY, 2022–2029 (USD MILLION)
  • TABLE 52 INDIA: MARKET, BY END-USE INDUSTRY, 2022–2029 (KILOTON)
  • TABLE 53 INDONESIA: UREA MARKET, BY GRADE, 2022–2029 (USD MILLION)
  • TABLE 54 INDONESIA: MARKET, BY GRADE, 2022–2029 (KILOTON)
  • TABLE 55 INDONESIA: MARKET, BY APPLICATION, 2022–2029 (USD MILLION)
  • TABLE 56 INDONESIA: MARKET, BY APPLICATION, 2022–2029 (KILOTON)
  • TABLE 57 INDONESIA: MARKET, BY END-USE INDUSTRY, 2022–2029 (USD MILLION)
  • TABLE 58 INDONESIA: MARKET, BY END-USE INDUSTRY, 2022–2029 (KILOTON)
  • TABLE 59 VIETNAM: UREA MARKET, BY GRADE, 2022–2029 (USD MILLION)
  • TABLE 60 VIETNAM: MARKET, BY GRADE, 2022–2029 (KILOTON)
  • TABLE 61 VIETNAM: MARKET, BY APPLICATION, 2022–2029 (USD MILLION)
  • TABLE 62 VIETNAM: MARKET, BY APPLICATION, 2022–2029 (KILOTON)
  • TABLE 63 VIETNAM: MARKET, BY END-USE INDUSTRY, 2022–2029 (USD MILLION)
  • TABLE 64 VIETNAM: MARKET, BY END-USE INDUSTRY, 2022–2029 (KILOTON)
  • TABLE 65 JAPAN: UREA MARKET, BY GRADE, 2022–2029 (USD MILLION)
  • TABLE 66 JAPAN: MARKET, BY GRADE, 2022–2029 (KILOTON)
  • TABLE 67 JAPAN: MARKET, BY APPLICATION, 2022–2029 (USD MILLION)
  • TABLE 68 JAPAN: MARKET, BY APPLICATION, 2022–2029 (KILOTON)
  • TABLE 69 JAPAN: MARKET, BY END-USE INDUSTRY, 2022–2029 (USD MILLION)
  • TABLE 70 JAPAN: MARKET, BY END-USE INDUSTRY, 2022–2029 (KILOTON)
  • TABLE 71 REST OF ASIA PACIFIC: UREA MARKET, BY GRADE, 2022–2029 (USD MILLION)
  • TABLE 72 REST OF ASIA PACIFIC: MARKET, BY GRADE, 2022–2029 (KILOTON)
  • TABLE 73 RET OF ASIA PACIFIC: MARKET, BY APPLICATION, 2022–2029 (USD MILLION)
  • TABLE 74 REST OF ASIA PACIFIC: MARKET, BY APPLICATION, 2022–2029 (KILOTON)
  • TABLE 75 REST OF ASIA PACIFIC: MARKET, BY END-USE INDUSTRY, 2022–2029 (USD MILLION)
  • TABLE 76 REST OF ASIA PACIFIC: MARKET, BY END-USE INDUSTRY, 2022–2029 (KILOTON)
  • TABLE 77 SOUTH AMERICA: UREA MARKET, BY COUNTRY, 2022–2029 (USD MILLION)
  • TABLE 78 SOUTH AMERICA: MARKET, BY COUNTRY, 2022–2029 (KILOTON)
  • TABLE 79 SOUTH AMERICA: MARKET, BY PRODUCT TYPE, 2022–2029 (USD MILLION)
  • TABLE 80 SOUTH AMERICA: MARKET, BY PRODUCT TYPE, 2022–2029 (KILOTON)
  • TABLE 81 SOUTH AMERICA: MARKET, BY GRADE, 2022–2029 (USD MILLION)
  • TABLE 82 SOUTH AMERICA: MARKET, BY GRADE, 2022–2029 (KILOTON)
  • TABLE 83 SOUTH AMERICA: MARKET, BY APPLICATION, 2022–2029 (USD MILLION)
  • TABLE 84 SOUTH AMERICA: MARKET, BY APPLICATION, 2022–2029 (KILOTON)
  • TABLE 85 SOUTH AMERICA: MARKET, BY END-USE INDUSTRY, 2022–2029 (USD MILLION)
  • TABLE 86 SOUTH AMERICA: MARKET, BY END-USE INDUSTRY, 2022–2029 (KILOTON)
  • TABLE 87 BRAZIL: UREA MARKET, BY GRADE, 2022–2029 (USD MILLION)
  • TABLE 88 BRAZIL: MARKET, BY GRADE, 2022–2029 (KILOTON)
  • TABLE 89 BRAZIL: MARKET, BY APPLICATION, 2022–2029 (USD MILLION)
  • TABLE 90 BRAZIL: MARKET, BY APPLICATION, 2022–2029 (KILOTON)
  • TABLE 91 BRAZIL: MARKET, BY END-USE INDUSTRY, 2022–2029 (USD MILLION)
  • TABLE 92 BRAZIL: MARKET, BY END-USE INDUSTRY, 2022–2029 (KILOTON)
  • TABLE 93 ARGENTINA: UREA MARKET, BY GRADE, 2022–2029 (USD MILLION)
  • TABLE 94 ARGENTINA: MARKET, BY GRADE, 2022–2029 (KILOTON)
  • TABLE 95 ARGENTINA: MARKET, BY APPLICATION, 2022–2029 (USD MILLION)
  • TABLE 96 ARGENTINA: MARKET, BY APPLICATION, 2022–2029 (KILOTON)
  • TABLE 97 ARGENTINA: MARKET, BY END-USE INDUSTRY, 2022–2029 (USD MILLION)
  • TABLE 98 ARGENTINA: MARKET, BY END-USE INDUSTRY, 2022–2029 (KILOTON)
  • TABLE 99 REST OF SOUTH AMERICA: UREA MARKET, BY GRADE, 2022–2029 (USD MILLION)
  • TABLE 100 REST OF SOUTH AMERICA: MARKET, BY GRADE, 2022–2029 (KILOTON)
  • TABLE 101 REST OF SOUTH AMERICA: MARKET, BY APPLICATION, 2022–2029 (USD MILLION)
  • TABLE 102 REST OF SOUTH AMERICA: MARKET, BY APPLICATION, 2022–2029 (KILOTON)
  • TABLE 103 REST OF SOUTH AMERICA: MARKET, BY END-USE INDUSTRY, 2022–2029 (USD MILLION)
  • TABLE 104 REST OF SOUTH AMERICA: MARKET, BY END-USE INDUSTRY, 2022–2029 (KILOTON)
  • TABLE 105 NORTH AMERICA: UREA MARKET, BY COUNTRY, 2022–2029 (USD MILLION)
  • TABLE 106 NORTH AMERICA: MARKET, BY COUNTRY, 2022–2029 (KILOTON)
  • TABLE 107 NORTH AMERICA: MARKET, BY PRODUCT TYPE, 2022–2029 (USD MILLION)
  • TABLE 108 NORTH AMERICA: MARKET, BY PRODUCT TYPE, 2022–2029 (KILOTON)
  • TABLE 109 NORTH AMERICA: MARKET, BY GRADE, 2022–2029 (USD MILLION)
  • TABLE 110 NORTH AMERICA: MARKET, BY GRADE, 2022–2029 (KILOTON)
  • TABLE 111 NORTH AMERICA: MARKET, BY APPLICATION, 2022–2029 (USD MILLION)
  • TABLE 112 NORTH AMERICA: MARKET, BY APPLICATION, 2022–2029 (KILOTON)
  • TABLE 113 NORTH AMERICA: MARKET, BY END-USE INDUSTRY,2022–2029 (USD MILLION)
  • TABLE 114 NORTH AMERICA: MARKET, BY END-USE INDUSTRY, 2022–2029 (KILOTON)
  • TABLE 115 US: UREA MARKET, BY GRADE, 2022–2029 (USD MILLION)
  • TABLE 116 US: MARKET, BY GRADE, 2022–2029 (KILOTON)
  • TABLE 117 US: MARKET, BY APPLICATION, 2022–2029 (USD MILLION)
  • TABLE 118 US: MARKET, BY APPLICATION, 2022–2029 (KILOTON)
  • TABLE 119 US: MARKET, BY END-USE INDUSTRY, 2022–2029 (USD MILLION)
  • TABLE 120 US: MARKET, BY END-USE INDUSTRY, 2022–2029 (KILOTON)
  • TABLE 121 CANADA: UREA MARKET, BY GRADE, 2022–2029 (USD MILLION)
  • TABLE 122 CANADA: MARKET, BY GRADE, 2022–2029 (KILOTON)
  • TABLE 123 CANADA: MARKET, BY APPLICATION, 2022–2029 (USD MILLION)
  • TABLE 124 CANADA: MARKET, BY APPLICATION, 2022–2029 (KILOTON)
  • TABLE 125 CANADA: MARKET, BY END-USE INDUSTRY, 2022–2029 (USD MILLION)
  • TABLE 126 CANADA: MARKET, BY END-USE INDUSTRY, 2022–2029 (KILOTON)
  • TABLE 127 MEXICO: UREA MARKET, BY GRADE, 2022–2029 (USD MILLION)
  • TABLE 128 MEXICO: MARKET, BY GRADE, 2022–2029 (KILOTON)
  • TABLE 129 MEXICO: MARKET, BY APPLICATION, 2022–2029 (USD MILLION)
  • TABLE 130 MEXICO: MARKET, BY APPLICATION, 2022–2029 (KILOTON)
  • TABLE 131 MEXICO: MARKET, BY END-USE INDUSTRY, 2022–2029 (USD MILLION)
  • TABLE 132 MEXICO: MARKET, BY END-USE INDUSTRY, 2022–2029 (KILOTON)
  • TABLE 133 EUROPE: UREA MARKET, BY COUNTRY, 2022–2029 (USD MILLION)
  • TABLE 134 EUROPE: MARKET, BY COUNTRY, 2022–2029 (KILOTON)
  • TABLE 135 EUROPE: MARKET, BY PRODUCT TYPE, 2022–2029 (USD MILLION)
  • TABLE 136 EUROPE: MARKET, BY PRODUCT TYPE, 2022–2029 (KILOTON)
  • TABLE 137 EUROPE: MARKET, BY GRADE, 2022–2029 (USD MILLION)
  • TABLE 138 EUROPE: MARKET, BY GRADE, 2022–2029 (KILOTON)
  • TABLE 139 EUROPE: MARKET, BY APPLICATION, 2022–2029 (USD MILLION)
  • TABLE 140 EUROPE: MARKET, BY APPLICATION, 2022–2029 (KILOTON)
  • TABLE 141 EUROPE: MARKET, BY END-USE INDUSTRY, 2022–2029 (USD MILLION)
  • TABLE 142 EUROPE: MARKET, BY END-USE INDUSTRY, 2022–2029 (KILOTON)
  • TABLE 143 GERMANY: UREA MARKET, BY GRADE, 2022–2029 (USD MILLION)
  • TABLE 144 GERMANY: MARKET, BY GRADE, 2022–2029 (KILOTON)
  • TABLE 145 GERMANY: MARKET, BY APPLICATION, 2022–2029 (USD MILLION)
  • TABLE 146 GERMANY: MARKET, BY APPLICATION, 2022–2029 (KILOTON)
  • TABLE 147 GERMANY: MARKET, BY END-USE INDUSTRY, 2022–2029 (USD MILLION)
  • TABLE 148 GERMANY: MARKET, BY END-USE INDUSTRY, 2022–2029 (KILOTON)
  • TABLE 149 FRANCE: UREA MARKET, BY GRADE, 2022–2029 (USD MILLION)
  • TABLE 150 FRANCE: MARKET, BY GRADE, 2022–2029 (KILOTON)
  • TABLE 151 FRANCE: MARKET, BY APPLICATION, 2022–2029 (USD MILLION)
  • TABLE 152 FRANCE: MARKET, BY APPLICATION, 2022–2029 (KILOTON)
  • TABLE 153 FRANCE: MARKET, BY END-USE INDUSTRY, 2022–2029 (USD MILLION)
  • TABLE 154 FRANCE: MARKET, BY END-USE INDUSTRY, 2022–2029 (KILOTON)
  • TABLE 155 UK: UREA MARKET, BY GRADE, 2022–2029 (USD MILLION)
  • TABLE 156 UK: MARKET, BY GRADE, 2022–2029 (KILOTON)
  • TABLE 157 UK: MARKET, BY APPLICATION, 2022–2029 (USD MILLION)
  • TABLE 158 UK: MARKET, BY APPLICATION, 2022–2029 (KILOTON)
  • TABLE 159 UK: MARKET, BY END-USE INDUSTRY, 2022–2029 (USD MILLION)
  • TABLE 160 UK: MARKET, BY END-USE INDUSTRY, 2022–2029 (KILOTON)
  • TABLE 161 ITALY: UREA MARKET, BY GRADE, 2022–2029 (USD MILLION)
  • TABLE 162 ITALY: MARKET, BY GRADE, 2022–2029 (KILOTON)
  • TABLE 163 ITALY: MARKET, BY APPLICATION, 2022–2029 (USD MILLION)
  • TABLE 164 ITALY: MARKET, BY APPLICATION, 2022–2029 (KILOTON)
  • TABLE 165 ITALY: MARKET, BY END-USE INDUSTRY, 2022–2029 (USD MILLION)
  • TABLE 166 ITALY: MARKET, BY END-USE INDUSTRY, 2022–2029 (KILOTON)
  • TABLE 167 RUSSIA: UREA MARKET, BY GRADE, 2022–2029 (USD MILLION)
  • TABLE 168 RUSSIA: MARKET, BY GRADE, 2022–2029 (KILOTON)
  • TABLE 169 RUSSIA: MARKET, BY APPLICATION, 2022–2029 (USD MILLION)
  • TABLE 170 RUSSIA: MARKET, BY APPLICATION, 2022–2029 (KILOTON)
  • TABLE 171 RUSSIA: MARKET, BY END-USE INDUSTRY, 2022–2029 (USD MILLION)
  • TABLE 172 RUSSIA: MARKET, BY END-USE INDUSTRY, 2022–2029 (KILOTON)
  • TABLE 173 UKRAINE: UREA MARKET, BY GRADE, 2022–2029 (USD MILLION)
  • TABLE 174 UKRAINE: MARKET, BY GRADE, 2022–2029 (KILOTON)
  • TABLE 175 UKRAINE: MARKET, BY APPLICATION, 2022–2029 (USD MILLION)
  • TABLE 176 UKRAINE: MARKET, BY APPLICATION, 2022–2029 (KILOTON)
  • TABLE 177 UKRAINE: MARKET, BY END-USE INDUSTRY, 2022–2029 (USD MILLION)
  • TABLE 178 UKRAINE: MARKET, BY END-USE INDUSTRY, 2022–2029 (KILOTON)
  • TABLE 179 REST OF EUROPE: UREA MARKET, BY GRADE, 2022–2029 (USD MILLION)
  • TABLE 180 REST OF EUROPE: MARKET, BY GRADE, 2022–2029 (KILOTON)
  • TABLE 181 REST OF EUROPE: MARKET, BY APPLICATION, 2022–2029 (USD MILLION)
  • TABLE 182 REST OF EUROPE: MARKET, BY APPLICATION, 2022–2029 (KILOTON)
  • TABLE 183 REST OF EUROPE: MARKET, BY END-USE INDUSTRY, 2022–2029 (USD MILLION)
  • TABLE 184 REST OF EUROPE: MARKET, BY END-USE INDUSTRY, 2022–2029 (KILOTON)
  • TABLE 185 MIDDLE EAST & AFRICA: UREA MARKET, BY COUNTRY, 2022–2029 (USD MILLION)
  • TABLE 186 MIDDLE EAST & AFRICA: MARKET, BY COUNTRY, 2022–2029 (KILOTON)
  • TABLE 187 MIDDLE EAST & AFRICA: MARKET, BY PRODUCT TYPE, 2022–2029 (USD MILLION)
  • TABLE 188 MIDDLE EAST & AFRICA: MARKET, BY PRODUCT TYPE, 2022–2029 (KILOTON)
  • TABLE 189 MIDDLE EAST & AFRICA: MARKET, BY GRADE, 2022–2029 (USD MILLION)
  • TABLE 190 MIDDLE EAST & AFRICA: MARKET, BY GRADE, 2022–2029 (KILOTON)
  • TABLE 191 MIDDLE EAST & AFRICA: MARKET, BY APPLICATION, 2022–2029 (USD MILLION)
  • TABLE 192 MIDDLE EAST & AFRICA: MARKET, BY APPLICATION, 2022–2029 (KILOTON)
  • TABLE 193 MIDDLE EAST & AFRICA: MARKET, BY END-USE INDUSTRY, 2022–2029 (USD MILLION)
  • TABLE 194 MIDDLE EAST & AFRICA: MARKET, BY END-USE INDUSTRY, 2022–2029 (KILOTON)
  • TABLE 195 GCC COUNTRIES: UREA MARKET, BY GRADE, 2022–2029 (USD MILLION)
  • TABLE 196 GCC COUNTRIES: MARKET, BY GRADE, 2022–2029 (KILOTON)
  • TABLE 197 GCC COUNTRIES: MARKET, BY APPLICATION, 2022–2029 (USD MILLION)
  • TABLE 198 GCC COUNTRIES: MARKET, BY APPLICATION, 2022–2029 (KILOTON)
  • TABLE 199 GCC COUNTRIES: MARKET, BY END-USE INDUSTRY, 2022–2029 (USD MILLION)
  • TABLE 200 GCC COUNTRIES: MARKET, BY END-USE INDUSTRY, 2022–2029 (KILOTON)
  • TABLE 201 SAUDI ARABIA: UREA MARKET, BY GRADE, 2022–2029 (USD MILLION)
  • TABLE 202 SAUDI ARABIA: MARKET, BY GRADE, 2022–2029 (KILOTON)
  • TABLE 203 SAUDI ARABIA: MARKET, BY APPLICATION, 2022–2029 (USD MILLION)
  • TABLE 204 SAUDI ARABIA: MARKET, BY APPLICATION, 2022–2029 (KILOTON)
  • TABLE 205 SAUDI ARABIA: MARKET, BY END-USE INDUSTRY, 2022–2029 (USD MILLION)
  • TABLE 206 SAUDI ARABIA: MARKET, BY END-USE INDUSTRY, 2022–2029 (KILOTON)
  • TABLE 207 UAE: UREA MARKET, BY GRADE, 2022–2029 (USD MILLION)
  • TABLE 208 UAE: MARKET, BY GRADE, 2022–2029 (KILOTON)
  • TABLE 209 UAE: MARKET, BY APPLICATION, 2022–2029 (USD MILLION)
  • TABLE 210 UAE: MARKET, BY APPLICATION, 2022–2029 (KILOTON)
  • TABLE 211 UAE: MARKET, BY END-USE INDUSTRY, 2022–2029 (USD MILLION)
  • TABLE 212 UAE: MARKET, BY END-USE INDUSTRY, 2022–2029 (KILOTON)
  • TABLE 213 REST OF GCC COUNTRIES: UREA MARKET, BY GRADE, 2022–2029 (USD MILLION)
  • TABLE 214 REST OF GCC COUNTRIES: MARKET, BY GRADE, 2022–2029 (KILOTON)
  • TABLE 215 REST OF GCC COUNTRIES: MARKET, BY APPLICATION, 2022–2029 (USD MILLION)
  • TABLE 216 REST OF GCC COUNTRIES: MARKET, BY APPLICATION, 2022–2029 (KILOTON)
  • TABLE 217 REST OF GCC COUNTRIES: MARKET, BY END-USE INDUSTRY, 2022–2029 (USD MILLION)
  • TABLE 218 REST OF GCC COUNTRIES: MARKET, BY END-USE INDUSTRY, 2022–2029 (KILOTON)
  • TABLE 219 SOUTH AFRICA: UREA MARKET, BY GRADE, 2022–2029 (USD MILLION)
  • TABLE 220 SOUTH AFRICA: MARKET, BY GRADE, 2022–2029 (KILOTON)
  • TABLE 221 SOUTH AFRICA: MARKET, BY APPLICATION, 2022–2029 (USD MILLION)
  • TABLE 222 SOUTH AFRICA: MARKET, BY APPLICATION, 2022–2029 (KILOTON)
  • TABLE 223 SOUTH AFRICA: MARKET, BY END-USE INDUSTRY, 2022–2029 (USD MILLION)
  • TABLE 224 SOUTH AFRICA: MARKET, BY END-USE INDUSTRY, 2022–2029 (KILOTON)
  • TABLE 225 NIGERIA: UREA MARKET, BY GRADE, 2022–2029 (USD MILLION)
  • TABLE 226 NIGERIA: MARKET, BY GRADE, 2022–2029 (KILOTON)
  • TABLE 227 NIGERIA: MARKET, BY APPLICATION, 2022–2029 (USD MILLION)
  • TABLE 228 NIGERIA: MARKET, BY APPLICATION, 2022–2029 (KILOTON)
  • TABLE 229 NIGERIA: MARKET, BY END-USE INDUSTRY, 2022–2029 (USD MILLION)
  • TABLE 230 NIGERIA: MARKET, BY END-USE INDUSTRY, 2022–2029 (KILOTON)
  • TABLE 231 TÜRKIYE: UREA MARKET, BY GRADE, 2022–2029 (USD MILLION)
  • TABLE 232 TÜRKIYE: MARKET, BY GRADE, 2022–2029 (KILOTON)
  • TABLE 233 TÜRKIYE: MARKET, BY APPLICATION, 2022–2029 (USD MILLION)
  • TABLE 234 TÜRKIYE: MARKET, BY APPLICATION, 2022–2029 (KILOTON)
  • TABLE 235 TÜRKIYE: MARKET, BY END-USE INDUSTRY, 2022–2029 (USD MILLION)
  • TABLE 236 TÜRKIYE: MARKET, BY END-USE INDUSTRY, 2022–2029 (KILOTON)
  • TABLE 237 REST OF MIDDLE EAST & AFRICA: UREA MARKET, BY GRADE, 2022–2029 (USD MILLION)
  • TABLE 238 REST OF MIDDLE EAST & AFRICA: MARKET, BY GRADE, 2022–2029 (KILOTON)
  • TABLE 239 REST OF MIDDLE EAST & AFRICA: MARKET, BY APPLICATION, 2022–2029 (USD MILLION)
  • TABLE 240 REST OF MIDDLE EAST & AFRICA: MARKET, BY APPLICATION, 2022–2029 (KILOTON)
  • TABLE 241 REST OF MIDDLE EAST & AFRICA: MARKET, BY END-USE INDUSTRY, 2022–2029 (USD MILLION)
  • TABLE 242 REST OF MIDDLE EAST & AFRICA: MARKET, BY END-USE INDUSTRY, 2022–2029 (KILOTON)
  • TABLE 243 OVERVIEW OF STRATEGIES DEPLOYED BY KEY PLAYERS IN UREA MARKET, JANUARY 2019–AUGUST 2024
  • TABLE 244 UREA MARKET: DEGREE OF COMPETITION
  • TABLE 245 UREA MARKET: PRODUCT TYPE FOOTPRINT
  • TABLE 246 UREA MARKET: GRADE FOOTPRINT
  • TABLE 247 UREA MARKET: APPLICATION FOOTPRINT
  • TABLE 248 UREA MARKET: END-USE INDUSTRY FOOTPRINT
  • TABLE 249 UREA MARKET: REGION FOOTPRINT
  • TABLE 250 UREA MARKET: KEY STARTUPS/SMES
  • TABLE 251 UREA MARKET: COMPETITIVE BENCHMARKING OF KEY STARTUPS/SMES
  • TABLE 252 UREA MARKET: PRODUCT LAUNCHES, JANUARY 2019–AUGUST 2024
  • TABLE 253 UREA MARKET: DEALS, JANUARY 2019–AUGUST 2024
  • TABLE 254 UREA MARKET: EXPANSIONS, JANUARY 2019–AUGUST 2024
  • TABLE 255 CF INDUSTRIES HOLDINGS, INC.: COMPANY OVERVIEW
  • TABLE 256 CF INDUSTRIES HOLDINGS, INC.: PRODUCTS/SOLUTIONS/SERVICES OFFERED
  • TABLE 257 CF INDUSTRIES HOLDINGS, INC.: DEALS, JANUARY 2019–AUGUST 2024
  • TABLE 258 PUPUK INDONESIA (PERSERO): COMPANY OVERVIEW
  • TABLE 259 PUPUK INDONESIA (PERSERO): PRODUCTS/SOLUTIONS/SERVICES OFFERED
  • TABLE 260 PUPUK INDONESIA (PERSERO): DEALS, JANUARY 2019–AUGUST 2024
  • TABLE 261 YARA INTERNATIONAL ASA: COMPANY OVERVIEW
  • TABLE 262 YARA INTERNATIONAL ASA: PRODUCTS/SOLUTIONS/SERVICES OFFERED
  • TABLE 263 YARA INTERNATIONAL ASA: DEALS, JANUARY 2019–AUGUST 2024
  • TABLE 264 YARA INTERNATIONAL ASA: EXPANSIONS, JANUARY 2019-AUGUST 2024
  • TABLE 265 SABIC: BUSINESS OVERVIEW
  • TABLE 266 SABIC: PRODUCTS/SOLUTIONS/SERVICES OFFERED
  • TABLE 267 SABIC: DEALS, JANUARY 2019–AUGUST 2024
  • TABLE 268 OCI: COMPANY OVERVIEW
  • TABLE 269 OCI: PRODUCTS/SOLUTIONS/SERVICES OFFERED
  • TABLE 270 OCI: PRODUCT LAUNCHES, JANUARY 2019–AUGUST 2024
  • TABLE 271 OCI: DEALS, JANUARY 2019–AUGUST 2024
  • TABLE 272 OCI: EXPANSIONS, JANUARY 2019–AUGUST 2024
  • TABLE 273 NUTRIEN: BUSINESS OVERVIEW
  • TABLE 274 NUTRIEN: PRODUCTS/SOLUTIONS/SERVICES OFFERED
  • TABLE 275 NUTRIEN: DEALS, JANUARY 2019–AUGUST 2024
  • TABLE 276 NUTRIEN: EXPANSIONS, JANUARY 2019–AUGUST 2024
  • TABLE 277 EUROCHEM GROUP: COMPANY OVERVIEW
  • TABLE 278 EUROCHEM GROUP: PRODUCTS/SOLUTIONS/SERVICES OFFERED
  • TABLE 279 EUROCHEM GROUP: DEALS, JANUARY 2019–AUGUST 2024
  • TABLE 280 EUROCHEM GROUP: EXPANSIONS, JANUARY 2019–AUGUST 2024
  • TABLE 281 QATAR FERTILIZER COMPANY: COMPANY OVERVIEW
  • TABLE 282 QATAR FERTILISER COMPANY: PRODUCTS/SOLUTIONS/SERVICES OFFERED
  • TABLE 283 QATAR FERTILISER COMPANY: DEALS, JANUARY 2019–AUGUST 2024
  • TABLE 284 BASF SE: COMPANY OVERVIEW
  • TABLE 285 BASF SE: PRODUCTS/SOLUTIONS/SERVICES OFFERED
  • TABLE 286 BASF SE: PRODUCT LAUNCHES, JANUARY 2019–AUGUST 2024
  • TABLE 287 BASF SE: DEALS, JANUARY 2019–AUGUST 2024
  • TABLE 288 BASF SE: OTHER DEVELOPMENTS, JANUARY 2019–AUGUST 2024
  • TABLE 289 CNPC: COMPANY OVERVIEW
  • TABLE 290 CNPC: PRODUCTS/SOLUTIONS/SERVICES OFFERED
  • TABLE 291 CNPC: DEALS, JANUARY 2019–AUGUST 2024
  • TABLE 292 IFFCO: COMPANY OVERVIEW
  • TABLE 293 IFFCO: PRODUCTS/SOLUTIONS/SERVICES OFFERED
  • TABLE 294 IFFCO: DEALS, JANUARY 2019–AUGUST 2024
  • TABLE 295 AMERICAN PLANT FOOD CORPORATION: COMPANY OVERVIEW
  • TABLE 296 GREENWAY BIOTECH, INC.: COMPANY OVERVIEW
  • TABLE 297 GAC CHEMICAL CORPORATION: COMPANY OVERVIEW
  • TABLE 298 RAVENSDOWN: COMPANY OVERVIEW
  • TABLE 299 VINIPUL INORGANICS PVT. LTD.: COMPANY OVERVIEW
  • TABLE 300 GUJARAT STATE FERTILIZERS & CHEMICALS LIMITED (GSFC): COMPANY OVERVIEW
  • TABLE 301 GROUP DF: COMPANY OVERVIEW
  • TABLE 302 FERTIBERIA: COMPANY OVERVIEW
  • TABLE 303 KANTO CHEMICAL CO., INC.: COMPANY OVERVIEW
  • TABLE 304 DUBI CHEM MARINE INTERNATIONAL: COMPANY OVERVIEW
  • TABLE 305 PT PUPUK SRIWIDJAJA PALEMBANG (PUSRI): COMPANY OVERVIEW
  • TABLE 306 JSC TOGLIATTIAZOT (TOAZ): COMPANY OVERVIEW
  • TABLE 307 ANMOL CHEMICALS PRIVATE LIMITED: COMPANY OVERVIEW
  • TABLE 308 GREENSTAR FERTILIZERS LIMITED: COMPANY OVERVIEW
  • TABLE 309 MATIX FERTILISERS AND CHEMICALS LIMITED: COMPANY OVERVIEW
  • TABLE 310 KOCH FERTILIZER, LLC
  • TABLE 311 AMMONIUM SULFATE MARKET, BY TYPE, 2022–2029 (USD MILLION)
  • TABLE 312 AMMONIUM SULFATE MARKET, BY TYPE, 2022–2029 (KILOTON)
  • TABLE 313 AMMONIUM SULFATE MARKET, BY APPLICATION, 2022–2029 (USD MILLION)
  • TABLE 314 AMMONIUM SULFATE MARKET, BY APPLICATION, 2022–2029 (KILOTON)
  • TABLE 315 AMMONIUM SULFATE MARKET, BY REGION, 2022–2029 (USD MILLION)
  • TABLE 316 AMMONIUM SULFATE MARKET, BY REGION, 2022–2029 (KILOTON)
  • TABLE 317 NITROGENOUS FERTILIZERS MARKET, BY TYPE, 2014–2022 (USD BILLION)
  • TABLE 318 NITROGENOUS FERTILIZERS MARKET, BY TYPE, 2014–2022 (KILOTON)
  • TABLE 319 NITROGENOUS FERTILIZERS MARKET, BY CROP TYPE, 2014–2022 (USD BILLION)
  • TABLE 320 NITROGENOUS FERTILIZERS MARKET, BY CROP TYPE, 2014–2022 (KILOTON)
  • TABLE 321 NITROGENOUS FERTILIZERS MARKET, BY FORM, 2014–2022 (USD BILLION)
  • TABLE 322 NITROGENOUS FERTILIZERS MARKET, BY FORM, 2014–2022 (KILOTON)
  • TABLE 323 NITROGENOUS FERTILIZERS MARKET, BY REGION, 2014–2022 (USD THOUSAND)
  • TABLE 324 NITROGENOUS FERTILIZERS MARKET, BY REGION, 2014–2022 (KILOTON)
LIST OF FIGURES
 
  • FIGURE 1 UREA MARKET SEGMENTATION AND REGIONAL SCOPE
  • FIGURE 2 UREA MARKET: RESEARCH DESIGN
  • FIGURE 3 MARKET SIZE ESTIMATION METHODOLOGY: BOTTOM-UP APPROACH
  • FIGURE 4 MARKET SIZE ESTIMATION METHODOLOGY: TOP-DOWN APPROACH
  • FIGURE 5 UREA MARKET: DATA TRIANGULATION
  • FIGURE 7 GRANULAR UREA TO REMAIN LARGEST TYPE SEGMENT
  • FIGURE 8 AGRICULTURAL GRADE UREA TO DOMINATE MARKET DURING FORECAST PERIOD
  • FIGURE 9 NITROGENOUS FERTILIZERS APPLICATION TO COMMAND UREA MARKET
  • FIGURE 10 STAMICARBON TECHNOLOGY TO BE LARGEST SEGMENT
  • FIGURE 11 AGRICULTURE INDUSTRY TO DOMINATE UREA MARKET
  • FIGURE 12 ASIA PACIFIC ACCOUNTED FOR LARGEST SHARE IN UREA MARKET
  • FIGURE 13 ASIA PACIFIC TO GROW AT HIGH CAGR DURING FORECAST PERIOD
  • FIGURE 14 GRANULAR UREA TO LEAD DURING FORECAST PERIOD
  • FIGURE 15 AGRICULTURAL GRADE TO BE FASTEST-GROWING SEGMENT DURING FORECAST PERIOD
  • FIGURE 16 NITROGENOUS FERTILIZERS TO DOMINATE MARKET DURING FORECAST PERIOD
  • FIGURE 17 STAMICARBON REGISTERED LARGEST MARKET SHARE
  • FIGURE 18 AGRICULTURE INDUSTRY TO DOMINATE MARKET DURING FORECAST PERIOD
  • FIGURE 19 ASIA PACIFIC AND AGRICULTURAL GRADE LED THEIR RESPECTIVE SEGMENTS IN UREA MARKET IN 2023
  • FIGURE 20 UREA MARKET IN INDIA TO GROW AT HIGHEST CAGR
  • FIGURE 21 DRIVERS, RESTRAINTS, OPPORTUNITIES, AND CHALLENGES IN UREA MARKET
  • FIGURE 22 WORLD FERTILIZER CONSUMPTION- HISTORICAL TRENDS
  • FIGURE 23 NATURAL GAS SPOT PRICE (USD PER MILLION BTU)
  • FIGURE 24 PRICE TREND OF UREA (USD/TON)
  • FIGURE 25 REVENUE SHIFT FOR UREA MANUFACTURERS
  • FIGURE 26 AVERAGE SELLING PRICE TREND OF KEY PLAYERS, BY GRADE
  • FIGURE 27 AVERAGE SELLING PRICE TREND, BY REGION (USD/TON)
  • FIGURE 28 UREA MARKET: VALUE CHAIN ANALYSIS
  • FIGURE 29 UREA MARKET: ECOSYSTEM MAPPING
  • FIGURE 30 GLOBAL AI ADOPTION, 2023
  • FIGURE 31 LIST OF MAJOR PATENTS FOR UREA (2014–2023)
  • FIGURE 32 COUNTRY-WISE EXPORT DATA FOR HS CODE 310210 (USD MILLION)
  • FIGURE 33 COUNTRY-WISE IMPORT SCENARIO FOR HS CODE 310210 (USD MILLION)
  • FIGURE 34 COUNTRY-WISE EXPORT DATA FOR HS CODE 310280 (USD MILLION)
  • FIGURE 35 COUNTRY-WISE IMPORT DATA FOR HS CODE 310280 (USD MILLION)
  • FIGURE 36 UREA MARKET: PORTER’S FIVE FORCES ANALYSIS
  • FIGURE 37 INFLUENCE OF STAKEHOLDERS ON BUYING PROCESS
  • FIGURE 38 KEY BUYING CRITERIA FOR END-USE INDUSTRIES
  • FIGURE 39 INVESTMENT AND FUNDING SCENARIO
  • FIGURE 40 AGRICULTURAL GRADE SEGMENT TO ACCOUNT FOR LARGEST MARKET SHARE DURING FORECAST PERIOD
  • FIGURE 41 NITROGENOUS FERTILIZERS SEGMENT TO ACCOUNT FOR LARGEST MARKET SHARE DURING FORECAST PERIOD
  • FIGURE 42 AGRICULTURE SEGMENT TO ACCOUNT FOR LARGEST MARKET SHARE DURING FORECAST PERIOD
  • FIGURE 43 GRANULAR UREA SEGMENT TO ACCOUNT FOR LARGEST MARKET SHARE DURING FORECAST PERIOD
  • FIGURE 44 STAMICARBON SEGMENT TO ACCOUNT FOR LARGEST MARKET SHARE DURING FORECAST PERIOD
  • FIGURE 45 INDIA AND CHINA EMERGING AS STRATEGIC LEADERS IN UREA MARKET
  • FIGURE 46 ASIA PACIFIC TO BE FASTEST-GROWING MARKET FOR UREA DURING FORECAST PERIOD
  • FIGURE 47 ASIA PACIFIC: UREA MARKET SNAPSHOT
  • FIGURE 48 SOUTH AMERIA: UREA MARKET SNAPSHOT
  • FIGURE 49 CARBON FOOTPRINT OF FERTILIZER PRODUCTION
  • FIGURE 50 UREA MARKET: MARKET SHARE ANALYSIS
  • FIGURE 51 UREA MARKET: REVENUE ANALYSIS OF KEY COMPANIES IN LAST FIVE YEARS
  • FIGURE 52 COMPANY VALUATION (USD BILLION), 2024
  • FIGURE 53 FINANCIAL MATRIX: EV/EBITDA RATIO, 2024
  • FIGURE 54 PRODUCT COMPARISON
  • FIGURE 55 UREA MARKET: COMPANY EVALUATION MATRIX (KEY PLAYERS), 2023
  • FIGURE 56 UREA MARKET: COMPANY FOOTPRINT
  • FIGURE 57 UREA MARKET: COMPANY EVALUATION MATRIX (STARTUPS/SMES), 2023
  • FIGURE 58 CF INDUSTRIES HOLDINGS, INC.: COMPANY SNAPSHOT
  • FIGURE 59 PUPUK INDONESIA (PERSERO): COMPANY SNAPSHOT
  • FIGURE 60 YARA INTERNATIONAL ASA: COMPANY SNAPSHOT
  • FIGURE 61 SABIC: COMPANY SNAPSHOT
  • FIGURE 62 OCI: COMPANY SNAPSHOT
  • FIGURE 63 NUTRIEN: COMPANY SNAPSHOT
  • FIGURE 64 EUROCHEM GROUP: COMPANY SNAPSHOT
  • FIGURE 65 QATAR FERTILIZER COMPANY: COMPANY SNAPSHOT
  • FIGURE 66 BASF SE: COMPANY SNAPSHOT
  • FIGURE 67 CNPC: COMPANY SNAPSHOT
  • FIGURE 68 IFFCO: COMPANY SNAPSHOT


The study involved four major activities for estimating the current size of the global urea market. Exhaustive secondary research was conducted to collect information on the market, the peer product market, and the parent product group market. The next step was to validate these findings, assumptions, and sizes with the industry experts across the value chain of urea through primary research. Both the top-down and bottom-up approaches were employed to estimate the overall size of the urea market. After that, market breakdown and data triangulation procedures were used to determine the size of different segments and sub-segments of the market.

Secondary Research

In the secondary research process, various secondary sources such as Hoovers, Factiva, Bloomberg BusinessWeek, and Dun & Bradstreet were referred, to identify and collect information for this study on the urea market. These secondary sources included annual reports, press releases & investor presentations of companies; white papers; certified publications; articles by recognized authors; regulatory bodies, trade directories, and databases.

Primary Research

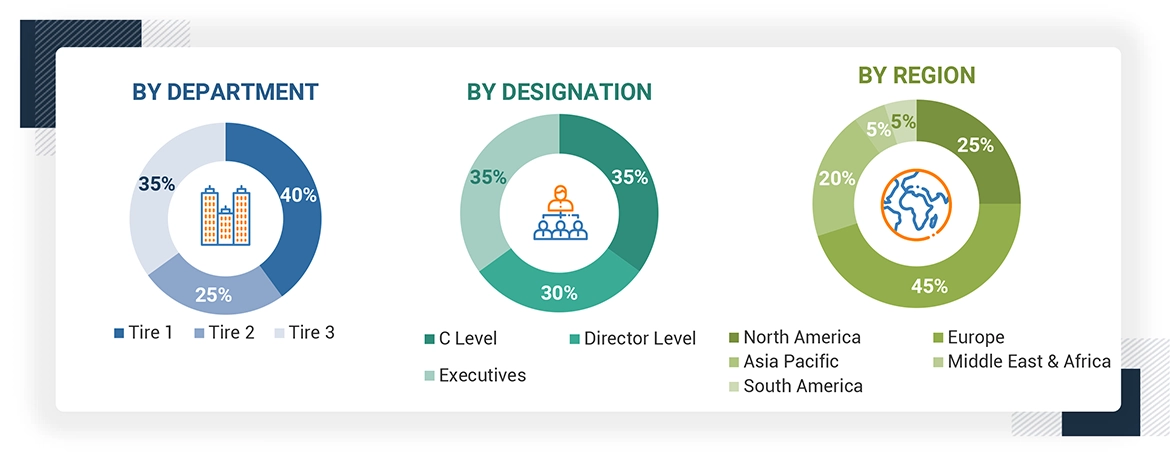
The urea market comprises several stakeholders in the supply chain, which include raw material suppliers, processors, end-product manufacturers, buyers, and regulatory organizations. Various primary sources from the supply and demand sides of the markets have been interviewed to obtain qualitative and quantitative information. The primary participants from the demand side include key opinion leaders, executives, vice presidents, and CEOs of companies in the urea market. Primary sources from the supply side include associations and institutions involved in the urea industry, key opinion leaders, and processing players.

Following is the breakdown of primary respondents:
To know about the assumptions considered for the study, download the pdf brochure

Market Size Estimation

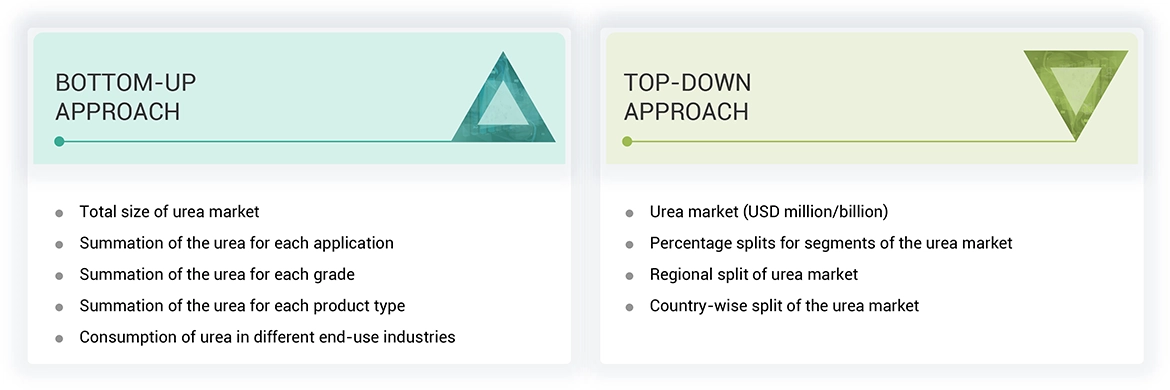
The bottom-up and top-down approaches have been used to estimate the urea market by product type, grade, technology, application, end-use industry, and region. The research methodology used to calculate the market size includes the following steps:

  • The key players in the industry and markets were identified through extensive secondary research.
  • In terms of value, the industry’s supply chain and market size were determined through primary and secondary research processes.
  • All percentage shares, splits, and breakdowns were determined using secondary sources and verified through primary sources.
  • All possible parameters that affect the markets covered in this research study were accounted for, viewed in extensive detail, verified through primary research, and analyzed to obtain the final quantitative and qualitative data.
  • The research included studying reports, reviews, and newsletters of top market players and extensive interviews with leaders such as directors and marketing executives to obtain opinions.
  • The following figure illustrates the overall market size estimation process employed for this study.
Data Triangulation

After arriving at the overall size of the urea market from the estimation process explained above, the total market was split into several segments and sub-segments. The data triangulation and market breakdown procedures were employed, wherever applicable, to complete the overall market engineering process and arrive at the exact statistics for all segments and subsegments. The data was triangulated by studying various factors and trends from both the demand and supply sides. Along with this, the market size was validated using both the top-down and bottom-up approaches.

Market Definition

Urea is an organic compound that exists as a white odorless and tasteless crystalline solid, consisting of carbon, nitrogen, oxygen, and hydrogen. It is highly soluble in water and hence is crucially necessary in the majority of industrial and agricultural sectors all over the world. Urea primarily acts as a fertilizer, which contains high percentages of nitrogen, making it proficiently efficient in transport and application in agriculture. Besides its strategic position in agriculture, urea serves as a raw material for chemical manufacturing, and pharmaceuticals, and through animal feed, it serves as the source of important nutrients. Urea is a critical component of high productivity in agriculture and assists other industrial operations, and it is also substantially applied in environmental applications, like diesel exhaust fluid, to reduce the nitrogen oxide concentration that diesel engines emit, thereby paving its way toward cleaner air standards.

Stakeholders

  • Urea manufacturers
  • Urea suppliers
  • Fertilizer manufacturers
  • Pharmaceutical companies
  • Chemical industries
  • Government agencies
  • Raw material suppliers

Report Objectives

  • To provide detailed information regarding the key factors influencing the growth of the market (drivers, restraints, opportunities, and challenges)
  • To forecast the market size based on product type, grade, technology, application, end-use industry, and region.
  • To forecast the market size for the five main regions—North America, Europe, Asia Pacific (APAC), the Middle East & Africa (MEA), and South America—along with their key countries
  • To strategically analyze micro markets with respect to individual growth trends, prospects, and contributions to the total market
  • To analyze the opportunities in the market for stakeholders and provide details of the competitive landscape for the market leaders
  • To strategically profile leading players and comprehensively analyze their key developments such as new product launches, expansions, and acquisitions in the urea market
  • To define, describe, and forecast the size of the global urea market in terms of value and volume
  • To strategically profile key players and comprehensively analyze their market shares and core competencies.


Previous Versions of this Report

Custom Market Research Services

We Will Customise The Research For You, In Case The Report Listed Above Does Not Meet With Your Requirements

Get 10% Free Customisation

Growth opportunities and latent adjacency in Urea Market

DMCA.com Protection Status