Unit Dose Packaging Market

Unit Dose Packaging Market by Form (Liquid, Solid, Powder, Gel), Material Type (Plastic, Glass, Paper, Aluminium), Product Type, End-use industry (Pharmaceuticals, Cosmetic & Personal Care, Nutraceuticals), and Region - Global Forecast to 2029

Report Code: PK 9105 Aug, 2024, by marketsandmarkets.com

Unit Dose Packaging Market

The global unit dose packaging market is valued at USD 29.1 billion in 2024 and is projected to reach USD 43.8 billion by 2029, growing at 8.5% CAGR from 2024 to 2029.

The unit dose packaging market is expanding rapidly due to rising demand from key industries including pharmaceuticals, cosmetics and personal care, nutraceuticals, electronics, and food and beverage. This spike is being driven by rising healthcare spending in emerging economies and stricter environmental rules for packaging solutions. With the US playing a key part in this growth trajectory and a significant increase in both production and consumption of unit dosage packaging, North America is notably the fastest-growing market. The North American market is being pushed by the need for accurate and convenient medicine, rising healthcare expenditures, and the desire for effective drug management among ageing populations. The need for unit dose packaging is driven by key end-use industries such as pharmaceuticals, cosmetics and personal care, and nutraceuticals, which employ unit dose packaging for accurate dosing, user convenience, and safety enhancement.

Attractive Opportunities in the Unit Dose Packaging Market

Unit Dose Packaging Market

To know about the assumptions considered for the study, Request for Free Sample Report

Unit Dose Packaging Market

Unit Dose Packaging Market Dynamics

Driver: Thriving Pharmaceutical Sector and surge in healthcare expenditure

The growing pharmaceutical sector and rising healthcare expenditure are key drivers of the unit dose packaging market. The expansion of the pharmaceutical industry increases the demand for precise, efficient, and safe medication delivery systems. Unit dose packaging, with its accurate, pre-measured doses, reduces dosing errors and enhances patient safety. For example, pre-filled syringes and single-use vials, which ensure exact medication amounts, minimizing waste and improving treatment outcomes. The rise in healthcare expenditure, driven by aging populations and chronic diseases, boosts investment in advanced packaging solutions. For instance, China's median age rose from about 20 years in 1970 to 37.5 years in 2020 and is expected to reach 60 by 2100. According to WHO's 2024 data, healthcare spending in 2021 was 9.89% of GDP in Brazil, 5.38% in China, and 3.38% in India. Factors such as population growth, government support, healthcare advancements, and emerging diseases contribute to this spending increase. Hospitals and healthcare providers adopt unit dose packaging to streamline medication administration, improve inventory management, and reduce contamination and medication errors. This is evident in the widespread use of blister packs for oral medications and single-dose containers for liquid drugs, supporting better adherence to treatments and enhancing healthcare efficiency.

Restraint: The setup and maintenance of unit dose packaging machines

Setting up and maintaining unit dose packaging machines require substantial capital investment, presenting a significant barrier for small and medium-sized enterprises (SMEs) looking to enter the market. The high initial costs of these machines can hinder SMEs from competing effectively. The cost of pharmaceutical packaging machines varies widely based on type and complexity. For instance, a basic tablet blister sealing machine costs around USD 299.1 per unit, while advanced equipment like automatic two-head liquid vial filling machines is priced at approximately USD 2692.03 each. High-end machines, such as ALU blister packaging machines, can cost up to USD 23929.16 per piece. According to ResearchGate, the overall cost for manufacturer-based unit dose packaging systems is USD 91,272, whereas in-house packaging is calculated at USD 93,053, highlighting the significant financial burden of setting up in-house systems, including acquisition, labor, repackaging consumables, and maintenance costs. Ongoing expenses such as maintenance, regulatory compliance, and skilled labor further increase the financial burden on SMEs. These high costs can prevent SMEs from entering the market or expanding their operations, limiting their ability to compete and innovate within the unit dose packaging sector.

Opportunities: Market expansion in nutraceuticals and cosmetics

The growth of the nutraceuticals and cosmetics markets is creating valuable opportunities for unit dose packaging, driven by changing consumer preferences and industry trends. In the nutraceutical sector, there is a rising demand for convenient and precise dosing options, which unit dose packaging addresses with pre-measured portions like single-dose sachets or vials. This simplifies daily supplementation and ensures accurate intake, such as single-dose sachets for vitamin C. In cosmetics, the trend towards personalized skincare and advanced delivery systems is supported by unit dose packaging, which offers precise dispensing of serums, lotions, and creams, preserving active ingredients and improving efficacy. Single-dose ampoules for facial serums, for example, provide freshness and exact dosing per application, meeting consumer preferences for hygiene and quality. Additionally, there is a growing emphasis on sustainability, driving the adoption of eco-friendly materials and designs in unit dose packaging for both nutraceuticals and cosmetics. Companies are exploring biodegradable materials and reducing packaging waste to align with environmental concerns and consumer expectations. The expansion of these markets presents robust opportunities for innovation in unit dose packaging, allowing brands to meet the demand for convenience, accuracy, and sustainability, and differentiate themselves in competitive markets.

Challenges: High initial investment

The high initial investment required for unit dose packaging presents a significant challenge for companies, including new entrants and established players aiming to expand. This packaging demands specialized, costly machinery to ensure precise dosing, product integrity, and regulatory compliance, particularly in pharmaceuticals. Costs can reach hundreds of thousands or even millions of dollars, posing a financial burden, especially for small and medium-sized enterprises (SMEs). Securing funding for these expenses is often difficult, limiting SMEs' market competitiveness. SMEs also struggle with acquiring the technical expertise and resources needed to implement and maintain these technologies. Beyond equipment purchase, costs for installation, staff training, ongoing maintenance, and regulatory compliance strain financial resources and operational budgets, affecting profitability and long-term viability. While unit dose packaging offers precise dosing and product safety, the substantial upfront investment remains a major hurdle, impacting companies' growth prospects and competitive positioning.

Unit Dose Packaging Market ECOSYSTEM

Unit Dose Packaging Market Ecosystem

Liquid segment accounted for the largest form of unit dose packaging.

As it is widely used in the pharmaceutical industry for injectable drugs and vaccines, liquid unit dose packaging is the market leader, with 42.5% of the overall market share in 2023. Pre-filled syringes and ampoules are widely used for giving insulin and vaccinations, providing precise dosing and cleanliness. In the nutraceutical industry, liquid dietary supplements and health shots, including energy boosters and liquid vitamins, are prominent due to their ease of use and quick absorption. With single-use vials of serums and face treatments offering precise application and minimising contamination, the cosmetics industry also benefits from liquid unit dose packaging. Liquid unit dose packaging extends the shelf life and safety of products by providing excellent defence against oxidation and contamination. This is especially important for the pharmaceutical and cosmetic industries, where sterility and product integrity are critical.

Glass segment accounted for the third largest material type of unit dose packaging

Glass, a hard and brittle substance formed by melting silica (sand) with additions like soda ash and limestone, cools to a clear or translucent, non-crystalline solid. It is preferred for unit dose packaging in a variety of sectors due to its superior barrier qualities and inert nature. Glass provides an impermeable barrier against gases, moisture, and odours, ensuring the integrity and stability of drugs, chemicals, and delicate products for extended durations. Recent advances in glass technology have resulted in developments such as laminated glass for increased safety, self-cleaning glass for simpler upkeep, and smart glass with adjustable transparency, energy-efficient (Low-E) glass for reduced heat transmission and improved illumination. These advancements are improving modern glass technology and broadening its applications. The COVID-19 pandemic highlighted the need of glass packaging, particularly for vaccine delivery, resulting in a significant surge in demand. Glass is commonly used to manufacture precision chemical reagents, medical devices such as prefilled syringes, and vials and ampoules for pharmaceutical unit dose packaging.

Ampoules & Vials segment accounted for the third largest product type of unit dose packaging

Ampoules and Vials are tiny, sealed containers for unit dose packaging. Vials are cylindrical with screw closures, whereas ampoules are sealed glass canisters that can be snapped open. Both are used for keeping and dispensing liquid medications, and are usually manufactured of glass or plastic to guarantee sterility and product integrity. Plastic ampoules are gaining demand because they have superior barrier qualities, greater dimensional stability, and a lower danger of breakage than glass. The growing global need for biologics, insulin, and vaccines is a significant driver of the vials and ampoules industry. Packaging is changing as a result of innovations like Blow-Fill-Seal (BFS) technology, which offers a flexible, affordable solution that satisfies strict sterility requirements and, due to its high automation, minimises the need for manual labour. Modern pharmaceutical packaging includes smart elements such as Near Field Communication (NFC), Radio Frequency Identification (RFID), and QR codes to provide extensive information about product quality, handling, storage, and delivery. Leading firms such as Schott AG and Gerresheimer AG are developing the industry with breakthroughs in glass composition and ready-to-fill technologies, respectively, to satisfy changing market demands and assure continuous growth in the ampoules and vials industry.

Nutraceuticals end-use industry accounted for the third largest end-use industry of unit dose packaging.

The nutraceutical sector uses a variety of unit dose packaging methods, such as sachets, stick packs, ampoules, capsules, and soft gel capsules, to ensure accurate supplement delivery. Unit dose packaging is critical in this industry because it ensures precise dosing, protects product integrity, and increases consumer compliance. Sachets and stick packs are adaptable packaging options for  liquids, powders, capsules, tablets, and gummies. Paper and paperboard nutraceutical packaging innovations, such as improved branding and labelling, braille compliance features, and full regulatory information, are projected to propel the industry forward. Interactive packaging is an innovative design that mixes contemporary technology with traditional materials, including sensors that track product freshness and consumption in real time. Consumers can utilise mobile apps to access information about efficacy, safety, and environmental considerations. Amcor Plc and Constantia Flexibles are two key players that provide flexible packaging solutions for nutraceutical items, such as sachets, stick packs, pouches, and more.

Middle East & Africa is estimated to account for the fifth largest market share during the forecast period.

According to the CIA World Factbook, all Middle Eastern and African countries are predicted to continue positive GDP growth rates, highlighting the region's relevance in the unit dose packaging industry. Government of Saudi Arabia pledged over USD 71 billion to achieving its Vision 2030 goals, including considerable investments in packaging. These investments are propelling the unit dosage packaging industry forward as manufacturers create innovative products. The growth of end-use industries like pharmaceuticals, cosmetics and personal care, and nutraceuticals is driving up demand for unit dose packaging. The market in the Middle East and Africa is mainly propelled by the healthcare industry's increasing demand for accurate and convenient drug delivery. The increase in chronic diseases, combined with the need for exact dosage and user-friendly drug formats, is driving healthcare practitioners and patients to favour unit dose packaging. Strict legal constraints pertaining to medication compliance and patient safety are also encouraging this packing solution. The region's developing pharmaceutical industry, combined with developments in packaging technology, is driving market expansion. Trends towards personalised treatment, as well as effective inventory management in hospitals and clinics, are boosting demand for unit dose packaging in the Middle East and Africa.

Unit Dose Packaging Market by Region

To know about the assumptions considered for the study, download the pdf brochure

Unit Dose Packaging Market Players

The Unit dose packaging market comprises key manufacturers such as are Pfizer Inc. (US), Amcor Plc (Switzerland), Corning Incorporated (US), West Pharmaceutical Services (US), Stevanato Group (Italy), Gerresheimer AG (Germany), SCHOTT (Germany), Nipro (Japan), Constantia Flexibles (Austria), and Klöckner Pentaplast (UK), are the top manufacturers covered in the unit dose packaging market. Expansions, mergers & acquisitions, new product launches and deals were some of the major strategies adopted by these key players to enhance their positions in the unit dose packaging market. A major focus was given to the expansions and deals.

Unit Dose Packaging Market Scope

Report Metric

Details

Market size available for years

2022–2029

Base year considered

2023

Forecast period

2024–2029

Forecast units

Value (USD Million)

Segments Covered

Form, Material Type, Product Type, End-Use Industry, and Region

Geographies covered

North America, Asia Pacific, Europe, South America, and Middle East & Africa.

Companies covered

Pfizer Inc. (US), Amcor Plc (Switzerland), Corning Incorporated (US), West Pharmaceutical Services (US), Stevanato Group (Italy), Gerresheimer AG (Germany), SCHOTT (Germany), Nipro (Japan), Constantia Flexibles (Austria), and Klöckner Pentaplast (UK), among others.
25 manufacturers are covered in the unit dose packaging market.

This research report categorizes the unit dose packaging market based on Form, Material Type, Product Type, End-Use Industry, and Region.

Based on Form:
  • Liquid
  • Solid
  • Powder
  • Gel
Based on Material Type:
  • Plastic
  • Glass
  • Paper & Paper Board
  • Aluminium
  • Other Material Types
Based on Product Type:
  • Blister Pack
  • Sachets & Strip Packs
  • Ampoules & Vials
  • Other Product Types
Based on End-Use Industry:
  • Pharmaceuticals
  • Cosmetic & Personal Care
  • Nutraceuticals
  • Other End-Use Industries
Based on Region:
  • North America
  • Europe
  • Asia Pacific
  • Middle East & Africa
  • South America

Recent Developments

  • In April 2024, Pfizer Inc. launched a new single-dose vial of Idamycin PFS (idarubicin hydrochloride injection), 10 mg/10 mL (1 mg/mL). Its reinforced PVC bottom provides strong shatter resistance, enabling safe handling in delicate conditions. The clear and transparent design allows easy viewing, aiding confident and precise handling in healthcare environments.
  • In January 2024, Amcor announces an expansion of its thermoforming production capacity to support healthcare customer growth in North America, including Wisconsin. This will meet clients’ growing pharmaceutical, consumer health, and medical needs.
  • In February 2023, Corning Incorporated and Gerresheimer AG have joined forces to increase the global availability of the Velocity Vial technology platform. The goal is to improve access to efficient and cost-effective techniques for filling high-quality injectable pharmaceuticals.
  • In August 2022, West Pharmaceutical Services has invested strategically in Latch Medical Limited, a Dublin-based company specializing in innovative vaccination and biologics delivery technology via intradermal routes. This investment seeks to create and enhance products that improve the effectiveness and efficiency of healthcare delivery.
  • In March 2023, Stevanato Group and Recipharm have teamed up to develop pre-fillable syringes, providing pharmaceutical companies with more packaging options. Stevanato Group will supply its Alba glass pre-fillable syringe and Recipharm's ISMTM technology for the Pre-Filled Syringe Inhaler (PFSITM).

Frequently Asked Questions (FAQ):

To speak to our analyst for a discussion on the above findings, click Speak to Analyst

TABLE OF CONTENTS
 
1 INTRODUCTION (Page No. - 22)
    1.1 STUDY OBJECTIVES 
    1.2 MARKET DEFINITION 
           1.2.1 INCLUSIONS AND EXCLUSIONS
    1.3 STUDY SCOPE 
           1.3.1 UNIT DOSE PACKAGING MARKET SEGMENTATION
           1.3.2 YEARS CONSIDERED
           1.3.3 CURRENCY CONSIDERED
           1.3.4 UNITS CONSIDERED
    1.4 LIMITATIONS 
    1.5 STAKEHOLDERS 
 
2 RESEARCH METHODOLOGY (Page No. - 27)
    2.1 RESEARCH DATA 
           2.1.1 SECONDARY DATA
                    2.1.1.1 Key data from secondary sources
           2.1.2 PRIMARY DATA
                    2.1.2.1 Key data from primary sources
                    2.1.2.2 Key primary participants
                    2.1.2.3 Key industry insights
                    2.1.2.4 Breakdown of interviews with experts
    2.2 MARKET SIZE ESTIMATION 
           2.2.1 BOTTOM-UP APPROACH
           2.2.2 TOP-DOWN APPROACH
    2.3 FORECAST NUMBER CALCULATION 
    2.4 DATA TRIANGULATION 
    2.5 FACTOR ANALYSIS 
    2.6 ASSUMPTIONS 
    2.7 RESEARCH LIMITATIONS AND RISKS 
 
3 EXECUTIVE SUMMARY (Page No. - 38)
 
4 PREMIUM INSIGHTS (Page No. - 42)
    4.1 ATTRACTIVE OPPORTUNITIES FOR PLAYERS IN UNIT DOSE PACKAGING MARKET 
    4.2 NORTH AMERICA: UNIT DOSE PACKAGING MARKET, BY END-USE INDUSTRY AND COUNTRY 
    4.3 NORTH AMERICA UNIT DOSE PACKAGING MARKET, BY PRODUCT TYPE 
    4.4 NORTH AMERICA UNIT DOSE PACKAGING MARKET, BY END-USE INDUSTRY 
    4.5 UNIT DOSE PACKAGING MARKET, BY KEY COUNTRY 
 
5 MARKET OVERVIEW (Page No. - 45)
    5.1 INTRODUCTION 
    5.2 MARKET DYNAMICS 
           5.2.1 DRIVERS
                    5.2.1.1 Thriving pharmaceutical sector and surge in healthcare expenditure
                    5.2.1.2 Rising demand for blister packaging
                    5.2.1.3 Consumer preference for convenience and portability
           5.2.2 RESTRAINTS
                    5.2.2.1 Substantial capital investment required for setup and maintenance of unit dose packaging machines
                    5.2.2.2 Environmental concerns
           5.2.3 OPPORTUNITIES
                    5.2.3.1 Increasing demand for primary pharmaceutical packaging
                    5.2.3.2 Market expansion in nutraceuticals and cosmetics
           5.2.4 CHALLENGES
                    5.2.4.1 Technological challenges
                    5.2.4.2 High initial investment
 
6 INDUSTRY TRENDS (Page No. - 51)
    6.1 PORTER’S FIVE FORCES ANALYSIS 
           6.1.1 THREAT OF NEW ENTRANTS
           6.1.2 THREAT OF SUBSTITUTES
           6.1.3 BARGAINING POWER OF SUPPLIERS
           6.1.4 BARGAINING POWER OF BUYERS
           6.1.5 INTENSITY OF COMPETITIVE RIVALRY
    6.2 VALUE CHAIN ANALYSIS 
    6.3 TRADE ANALYSIS 
           6.3.1 EXPORT SCENARIO
           6.3.2 IMPORT SCENARIO
    6.4 IMPACT OF GEN AI ON UNIT DOSE PACKAGING 
           6.4.1 INTEGRATING AI IN UNIT DOSE PACKAGING
           6.4.2 BEST PRACTICES TO LEVERAGE AI FOR UNIT DOSE PACKAGING MARKET
           6.4.3 USE CASES OF GENERATIVE AI IN UNIT DOSE PACKAGING MARKET
                    6.4.3.1 Future of generative AI in unit dose packaging market
    6.5 MACROECONOMIC INDICATORS 
           6.5.1 GLOBAL GDP OUTLOOK
    6.6 TECHNOLOGY ANALYSIS 
           6.6.1 KEY TECHNOLOGIES
                    6.6.1.1 Blister packaging
                    6.6.1.2 Strip packaging
                    6.6.1.3 Blow-Fill-Seal
           6.6.2 COMPLEMENTARY TECHNOLOGIES
                    6.6.2.1 Smart packaging
                    6.6.2.2 Barrier and coating
    6.7 TARIFF AND REGULATORY LANDSCAPE 
           6.7.1 TARIFF RELATED TO UNIT DOSE PACKAGING MARKET
           6.7.2 REGULATORY BODIES, GOVERNMENT AGENCIES, AND OTHER ORGANIZATIONS
    6.8 CASE STUDY ANALYSIS 
    6.9 TRENDS AND DISRUPTIONS IMPACTING CUSTOMER BUSINESS 
    6.10 KEY CONFERENCES & EVENTS IN 2024–2025 
    6.11 KEY STAKEHOLDERS AND BUYING CRITERIA 
           6.11.1 KEY STAKEHOLDERS IN BUYING PROCESS
           6.11.2 BUYING CRITERIA
    6.12 ECOSYSTEM ANALYSIS 
    6.13 PATENT ANALYSIS 
           6.13.1 INTRODUCTION
           6.13.2 METHODOLOGY
    6.14 PRICING ANALYSIS 
           6.14.1 AVERAGE SELLING PRICE OF PHARMACEUTICAL PACKAGING, BY REGION
           6.14.2 AVERAGE SELLING PRICE TREND OF KEY PLAYERS, BY MATERIAL TYPE
           6.14.3 INVESTMENT AND FUNDING SCENARIO
 
7 UNIT DOSE PACKAGING MARKET, BY FORM (Page No. - 81)
    7.1 INTRODUCTION 
    7.2 LIQUID 
    7.3 SOLID 
    7.4 POWDER 
    7.5 GEL 
 
8 UNIT DOSE PACKAGING MARKET, BY MATERIAL TYPE (Page No. - 84)
    8.1 INTRODUCTION 
    8.2 PLASTIC 
           8.2.1 POLYVINYL CHLORIDE
           8.2.2 POLYETHYLENE
           8.2.3 POLYPROPYLENE
           8.2.4 POLYETHYLENE TEREPHTHALATE
           8.2.5 OTHER PLASTIC FILMS
    8.3 GLASS 
    8.4 PAPER & PAPERBOARD 
    8.5 ALUMINUM 
    8.6 OTHER MATERIAL TYPES 
 
9 UNIT DOSE PACKAGING MARKET, BY PRODUCT TYPE (Page No. - 90)
    9.1 INTRODUCTION 
    9.2 BLISTER PACKS 
           9.2.1 ENSURE DRUG DOSING ACCURACY AND INCREASED SAFETY
    9.3 SACHETS & STRIP PACKS 
           9.3.1 MAINTAIN PRODUCT FRESHNESS AND QUALITY
    9.4 AMPOULES & VIALS 
           9.4.1 USED FOR STORING AND DISPENSING LIQUID PHARMACEUTICALS
    9.5 OTHER PRODUCT TYPES 
 
10 UNIT DOSE PACKAGING, BY END-USE INDUSTRY (Page No. - 94)
     10.1 INTRODUCTION 
     10.2 PHARMACEUTICALS 
             10.2.1 INCREASED DEMAND FOR PREFILLED SYRINGES AND AUTO-INJECTORS
     10.3 COSMETICS & PERSONAL CARE 
             10.3.1 EXTENDING SHELF LIFE OF BEAUTY PRODUCTS
     10.4 NUTRACEUTICALS 
             10.4.1 ADMINISTRATION OF PRECISE DOSAGE AND CONSUMER COMPLIANCE
     10.5 OTHER END-USE INDUSTRIES 
 
11 UNIT DOSE PACKAGING MARKET, BY REGION (Page No. - 98)
     11.1 INTRODUCTION 
     11.2 ASIA PACIFIC 
             11.2.1 CHINA
                        11.2.1.1 Rising investments in biologics and biosimilar drug research to drive market
             11.2.2 INDIA
                        11.2.2.1 Large domestic consumption and export of generic drugs to drive market
             11.2.3 JAPAN
                        11.2.3.1 Surge in aging population to drive demand for medications
             11.2.4 SOUTH KOREA
                        11.2.4.1 Growth of cosmetic & personal care industries to drive market
             11.2.5 REST OF ASIA PACIFIC
     11.3 EUROPE 
             11.3.1 GERMANY
                        11.3.1.1 Advanced healthcare infrastructure and emphasis on patient-centric care to drive market
             11.3.2 FRANCE
                        11.3.2.1 Surge in demand for generic drugs to drive market
             11.3.3 ITALY
                        11.3.3.1 Growing exports of pharmaceutical products to boost market
             11.3.4 UK
                        11.3.4.1 Innovations in drug manufacturing to drive market
             11.3.5 SPAIN
                        11.3.5.1 Growth of cosmetic & personal care industry to drive market
             11.3.6 REST OF EUROPE
     11.4 NORTH AMERICA 
             11.4.1 US
                        11.4.1.1 Increasing demand for RFID integration and smart packaging to drive market
             11.4.2 CANADA
                        11.4.2.1 Rising demand for precise packaging to drive market
             11.4.3 MEXICO
                        11.4.3.1 Technological advancements and packaging innovations to boost market
     11.5 SOUTH AMERICA 
             11.5.1 BRAZIL
                        11.5.1.1 Increased healthcare awareness and substantial investment to drive market
             11.5.2 ARGENTINA
                        11.5.2.1 Innovations in packaging to drive market
             11.5.3 REST OF SOUTH AMERICA
     11.6 MIDDLE EAST & AFRICA 
             11.6.1 GCC COUNTRIES
                        11.6.1.1 Saudi Arabia
                                     11.6.1.1.1 Saudi Vision 2030 to boost demand for advanced medical packaging solutions
                        11.6.1.2 UAE
                                     11.6.1.2.1 Increasing demand for dietary supplements and functional foods to drive market
                        11.6.1.3 Rest of GCC countries
             11.6.2 SOUTH AFRICA
                        11.6.2.1 Government initiatives upholding safety and efficacy standards to boost market
             11.6.3 REST OF MIDDLE EAST & AFRICA
 
12 COMPETITIVE LANDSCAPE (Page No. - 136)
     12.1 OVERVIEW 
     12.2 KEY PLAYER STRATEGIES/RIGHT TO WIN 
     12.3 REVENUE ANALYSIS 
     12.4 MARKET SHARE ANALYSIS 
     12.5 COMPANY VALUATION AND FINANCIAL METRICS 
     12.6 PRODUCT/BRAND COMPARISON ANALYSIS 
     12.7 COMPANY EVALUATION MATRIX: KEY PLAYERS, 2023 
             12.7.1 STARS
             12.7.2 EMERGING LEADERS
             12.7.3 PERVASIVE PLAYERS
             12.7.4 PARTICIPANTS
             12.7.5 COMPANY FOOTPRINT: KEY PLAYERS, 2023
                        12.7.5.1 Company footprint
                        12.7.5.2 Form footprint
                        12.7.5.3 Material type footprint
                        12.7.5.4 Product type footprint
                        12.7.5.5 End-use industry footprint
                        12.7.5.6 Region footprint
     12.8 COMPANY EVALUATION MATRIX: STARTUPS/SMES, 2023 
             12.8.1 PROGRESSIVE COMPANIES
             12.8.2 RESPONSIVE COMPANIES
             12.8.3 DYNAMIC COMPANIES
             12.8.4 STARTING BLOCKS
             12.8.5 COMPETITIVE BENCHMARKING: STARTUPS/SMES, 2023
     12.9 COMPETITIVE SCENARIO AND TRENDS 
             12.9.1 PRODUCT LAUNCHES
             12.9.2 DEALS
             12.9.3 EXPANSIONS
 
13 COMPANY PROFILES (Page No. - 158)
     13.1 KEY PLAYERS 
             13.1.1 PFIZER INC.
                        13.1.1.1 Business overview
                        13.1.1.2 Products/Solutions/Services offered
                        13.1.1.3 Recent developments
                                     13.1.1.3.1 Product launches
                                     13.1.1.3.2 Deals
                        13.1.1.4 MnM view
                                     13.1.1.4.1 Right to win
                                     13.1.1.4.2 Strategic choices
                                     13.1.1.4.3 Weaknesses & competitive threats
             13.1.2 AMCOR PLC
                        13.1.2.1 Business overview
                        13.1.2.2 Products/Solutions/Services offered
                        13.1.2.3 Recent developments
                                     13.1.2.3.1 Product launches
                                     13.1.2.3.2 Expansion
                        13.1.2.4 MnM view
                                     13.1.2.4.1 Right to win
                                     13.1.2.4.2 Strategic choices
                                     13.1.2.4.3 Weaknesses & competitive threats
             13.1.3 CORNING INCORPORATED
                        13.1.3.1 Business overview
                        13.1.3.2 Products/Solutions/Services offered
                        13.1.3.3 Recent developments
                                     13.1.3.3.1 Product launches
                                     13.1.3.3.2 Deals
                        13.1.3.4 MnM view
                                     13.1.3.4.1 Right to win
                                     13.1.3.4.2 Strategic choices
                                     13.1.3.4.3 Weaknesses & competitive threats
             13.1.4 WEST PHARMACEUTICAL SERVICES
                        13.1.4.1 Business overview
                        13.1.4.2 Products/Solutions/Services offered
                        13.1.4.3 Recent developments
                                     13.1.4.3.1 Product launches
                                     13.1.4.3.2 Deals
                                     13.1.4.3.3 Expansion
                        13.1.4.4 MnM view
                                     13.1.4.4.1 Right to win
                                     13.1.4.4.2 Strategic choices
                                     13.1.4.4.3 Weaknesses & competitive threats
             13.1.5 STEVANATO GROUP
                        13.1.5.1 Business overview
                        13.1.5.2 Products/Solutions/Services offered
                        13.1.5.3 Recent developments
                                     13.1.5.3.1 Product launches
                                     13.1.5.3.2 Deals
                                     13.1.5.3.3 Expansion
                        13.1.5.4 MnM view
                                     13.1.5.4.1 Right to win
                                     13.1.5.4.2 Strategic choices
                                     13.1.5.4.3 Weaknesses & competitive threats
             13.1.6 GERRESHEIMER AG
                        13.1.6.1 Business overview
                        13.1.6.2 Products/Solutions/Services offered
                        13.1.6.3 Recent developments
                                     13.1.6.3.1 Product launches
                                     13.1.6.3.2 Deals
                                     13.1.6.3.3 Expansion
                        13.1.6.4 MnM view
             13.1.7 SCHOTT
                        13.1.7.1 Business overview
                        13.1.7.2 Products/Solutions/Services offered
                        13.1.7.3 Recent developments
                                     13.1.7.3.1 Product launches
                                     13.1.7.3.2 Deals
                                     13.1.7.3.3 Expansion
                        13.1.7.4 MnM view
             13.1.8 NIPRO
                        13.1.8.1 Business overview
                        13.1.8.2 Products/Solutions/Services offered
                        13.1.8.3 Recent developments
                                     13.1.8.3.1 Product launches
                        13.1.8.4 MnM view
             13.1.9 CONSTANTIA FLEXIBLES
                        13.1.9.1 Business overview
                        13.1.9.2 Products/Solutions/Services offered
                        13.1.9.3 Recent developments
                                     13.1.9.3.1 Deals
                                     13.1.9.3.2 Expansion
                        13.1.9.4 MnM view
             13.1.10 KLOCKNER PENTAPLAST
                        13.1.10.1 Business overview
                        13.1.10.2 Products/Solutions/Services offered
                        13.1.10.3 Recent developments
                                     13.1.10.3.1 Expansion
                        13.1.10.4 MnM view
     13.2 OTHER PLAYERS 
             13.2.1 SONIC PACKAGING INDUSTRIES INC.
             13.2.2 SHARP SERVICES, LLC
             13.2.3 TEKNI-PLEX, INC.
             13.2.4 THERMO-PAK CO. INC.
             13.2.5 APHENA PHARMA SOLUTIONS
             13.2.6 PACIFIC VIAL MANUFACTURING INC.
             13.2.7 HEALTH CARE LOGISTICS, INC.
             13.2.8 ULTRA SEAL CORPORATION
             13.2.9 SAFECORE HEALTH
             13.2.10 UNIT PACK
             13.2.11 JONES HEALTHCARE GROUP
             13.2.12 ROPACK INC.
             13.2.13 RX SYSTEMS, INC.
             13.2.14 JAMES ALEXANDER CORPORATION
             13.2.15 PHARMACY AUTOMATION SUPPLIES
 
14 ADJACENT & RELATED MARKETS (Page No. - 210)
     14.1 INTRODUCTION 
     14.2 LIMITATIONS 
             14.2.1 PHARMACEUTICAL PACKAGING MARKET
                        14.2.1.1 Market definition
                        14.2.1.2 Pharmaceutical packaging market, by packaging type
                        14.2.1.3 Pharmaceutical packaging market, by raw material
                        14.2.1.4 Pharmaceutical packaging market, by drug delivery
                        14.2.1.5 Pharmaceutical packaging market, by type
                        14.2.1.6 Pharmaceutical packaging market, by region
             14.2.2 NUTRACEUTICAL PACKAGING MARKET
                        14.2.2.1 Market definition
                        14.2.2.2 Nutraceutical packaging market, by product form
                        14.2.2.3 Nutraceutical packaging market, by product type
                        14.2.2.4 Nutraceutical packaging market, by packaging type
                        14.2.2.5 Nutraceutical packaging market, by material
                        14.2.2.6 Nutraceutical packaging market, by ingredient
                        14.2.2.7 Nutraceutical packaging market, by region
 
15 APPENDIX (Page No. - 225)
     15.1 DISCUSSION GUIDE 
     15.2 CUSTOMIZATION OPTIONS 
     15.3 RELATED REPORTS 
     15.4 AUTHOR DETAILS 
 
 
LIST OF TABLES (165 TABLES)
 
TABLE 1 UNIT DOSE PACKAGING MARKET: PORTER’S FIVE FORCES ANALYSIS
TABLE 2 WORLD GDP GROWTH PROJECTION, 2019–2026 (USD BILLION)
TABLE 3 AVERAGE TARIFF BY COUNTRY
TABLE 4 NORTH AMERICA: REGULATORY BODIES, GOVERNMENT AGENCIES, AND OTHER ORGANIZATIONS
TABLE 5 EUROPE: REGULATORY BODIES, GOVERNMENT AGENCIES, AND OTHER ORGANIZATIONS
TABLE 6 ASIA PACIFIC: REGULATORY BODIES, GOVERNMENT AGENCIES, AND OTHER ORGANIZATIONS
TABLE 7 MIDDLE EAST & AFRICA: REGULATORY BODIES, GOVERNMENT AGENCIES, AND OTHER ORGANIZATIONS
TABLE 8 SOUTH AMERICA: REGULATORY BODIES, GOVERNMENT AGENCIES, AND OTHER ORGANIZATIONS
TABLE 9 PFIZER—ENHANCING MEDICATION COMPLIANCE IN ELDERLY PATIENTS
TABLE 10 WESTROCK COMPANY—IMPROVING OPERATIONAL EFFICIENCY IN UNIT DOSE PACKAGING PRODUCTION
TABLE 11 SHARP PACKAGING SOLUTIONS—INTEGRATING SMART TECHNOLOGY TO IMPROVE PATIENT ADHERENCE
TABLE 12 UNIT DOSE PACKAGING MARKET: KEY CONFERENCES & EVENTS, 2024–2025
TABLE 13 INFLUENCE OF STAKEHOLDERS ON BUYING PROCESS FOR UNIT DOSE PACKAGING MARKET
TABLE 14 KEY BUYING CRITERIA FOR TOP 3 END-USE INDUSTRIES
TABLE 15 UNIT DOSE PACKAGING MARKET: ROLE OF PLAYERS IN ECOSYSTEM
TABLE 16 PATENTS IN UNIT DOSE PACKAGING MARKET, 2022–2023
TABLE 17 AVERAGE SELLING PRICE OF MATERIAL TYPE, BY KEY PLAYER, 2023 (USD/TON)
TABLE 18 UNIT DOSE PACKAGING MARKET, BY FORM, 2022–2029 (USD BILLION)
TABLE 19 UNIT DOSE PACKAGING MARKET, BY MATERIAL TYPE, 2022–2029 (USD BILLION)
TABLE 20 UNIT DOSE PACKAGING MARKET, BY PRODUCT TYPE, 2022–2029 (USD BILLION)
TABLE 21 UNIT DOSE PACKAGING MARKET, BY END-USE INDUSTRY, 2022–2029 (USD BILLION)
TABLE 22 UNIT DOSE PACKAGING MARKET, BY REGION, 2022–2029 (USD BILLION)
TABLE 23 ASIA PACIFIC: UNIT DOSE PACKAGING MARKET, BY COUNTRY, 2022–2029 (USD BILLION)
TABLE 24 ASIA PACIFIC: UNIT DOSE PACKAGING MARKET, BY PRODUCT TYPE, 2022–2029 (USD BILLION)
TABLE 25 ASIA PACIFIC: UNIT DOSE PACKAGING MARKET, BY END-USE INDUSTRY, 2022–2029 (USD BILLION)
TABLE 26 CHINA: UNIT DOSE PACKAGING MARKET, BY PRODUCT TYPE, 2022–2029 (USD BILLION)
TABLE 27 CHINA: UNIT DOSE PACKAGING MARKET, BY END-USE INDUSTRY, 2022–2029 (USD BILLION)
TABLE 28 INDIA: UNIT DOSE PACKAGING MARKET, BY PRODUCT TYPE, 2022–2029 (USD BILLION)
TABLE 29 INDIA: UNIT DOSE PACKAGING MARKET, BY END-USE INDUSTRY, 2022–2029 (USD BILLION)
TABLE 30 JAPAN: UNIT DOSE PACKAGING MARKET, BY PRODUCT TYPE, 2022–2029 (USD BILLION)
TABLE 31 JAPAN: UNIT DOSE PACKAGING MARKET, BY END-USE INDUSTRY, 2022–2029 (USD BILLION)
TABLE 32 SOUTH KOREA: UNIT DOSE PACKAGING MARKET, BY PRODUCT TYPE, 2022–2029 (USD BILLION)
TABLE 33 SOUTH KOREA: UNIT DOSE PACKAGING MARKET, BY END-USE INDUSTRY, 2022–2029 (USD BILLION)
TABLE 34 REST OF ASIA PACIFIC: UNIT DOSE PACKAGING MARKET, BY PRODUCT TYPE, 2022–2029 (USD BILLION)
TABLE 35 REST OF ASIA PACIFIC: UNIT DOSE PACKAGING MARKET, BY END-USE INDUSTRY, 2022–2029 (USD BILLION)
TABLE 36 EUROPE: UNIT DOSE PACKAGING MARKET, BY COUNTRY, 2022–2029 (USD BILLION)
TABLE 37 EUROPE: UNIT DOSE PACKAGING MARKET, BY PRODUCT TYPE, 2022–2029 (USD BILLION)
TABLE 38 EUROPE: UNIT DOSE PACKAGING MARKET, BY END-USE INDUSTRY, 2022–2029 (USD BILLION)
TABLE 39 GERMANY: UNIT DOSE PACKAGING MARKET, BY PRODUCT TYPE, 2022–2029 (USD BILLION)
TABLE 40 GERMANY: UNIT DOSE PACKAGING MARKET, BY END-USE INDUSTRY, 2022–2029 (USD BILLION)
TABLE 41 FRANCE: UNIT DOSE PACKAGING MARKET, BY PRODUCT TYPE, 2022–2029 (USD BILLION)
TABLE 42 FRANCE: UNIT DOSE PACKAGING MARKET, BY END-USE INDUSTRY, 2022–2029 (USD BILLION)
TABLE 43 ITALY: UNIT DOSE PACKAGING MARKET, BY PRODUCT TYPE, 2022–2029 (USD BILLION)
TABLE 44 ITALY: UNIT DOSE PACKAGING MARKET, BY END-USE INDUSTRY, 2022–2029 (USD BILLION)
TABLE 45 UK: UNIT DOSE PACKAGING MARKET, BY PRODUCT TYPE, 2022–2029 (USD BILLION)
TABLE 46 UK: UNIT DOSE PACKAGING MARKET, BY END-USE INDUSTRY, 2022–2029 (USD BILLION)
TABLE 47 SPAIN: UNIT DOSE PACKAGING MARKET, BY PRODUCT TYPE, 2022–2029 (USD BILLION)
TABLE 48 SPAIN: UNIT DOSE PACKAGING MARKET, BY END-USE INDUSTRY, 2022–2029 (USD BILLION)
TABLE 49 REST OF EUROPE: UNIT DOSE PACKAGING MARKET, BY PRODUCT TYPE, 2022–2029 (USD BILLION)
TABLE 50 REST OF EUROPE: UNIT DOSE PACKAGING MARKET, BY END-USE INDUSTRY, 2022–2029 (USD BILLION)
TABLE 51 NORTH AMERICA: UNIT DOSE PACKAGING MARKET, BY COUNTRY, 2022–2029 (USD BILLION)
TABLE 52 NORTH AMERICA: UNIT DOSE PACKAGING MARKET, BY PRODUCT TYPE, 2022–2029 (USD BILLION)
TABLE 53 NORTH AMERICA: UNIT DOSE PACKAGING MARKET, BY END-USE INDUSTRY, 2022–2029 (USD BILLION)
TABLE 54 US: UNIT DOSE PACKAGING MARKET, BY PRODUCT TYPE, 2022–2029 (USD BILLION)
TABLE 55 US: UNIT DOSE PACKAGING MARKET, BY END-USE INDUSTRY, 2022–2029 (USD BILLION)
TABLE 56 CANADA: UNIT DOSE PACKAGING MARKET, BY PRODUCT TYPE, 2022–2029 (USD BILLION)
TABLE 57 CANADA: UNIT DOSE PACKAGING MARKET, BY END-USE INDUSTRY, 2022–2029 (USD BILLION)
TABLE 58 MEXICO: UNIT DOSE PACKAGING MARKET, BY PRODUCT TYPE, 2022–2029 (USD BILLION)
TABLE 59 MEXICO: UNIT DOSE PACKAGING MARKET, BY END-USE INDUSTRY, 2022–2029 (USD BILLION)
TABLE 60 SOUTH AMERICA: UNIT DOSE PACKAGING MARKET, BY COUNTRY, 2022–2029 (USD BILLION)
TABLE 61 SOUTH AMERICA: UNIT DOSE PACKAGING MARKET, BY PRODUCT TYPE, 2022–2029 (USD BILLION)
TABLE 62 SOUTH AMERICA: UNIT DOSE PACKAGING MARKET, BY END-USE INDUSTRY, 2022–2029 (USD BILLION)
TABLE 63 BRAZIL: UNIT DOSE PACKAGING MARKET, BY PRODUCT TYPE,  2022–2029 (USD BILLION)
TABLE 64 BRAZIL: UNIT DOSE PACKAGING MARKET, BY END-USE INDUSTRY, 2022–2029 (USD BILLION)
TABLE 65 ARGENTINA: UNIT DOSE PACKAGING MARKET, BY PRODUCT TYPE, 2022–2029 (USD BILLION)
TABLE 66 ARGENTINA: UNIT DOSE PACKAGING MARKET, BY END-USE INDUSTRY, 2022–2029 (USD BILLION)
TABLE 67 REST OF SOUTH AMERICA: UNIT DOSE PACKAGING MARKET, BY PRODUCT TYPE, 2022–2029 (USD BILLION)
TABLE 68 REST OF SOUTH AMERICA: UNIT DOSE PACKAGING MARKET, BY END-USE INDUSTRY, 2022–2029 (USD BILLION)
TABLE 69 MIDDLE EAST & AFRICA: UNIT DOSE PACKAGING MARKET, BY COUNTRY, 2022–2029 (USD BILLION)
TABLE 70 MIDDLE EAST & AFRICA: UNIT DOSE PACKAGING MARKET, BY PRODUCT TYPE, 2022–2029 (USD BILLION)
TABLE 71 MIDDLE EAST & AFRICA: UNIT DOSE PACKAGING MARKET, BY END-USE INDUSTRY, 2022–2029 (USD BILLION)
TABLE 72 GCC COUNTRIES: UNIT DOSE PACKAGING MARKET, BY PRODUCT TYPE, 2022–2029 (USD BILLION)
TABLE 73 GCC COUNTRIES: UNIT DOSE PACKAGING MARKET, BY END-USE INDUSTRY, 2022–2029 (USD BILLION)
TABLE 74 SAUDI ARABIA: UNIT DOSE PACKAGING MARKET, BY PRODUCT TYPE, 2022–2029 (USD BILLION)
TABLE 75 SAUDI ARABIA: UNIT DOSE PACKAGING MARKET, BY END-USE INDUSTRY, 2022–2029 (USD BILLION)
TABLE 76 UAE: UNIT DOSE PACKAGING MARKET, BY PRODUCT TYPE, 2022–2029 (USD BILLION)
TABLE 77 UAE: UNIT DOSE PACKAGING MARKET, BY END-USE INDUSTRY, 2022–2029 (USD BILLION)
TABLE 78 REST OF GCC COUNTRIES: UNIT DOSE PACKAGING MARKET, BY PRODUCT TYPE, 2022–2029 (USD BILLION)
TABLE 79 REST OF GCC COUNTRIES: UNIT DOSE PACKAGING MARKET, BY END-USE INDUSTRY, 2022–2029 (USD BILLION)
TABLE 80 SOUTH AFRICA: UNIT DOSE PACKAGING MARKET, BY PRODUCT TYPE, 2022–2029 (USD BILLION)
TABLE 81 SOUTH AFRICA: UNIT DOSE PACKAGING MARKET, BY END-USE INDUSTRY, 2022–2029 (USD BILLION)
TABLE 82 REST OF MIDDLE EAST & AFRICA: UNIT DOSE PACKAGING MARKET, BY PRODUCT TYPE, 2022–2029 (USD BILLION)
TABLE 83 REST OF MIDDLE EAST & AFRICA: UNIT DOSE PACKAGING MARKET, BY END-USE INDUSTRY, 2022–2029 (USD BILLION)
TABLE 84 OVERVIEW OF STRATEGIES DEPLOYED BY KEY PLAYERS IN UNIT DOSAGE PACKAGING MARKET
TABLE 85 UNIT DOSE PACKAGING MARKET: DEGREE OF COMPETITION
TABLE 86 UNIT DOSE PACKAGING MARKET: FORM FOOTPRINT
TABLE 87 UNIT DOSE PACKAGING MARKET: MATERIAL TYPE FOOTPRINT
TABLE 88 UNIT DOSE PACKAGING MARKET: PRODUCT TYPE FOOTPRINT
TABLE 89 UNIT DOSE PACKAGING MARKET: END-USE INDUSTRY FOOTPRINT
TABLE 90 UNIT DOSE PACKAGING MARKET: REGION FOOTPRINT
TABLE 91 UNIT DOSE PACKAGING MARKET: KEY STARTUPS/SMES
TABLE 92 UNIT DOSE PACKAGING MARKET: COMPETITIVE BENCHMARKING OF KEY STARTUPS/SMES
TABLE 93 UNIT DOSE PACKAGING MARKET: PRODUCT LAUNCHES, JANUARY 2018–MAY 2024
TABLE 94 UNIT DOSE PACKAGING MARKET: DEALS, JANUARY 2018–MAY 2024
TABLE 95 UNIT DOSE PACKAGING MARKET: EXPANSIONS, JANUARY 2018–MAY 2024
TABLE 96 PFIZER INC.: COMPANY OVERVIEW
TABLE 97 PFIZER INC.: PRODUCTS/SOLUTIONS/SERVICES OFFERED
TABLE 98 PFIZER INC.: PRODUCT LAUNCHES, JANUARY 2018−MAY 2024
TABLE 99 PFIZER INC.: DEALS, JANUARY 2018−MAY 2024
TABLE 100 AMCOR PLC: COMPANY OVERVIEW
TABLE 101 AMCOR PLC: PRODUCTS/SOLUTIONS/SERVICES OFFERED
TABLE 102 AMCOR PLC: PRODUCT LAUNCHES, JANUARY 2018−MAY 2024
TABLE 103 AMCOR PLC: EXPANSION, JANUARY 2018−MAY 2024
TABLE 104 CORNING INCORPORATED: COMPANY OVERVIEW
TABLE 105 CORNING INCORPORATED: PRODUCTS/SOLUTIONS/SERVICES OFFERED
TABLE 106 CORNING INCORPORATED: PRODUCT LAUNCHES, JANUARY 2018−MAY 2024
TABLE 107 CORNING INCORPORATED: DEALS, JANUARY 2018−MAY 2024
TABLE 108 WEST PHARMACEUTICAL SERVICES: COMPANY OVERVIEW
TABLE 109 WEST PHARMACEUTICAL SERVICES: PRODUCTS/SOLUTIONS/SERVICES OFFERED
TABLE 110 WEST PHARMACEUTICAL SERVICES: PRODUCT LAUNCHES, JANUARY 2018−MAY 2024
TABLE 111 WEST PHARMACEUTICAL SERVICES: DEALS, JANUARY 2018−MAY 2024
TABLE 112 WEST PHARMACEUTICAL SERVICES: EXPANSION, JANUARY 2018−MAY 2024
TABLE 113 STEVANATO GROUP: COMPANY OVERVIEW
TABLE 114 STEVANATO GROUP: PRODUCTS/SOLUTIONS/SERVICES OFFERED
TABLE 115 STEVANATO GROUP: PRODUCT LAUNCHES, JANUARY 2018−MAY 2024
TABLE 116 STEVANATO GROUP: DEALS, JANUARY 2018−MAY 2024
TABLE 117 STEVANATO GROUP: EXPANSION, JANUARY 2018−MAY 2024
TABLE 118 GERRESHEIMER AG: COMPANY OVERVIEW
TABLE 119 GERRESHEIMER AG: PRODUCTS/SOLUTIONS/SERVICES OFFERED
TABLE 120 GERRESHEIMER AG: PRODUCT LAUNCHES, JANUARY 2018−MAY 2024
TABLE 121 GERRESHEIMER AG: DEALS, JANUARY 2018−MAY 2024
TABLE 122 GERRESHEIMER AG: EXPANSION, JANUARY 2018−MAY 2024
TABLE 123 SCHOTT: COMPANY OVERVIEW
TABLE 124 SCHOTT: PRODUCTS/SOLUTIONS/SERVICES OFFERED
TABLE 125 SCHOTT: PRODUCT LAUNCHES, JANUARY 2018−MAY 2024
TABLE 126 SCHOTT: DEALS, JANUARY 2018−MAY 2024
TABLE 127 SCHOTT: EXPANSION, JANUARY 2018−MAY 2024
TABLE 128 NIPRO: COMPANY OVERVIEW
TABLE 129 NIPRO: PRODUCTS/SOLUTIONS/SERVICES OFFERED
TABLE 130 NIPRO: PRODUCT LAUNCHES, JANUARY 2018−MAY 2024
TABLE 131 CONSTANTIA FLEXIBLES: COMPANY OVERVIEW
TABLE 132 CONSTANTIA FLEXIBLES: PRODUCTS/SOLUTIONS/SERVICES OFFERED
TABLE 133 CONSTANTIA FLEXIBLES: DEALS, JANUARY 2018−MAY 2024
TABLE 134 CONSTANTIA FLEXIBLES: EXPANSION, JANUARY 2018−MAY 2024
TABLE 135 KLOCKNER PENTAPLAST: COMPANY OVERVIEW
TABLE 136 KLOCKNER PENTAPLAST: PRODUCTS/SOLUTIONS/SERVICES OFFERED
TABLE 137 KLOCKNER PENTAPLAST: EXPANSION, JANUARY 2018−MAY 2024
TABLE 138 PHARMACEUTICAL PACKAGING MARKET, BY PACKAGING TYPE, 2020–2022 (USD MILLION)
TABLE 139 PHARMACEUTICAL PACKAGING MARKET, BY PACKAGING TYPE, 2023–2028 (USD MILLION)
TABLE 140 PHARMACEUTICAL PACKAGING MARKET, BY RAW MATERIAL, 2020–2022 (KILOTON)
TABLE 141 PHARMACEUTICAL PACKAGING MARKET, BY RAW MATERIAL, 2023–2028 (KILOTON)
TABLE 142 PHARMACEUTICAL PACKAGING MARKET, BY RAW MATERIAL, 2020–2022 (USD MILLION)
TABLE 143 PHARMACEUTICAL PACKAGING MARKET, BY RAW MATERIAL, 2023–2028 (USD MILLION)
TABLE 144 DRUG DELIVERY: PHARMACEUTICAL PACKAGING MARKET, BY REGION, 2020–2022 (USD MILLION)
TABLE 145 DRUG DELIVERY: PHARMACEUTICAL PACKAGING MARKET, BY REGION, 2023–2028 (USD MILLION)
TABLE 146 PHARMACEUTICAL PACKAGING MARKET, BY DRUG DELIVERY, 2020–2022 (USD MILLION)
TABLE 147 PHARMACEUTICAL PACKAGING MARKET, BY DRUG DELIVERY, 2023–2028 (USD MILLION)
TABLE 148 PHARMACEUTICAL PACKAGING MARKET, BY TYPE, 2020–2022 (USD MILLION)
TABLE 149 PHARMACEUTICAL PACKAGING MARKET, BY TYPE, 2023–2028 (USD MILLION)
TABLE 150 PHARMACEUTICAL PACKAGING MARKET, BY REGION, 2020–2022 (USD MILLION)
TABLE 151 PHARMACEUTICAL PACKAGING MARKET, BY REGION, 2023–2028 (USD MILLION)
TABLE 152 NUTRACEUTICAL PACKAGING MARKET, BY PRODUCT FORM, 2019–2022 (USD MILLION)
TABLE 153 NUTRACEUTICAL PACKAGING MARKET, BY PRODUCT FORM, 2023–2028 (USD MILLION)
TABLE 154 NUTRACEUTICAL PACKAGING MARKET, BY PRODUCT TYPE, 2019–2022 (USD MILLION)
TABLE 155 NUTRACEUTICAL PACKAGING MARKET, BY PRODUCT TYPE, 2023–2028 (USD MILLION)
TABLE 156 NUTRACEUTICAL PACKAGING MARKET, BY PACKAGING TYPE, 2019–2022 (USD MILLION)
TABLE 157 NUTRACEUTICAL PACKAGING MARKET, BY PACKAGING TYPE, 2023–2028 (USD MILLION)
TABLE 158 NUTRACEUTICAL PACKAGING MARKET, BY MATERIAL, 2019–2022 (USD MILLION)
TABLE 159 NUTRACEUTICAL PACKAGING MARKET, BY MATERIAL, 2023–2028 (USD MILLION)
TABLE 160 NUTRACEUTICAL PACKAGING MARKET, BY MATERIAL, 2019–2022 (KILOTON)
TABLE 161 NUTRACEUTICAL PACKAGING MARKET, BY MATERIAL, 2023–2028 (KILOTON)
TABLE 162 NUTRACEUTICAL PACKAGING MARKET, BY INGREDIENT, 2019–2022 (USD MILLION)
TABLE 163 NUTRACEUTICAL PACKAGING MARKET, BY INGREDIENT, 2023–2028 (USD MILLION)
TABLE 164 NUTRACEUTICAL PACKAGING MARKET, BY REGION, 2019–2022 (USD MILLION)
TABLE 165 NUTRACEUTICAL PACKAGING MARKET, BY REGION, 2023–2028 (USD MILLION)
 
 
LIST OF FIGURES (53 FIGURES)
 
FIGURE 1 UNIT DOSE PACKAGING: RESEARCH DESIGN
FIGURE 2 UNIT DOSE PACKAGING MARKET: TOP-DOWN APPROACH
FIGURE 3 UNIT DOSE PACKAGING MARKET: APPROACH 1
FIGURE 4 UNIT DOSE PACKAGING MARKET: APPROACH 2
FIGURE 5 UNIT DOSE PACKAGING MARKET: DATA TRIANGULATION
FIGURE 6 LIQUID FORM SEGMENT TO REGISTER HIGHEST CAGR DURING FORECAST PERIOD
FIGURE 7 PLASTIC SEGMENT TO WITNESS HIGHEST GROWTH RATE DURING FORECAST PERIOD
FIGURE 8 BLISTER PACKS TO WITNESS HIGHEST CAGR DURING FORECAST PERIOD
FIGURE 9 PHARMACEUTICALS TO BE LARGEST END-USE INDUSTRY DURING FORECAST PERIOD
FIGURE 10 NORTH AMERICA TO LEAD MARKET DURING FORECAST PERIOD
FIGURE 11 EMERGING ECONOMIES OFFER ATTRACTIVE OPPORTUNITIES IN UNIT DOSE PACKAGING MARKET
FIGURE 12 US DOMINATED UNIT DOSE PACKAGING MARKET IN 2023
FIGURE 13 BLISTER PACKS TO REGISTER HIGHEST GROWTH RATE DURING FORECAST PERIOD
FIGURE 14 PHARMACEUTICALS TO LEAD UNIT DOSE PACKAGING MARKET DURING FORECAST PERIOD
FIGURE 15 CHINA PROJECTED TO GROW AT HIGHEST CAGR FROM 2024 TO 2029
FIGURE 16 UNIT DOSE PACKAGING MARKET: DRIVERS, RESTRAINTS, OPPORTUNITIES, AND CHALLENGES
FIGURE 17 VALUE FORECAST OF PHARMACEUTICAL EMPTY CAPSULES MARKET WORLDWIDE FROM 2021 TO 2032, BY RAW MATERIALS (USD MILLION)
FIGURE 18 UNIT DOSE PACKAGING MARKET: PORTER’S FIVE FORCES ANALYSIS
FIGURE 19 UNIT DOSE PACKAGING: VALUE CHAIN ANALYSIS
FIGURE 20 EXPORT OF “3923 ARTICLES FOR THE CONVEYANCE OR PACKAGING OF GOODS, OF PLASTICS; STOPPERS, LIDS, CAPS, AND OTHER CLOSURES, OF PLASTICS,” BY KEY COUNTRY, 2019–2023
FIGURE 21 IMPORT OF 280610 “3923 ARTICLES FOR THE CONVEYANCE OR PACKAGING OF GOODS, OF PLASTICS; STOPPERS, LIDS, CAPS, AND OTHER CLOSURES, OF PLASTICS,” BY KEY COUNTRY, 2019–2023
FIGURE 22 EMERGING TRENDS AND ADVANCEMENTS IN TECHNOLOGY TO CHANGE FUTURE REVENUE MIX OF SUPPLIERS
FIGURE 23 INFLUENCE OF STAKEHOLDERS ON BUYING PROCESS FOR TOP 3 END-USE INDUSTRIES
FIGURE 24 KEY BUYING CRITERIA FOR TOP 3 END-USE INDUSTRIES
FIGURE 25 UNIT DOSE PACKAGING MARKET: ECOSYSTEM
FIGURE 26 NUMBER OF PATENTS GRANTED FOR UNIT DOSE PACKAGING, 2013–2023
FIGURE 27 REGIONAL ANALYSIS OF PATENTS GRANTED FOR UNIT DOSE PACKAGING, 2013–2023
FIGURE 28 AVERAGE SELLING PRICE OF PHARMACEUTICAL PACKAGING, BY REGION (USD/KG)
FIGURE 29 AVERAGE SELLING PRICE TREND OF KEY PLAYERS, BY MATERIAL TYPE (USD/KG)
FIGURE 30 INVESTOR DEALS AND FUNDING IN UNIT DOSE PACKAGING SOARED IN 2023
FIGURE 31 LIQUID SEGMENT TO REGISTER HIGHEST GROWTH THROUGH 2029
FIGURE 32 PLASTICS SEGMENT TO REGISTER HIGHEST CAGR THROUGH 2029
FIGURE 33 BLISTER PACKS SEGMENT TO RECORD HIGHEST GROWTH THROUGH 2029
FIGURE 34 PHARMACEUTICALS INDUSTRY TO BE LARGEST CONSUMER OF UNIT DOSE PACKAGING
FIGURE 35 UNIT DOSE PACKAGING MARKET GROWTH RATE, BY COUNTRY, 2024–2029
FIGURE 36 ASIA PACIFIC: UNIT DOSE PACKAGING MARKET SNAPSHOT
FIGURE 37 EUROPE: UNIT DOSE PACKAGING MARKET SNAPSHOT
FIGURE 38 NORTH AMERICA: UNIT DOSE PACKAGING MARKET SNAPSHOT
FIGURE 39 REVENUE ANALYSIS OF KEY COMPANIES IN LAST FIVE YEARS
FIGURE 40 UNIT DOSE PACKAGING MARKET: MARKET SHARE ANALYSIS
FIGURE 41 COMPANY VALUATION (USD BILLION)
FIGURE 42 FINANCIAL MATRIX: EV/EBITDA RATIO
FIGURE 43 PRODUCT COMPARISON
FIGURE 44 UNIT DOSE PACKAGING MARKET: COMPANY EVALUATION MATRIX (KEY PLAYERS), 2023
FIGURE 45 UNIT DOSE PACKAGING MARKET: COMPANY FOOTPRINT
FIGURE 46 UNIT DOSE PACKAGING MARKET: COMPANY EVALUATION MATRIX (STARTUPS/SMES), 2023
FIGURE 47 PFIZER INC.: COMPANY SNAPSHOT
FIGURE 48 AMCOR PLC: COMPANY SNAPSHOT
FIGURE 49 CORNING INCORPORATED: COMPANY SNAPSHOT
FIGURE 50 WEST PHARMACEUTICAL SERVICES: COMPANY SNAPSHOT
FIGURE 51 STEVANATO GROUP: COMPANY SNAPSHOT
FIGURE 52 GERRESHEIMER AG: COMPANY SNAPSHOT
FIGURE 53 NIPRO: COMPANY SNAPSHOT

The study involved four major activities for estimating the current size of the global unit dose packaging market. Exhaustive secondary research was carried out to collect information on the market, the peer product market, and the parent product group market. The next step was to validate these findings, assumptions, and sizes with the industry experts across the value chain of unit dose packaging through primary research. Both the top-down and bottom-up approaches were employed to estimate the overall size of the unit dose packaging market. After that, market breakdown and data triangulation procedures were used to determine the size of different segments and sub-segments of the market.

Secondary Research

In the secondary research process, various secondary sources such as Hoovers, Factiva, Bloomberg BusinessWeek, and Dun & Bradstreet were referred to, to identify and collect information for this study on the unit dose packaging market. These secondary sources included annual reports, press releases & investor presentations of companies; white papers; certified publications; articles by recognized authors; regulatory bodies, trade directories, and databases.

Primary Research

The unit dose packaging market comprises several stakeholders in the supply chain, which include raw material suppliers, processors, end-product manufacturers, buyers, and regulatory organizations. Various primary sources from the supply and demand sides of the markets have been interviewed to obtain qualitative and quantitative information. The primary participants from the demand side include key opinion leaders, executives, vice presidents, and CEOs of companies in the Unit dose packaging market. Primary sources from the supply side include associations and institutions involved in the unit dose packaging industry, key opinion leaders, and processing players.

Following is the breakdown of primary respondents

Unit Dose Packaging Market Size, and Share

Notes: Other designations include product, sales, and marketing managers.

Tiers of the companies are classified based on their annual revenues as of 2022: Tier 1 = >USD 5 Billion, Tier 2 = USD 1 Billion to USD 5 Billion, and Tier 3= <USD 1 Billion.

To know about the assumptions considered for the study, download the pdf brochure

Market Size Estimation

Both the top-down and bottom-up approaches were used to estimate and validate the size of the global unit dose packaging market. These approaches were also used extensively to estimate the size of various segments of the market. The research methodology used to estimate the market size included the following details:

  • The key players in the industry were identified through extensive secondary research.
  • The supply chain of the industry and market size, in terms of value, were determined through primary and secondary research.
  • All percentage share splits and breakdowns were determined using secondary sources and verified through primary sources.
  • All possible parameters that affect the markets covered in this research study were accounted for, viewed in extensive detail, verified through primary research, and analyzed to obtain the final quantitative and qualitative data.
  • The research includes the study of reports, reviews, and newsletters of key industry players, along with extensive interviews with key officials, such as directors and marketing executives.

Unit Dose Packaging Market Size, and Share

To know about the assumptions considered for the study, Request for Free Sample Report

Unit Dose Packaging Market Size, and Share

Data Triangulation

After arriving at the overall market size from the estimation process explained above, the total market was split into several segments and sub-segments. The data triangulation and market breakdown procedures were employed, wherever applicable, to complete the overall market engineering process and arrive at the exact statistics for all the segments and sub-segments of the unit dose packaging market. The data was triangulated by studying various factors and trends from both the demand- and supply-side.

In addition, the market size was validated by using both the top-down and bottom-up approaches. Then, it was verified through primary interviews. Hence, for every data segment, there are three sources—top-down approach, bottom-up approach, and expert interviews. The data were assumed to be correct when the values arrived at from the three sources matched.

Market Definition

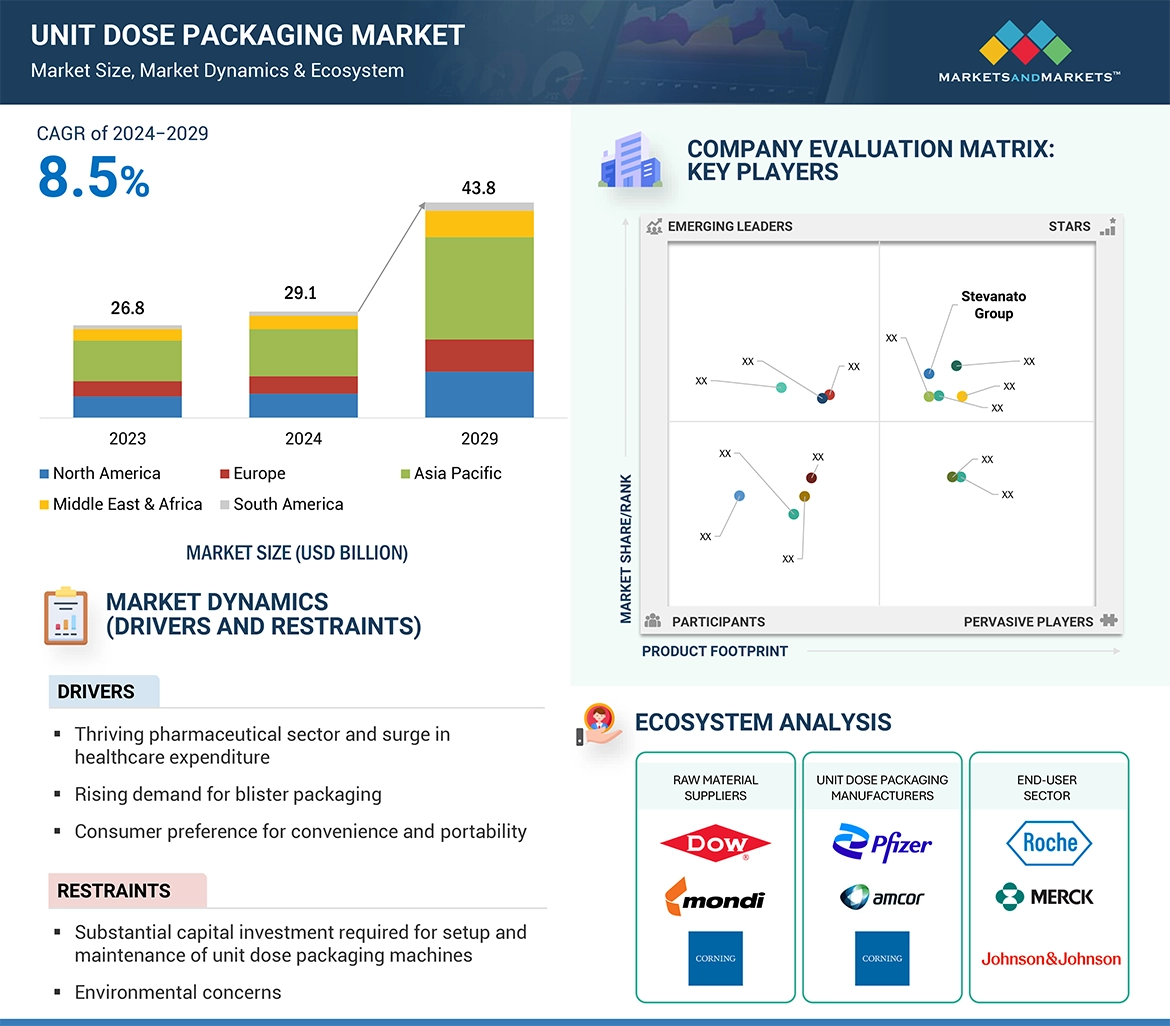
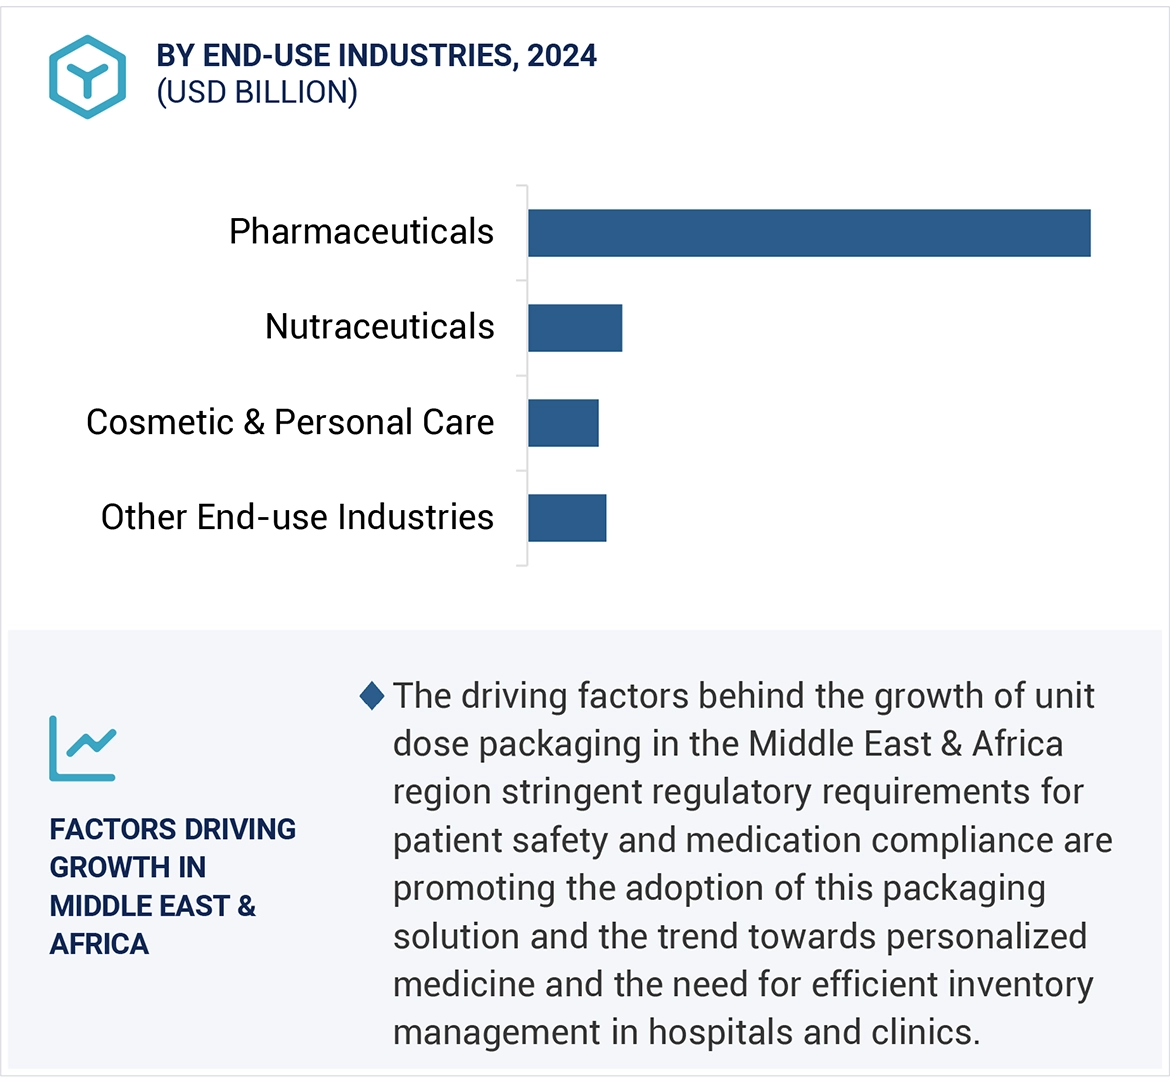
The unit dose packaging market focuses on providing single-serving or single-dose packaging solutions that ensure precise dosage, enhance convenience, improve hygiene, and protect product integrity. In the pharmaceutical industry, unit dose packaging ensures accurate dosing, reduces contamination risks, and boosts patient compliance, commonly used for syrups, oral suspensions, and injectables. In the cosmetics sector, it offers convenience and hygiene for serums, lotions, and treatments with easy-to-apply, portable single-use portions. The nutraceutical industry benefits from unit dose packaging by delivering precise, easily consumable doses of liquid supplements and vitamins, ensuring consistent intake and maintaining product integrity. This packaging method enhances accuracy, convenience, and safety, making it a valuable solution across these diverse applications.

Key Stakeholders

  • Unit dose packaging producing companies
  • Raw material suppliers and producers
  • Regulatory bodies
  • End-use industries of unit dose packaging
  • Associations and industrial bodies
  • Local governments
  • Market research and consulting firms

Report Objectives

  • To define, analyze, and project the size of the unit dose packaging market in terms of value based on form, material type, product type, end-use industry, and region.
  • To project the size of the market and its segments with respect to the five main regions, namely, North America, Europe, Asia Pacific, Middle East & Africa, and South America
  • To provide detailed information about the key factors, such as drivers, restraints, opportunities, and challenges, influencing the growth of the market
  • To analyze the opportunities in the market for stakeholders and provide a detailed competitive landscape of the market leaders.
  • To analyze the competitive developments, such as new product launches, expansions, and acquisitions, in the unit dose packaging market
  • To strategically profile the key players operating in the market and comprehensively analyze their market shares and core competencies.

Available Customizations

Along with the given market data, MarketsandMarkets offers customizations as per the specific needs of the companies. The following customization options are available for the report:

Product Analysis:

  • Product Matrix which gives a detailed comparison of the product portfolio of each company

Regional Analysis:

  • Further breakdown of the Rest of Asia Pacific market
  • Further breakdown of Rest of Europe market

Company Information:

  • Detailed analysis and profiling of additional market players (up to 5)
Custom Market Research Services

We will customize the research for you, in case the report listed above does not meet with your exact requirements. Our custom research will comprehensively cover the business information you require to help you arrive at strategic and profitable business decisions.

Request Customization
Report Code
PK 9105
Published ON
Aug, 2024
Choose License Type
BUY NOW
  • SHARE
X
Request Customization
Speak to Analyst
Speak to Analyst
OR FACE-TO-FACE MEETING
PERSONALIZE THIS RESEARCH
  • Triangulate with your Own Data
  • Get Data as per your Format and Definition
  • Gain a Deeper Dive on a Specific Application, Geography, Customer or Competitor
  • Any level of Personalization
REQUEST A FREE CUSTOMIZATION
LET US HELP YOU!
  • What are the Known and Unknown Adjacencies Impacting the Unit Dose Packaging Market
  • What will your New Revenue Sources be?
  • Who will be your Top Customer; what will make them switch?
  • Defend your Market Share or Win Competitors
  • Get a Scorecard for Target Partners
CUSTOMIZED WORKSHOP REQUEST
  • Call Us
  • +1-888-600-6441 (Corporate office hours)
  • +1-888-600-6441 (US/Can toll free)
  • +44-800-368-9399 (UK office hours)
CONNECT WITH US
ABOUT TRUST ONLINE
©2024 MarketsandMarkets Research Private Ltd. All rights reserved
DMCA.com Protection Status Website Feedback